
Crypto World
Bitcoin readies trendline showdown as weekly close sparks 60K target

Bitcoin (CRYPTO: BTC) navigated a technical crossroads as traders calibrated the outlook for the week ahead. After a weekend dip into the mid-$60k range, the price rebounded modestly, yet the real test lay with the long-standing 200-week exponential moving average, a line that has often defined the boundary between accumulation and a fresh leg higher. The EMA sits near $68,310, and the market watched whether BTC could reclaim this level on the weekly close or allow it to resume its role as a ceiling for momentum.
Key takeaways
- Bitcoin revisited the vicinity of the 200-week EMA near $68,310, with weekend lows near $66,569 marking a test of the long-term trend.
- The price has repeatedly tried to reclaim the EMA as support but has not successfully flipped it, keeping the line in focus as resistance on weekly closes.
- Oil and gold moves are the primary volatility catalysts, with WTI crude up almost 16% on Friday and gold faltering just under the $5,200 level.
- Analysts flag that a weekly candle close below the EMA would cement it as resistance, potentially prolonging a range-bound phase until a decisive breakout occurs.
- Some optimists point to 2023 patterns where reclaiming the 200-week EMA sparked a pronounced rally, suggesting a similar setup could unfold if BTC holds above critical levels.
Tickers mentioned: $BTC
Market context: The price action comes as liquidity and risk sentiment in crypto markets remain tethered to macro headlines. Oil and precious metals volatility, along with ongoing geopolitical tensions, continue to influence turnover and the pace of moves for Bitcoin and related assets.
Why it matters
The current technical setup matters because the 200-week EMA has historically acted as a major inflection point for Bitcoin, marking potential onset of a new trend or a renewed phase of consolidation. A break above the EMA, followed by a sustained weekly close, could open room for a run toward prior highs, while failure to hold could invite renewed tests of the lower bands as momentum cools.
For traders, the interaction between macro catalysts—like energy prices and safe-haven assets—and the crypto market is a reminder that Bitcoin remains sensitive to risk-on/off dynamics even as on-chain metrics show a mixed directional signal. The divergence between oil’s rally and gold’s resistance underscores a complex risk environment that can translate into crypto volatility when liquidity tightens or macro headlines shift sentiment.
Investor voices have offered mixed interpretations. If oil and gold tilt in Bitcoin’s favor, a retest of the highs could be on the table in the coming days; if the macro backdrop remains unfavorable, traders may pivot toward downside risk controls and liquidity preservation. In this setup, the EMA’s role as a guidepost remains central: it can either act as a springboard for momentum or as a stubborn ceiling that limits upside until a clearer directional cue emerges.
What to watch next
- Watch the weekly candle close around the EMA near $68,310; a close above that level could shift the short-term bias.
- Monitor oil and gold moves early in the week, as a renewed risk-on or risk-off signal could tip BTC’s direction.
- Look for price action near $65k and $60k as potential support zones if momentum falters.
- Track commentary from notable traders for signals on whether the market reclaims the EMA or tests lower levels.
Sources & verification
- TradingView BTCUSD price data showing weekend lows around $66,569 and the 200-week EMA near $68,310.
- Rekt Capital’s X posts discussing the significance of losing the 200-week EMA as resistance.
- Merlijn The Trader’s March 8, 2026 tweet reflecting the 2023 pattern of reclaiming the EMA and triggering a rally.
- Michaël van de Poppe’s X posts linking oil and gold movements to Bitcoin’s potential rebound, including remarks on RSI signals.
Market reaction and key details
Bitcoin (CRYPTO: BTC) navigated a technical crossroads as traders calibrated the outlook for the week ahead. After a weekend dip into the mid-$60k range, the price rebounded modestly, yet the real test lay with the long-standing 200-week exponential moving average, a line that has often defined the boundary between accumulation and a fresh leg higher. The EMA sits near $68,310, and the market watched whether BTC could reclaim this level on the weekly close or allow it to resume its role as a ceiling for momentum.
Over the weekend, price data from TradingView showed intraday lows around $66,569, a figure that exposed the vulnerability of the rebound to a deeper pullback if buyers failed to reassert control. The technical narrative centers on a familiar constraint: a weekly candle closing beneath the 200-week EMA would reinforce that line as resistance, not support, shaping the distribution of risk into the early days of trading.
Analysts highlighted the gravity of losing the EMA as a defined resistance zone. Rekt Capital emphasized that a break below the EMA on a weekly basis would impair the perception of an imminent breakout, arguably making the threshold more formidable to surpass in the near term. The assessment echoes a longer memory in BTC’s price action, where the 200-week EMA has marked pivotal junctures in prior cycles. “Indeed Bitcoin has once again upside wicked beyond the 200 EMA, with price cancelling out the vast amount of the recent rebound,” the trader wrote in a post, noting that a weekly close below the EMA could cement it as a persistent hurdle.
BITCOIN IS TESTING THE LEVEL THAT STARTED THE LAST RALLY.
While the primary focus remains on the chart, a parallel narrative has formed around macro drivers. The Middle East tension backdrop and broader geopolitical risk have kept traders attuned to how commodities move. Oil, in particular, has been a notable catalyst; Friday’s session saw WTI crude rally by almost 16%, underscoring a broader risk-off tilt that can spill into digital asset markets when liquidity tightens or macro uncertainty rises. In the same breath, gold has retreated from earlier peaks and hovered just under the $5,200 threshold, illustrating a tug-of-war between risk-on and risk-off assets that often translates into crypto volatility.
Notably, Michaël van de Poppe framed the oil-gold dynamic as a potential predictor for Bitcoin’s next move. “All eyes on Oil tomorrow, and Gold & Silver. If those are moving in favor of Bitcoin, we might see a return to the highs in the coming week and the worst is behind us,” he told followers on X. The analyst also warned of a different outcome, noting that a failure to see the macro moves align could push the price toward the lower end—“If that’s not the case, I’d be a big buyer in the $60K areas if we test the lows again.”
In practical terms, the market is watching not just the price action but the flow of liquidity that accompanies it. A related on-chain snapshot referenced in the coverage showed a notable outbound movement of Bitcoin from exchanges during a recent window, underscoring a willingness among holders to wait for clearer signals. The current setup remains fragile, contingent on whether buyers can sustain a move above the EMA or whether sellers reassert control in the absence of momentum catalysts.
As traders digest these signals, the general mood across the space is one of cautious anticipation. Some market participants see the current structure as an opportunity to re-engage, provided macro drivers tilt in Bitcoin’s favor. Others remain wary that any sustained break below major technical support could invite renewed tests of lower levels as risk sentiment ebbs and flows with energy prices and geopolitical headlines.
This tension is not unique to Bitcoin; it reflects a broader pattern in risk assets where crypto remains sensitive to external shocks and macro catalysts. The weekend price action, the proximity to a key long-term EMA, and the interaction with oil and gold movements collectively craft a narrative about the next phase of Bitcoin’s price discovery. For now, the market waits for a decisive signal—whether that comes through a strong weekly close above the EMA or a renewed test of the lows, the outcome will shape the short- to mid-term trajectory of BTC as markets circulate into the next trading week.

Michael Saylor, Executive Chairman of Strategy (MicroStrategy), hit back at Peter Schiff after the goldbug posted data suggesting Bitcoin (BTC) had lagged gold, silver, and equities over five years.
The exchange reignited a long-running public feud between two of the loudest voices on opposite sides of the Bitcoin-versus-gold divide.
Schiff’s Five-Year Window and Why It Matters
Schiff highlighted Bitcoin’s measly 12% gain over the past five years, comparing that figure to the NASDAQ’s 57.4% gain, the S&P 500’s 59.4% rise, gold’s 163% surge, and silver’s 181% rally.
“If the appeal of Bitcoin is its superior long-term performance, why should anyone keep HODLing it?” posed Schiff.
The five-year window he cited begins near April 2021, when BTC traded close to its then all-time high of approximately $69,000.
That starting point captures both the 2022 crypto crash and the slower 2024-2026 recovery. As of this writing, BTC trades for $66,847.
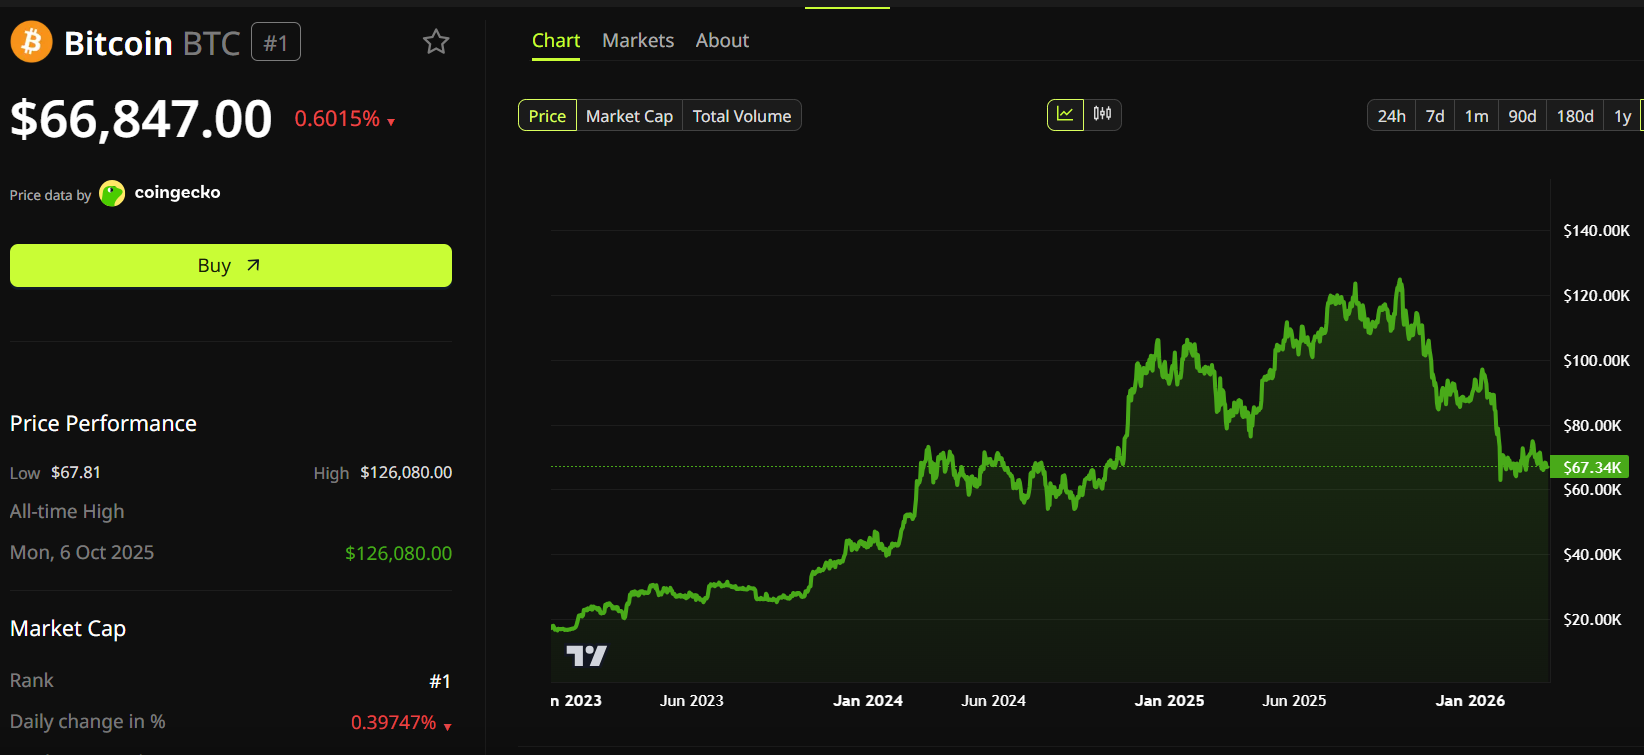
Gold, meanwhile, has surged above $4,700 per ounce. That represents a gain of over 160% from its April 2021 level near $1,780, confirming Schiff’s figures.
The precious metal hit an all-time high of $5,602 in late January 2026 before pulling back amid broader macro volatility tied to the Iran conflict and rising inflation expectations.
Schiff followed up with a separate post targeting Strategy directly. He noted that MSTR stock had outperformed the NASDAQ, gaining 68.5% over five years, but argued the rally had nothing to do with BTC’s performance.
“It’s due to investors’ willingness to overpay for MSTR so Saylor could keep overpaying for Bitcoin. Sell MSTR before it crashes,” warned Schiff
Saylor Responds With Annualized Returns
However, according to Michael Saylor, Schiff’s analogy is flawed. Saylor measured Bitcoin’s performance from August 2020, the month Strategy began its corporate BTC treasury strategy.
With this, the Bitcoin believer highlighted BTC annualizing at 36%, compared to 16% for gold (GLD), 15% for the Nasdaq-100 (QQQ), 14% for the S&P 500 (SPY), 5% for real estate (VNQ), and negative 1% for bonds (BND).
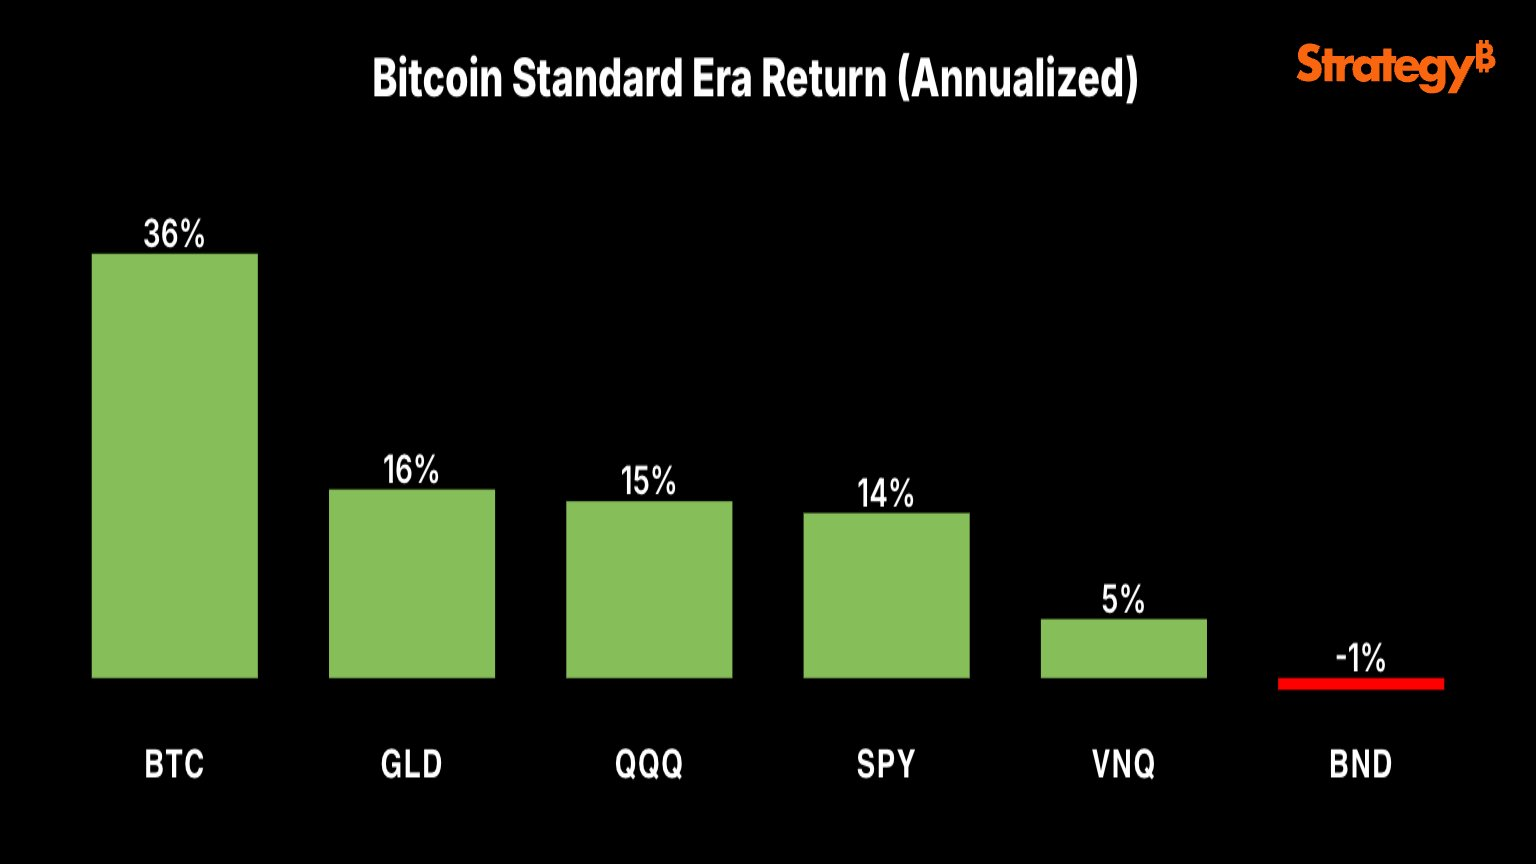
“Timeframes matter. Since Aug 2020, Bitcoin has been the top-performing major asset, and it’s not even close. Zoom out further, and the gap only widens,” Saylor challenged.
Strategy held 762,099 BTC as of this writing, making it the largest corporate holder of the cryptocurrency. The company acquired its holdings at an average price of roughly $75,699 per coin, putting its position below break-even at current spot prices.
A Familiar Feud With Higher Stakes
The Schiff-Saylor rivalry has become a recurring feature of crypto commentary. Schiff has called Strategy’s business model a “fraud” and predicted the company would eventually go bankrupt.
In December 2025, he challenged Saylor to a public debate at Binance Blockchain Week in Dubai. Saylor did not accept.
However, Schiff and CZ, the founder and former CEO of Binance, recently debated on the same topic, Bitcoin versus gold, with the outcome exposing a core divide between gold-backed stability and crypto innovation.
The post Michael Saylor Exposes the Fatal Flaw in Peter Schiff’s Anti-Bitcoin Argument appeared first on BeInCrypto.
Crypto World
Bitcoin Price Prediction: OCC Grants Crypto Bank Charter as Pepeto Targets 100x While ETH and XRP Hold

Bitcoin price prediction shifted this week after the OCC granted conditional approval for the biggest US crypto exchange to become a federally regulated trust bank, pulling digital assets deeper into the traditional banking system.
While the wider market has cooled with major coins pulling back, Pepeto stands out as the top presale entry with its Binance listing getting closer every day.
With a working exchange already live and $8.68 million raised, Pepeto combines real technology with a presale that analysts see running 100x once the listing opens, making it the play that the next rally is about to reward.
The OCC gave Coinbase conditional approval for a national trust bank charter on April 2, placing the largest US crypto exchange under direct federal oversight, according to CoinDesk.
The charter lets Coinbase handle custody services across all 50 states under one set of rules instead of juggling separate state licenses, according to Bitcoin Magazine. Pension funds and sovereign wealth funds often need bank-grade oversight before moving capital into crypto, and this approval knocks down one of the last walls.
The biggest stamp of trust in crypto history just dropped, and the presale entries set to ride that wave are where the real gains live.
Pepeto: The Presale Where 100x Lines Up as the Bitcoin Price Prediction Turns Bullish on Federal Backing
While the CLARITY Act sits stuck in committee, the direction is obvious, and sharp traders are hunting for the best entries to catch the recovery forming underneath.
Pepeto ranks near the top because a live exchange with $8.68 million committed and a Binance listing closing in gives it everything needed to stand as one of the best plays of 2026.

The math speaks for itself. At $0.0000001862, analysts see 100x once the Binance listing opens. The person who created the original Pepe token, which hit $11 billion on hype alone, built this exchange with a veteran from Binance’s listing team. Every swap runs through PepetoSwap at zero cost, every cross-chain move between ETH, BNB, and Solana lands at full value, and every token gets flagged for scam patterns before your capital touches it, all verified clean by SolidProof.
What drives Pepeto daily is real utility, and 188% APY staking grows every position while the listing window gets tighter. The entries that turned early believers into millionaires in past cycles all shared one trait: they found a working project before the crowd showed up, and Pepeto at presale pricing is that exact setup right now.
Ethereum (ETH)
ETH trades at $2,041 per CoinMarketCap, holding just above the $2,000 floor as the broader rally has not yet carried altcoins higher.
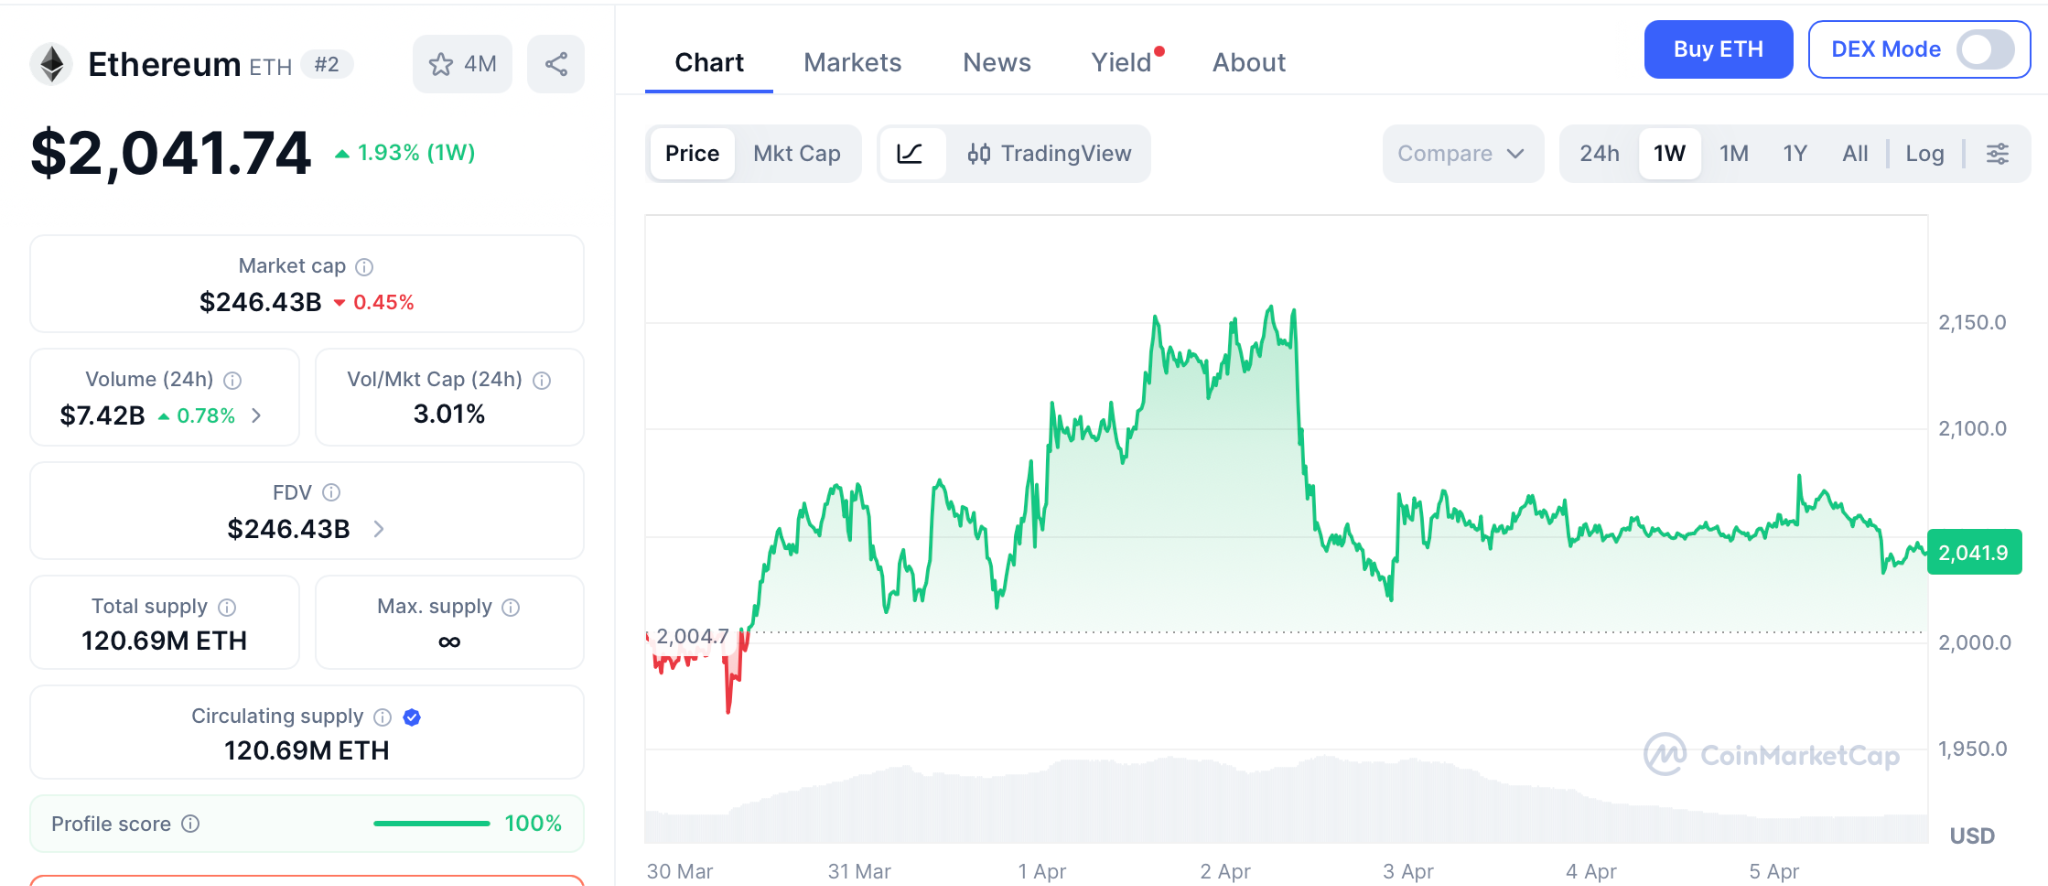
Standard Chartered keeps a $7,500 year-end target, but from here that is a 3.6x over nine months, decent for big portfolios, while Pepeto at presale pricing targets 100x from a single listing event the Binance debut is set to kick off.
XRP
XRP trades at $1.29 per CoinMarketCap, drifting below key moving averages as sellers stay in control.
Standard Chartered recently cut its year-end call to $2.80, roughly a 2x that takes patience, but presale entries grab the multiples that XRP at an $81 billion cap can no longer produce.
Conclusion
The picture is forming fast and the math is simple. The OCC handing a federal bank charter to the largest US exchange means the bitcoin price prediction just got backed by the same system that watches over Wall Street. ETH at $2,041 targets $7,500 over nine months, a 3.6x that pays patience, and the investors who grabbed ETH at $0.30 turned $1,000 into $16,000 because they spotted a working platform at early pricing and moved.
The bitcoin price prediction shows early bull signals building while the presale window gets tighter by the day. Visit the Pepeto official website and secure your spot before this chance turns into a headline you read about instead of a gain you earned, because projects with real products, viral buzz, and a Binance listing on deck do not sit at presale prices for long.
Click To Visit Pepeto Website To Enter The Presale

FAQs
What is the Coinbase OCC charter and how does it change the bitcoin price prediction?
The OCC gave Coinbase a federal trust bank charter, pulling crypto under Wall Street-grade rules. The bitcoin price prediction turns structurally bullish.
What are ETH and XRP targets next to the bitcoin price prediction?
ETH targets $7,500 by year end, XRP targets $2.80, and Pepeto targets 100x from the Binance listing. The Pepeto official website still takes entries.
Why is Pepeto the top pick as the bitcoin price prediction shifts bullish?
Pepeto has a live exchange, a SolidProof audit, $8.68 million raised, and 100x projected from the coming Binance listing.
Disclaimer: This is a Press Release provided by a third party who is responsible for the content. Please conduct your own research before taking any action based on the content.

MicroStrategy, the largest publicly traded corporate holder of Bitcoin, appears set to resume BTC purchases this week. This comes after a brief pause that interrupted one of the longest buying runs in its treasury strategy.
On Sunday, Executive Chairman Michael Saylor resurrected his customary “Orange Dot” tracker on the social media platform X, posting the phrase, “Back to work.”
STRC Rebound Raises Odds of Another MicroStrategy Bitcoin Purchase
Notably, similar phrases have served as a highly reliable leading indicator for multi-million-dollar Bitcoin buy orders over the past several months.
MicroStrategy currently holds 762,099 Bitcoin, valued at more than $50 billion. Another purchase this week would extend that lead and further separate the company from every other listed firm holding the token on its balance sheet.
Meanwhile, the size of any new purchase has not been disclosed.
Still, market watchers following the company’s financing activity say the latest issuance tied to its STRC preferred stock may have restored enough buying capacity. That would be enough to fund the acquisition of at least 1,500 Bitcoin.
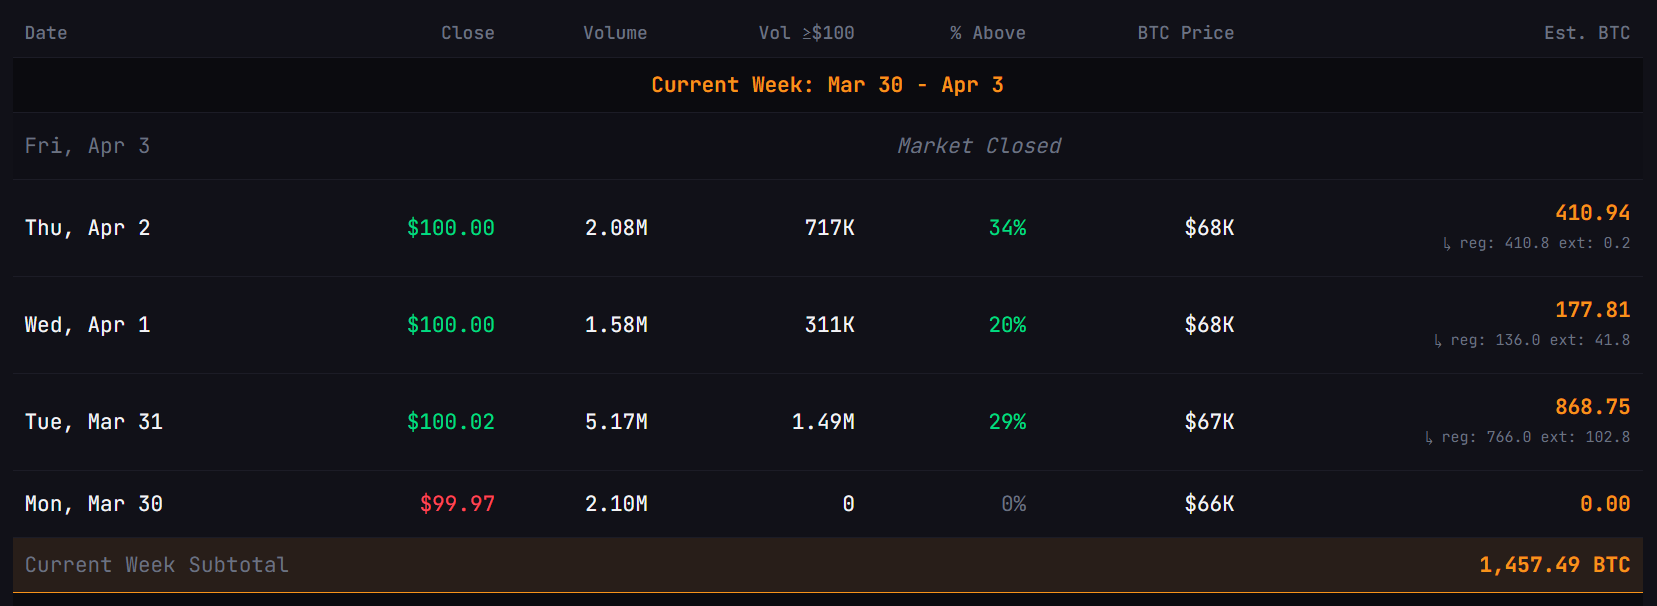
That would mark a reversal from the previous week, when STRC traded mostly below par and appeared to curb the company’s ability to raise fresh capital for additional Bitcoin purchases.
Meanwhile, the focus is shifting beyond the next headline purchase to the mechanics supporting it. STRC, one of the instruments used to finance the company’s Bitcoin strategy, pays a variable annualized dividend of 11.5% as of April 2026.
Since launch, STRC alone has financed the purchase of 50,792 Bitcoin. That has made the preferred stock an important part of the company’s broader funding structure as it continues to build what is already the largest corporate Bitcoin treasury in the market.
The strategy, however, continues to divide opinion.
MSTR supporters view the company’s financing model as a high-conviction way to accumulate Bitcoin at scale and tighten its identity as a proxy for the asset in equity markets.
However, critics argue the growing dividend burden tied to its preferred investors leaves the company more exposed if Bitcoin enters a sharp or prolonged downturn.
The post MicroStrategy May Resume Bitcoin Purchases as Saylor Revives ‘Orange Dot’ appeared first on BeInCrypto.
The Solana Foundation has launched a new developer toolkit aimed at bridging artificial intelligence with its blockchain network.
Last week, the Swiss-based non-profit organization introduced “Agent Skills” to allow AI programs to autonomously execute on-chain transactions.
AI Agents Payments Market Still Small
The open-source toolkit allows developers to install pre-built modules with a single line of code. This enables AI agents to handle automated tasks, process payments, and trade assets across the Solana network.
The foundation provided official modules for security and compatibility, alongside more than 60 community-contributed skills from major Solana ecosystem platforms like Jupiter Exchange, Raydium, and Helius.
However, the foundation noted that community-contributed tools are not officially endorsed. Users are warned that integrating autonomous AI agents with unvetted decentralized finance (DeFi) protocols carries inherent security risks, and inclusion in the toolkit does not imply a warranty.
The launch highlights the cryptocurrency industry’s broader push to capture the emerging market of “agentic payments.” These transactions are initiated and completed by AI without human intervention.
Last year, consulting firm McKinsey & Co. pointed out that more businesses will need to adapt to this AI-driven operating environment. According to the firm, this could create a $5 trillion market by 2030, encompassing retail, logistics, and commerce platforms.
Despite the rapid development of blockchain infrastructure tailored for AI integration, current market demand remains negligible, exposing a significant gap between technological capability and real-world adoption.
For example, x402, an existing agentic payment protocol, processed only about $24 million in volume during the last 30 days.
Furthermore, blockchain analytics firm Artemis pointed out that “x402 ‘agent payments’ boom is still mostly a mirage.” It noted that x402-related activities had collapsed from a peak of over 731,000 transactions per day in December to around 57,000 transactions per day in February.
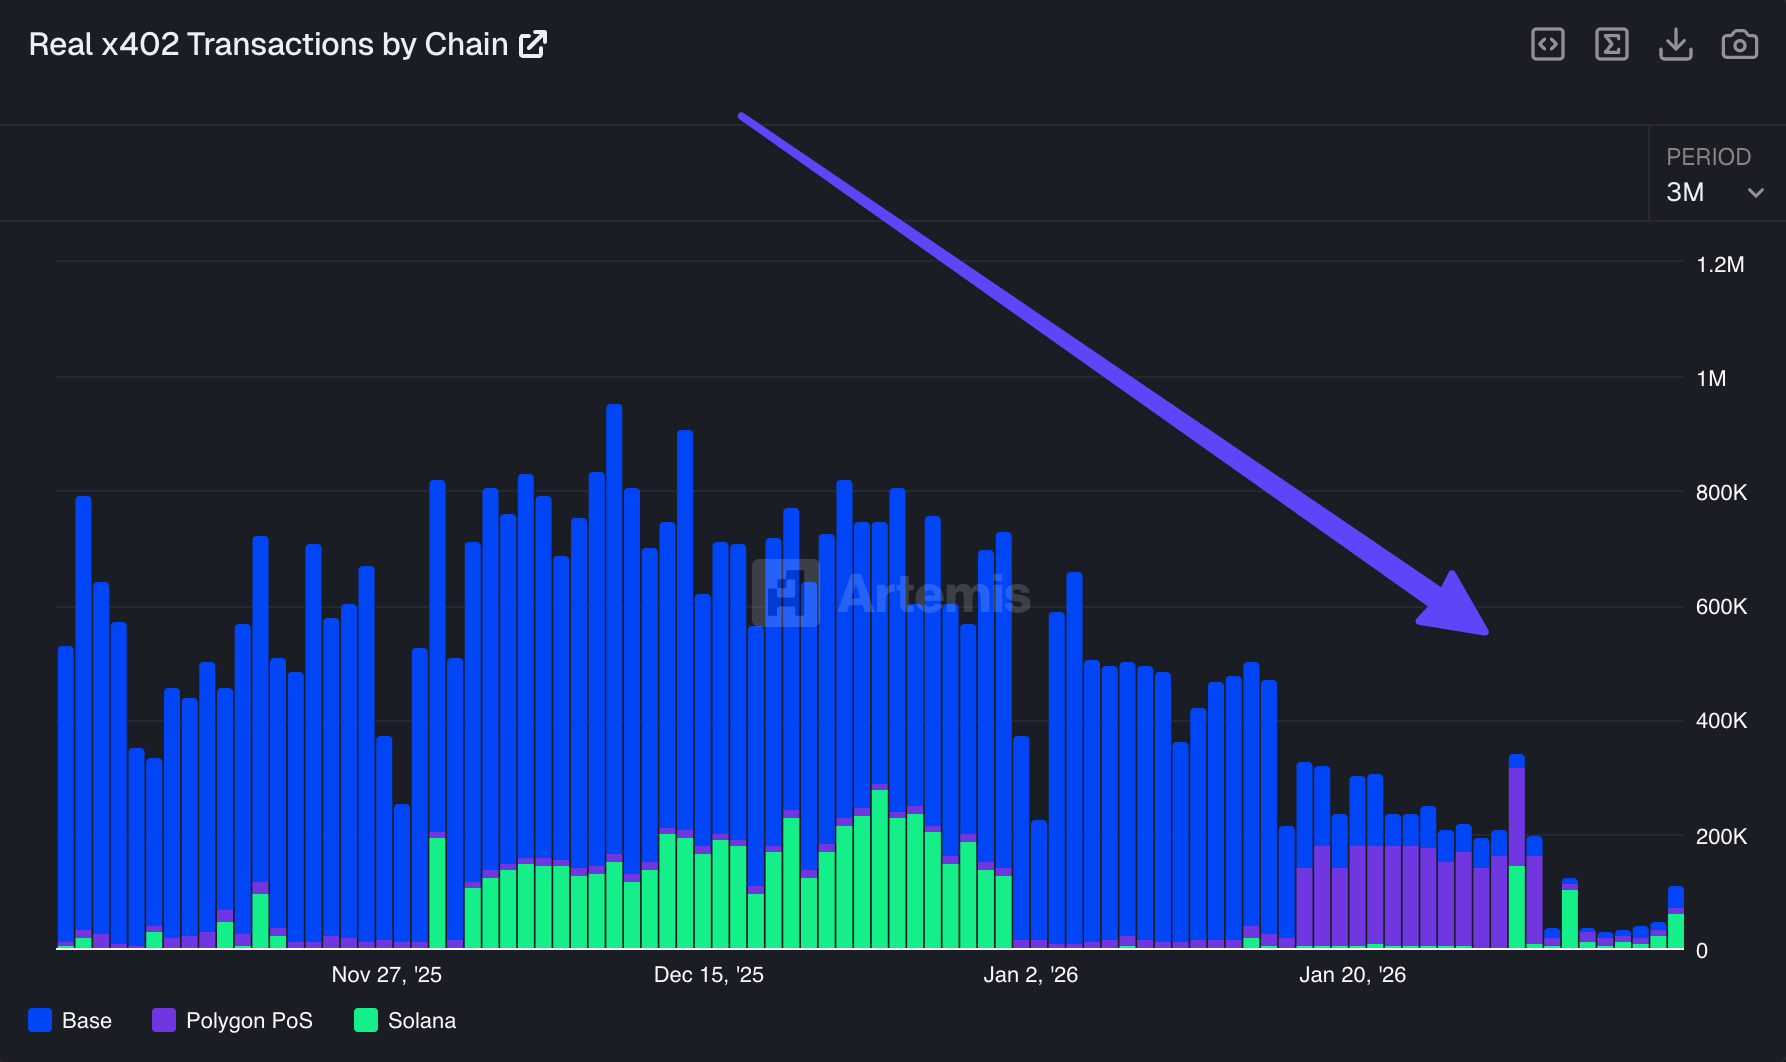
This data underscores that while networks like Solana are building the rails for an AI-driven economy, the merchants and users required to sustain it have not yet arrived.
The post Solana Targets $5 Trillion AI Market With New Developer Toolkit appeared first on BeInCrypto.

Bitcoin is hovering near the $67,000 level as weekend liquidity thins and traders weigh the risk of renewed downside. A Bollinger Bands squeeze on shorter timeframes points to a potential burst of volatility, but direction remains uncertain as sellers re-enter into a quiet end of the week.
In a market snapshot on Sunday, a prominent market observer highlighted how the current cycle differs from past Bitcoin bear markets. Pseudonymous trader LP_NXT noted that bottoms in earlier cycles typically formed after several sweeps of the downside, triggering capitulation before a revival. This time, the pattern has tended to sweep the highs, leaving the lows exposed and liquidity building below price action, complicating entries for bears and bulls alike.
“In contrast, this cycle has been sweeping the highs, making it difficult to enter short positions while leaving the lows exposed and building liquidity below.”
Meanwhile, traders are watching for a potential breakdown below key thresholds. LP_NXT suggested that a sweep of sub-$60,000 levels could be a likely signal once selling pressure intensifies, but the eventual breakdown and the way price behaves around consecutive lows will be crucial for identifying a real bottom.
Key takeaways
- Four-hour Bollinger Bands have contracted, signaling a classic volatility squeeze that could precede a sharp move up or down.
- Bottom formation remains uncertain; historical patterns favored repeated low sweeps to trigger capitulation, but this cycle has shown different dynamics by sweeping highs instead.
- Binance order-book data reveals unusual selling activity by a small investor class using a TWAP bot, with a single hour showing about $18 million in sell pressure—far above their typical daily volume.
- Market participants describe a dichotomy in whale behavior: “buying dips and selling rips” even as BTC remains range-bound, amid macro headwinds from stronger dollar pressures.
- Past coverage flagged added risk to bulls from a recovering U.S. dollar; investors should monitor whether price action can sustain above or below critical thresholds as liquidity shifts.
Technical setup: volatility compression and looming decisions
Price action around Sunday kept Bitcoin mired in a relatively tight band near $67k, with intraday volatility showing signs of re-emerging pressure rather than a firm directional breakout. The Bollinger Bands on the four-hour chart narrowed, a familiar prelude to a burst of activity once buyers or sellers step in decisively. Traders often interpret this as a fork in the road: a break above resistance could rekindle upside momentum, while a breakdown might expose the market to fresh liquidity-driven moves.
Among market observers, this has been a focal point because the prior cycles’ patterns around low-volume weekends can set the stage for the next move. The contrast with recent behavior—where repeated sweeps of local highs have dominated—adds an extra layer of complexity to positioning ahead of any potential move.
Whale dynamics and order-book signals
Beyond the price chart, on-chain and order-book activity has drawn attention. Keith Alan, cofounder of trading analytics firm Material Indicators, highlighted unusual selling density in the Binance BTC/USDT book despite muted price action. A time-weighted average price (TWAP) bot was observed distributing BTC, with the smallest order class executing a roughly $18 million sell program in an hour—significantly larger and more rapid than the class’s typical $3 million to $5 million daily volume.
“That’s exponentially more than their normal $3M-$5M daily volume in 1 hr. That ain’t retail!”
A broader portrait emerges of a market where whales are not uniformly aligned with a single directional narrative. Alan summarized the dynamic as “buying dips and selling rips” within a price range that continues to confound shorter-term traders. This pattern aligns with a market waiting for clearer macro cues and a more definitive breakout or breakdown signal.
Earlier reporting noted additional bulls’ headwinds from a recovering U.S. dollar, which can dampen enthusiasm for risk assets like Bitcoin when fiat strength escalates. The current activity in the order book underscores how much of the near-term price action may be driven by large players rather than retail flow, particularly as weekend liquidity dries up and position risks accumulate.
Macro backdrop and what it could mean next
The interplay between Bitcoin’s price trajectory and dollar strength remains a critical backdrop for traders. If the dollar cools or if liquidity shifts back into risk assets, BTC could attempt a sustained push higher. Conversely, renewed dollar strength or renewed selling pressure from large token holders could push the market toward test levels below the February low near $60,000. As with many chart-based narratives, the outcome will likely hinge on whether price can sustain a breakout beyond key resistance and whether further high-low sweeps occur, testing traders’ willingness to commit to new positions.
With Bitcoin hovering near critical junctures, investors are watching for concrete signals: a decisive break above the recent range, a compassionate test of sub-$60,000 lows, or a different pattern of liquidity formation that could indicate a new phase in the market cycle. The next couple of sessions should offer clearer directional clues as macro catalysts and order-book dynamics converge.
Cointelegraph’s prior coverage of dollar strength and its implications for crypto markets remains a useful context for readers assessing risk and potential routes for Bitcoin in the near term.
As the market enters a decision point, traders should monitor both price action and the evolving composition of order-book activity to gauge whether a bottom is forming or if a fresh leg down could materialize.
What remains uncertain is how quickly order-flow dynamics will normalize once weekends end and institutions re-enter the scene. Investors should stay alert to any break of sub-$60k liquidity traps or indicators that reinforce a shift in the prevailing liquidity regime.


Crypto markets faced a mix of structural, market, and policy-related developments on the day.
Summary
- Michael Ippolito said rising token supply diluted returns as average coin values lagged market cap.
- Michael Saylor said Bitcoin price now follows capital flows, not the old four-year halving cycle.
- Polymarket removed a market on a missing US service member after backlash over integrity standards.
New comments from industry figures focused on token oversupply, Bitcoin’s changing market cycle, and a backlash that led Polymarket to remove a sensitive prediction market.
Michael Ippolito, co-founder of Blockworks, said the crypto sector faces an “existential” problem as token supply grows faster than value creation. In posts on X, he said total crypto market capitalization has stayed relatively firm, but the average value per token has remained weak.
He wrote that “the average coin is only slightly higher than where it was in 2020” and also down about 50% since 2021. He added that median token returns have fallen sharply, with many tokens down about 80% from their peak levels.
Ippolito said this pattern shows gains have stayed concentrated in a small group of large-cap assets. At the same time, much of the wider market has failed to keep pace. His comments pointed to a growing gap between the number of new tokens and the value generated across the sector.
He also said, “We created a TON of new assets and STILL total market cap is flat.” That view framed token issuance as a dilution problem, where capital spreads across more assets without lifting average returns.
Saylor says capital flows now drive Bitcoin
Michael Saylor said Bitcoin no longer follows the traditional four-year cycle linked to halving events. He stated that the old cycle is “dead” and said price action now depends more on capital flows, credit conditions, and institutional demand.
For years, many traders used halvings as a core part of Bitcoin market analysis. Those events reduced miner rewards and often shaped expectations for future rallies. Saylor now argues that Bitcoin has entered a different stage.
He wrote that “price is now driven by capital flows” and said bank credit and digital credit will play a larger role in Bitcoin’s future path. His comments shifted attention away from supply shocks alone and toward access through funds, banks, and large firms.
That position came as more traditional financial platforms continued to expand Bitcoin-related services. The change has led some market participants to track treasury strategies, regulated products, and large-scale adoption more closely than past cycle models.
Polymarket removes market after criticism
Polymarket removed a market tied to the fate of a missing US service member after public criticism. The listing asked whether US authorities would confirm the rescue of a pilot reportedly shot down over Iran, and it drew sharp backlash online.
US Representative Seth Moulton criticized the market and called it “disgusting.” He said people were betting on the fate of a service member who could be injured, missing, or in danger.
Polymarket said the listing violated its “integrity standards” and removed it. The platform also said the market should not have gone live and that it is reviewing how it passed internal checks.
The company did not give more detail on the exact rule involved. Still, the removal added to the wider debate over what types of real-world events prediction markets should allow, especially when the subject involves war, injury, or loss of life.
Crypto World
ASST Stock Price Forecast: Analyst Projects 53x Surge to $515 by 2034 Using Bitcoin Power Law

TLDR:
- ASST stock price is projected to rise from $9.75 today to $515 by 2034, marking a 53x potential gain.
- Strive’s Bitcoin holdings may grow from 13,628 BTC to 83,299 BTC by 2034 through continuous SATA issuance.
- CEBE per share is forecast to grow 3.2x from 13,193 to 42,028 sats, even after 91% total share dilution.
- Strive currently trades at 73% of NAV with only $10M in debt, offering discounted Bitcoin-amplified exposure.
ASST stock price has drawn growing attention from crypto-focused investors. A financial analyst recently published a detailed multi-year projection for Strive Asset Management’s shares.
The model suggests the stock could climb from $9.75 today to $515 by 2034. The forecast relies on Bitcoin’s historical power law trajectory and a balance sheet leverage model. The analysis has gained traction among those tracking Bitcoin-linked equity vehicles in public markets.
Bitcoin Power Law Forms the Backbone of ASST Stock Price Forecast
Analyst Adam Livingston published the projection via social media. He applied two analytical tools: the Bitcoin Power Law and the CEBE Framework. Bitcoin’s 15-year price trend follows the expression P(t) ~ t⁵·⁶⁹, carrying an R² of 0.961.
The model assumes Strive maintains a 48% amplification ratio throughout the forecast period. This ratio is sustained through continuous SATA preferred share issuance. All proceeds from those issuances are directed toward Bitcoin purchases.
Throughout the model, the enterprise value mNAV remains constant at 1.06×. That figure reflects Strive’s current market valuation. Bitcoin’s price path follows the power law curve across all projected years.
According to the model, Strive’s Bitcoin holdings grow from 13,628 BTC today to 83,299 BTC by 2034. That marks a 6.1× increase in holdings over eight years. The growth stems entirely from maintaining the current amplification strategy.
CEBE Framework Tracks Common Equity Gains Despite Share Dilution
The CEBE framework measures what common shareholders actually own on the balance sheet. It strips out all senior claims before arriving at common equity value. This approach offers a more precise view of shareholder exposure to Bitcoin.
Livingston stated in his post: “CEBE per share grows from 13,193 to 42,028 sats… a 3.2× increase in what common equity actually owns, AFTER subtracting all senior claims, DESPITE 91% total share dilution over 8 years.”
Preferred dividends are set at 12.75% and are paid through common share issuance. This creates roughly 8.4% annual dilution for existing shareholders. Yet Bitcoin’s projected appreciation rate near 35% per year more than offsets that drag.
The spread between Bitcoin’s power law CAGR and the preferred cost sits at approximately 22 percentage points. That gap consistently favors common shareholders over the projection horizon. As Bitcoin’s price rises, dollar-denominated preferred claims become less burdensome in Bitcoin terms.
Strive currently trades at 73% of its net asset value. Its outstanding debt stands at just $10 million, reflecting a 1.1% leverage ratio.
Livingston observed that the market currently assigns no premium to the Bitcoin accumulation engine. He described ASST stock price as a discounted entry point into amplified Bitcoin exposure, with limited debt risk attached.
Crypto World
Ripple (XRP) Aims to Revolutionise Finance, Yet Analysts Say Taurox (TAUX) Might Make it Sooner After Opening Pre-KYA

Ripple trades near $1.32 right now. On April , the International Monetary Fund released a major new note on “Tokenized Finance,” calling tokenization a fundamental shift in how global finance works, not just a small tech upgrade. The IMF highlighted faster settlement, better transparency, and huge potential for real-world assets and cross-border payments. This directly aligns with what Ripple and XRP were built for.
Taurox, an AI-driven trading protocol, is designed to help regular stakers benefit from these big-picture shifts through smart autonomous agents that focus on steady, risk-managed returns.
Even with the IMF validating the exact type of tokenized future Ripple has been pushing, XRP holders often see sharp 20-30% swings due to escrow releases, market sentiment, and short-term noise. It can feel frustrating when the long-term story is strong but the price doesn’t always reflect it. Taurox was created to solve that. It pools deposits of USDT, BTC, or XRP into one shared trading pool and lets a global team of developers, quants, and AI engineers run multiple diversified strategies at once.
Each strategy is strictly limited to 2% of the total pool to keep risk controlled, and smart built-in rules automatically maintain balance. The result is smoother performance, without the constant stress of trying to time every headline or paying high management fees like traditional funds charge.

Taurox has opened the Pre-KYA Registration Table ahead of schedule. This early window lets developers, quants, and AI builders submit their trading agents before the full system launches. The first ones in get priority testing in the Proving Ground, faster access to pool capital, and extra rewards from the Agent Creator Fund (10% of total TAUX supply). If you already have a working trading strategy, this is your opportunity to position yourself early in the Taurox ecosystem.
When you stake, your funds go into one shared trading pool and you receive txTokens that represent your share of the pool’s value, starting at $1.00 each. The protocol keeps 15% in stablecoins as a safety buffer and puts the rest to work through autonomous agents.
These agents only run real strategies after passing strict tests in the Proving Ground. Daily loss limits of 2%, single-trade caps of 5%, and an automatic pause if the pool drops 5% all help protect your capital. Everything is on-chain and fully transparent.

TAUX has a hard-capped supply of 2 billion tokens that can never be increased after launch. Taurox charges zero upfront fees, it only takes 5% of the profits the agents make, buys TAUX on the open market, and permanently burns 30% of it. The rest is shared between stakers, the DAO, and the strategy creators. This design creates real scarcity: the bigger and more successful the pool becomes, the more valuable TAUX can get over time.
The Taurox Presale has entered Phase 4 and has already raised over $950K. TAUX is currently priced at $0.018. Investors joining in this phase are positioned for nearly 4.5x returns when the token lists at $0.08. If Taurox reaches its $1 billion pool target, these early participants could see up to 103x gains as TAUX potentially climbs to $1.85. For example, a $500 investment today would grow to roughly $2,220 at listing and approach $28,000 if TAUX hits the $1 level.
The presale includes a 1-month cliff and 20% monthly unlocks from month 2 to 5, so you can start staking quickly while limiting early selling. Combined with 30% burns and strong reserves, it offers real potential for both short-term and long-term upside.
The IMF just put a global spotlight on tokenized finance, exactly the space Ripple has been building toward for years. While the broader market sorts out the short-term noise, Taurox gives you a practical way to stay exposed without the usual volatility and guesswork. It combines intelligent AI agents with clear risk controls and a token that actually becomes scarcer as the protocol grows. If you believe in Ripple’s long-term role in the tokenized future, Taurox is built for exactly this moment.
Buy TAUX: https://taurox.io
Whitepaper: https://docs.taurox.io/
Official Telegram: https://t.me/tauroxlabs
Official X/Twitter: https://x.com/TauroxProtocol
Disclaimer: This is a Press Release provided by a third party who is responsible for the content. Please conduct your own research before taking any action based on the content.
Bitcoin may no longer move in step with Federal Reserve policy, according to a new report from Binance Research, which points to a structural shift driven by spot exchange-traded funds.
For years, crypto markets reacted sharply to interest rate signals, with bitcoin falling when central banks tightened monetary policy.
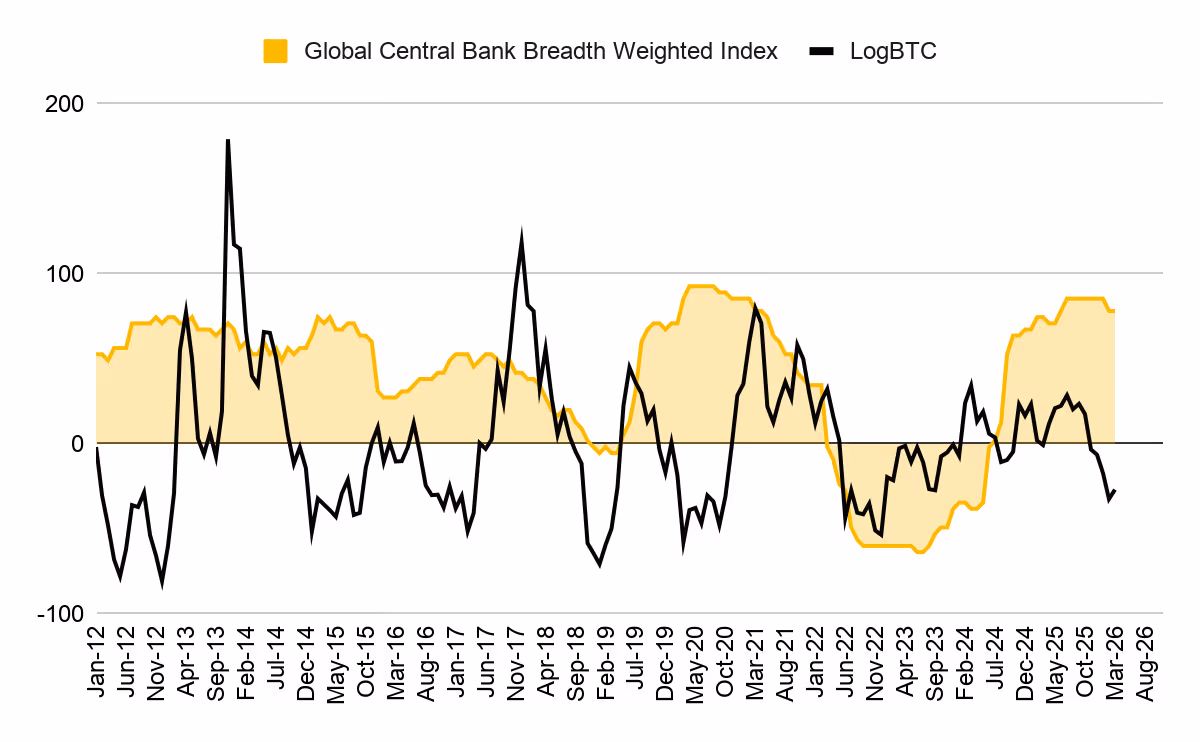
That pattern now appears to be breaking as Binance data shows bitcoin’s correlation with its Global Easing Breadth Index, which tracks 41 central banks, has turned strongly negative since 2024. Spot bitcoin ETFs were approved by the U.S. Securities and Exchange Commission (SEC) in January 2024.

Before ETFs, the relationship was mildly positive, with BTC tending to follow global easing cycles by several months. Now, the report finds the opposite effect is nearly three times stronger, suggesting the old link has reversed.
The change reflects a shift in who drives prices. Retail investors once dominated crypto trading and reacted to macro news. ETFs allowed institutions to play a bigger role, and these firms often positioned months ahead of policy changes, treating BTC as a forward-looking asset.
“As a result, BTC may have evolved from a macro ‘lagging receiver’ to a ‘leading pricer,” Binance Research wrote. “A peak in easing may already be old news for BTC, and crypto-native drivers—such as policy progress and institutional flows—could matter more than the direction of monetary easing itself.”
The findings come as markets grapple with renewed stagflation fears tied to rising oil prices and growing geopolitical tensions over the war in the Middle East.
Rate expectations have swung from projected cuts to possible hikes, a backdrop that historically pressured risk assets.
Binance argues that the reaction may be overstated. In past cycles, central banks often pivoted to support growth despite inflation spikes. If history repeats itself, central banks are to eventually prioritize growth over inflation, and bitcoin will likely price that pivot earlier than expected.


Bitcoin drew mixed public views after new comments from market observers focused on long-term performance and price structure.
Summary
- Adam Livingston said Bitcoin trades 0.94 sigma below center as price structure tightens around power law.
- Livingston said Bitcoin’s historical trading range compressed sharply, with crashes and blowoff tops becoming less extreme.
- Peter Schiff said Bitcoin gained 12% in five years, trailing stocks, gold, and silver.
Adam Livingston said Bitcoin’s recent price action shows a more stable pattern. In a post on X, he wrote that the asset’s oscillations are “dampening” and that the “funnel is closing.” He said this pattern shows Bitcoin moving closer to equilibrium around its long-term power law center.
He added that Bitcoin now sits about “−0.94σ below center,” which he described as below trend and below fair value. Livingston said the narrowing range suggests blowoff tops are fading and that large crashes are also becoming less severe.
Livingston said Bitcoin’s trading range has tightened over time. He wrote that the 5.3σ range seen in 2011 to 2013 has compressed to 1.4σ in the 2021 to 2025 period. He argued that this shift shows Bitcoin trading in a narrower channel as the market matures.
He also pointed to the model’s reported strength during major market events. According to his post, the power law model absorbed the 2022 market crash, the FTX collapse, the 2024 recovery, the 2025 top, and the current drawdown, while its R² value rose to 0.961.
Schiff questions Bitcoin’s long-term edge
As we recently reported, Peter Schiff took a different view by focusing on Bitcoin’s five-year return. He said Bitcoin gained 12% over that period. He also said the Nasdaq rose 57.4%, the S&P 500 gained 59.4%, gold climbed 163%, and silver advanced 181%.
Using those figures, Schiff asked,
“If the appeal of Bitcoin is its superior long-term performance, why should anyone keep HODLing it?”
His remarks placed Bitcoin’s recent record next to more traditional markets and metals.

Garmin x Natural Cycles could be a big step forward for women’s health

My Gaming PC Was Secretly Mining Crypto?!
‘I swapped Amazon to walk the streets with strangers – I wouldn’t change it for the world’


-

 NewsBeat3 days ago
Steven Gerrard disagrees with Gary Neville over ‘shock’ Chelsea and Arsenal claim | Football
-

 Business3 days ago
No Jackpot Winner and $194 Million Prize Rolls Over
-

 Fashion2 days ago
Weekend Open Thread: Spanx – Corporette.com
-
Entertainment6 days ago
Fans slam 'heartbreaking' Barbie Dream Fest convention debacle with 'cardboard cutout' experience
-

 Crypto World4 days ago
Gold Price Prediction: Worst Month in 17 Years fo Save Haven Rock
-

 Tech7 days ago
The Pixel 10a doesn’t have a camera bump, and it’s great
-
Crypto World5 days ago
Dems press CFTC, ethics board on prediction-market insider trades
-

 Tech7 days ago
Avatar Legends: The Fighting Game comes out in July and it looks pretty slick
-

 Sports22 hours ago
India men’s 4x400m and mixed 4x100m relay teams register big progress | Other Sports News
-

 Business4 days ago
Login and Checkout Issues Spark Merchant Frustration
-

 Tech6 days ago
Apple will hide your email address from apps and websites, but not cops
-

 Tech5 days ago
EE TV is using AI to help you find something to watch
-

 Sports5 days ago
Tallest college basketball player ever, standing at 7-foot-9, entering transfer portal
-

 Politics6 days ago
Should Trump Be Scared Strait?
-

 Tech6 days ago
Flipsnack and the shift toward motion-first business content with living visuals
-

 Fashion6 days ago
The Best Spring Trends of 2026
-

 Sports6 days ago
Women’s hockey camp eyes fitness boost, tactics ahead of WC 2026 campaign | Other Sports News
-

 Tech5 days ago
How to back up your iPhone & iPad to your Mac before something goes wrong
-
Crypto World7 days ago
Bitcoin’s Six-Month Losing Streak: What On-Chain Data Says About the Market’s Next Move
-

 Politics6 days ago
BBC slammed for ignoring author of The Fraud
You must be logged in to post a comment Login