
Crypto World
Bitcoin Rebound Fades as Range Highs Crumble: Why BTC Is Volatile

Bitcoin, the trailblazer of the crypto markets, extended a three-day retreat after failing to sustain a breakthrough above $70,000, briefly slipping under $66,000 during the New York session. The move comes as liquidity in spot markets appears thinner, with on-chain signals pointing to the possibility that selling pressure on dominant venue Binance is guiding the short-term trajectory. While the setup has drawn comparisons to prior pullbacks, the current dynamics show subdued US participation and a reluctance among traders to redeploy capital at current levels. Investors are watching whether the price can establish a more durable bottom or if the weakness spills into the broader risk-on spectrum, given the sensitivity of Bitcoin to macro risk sentiment, ETF flows, and spot demand signals.
Key takeaways
- The Coinbase premium index has dipped below zero, signaling muted US spot demand at current price levels.
- Cumulative volume delta (CVD) on Binance has remained negative, underscoring persistent net selling pressure rather than accumulation.
- The 30-day new money flow has flipped to negative territory, around –$2.8 billion, suggesting weaker fresh capital entering the market.
- Open interest has declined to about $17.6 billion, indicating a unwind of leverage rather than new long exposure.
- The “young supply” metric (coins moved in the last 0–1 month) has cooled to roughly 13%, pointing to thinner speculative participation compared with prior rallies.
Tickers mentioned: $BTC
Sentiment: Bearish
Price impact: Negative. The failure to sustain above $70,000 and the renewed downside move below $66,000 reflect renewed selling pressure and a cautious posture among traders.
Trading idea (Not Financial Advice): Hold. The lack of robust spot demand and waning open interest suggest patience until on-chain signals and price action align for a nearer-term reversal.
Market context: The current pullback follows a period of net selling pressure on Binance with a subdued US participation backdrop, as the Coinbase premium remains negative and on-chain metrics trend softer than in prior upswings.
Why it matters
The latest data paints a picture of a market that is trading with caution rather than enthusiasm. Bitcoin’s price action near the $66,000 level coincides with several on-chain indicators that have historically presaged slower bullish inflows rather than renewed buying interest. The negative CVD on Binance, coupled with a muted Coinbase premium, suggests that spot-led demand—the fuel for a sustained upmove—has cooled at these price levels. In practical terms, the market is testing whether investors will step in at lower levels or if the liquidity tap remains largely off, complicating any attempt to stage a durable rally in the near term.
From a leverage perspective, the steady decline in open interest implies that traders are closing positions rather than initiating new long bets. This is important because it signals a risk-tolerant environment is not currently driving new exposures; instead, participants are digesting the recent price action and awaiting clearer catalysts. The combined effect of shrinking leverage and muted new money flow reduces the odds of a rapid, self-sustaining rebound in Bitcoin prices without a shift in the broader liquidity backdrop or a fresh wave of buying momentum from major players.
Looking at the supply-side signals, the “young supply” share has cooled toward the lower end of its range, suggesting a lull in speculative participation from newer entrants. When the youth supply shrinks, it often accompanies a lack of capitulation-driven liquidity rather than the exuberance seen in stronger uptrends. In the current context, the market atmosphere resembles a phase of consolidation with a cautious tilt, rather than a momentum-driven breakout. The data also underlines the interplay between spot demand and the efficiency of price discovery in a market where futures and ETFs can influence the pace and direction of moves, even as spot liquidity remains fragile.
For readers tracking cross-corridors of influence, the ongoing discussion around spot Bitcoin ETFs and their inflows remains relevant. Related reporting has highlighted that spot Bitcoin ETFs added significant inflows recently, underscoring how new vehicles can alter risk appetite and liquidity dynamics even as spot markets grapple with a cooler demand cycle. This backdrop reinforces the notion that any sustained upside will likely hinge on a combination of improved on-chain demand, favorable macro conditions, and constructive ETF or futures flows that re-energize liquidity in the ecosystem.
Additional on-chain context comes from CryptoQuant data, which continues to emphasize the absence of robust spot demand below the $70,000 threshold. The 30-day money flow is negative, hovering near –$2.8 billion, with daily readings around the mid-to-high single-digit hundreds of millions of dollars in the red. In this environment, weaker inflows reduce the likelihood of a fast-paced re-acceleration, even as the market eyes any sign of a structural shift or a change in the ratio of bids to asks that could spark renewed buying interest.
All told, the market appears to be navigating a transitional phase: price discovery is proceeding in a backdrop of thinning liquidity, a cautious stance among buyers, and on-chain signals that favor restraint over aggression. While some traders will remain hopeful for a fast revival, others may choose to observe the next few sessions for clearer confirmation that demand is returning with conviction, not merely oscillating around a key price threshold.
Related: Spot Bitcoin ETFs add $167M, nearly erase last week’s outflows
CryptoQuant data further reinforces the lack of spot demand below $70,000. The 30-day cumulative new money flow has turned negative, near -$2.8 billion, while recent daily readings remain subdued around -$239 million. Unlike prior uptrends where price pullbacks drew meaningful inflows, the current price slide has not sparked a corresponding surge of capital into the market.
The “young supply” share (0–1 month), which tracks coins moved recently, has also cooled toward the lower end of its recent range, hovering near 13%. This pattern points to reduced speculative participation from newer traders, a characteristic frequently observed before the formation of a new base rather than during a fresh leg higher. Strong rallies in the past have been accompanied by rising young supply, expanding capital inflows, and increasing open interest—none of which are evident in the current phase, adding to the cautioned tone around near-term price prospects.
Related: Rare Bitcoin signal flashes: Will a 220percent BTC price rally follow?


Nvidia is being sued for hiding how much of its gaming GPU revenue came from crypto miners.
The class action covers fiscal 2018, a period when quarterly revenue surged 52% and 25% year-over-year. Shareholders allege the company deliberately obscured the fact that Ethereum mining demand was driving those numbers, not gaming.
The stakes extend beyond Nvidia. As the primary infrastructure-layer supplier to the GPU mining ecosystem, any regulatory cloud over its disclosure practices ripples into how investors price exposure across the entire supply chain.
Now the Supreme Court has entered the picture. It is reviewing the 9th Circuit’s decision allowing the suit to proceed, turning a corporate disclosure dispute into a potential landmark ruling on securities pleading standards.
This just got a lot bigger than one company’s accounting.
Key Takeaways:
- Case detail: Nvidia settled a parallel SEC enforcement action in May 2022 for $5.5 million after regulators found it failed to disclose crypto mining’s material impact on gaming GPU revenue in fiscal Q2 and Q3 2018.
- Legal mechanism: The class action turns on PSLRA pleading standards — plaintiffs lack internal documents proving CEO Jensen Huang knew exact mining revenue shares, but argue employee-level crypto trend tracking constitutes constructive knowledge sufficient to survive dismissal.
- Market implication: A Supreme Court ruling that loosens PSLRA pleading thresholds would expand litigation exposure for any public company with material crypto-derived revenue — a direct risk vector for mining hardware suppliers and adjacent equities.
The Allegation: Crypto Revenue Classified as Gaming Demand
Nvidia told investors its gaming GPU revenue growth reflected gamer demand. It did not. Cryptocurrency miners were bulk-buying GeForce cards to mine Ethereum during the 2017 boom cycle.
When Bitcoin crashed in 2018 and mining economics collapsed, GPU demand evaporated and gaming revenue fell sharply. The revenue base was never what Nvidia said it was.
The internal awareness is what makes this difficult to defend. During the 2 quarters with 52% and 25% year-over-year spikes, Nvidia’s own employees were actively tracking crypto market trends and their correlation with GPU sales.
Plaintiffs argue that makes executive statements attributing growth to gaming not just incomplete but knowingly misleading.
Nvidia’s own Q4 FY2019 results did the damage retroactively. The company explicitly linked the gaming and OEM revenue decline to cryptocurrency mining downturns. That admission directly contradicts the earlier framing.
The SEC already agreed something went wrong. Enforcement Division Crypto Assets and Cyber Unit Chief Kristina Littman stated that Nvidia’s disclosure failures deprived investors of critical information to evaluate the company’s business in a key market. Nvidia paid $5.5 million and signed a cease-and-desist without admitting wrongdoing.
That settlement structure is the core of the civil case now. Nvidia preserved its technical defense by not admitting fault. But the SEC finding functionally validates the factual allegation. The class action is not relitigating whether the disclosure failure happened. It is litigating who bears the financial consequences.
The Strategic Signal: Infrastructure-Layer Risk for Mining Markets
Nvidia supplies the dominant share of discrete GPUs used in proof-of-work mining operations. Mining companies — whether publicly listed operators or sovereign-scale entities like Bhutan’s state mining program liquidating Bitcoin holdings into Binance — depend on Nvidia hardware pricing and availability as a primary cost input.

Any sustained legal or regulatory uncertainty over Nvidia’s disclosure practices introduces a new variable into GPU procurement planning and equity valuation models for mining-adjacent companies.
The channel through which the lawsuit affects sentiment is investor trust, not GPU pricing directly. If the Supreme Court tightens PSLRA standards and dismisses the case, it effectively insulates tech companies from class actions built on circumstantial inference, reducing securities litigation risk across the sector.
If the Court upholds the 9th Circuit and the class action proceeds to discovery, plaintiffs gain access to internal communications, which historically is where these cases settle expensively.
Mining equities like Bitmine, currently accumulating ETH as a strategic reserve asset, carry indirect exposure through Nvidia’s role as GPU supplier — a guilty verdict or major settlement reframes how the market prices crypto-hardware dependency risk across the board.
Ethereum’s Merge in September 2022 already eliminated GPU-based ETH mining as a demand driver, and Nvidia’s 2021 launch of dedicated Cryptocurrency Mining Processor (CMP) products with hash rate limiters on GeForce cards was a deliberate structural separation of markets. The litigation relitigates a period that no longer operationally exists — but the precedent it sets for revenue source disclosure requirements is entirely forward-looking.
Discover: The best crypto to diversify your portfolio with
The post Nvidia Faces Class Action Over Crypto Mining Revenue Disclosure Gaps appeared first on Cryptonews.
Crypto World
XRP spot ETFs defy crypto slump with $1.4B in inflows as Bitcoin, gold and silver funds see outflows, JPMorgan says


XRP exchange-traded funds are pulling in fresh capital at a pace that puts them at odds with the rest of the market, as investors rotate out of gold and silver ETFs while keeping steady allocations to Bitcoin products amid geopolitical tensions and higher rates.
Summary
- XRP spot ETFs have amassed about $1.4 billion in net inflows since launch in November 2025, even as XRP’s price slid more than 30% from recent highs.
- By contrast, gold ETFs have seen nearly $11 billion in outflows in three weeks, while silver products also bled capital as rising rates and a stronger dollar pressured precious metals.
- JPMorgan says Bitcoin ETFs are holding net inflows and showing “greater resilience” than gold and silver, underscoring a shift in how investors hedge geopolitical and macro risk.
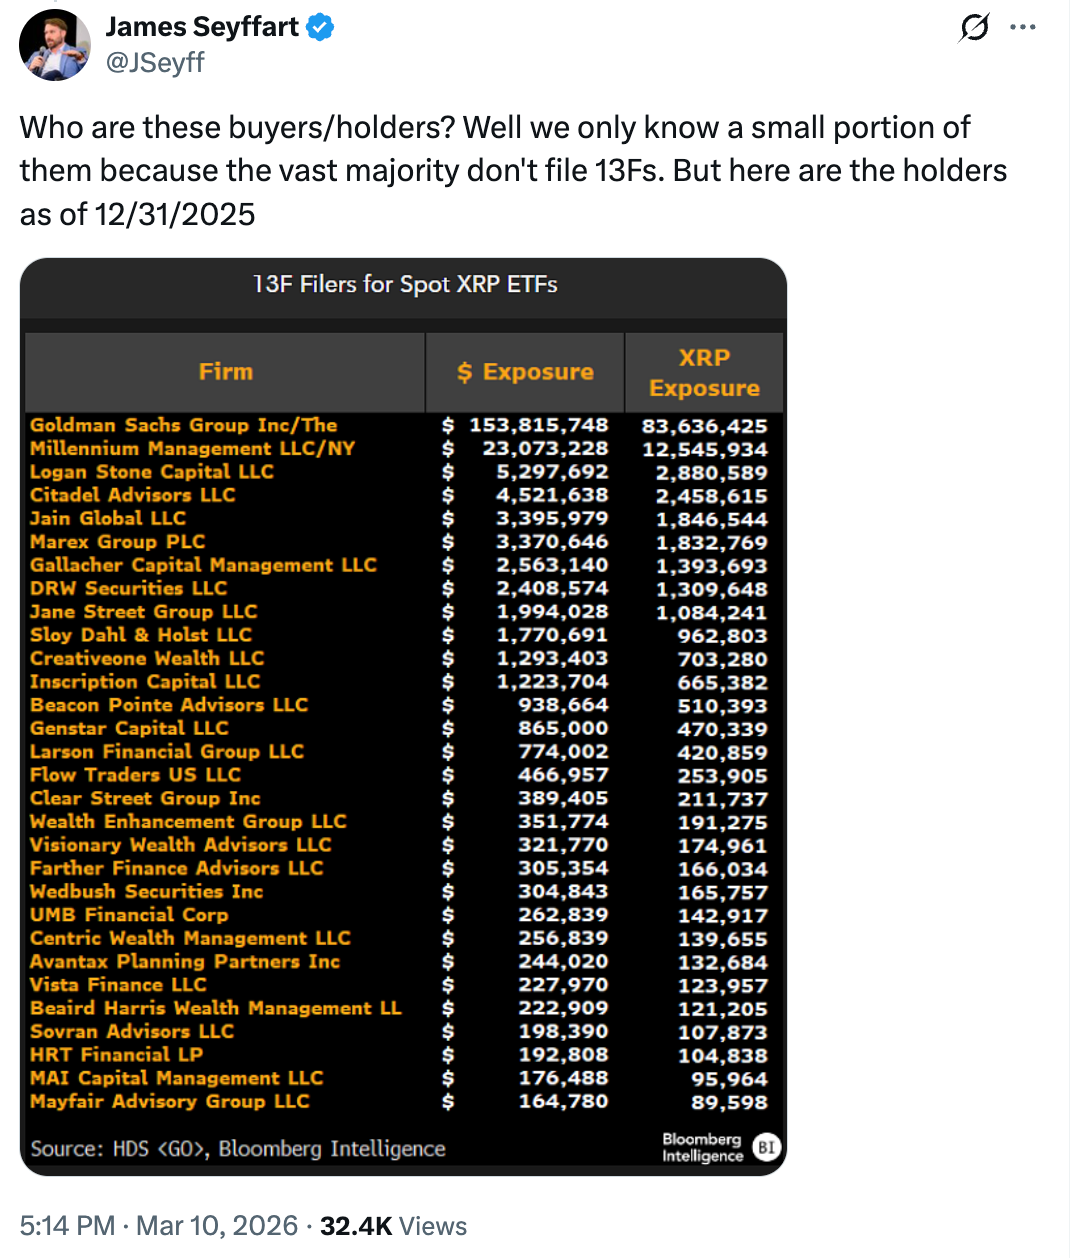
Since their launch in November 2025, XRP (XRP)-linked ETFs have attracted more than $1.4 billion in cumulative net inflows, according to data highlighted by Bloomberg analyst James Seyffart, even as XRP has dropped roughly 33% over the past 90 days and 24% year-to-date to around $1.38. JPMorgan, meanwhile, reports that gold ETFs have suffered close to $11 billion in outflows over a three‑week stretch leading into March, with silver products seeing similarly heavy withdrawals as rising interest rates and a stronger dollar undercut the traditional safe havens.
In a recent note on ETF flows, Nikolaos Panigirtzoglou, managing director at JPMorgan, said Bitcoin spot funds “have attracted approximately 1.5% in new assets” since the latest Middle East flare‑up began, while the largest gold ETF, SPDR Gold Shares (GLD), “has experienced outflows totaling about 2.7% of its assets under management.” He argued this divergence “represents a significant departure from historical patterns where investors typically flock to gold during geopolitical uncertainty,” suggesting that BTC is increasingly viewed as “a viable alternative to traditional safe‑haven assets.” According to CoinDesk, Bitcoin briefly fell into the $60,000 range alongside other risk assets at the onset of the conflict but quickly stabilized and is now trading between $68,000 and $70,000, a range JPMorgan reads as evidence that “long‑term capital is re‑entering the market to support prices after the panic.”
For XRP, the contrast between price action and ETF demand has become increasingly stark. Data compiled by SoSoValue and cited by Seyffart show cumulative XRP ETF inflows climbing from roughly $150 million in mid‑November to about $1.44 billion by early March, even as the token slid from recent peaks toward the low‑$1.30s. Bloomberg senior ETF analyst Eric Balchunas called the performance “really impressive given these launched into a brutal 45% drawdown,” adding that such consistent buying is rare for newly listed products trading through a “reverse shiny object moment.” “My guess is this is largely XRP super fans vs casual retail,” Balchunas wrote, pointing to concentrated conviction rather than broad speculative froth.
Ripple CEO Brad Garlinghouse has framed the flows as a structural shift in how investors access the token, saying the ETFs are “a sign of XRP’s long‑term payments potential” after the company’s courtroom win against the U.S. Securities and Exchange Commission unlocked the path for regulated products. According to a previous crypto.news story, spot XRP ETFs neared $1 billion in assets after just 13 days of consecutive inflows, following patterns seen after the approval of U.S. spot Bitcoin ETFs. That momentum has since pushed cumulative net inflows to around $1.4 billion, with February alone contributing between $58 million and $106.8 million depending on the dataset, even as the broader crypto complex cooled.
JPMorgan’s latest work on cross‑asset positioning suggests that institutional traders have been steadily cutting exposure to gold and silver while leaving Bitcoin allocations broadly intact. The bank notes that positions in precious‑metal futures have “significantly declined since the beginning of the year,” with trend‑following funds flipping from “overbought” to “below neutral,” which has “exacerbated their downward pressure” as ETF outflows accelerated. Bitcoin, by comparison, has moved out of an “oversold” momentum regime, and selling pressure has eased as ETF demand stabilized, helping support the $68,000–$70,000 trading band.
Liquidity indicators in JPMorgan’s framework now show market breadth in gold slipping below that of Bitcoin, while silver liquidity has weakened even further, a reversal of the typical hierarchy in traditional macro stress episodes. The bank argues that this shift “highlights Bitcoin’s gradually emerging performance characteristics that differ from traditional safe‑haven assets in the current macro and geopolitical environment,” with deeper ETF markets and institutional participation helping compress volatility relative to earlier cycles.
XRP’s ETF complex, though far smaller in absolute terms, appears to be tracking a similar institutionalization arc. By mid‑March, total net assets across XRP ETFs sat just under $1 billion, representing roughly 1.16% of the token’s market capitalization, while some estimates suggest custodians are removing close to 1% of circulating supply from exchanges each month to back new creations. An earlier crypto.news story on XRP ETFs noted that 13 straight days of inflows pulled nearly $900 million into the products within weeks of launch, underscoring how quickly regulated wrappers can tighten free‑float supply once they catch on with allocators.
For JPMorgan, the ETF flow divergence sits atop a macro mix that still looks hostile to precious metals. The bank points to rising real yields and a firmer dollar as key reasons why gold and silver have struggled to hold recent highs, even as geopolitical risk flared. CoinMarketCap data cited in the note show gold correcting from a record peak while SPDR Gold Shares shed about 2.7% of its assets over the crisis window, against positive net inflows for BlackRock’s iShares Bitcoin Trust of roughly 1.5% of AUM. In aggregate, gold ETFs have lost nearly $11 billion over three weeks, JPMorgan estimates, with silver funds recording “significant” redemptions as well.
Bitcoin’s ability to stabilize after an initial risk‑off impulse, and to keep pulling capital into ETFs, has led JPMorgan to reiterate its long‑term price target of $266,000, derived from a volatility‑adjusted comparison to gold’s market structure. While XRP lacks that kind of formal target, the resilience of its ETF flows relative to price has drawn similar interpretations from market participants who see regulated products as a bridge for institutional money. In previous crypto.news coverage, analysts noted that XRP’s ETF trajectory and the post‑SEC‑case regulatory clarity could help the token close its underperformance gap versus peers if macro headwinds ease and capital rotates back into higher‑beta assets.
Amid ETF outflows from gold and silver, deteriorating liquidity in those markets, and continued institutional deleveraging, JPMorgan’s takeaway is blunt: Bitcoin is holding up better than traditional safe havens, and regulated crypto wrappers are no longer a sideshow. For XRP, the early data suggest that even in a choppy tape, a committed ETF bid can quietly rewire the supply‑demand balance — and position the token as one of the key beneficiaries if risk appetite returns.
XRP (XRP) traded at $1.37 after a 3.5% decline in the last 24 hours, shrugging off Goldman Sachs’ disclosure of exposure to spot XRP exchange-traded funds (ETFs).
While this highlights long-term institutional confidence, it comes amid fragile risk sentiment and a typical breakdown from a bearish setup.
Key takeaways:
-
Goldman Sachs disclosed $152.17 million in spot XRP ETF holdings across four funds, making it the largest institutional holder in this segment.
-
XRP maintains its bear pennant breakdown setup targeting $0.72.
Goldman Sachs discloses $152 million exposure to XRP ETFs
Goldman Sachs has emerged as the largest disclosed institutional holder of US spot XRP ETFs, revealing a $152 million position in its Q4 2025 13F filing with the SEC.
Related: XRP treasury Evernorth files with SEC to list shares on Nasdaq
The $3.5 trillion asset manager has spread its exposure across four funds: $39.8 million in Bitwise XRP ETF, $38.5 million in Franklin XRP Trust, $38 million in Grayscale XRP ETF, and $35.9 million in 21Shares XRP ETF.
Goldman isn’t alone. Its allocation accounts for roughly 73% of the about $211 million held by the top 30 institutional investors in XRP ETFs, according to Bloomberg Senior ETF analyst James Seyffart.

While this institutional move highlights long-term confidence, XRP price remains 25% below its yearly open around $1.84, driven by slowing ETF inflows and macro headwinds.
Cumulative net inflows into US-based XRP ETFs crossed the $1 billion mark within the first few months of trading, peaking at $1.28 billion on Jan. 16. The pace has since cooled to $1.21 billion today.
Total assets under management peaked around $1.65 billion in early January but have dropped to roughly $995 billion, dragged down by XRP’s price decline and a stretch of net outflows, according to data from SoSoValue.
XRP ETFs recorded a total of $56.5 million in net outflows between March 3 and March 16. Since then, the daily inflows have been muted below $5 million.

XRP bear pennant breakdown underway
XRP price broke down from its prevailing bear pennant when it dropped below the lower trend line of the pattern at $1.40 on Thursday. The price could retest the lower trend line as new resistance, a move that could confirm the breakdown.

Bull pennants form when price consolidates inside a triangle following a steep decline. Once the price breaks below that triangle, it triggers another massive downward move.
For XRP, the measured target of the bear pennant is $0.72, roughly 48% below the current price.
As Cointelegraph reported, a break below $1.27 would suggest that the bears are still in control, fueling XRP/USD drop toward $1.
Declining XRP volatility hints at “sharp” price move next
XRP’s volatility metrics are warning of an imminent massive price move.
The 30-day Realized Volatility (RV 30D) has dropped to around 0.5266, marking the lowest level for 2026.
Meanwhile, the Volatility Z-Score is at -0.9048, “reflecting a clear decline in volatility compared to the historical average,” CryptoQuant analyst Arab Chain said in a recent Quicktake note, adding:
“This type of volatility contraction is commonly referred to as volatility compression, a phase that often precedes a sharp price movement in either direction.”

This article does not contain investment advice or recommendations. Every investment and trading move involves risk, and readers should conduct their own research when making a decision. While we strive to provide accurate and timely information, Cointelegraph does not guarantee the accuracy, completeness, or reliability of any information in this article. This article may contain forward-looking statements that are subject to risks and uncertainties. Cointelegraph will not be liable for any loss or damage arising from your reliance on this information.
Euro-denominated stablecoins make up more than 80% of the non-US dollar stablecoin market, which Dune says has grown to about $1.2 billion in total supply, according to a report commissioned by Visa.
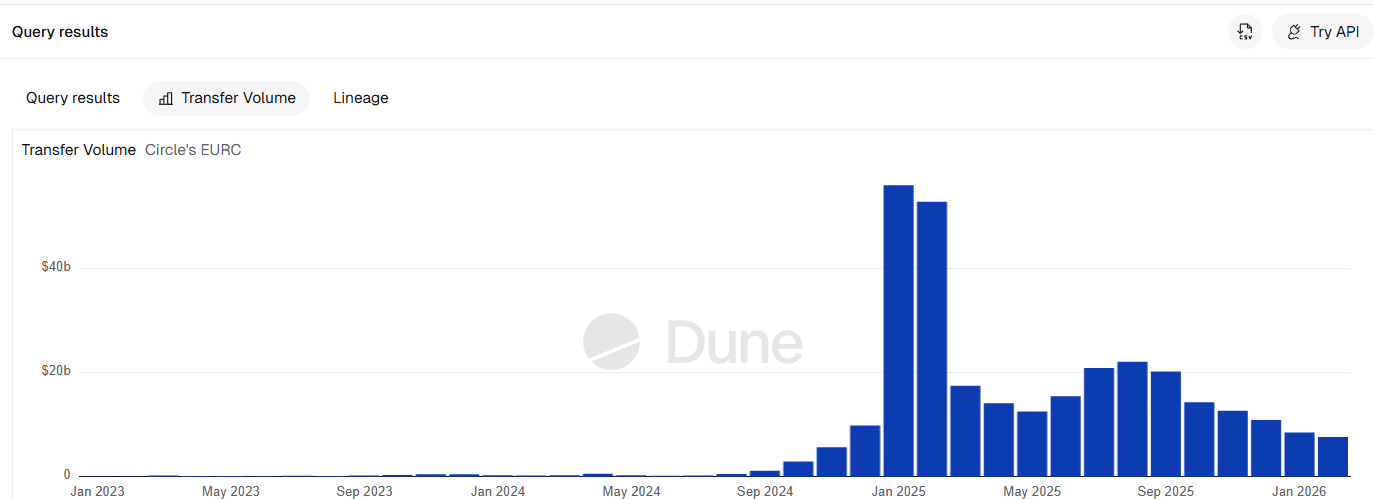
Dune said euro stablecoins accounted for 85% of transfer volume in the non-US dollar stablecoin market, with Circle’s EURC (EURC) emerging as the dominant euro token in the segment.
The report pointed to growing euro stablecoin use across payment infrastructure, while Visa and Mastercard have separately expanded settlement support for EURC in parts of their networks.
Dune said the non-US dollar stablecoin market now handles about $10 billion in monthly transfer volume, reflecting a sharp increase in usage over the past three years.
Even so, euro stablecoins remain a tiny part of the broader stablecoin sector, which now totals about $300 billion to $316 billion, while the euro still accounts for about 20% of global foreign exchange reserves, according to DefiLlama data.

MiCA helps push euro stablecoins forward
The research signals that European businesses operating in euros are “turning to stablecoins,” driven by the regulatory clarity in the Eurozone, Nic Puckrin, CEO and co-founder of educational platform Coin Bureau, told Cointelegraph.
“EURC is a natural choice because it’s issued by Circle, an established entity that has already won trust with its USDC product,” he added.
EURC’s total supply surpassed $506 million on Feb. 27, according to the report. Excluding EURC, 80% of euro-stablecoin activity was related to payments, remittances, payroll and treasury flows.

Puckrin said that the main driver of the growing stablecoin usage across the EU is the regulatory clarity provided by the Markets in Crypto-Assets Regulation (MiCA), which went into effect for crypto asset service providers on Dec. 30, 2024.
He added that delays around the digital euro could leave private stablecoin issuers with more room to fill parts of Europe’s digital payments gap.
Related: Circle’s policy chief tells UK to merge MiCA clarity with US stablecoin rules
Circle has also been pitching EURC and USDC (USDC) as tools for around-the-clock euro-dollar foreign exchange flows through its StableFX infrastructure, offering institutions a way to move between currencies outside traditional banking hours.
Still, broader adoption will depend on whether payment providers, treasury teams and licensed financial companies get enough compliant infrastructure to use euro stablecoins at scale, Mouloukou Sanoh, co-founder and CEO of cross-border liquidity platform Mansa, told Cointelegraph.
“The companies winning are the ones solving for licensed payment operators, not building generic L1s or other platforms, but infrastructure that lets a head of treasury at a payment service provider or electronic money institution move money in real time without prefunding, compliance friction or operational chaos,” he said.
Magazine: Crypto wanted to overthrow banks, now it’s becoming them in stablecoin fight

Bernstein has called a Bitcoin bottom and set a $450 price target on Strategy stock, 226% above Monday’s closing price of $138.20. The call comes from analyst Gautam Chhugani at a firm managing nearly $880 billion in assets, which means this is not a retail sentiment spike. It is institutional research drawing a line in the sand on the BTC-equity trade.
- Bitcoin Bottom Call: Bernstein’s Gautam Chhugani identifies the current drawdown — 44% from Bitcoin’s $126,210 all-time high — as a cycle bottom supported by ETF inflows and corporate treasury buying.
- Strategy Upside Target: Bernstein sets a $450 price target on Strategy stock, implying 226% upside from $138.20, backed by $56 billion in Bitcoin and cash against $18 billion in total debt.
- Institutional Signal: Bitcoin ETFs absorbed $2.2 billion in net inflows over four weeks, flipping year-to-date flows positive; FMR, BlackRock, Capital Group, and VanEck now hold 23% of Strategy’s STRC preferred shares.
Discover: The best crypto presales gaining institutional momentum right now
Bernstein Bitcoin Bottom Case: What the Data Shows
Bitcoin peaked at $126,210 on October 6, 2025. A flash crash on October 10, triggered by leveraged liquidations, initiated the correction, compounded by late February 2026 U.S.-Israeli strikes on Iran, and Bitcoin still held a floor near $71,000.
Chhugani frames the 44% drawdown as evidence of maturation, not breakdown: institutional demand absorbed the selling pressure that, in prior cycles, would have driven 70–80% wipeouts.
— BSCN (@BSCNews) March 26, 2026
 BERNSTEIN: MARKET MISREADING CLARITY ACT
Circle shares plunged nearly 21% over the last five days, dragging down broader crypto stocks.
The drop followed investor fears around a proposed ban on stablecoin yield. The concern stems from new language in the Clarity Act bill.… pic.twitter.com/qXkglh9Gi5
The ETF data reinforces the case. Bitcoin ETFs recorded $2.2 billion in net inflows over the four weeks preceding Bernstein’s note, reversing year-to-date outflows and pushing the net 2026 figure to positive $364 million against a $90 billion asset base.
ETFs now hold 6.1% of the total Bitcoin supply. That is a structural bid, not a momentum trade, and it is exactly the kind of price floor institutional demand analysis has pointed toward throughout this correction cycle.
Bernstein’s year-end Bitcoin target is $150,000, contingent on sustained institutional buying through mid-2026 amid geopolitical headwinds. The bottom call is not a chart pattern. It is a capital flows argument.
Discover: The best crypto to diversify your portfolio with
Strategy’s Bitcoin Treasury: The Math Behind 226% Upside
Strategy holds 762,099 BTC, acquired most recently with a 1,031 BTC purchase last week, valued at approximately $51.43 billion.

Total balance sheet Bitcoin and cash stands at $56 billion against $18 billion in total debt, per Bernstein. Cash reserves alone cover annual dividend and interest obligations for 25 months. The Bitcoin position covers annual financing costs for approximately 50 years.
The leverage mechanism is straightforward: Strategy stock amplifies Bitcoin moves because each share represents a claim on a BTC treasury that grows as the company raises capital and buys more coin.
At $138.20, Bernstein’s $450 target prices in a Bitcoin recovery toward the $150,000 level while assigning value to the capital-raising machine itself — the $42 billion raise split between Class A common stock and perpetual preferred shares, with $6.24 billion in ATM program capacity still available across a 19-agent sales syndicate.
The STRC preferred share launched in July 2025, paying an 11.5% annual dividend monthly. Thirty-day average daily STRC volume hit $220 million, up 65% over three months, making it the most liquid preferred product in its category. Strategy is down 57% over six months and 59% over twelve months, reflecting dilution concerns from ongoing equity raises.
The stock has recovered 10.9% over the past month. Bernstein is betting the dilution discount is already priced in.
Discover: The best crypto presales gaining institutional momentum right now
The post Bernstein Calls Bitcoin Bottom and Sets 226% Upside Target for Strategy appeared first on Cryptonews.


Tether crypto has engaged an unnamed Big Four accounting firm for a comprehensive financial statement audit of USDT, announced March 24, 2026.
The stablecoin now carries a $184 billion market cap and supports more than 550 million users worldwide, making this the largest-scope inaugural audit in digital asset history.
This is not an incremental compliance step. It is a structural reclassification of how Tether’s reserves are verified.
- Audit Scope: The Big Four engagement covers a full financial statement opinion across digital assets, traditional reserves, and tokenized liabilities — replacing point-in-time attestations from BDO Italia used since 2021.
- Scale: USDT’s $184 billion market cap and 550 million global users make this the largest inaugural Big Four audit ever conducted on a stablecoin.
- Selection Process: CFO Simon McWilliams confirms the firm was chosen through a competitive process, with Tether asserting it already meets Big Four operational standards ahead of engagement.
Discover: The best crypto presales gaining institutional momentum right now
The Mechanics: Attestation vs. Full Financial Audit
Tether’s prior arrangement with BDO Italia produced quarterly attestations, agreed-upon procedures that confirmed asset existence at a specific point in time.
They did not constitute an audit opinion on whether financial statements fairly present Tether’s overall position. That distinction matters enormously to institutional counterparties and regulators.
A full Big Four audit requires the firm to independently examine Tether’s complete reserve structure: U.S. Treasuries, cash equivalents, commercial paper holdings, digital asset positions, and tokenized liabilities.
The auditor issues a formal opinion on whether those financials are presented fairly in accordance with recognized accounting standards. The scope here is wider than any prior stablecoin audit on record.
CEO Paolo Ardoino states: “This audit represents years of work to strengthen our systems so that Tether can meet the highest standards applied in global finance.” CFO Simon McWilliams adds that the firm “was selected through a competitive process because the organisation is already operating at Big Four audit standard.” The firm’s identity has not been disclosed. One of Deloitte, EY, KPMG, or PwC is now inside Tether’s books.
Discover: The best crypto to diversify your portfolio with
The Strategic Signal: Why This Changes Tether Crypto Institutional Profile
Tether has operated under institutional skepticism for five years. A $41 million CFTC fine in October 2021 followed misleading claims about full USD backing.
An $18.5 million settlement with the New York Attorney General in February 2021 centered on reserve transparency failures. Both actions left a credibility gap that quarterly attestations never fully closed.
The Big Four engagement closes that gap structurally, not rhetorically. Dr. Anya Petrova of the Global Digital Finance Institute calls it “the gold standard of financial credibility,” adding it “could significantly lower the perceived risk premium for institutions interacting with the USDT ecosystem.” That risk premium has been the primary barrier to sovereign, pension, and prime brokerage exposure to USDT-denominated instruments.
The timing aligns with a broader regulatory tightening across digital assets. The CFTC’s Innovation Task Force is actively restructuring oversight frameworks for crypto derivatives — and stablecoin reserve transparency is a core compliance variable in that architecture. Tether’s audit positions USDT ahead of any reserve disclosure mandate, rather than behind it.
That is a deliberate strategic posture, not a coincidence. As the Ripple RLUSD pilot with MAS demonstrates, institutional-grade stablecoins now compete on compliance infrastructure as much as liquidity depth.
Discover: The best crypto presales gaining institutional momentum right now
The post Tether Crypto Secures Big Four Auditor for Full USDT Transparency Review appeared first on Cryptonews.

Key Highlights
- Best Buy (BBY) shares climbed 5.3% amid rumors of a potential GameStop (GME) acquisition
- GameStop’s CEO Ryan Cohen announced in January his pursuit of a “very, very, very big” consumer company acquisition
- GameStop’s recent 10-K revealed approximately $0.7 billion pledged as collateral for derivative transactions
- Gordon Haskett’s Don Bilson identified “prime broker action” in BBY during Q4 while questioning the timeline alignment
- GameStop (GME) shares declined 2.3% during the same trading session; the company has remained silent on inquiries
Shares of Best Buy (BBY) experienced a notable 5.3% climb on Wednesday following widespread speculation that GameStop (GME) may be positioning itself to acquire the electronics retail giant.
The acquisition chatter traces back to remarks from GameStop Chairman and CEO Ryan Cohen during late January, where he expressed his ambition to execute a “very, very, very big” acquisition of a substantial consumer-focused company — characterizing it as a potentially transformational move for GameStop.
The speculation intensified following GameStop’s most recent 10-K filing, which revealed the company “posted approximately $0.7 billion of cash into an account that is pledged as collateral for certain existing and potential cash or physically settled derivative transactions.”
According to Gordon Haskett analyst Don Bilson, evidence suggests GameStop has established a swap position and appears to be evaluating potential acquisition candidates. However, he refrained from identifying a specific target company.
Bilson had earlier mentioned Best Buy as a plausible candidate, citing prime broker movements in BBY throughout the fourth quarter. Nevertheless, he acknowledged a potential timing discrepancy — the observed activity doesn’t perfectly align with GameStop’s disclosure indicating capital deployment occurred after its fiscal year conclusion.
Despite these uncertainties, market participants reacted enthusiastically, driving BBY shares significantly higher.
GameStop has not issued any response to media inquiries regarding the speculation. The company’s stock declined 2.3% during the same trading period.
Best Buy’s Current Financial Standing
Best Buy maintains a market capitalization of approximately $13.58 billion. Trailing twelve-month revenue reaches $41.69 billion, although the retailer’s 3-year revenue growth rate registers at -1.4%.
Profit margins remain modest, with operating margins at 4.2% and net margins at 2.56% — both showing declining trends in recent periods. Insider activity has leaned toward selling, with six transactions totaling 77,247 shares executed over the previous three months.
From a valuation perspective, however, the metrics present a more compelling narrative. Best Buy’s price-to-earnings ratio of 12.89 hovers near its 3-year minimum. Similarly, the P/S ratio of 0.34 and P/B ratio of 4.58 are approaching historical lows, suggesting potential undervaluation.
The relative strength index currently stands at 37.79, approaching oversold conditions.
Underlying Financial Resilience
Notwithstanding revenue challenges, Best Buy demonstrates robust financial health indicators. The company’s Altman Z-Score of 4.13 and Piotroski F-Score of 7 both signal strong balance sheet fundamentals.
Wall Street analysts have established an average price target of $73.32, accompanied by a recommendation score of 2.7 — reflecting measured optimism.
Best Buy maintains operations across approximately 1,068 retail locations through its Domestic and International divisions, spanning computing, mobile devices, appliances, consumer electronics, entertainment products, and related services.
The stock’s beta coefficient of 1.69 indicates heightened sensitivity to broader market movements — a relevant consideration given Wednesday’s rapid response to acquisition speculation.
GameStop has not publicly confirmed any specific acquisition target, and no formal proposal or regulatory filing has been disclosed to date.


Opinion by: Abdul Rafay Gadit, co-founder at Zignaly and ZIGChain
Digital asset treasury companies (DATCOs) are facing a classification problem that the market can no longer ignore.
DATCOs were built to hold crypto. Increasingly, they’re being forced to decide whether they want to own assets or operate the systems those assets run on.
Index providers are now openly debating whether these businesses still resemble operating companies or whether they function more like investment vehicles.
Recently, we saw MSCI’s note that it would keep “digital asset treasury companies” in its indexes for now, while launching a broader consultation on how they should be classified going forward.
That hesitation reflects a deeper uncertainty about what these companies have become. The model that once defined these companies’ passive balance sheet exposure to Bitcoin is already starting to fracture.
The cost of moving beyond simplicity
What’s emerging in its place is not a cleaner or safer evolution, but a materially riskier one.
The industry has rebranded this shift as “active treasury management,” a phrase that understates the risks being introduced and obscures what is actually changing. In practice, it means moving beyond passive exposure into operational strategies that introduce new layers of risk, leverage and governance complexity.
Once DATCOs cross that threshold, they are no longer just holders of digital assets. That means we need to have regulators, index providers and investors treat them accordingly, as ultimately, operators are judged by execution, not conviction.
The first phase of DATCOs was straightforward: Hold Bitcoin, communicate long-term conviction and allow balance sheet exposure to do the rest. That simplicity mattered to boards, auditors and index providers, and it kept outcomes tied to broader macro forces rather than execution risk.
The second phase is fundamentally different. As competition increases and simple exposure becomes less compelling, treasury companies are being pushed to manufacture yield. Various reports in 2026 have indicated that a growing number of crypto treasury companies are expanding beyond Bitcoin (BTC) and Ether (ETH) into more volatile tokens to boost returns. That strategy may improve short-term performance optics, but it steepens tail risk dramatically. In stressed conditions, these positions are more likely to unwind quickly and in a correlated fashion precisely when liquidity is most fragile.
Exposure becomes responsibility
There’s a quiet shift happening in how institutions engage with blockchain. Instead of treating networks purely as assets to hold, some are beginning to participate at the infrastructure layer by running validator nodes, adding to network security and taking part in governance.
Any yield that comes from this is incidental; the primary focus is on reliability, control and active involvement in systems that now support real economic activity.
Any yield that comes from this is incidental; the primary focus is on reliability, control and active involvement in systems that now support real economic activity. This represents a fundamental change in what these companies actually do.
Validator operations introduce protocol level obligations that boards cannot treat as ancillary. Slashing risk, uptime guarantees, key management, client concentration and governance participation are not abstract technical issues. These are core business risks, exposing companies to forms of liability and reputational damage that passive asset holding never created.
At that point, a DATCO is no longer merely exposed to market volatility. It is exposed to operational failure, governance decisions and protocol level outcomes. That leaves only two coherent identities: an operating company with formal controls, or a fund with explicit fiduciary obligations. The real danger lies in occupying the space between the two.
Related: Digital asset treasuries that only hodl may fall short
Active treasury strategies blur the line between corporate finance and delegated investment management. When companies pursue yield through staking, token rotation or infrastructure participation, they are making discretionary allocation decisions on behalf of shareholders. Those decisions carry risk profiles that look far closer to fund management than to treasury stewardship.
No governance, no right to be active
If DATCOs want to avoid being treated as unregulated investment vehicles, they need to adopt fund-grade guardrails. That means clear disclosures around strategy and risk. It means segregation of duties between custody, execution and risk oversight.
It means independent controls, audit-ready reporting and stress testing that models correlated drawdowns and protocol-level failures, not just price volatility.
Most importantly, it means boards formally recognizing protocol exposure and governance influence as core risks, not experimental upside.
Without those safeguards, “active treasury” becomes a euphemism for leverage without accountability.
This shift also exposes a second gap: infrastructure. Combining tokenized assets, staking income and compliance obligations inside a single mandate is not something legacy systems were designed to handle. Nor can it be safely managed through ad hoc wallets, spreadsheets or loosely governed smart contracts.
Institutional onchain rails will need to support delegated execution, policy driven controls and auditable workflows if DATCOs are going to operate at scale without amplifying systemic risk. That infrastructure must treat operational risk with the same seriousness as market risk because in active treasury models, the two are inseparable.
The consultation underway at MSCI should not be viewed as a threat to the sector. It is a signal that the easy phase is over. As DATCOs evolve into active operators from passive holders, the market will demand clarity about what these companies are and what risks they are taking.
Those that chase yield without guardrails may discover that classification was the least of their problems, because by the time the market reacts, the risks will already be embedded.
Opinion by: Abdul Rafay Gadit, co-Founder at Zignaly and ZIGChain.
This opinion article presents the author’s expert view, and it may not reflect the views of Cointelegraph.com. This content has undergone editorial review to ensure clarity and relevance. Cointelegraph remains committed to transparent reporting and upholding the highest standards of journalism. Readers are encouraged to conduct their own research before taking any actions related to the company.

As competition in the cryptocurrency space continues to grow, more blockchain and Web3 projects are turning to specialist PR agencies to get their announcements in front of the right audiences. Kooc Media, a crypto PR agency founded in 2017, has positioned itself as a direct solution for projects that need guaranteed media placements without the delays and unpredictability of traditional PR.
The agency operates differently from most PR firms. Rather than relying solely on pitching third-party journalists, Kooc Media owns and runs its own portfolio of established news publications, giving clients immediate access to real editorial placements on sites with built-up traffic and domain authority.
“Crypto doesn’t wait for anyone,” said Michelle De Gouveia, spokesperson for Kooc Media. “If you’ve just closed a funding round or you’re about to list a token, you need that press coverage live now, not in two weeks after a journalist decides whether they’re interested.”
A PR Model Designed Around Crypto’s Pace
Traditional PR works on a pitch-and-hope basis. An agency writes a press release, sends it to a list of reporters, and waits to see who picks it up. For industries that move on slower timescales, this can work fine. For crypto, where a token can launch, spike and settle within a matter of days, it creates a problem.
Kooc Media was built to remove that bottleneck. The agency owns and operates several well-known online publications including Blockonomi, CoinCentral, MoneyCheck, Parameter, Beanstalk and Computing. Clients can view the full list of brands on the agency’s sites page.

Because these are in-house publications, there is no pitch process and no editorial gatekeeping to navigate. When a client books a PR package, their article gets published. It’s a straightforward transaction with a clear outcome, which is exactly what most crypto teams are looking for.
Same-Day Publishing Across Multiple Sites
Speed is one of the main reasons crypto projects choose Kooc Media over other PR options. The agency offers same-day distribution, meaning a press release submitted in the morning can be live on multiple websites by the afternoon.
This matters for time-sensitive announcements like exchange listings, mainnet launches, strategic partnerships and presale openings. In each of these cases, the window for maximum impact is short. Having coverage appear within hours rather than days can make a meaningful difference to how much attention an announcement receives.
Beyond its own network, Kooc Media also distributes press releases through a wide partner network of finance, technology and crypto news sites. Clients who select higher-tier packages can also access major newswire distribution, with placements appearing on outlets including Business Insider, Bloomberg, Benzinga, MarketWatch, USA Today and Dow Jones-connected feeds.
Who Works With Kooc Media
The agency’s client base spans the full range of the crypto industry. This includes new token projects preparing for their first public launch, established blockchain companies announcing product updates, DeFi protocols seeking broader recognition, NFT and gaming platforms building mainstream awareness, and Web3 infrastructure companies raising venture capital.
Kooc Media also serves fintech companies that operate at the crossover between traditional finance and blockchain. As institutional interest in digital assets has increased, press coverage that reaches both crypto-native audiences and mainstream financial readers has become more valuable than ever.
“There’s a big difference between being covered on a crypto blog and being covered on a financial news network,” said De Gouveia. “Both have their place, but when a project shows up on both, it sends a much stronger signal to investors and partners.”
Crypto-specific PR packages and pricing are available at kooc.co.uk/crypto-pr/.
Full-Service PR Without the Overhead
Many crypto startups operate with small teams. They may have strong developers and a clear product vision but no dedicated marketing or communications staff. Hiring a full-time PR manager or building a media outreach strategy from scratch isn’t realistic when a project is focused on shipping code and hitting launch deadlines.
Kooc Media addresses this by offering managed PR creation. The agency’s in-house editorial team writes the press release, handles the formatting, and takes care of publishing and distribution. The client provides the key details about their announcement, and Kooc Media handles the rest.

This means a project with no existing press presence can go from zero coverage to being featured across multiple high-authority publications in a single day. There are no long onboarding processes, no retainer agreements and no minimum commitment periods.
Transparent Reporting and Verifiable Results
Every Kooc Media PR campaign comes with full reporting. After distribution is complete, clients receive a list of live URLs showing exactly where their press release has been published. Each link is clickable and verifiable, so there is no ambiguity about what was delivered.
The agency also provides information on the domain authority of each publication where the article appears. This is particularly relevant for projects that care about SEO, since backlinks from high-authority news websites contribute directly to higher search engine rankings.
For crypto projects, this dual benefit of credibility and search visibility makes PR a practical investment rather than just a branding exercise. A single well-distributed press release can improve a project’s Google rankings while also giving them something concrete to share with potential investors and community members.
Why Crypto PR Has Become Standard Practice
The days when a crypto project could gain traction purely through Discord communities and Twitter threads are fading. As the industry has matured, so have the expectations of investors, users and regulators. Press coverage on recognised publications now functions as a basic credibility signal that most serious projects are expected to have.
At the same time, the sheer number of projects launching every month means that standing out requires more than a good whitepaper. Visibility matters, and earned or placed media coverage remains one of the most effective ways to achieve it.
Kooc Media’s combination of owned media, partner distribution and newswire access gives crypto projects a clear path to that visibility without the guesswork that comes with traditional agency models.
iGaming and Gambling PR
In addition to its crypto and fintech services, Kooc Media runs dedicated PR packages for the iGaming industry, including online casinos, sportsbooks and gambling technology providers. Details on these services are available at kooc.co.uk/gambling-pr/.
About Kooc Media
Kooc Media is a specialist PR distribution agency covering the crypto, fintech, technology and iGaming sectors. The agency operates its own network of news publications and distributes through a broad partner network, offering guaranteed placements with same-day turnaround. Since 2017, the company has provided press coverage for hundreds of projects across the blockchain and financial technology space.
Kooc Media’s Crypto PR packages are available now through the company’s website at https://kooc.co.uk.

WhiteBIT, the largest European crypto exchange by traffic, has introduced two automated trading solutions – Spot Grid Bot and Martingale (DCA) Bot – designed to give retail traders greater control, flexibility, and capital efficiency when navigating volatile and trending crypto markets.
Designed primarily for retail traders, the tools focus on automation that allows users to adjust strategy, manage risk, and intervene when market conditions change.
While grid and dollar-cost averaging (DCA) tools are widely available on the market, WhiteBIT’s approach focuses on improving how these strategies are executed in practice. The new tools offer live strategy editing, adaptive AI parameter recommendations, and multiple reinvestment models, allowing users to adjust their approach without fully restarting trading cycles.
The launch expands WhiteBIT’s spot automation offering, prioritizing practical differentiation over introducing entirely new strategy types.
Key Differentiators
WhiteBIT’s implementation introduces several improvements to standard automation tools :
- Mid-cycle bot editing – users can adjust core parameters without fully exiting the strategy
- Multiple reinvestment modes – profits can be withdrawn, compounded, or converted into asset accumulation (HOLD logic)
- Manual averaging in DCA – allowing traders to intervene strategically when markets move deeper than expected
These features address a most common limitation among automated trading: inability to adapt once a bot is deployed.
Spot Grid Bot: AI-assisted volatility strategy
The bot uses an adaptive AI system that analyzes historical price data and volatility patterns to recommend optimized trading ranges. Instead of relying on static presets, the system applies machine learning methods to forecast probable price behavior and suggest safer grid boundaries.Users can preview performance through a historical replay backtesting model, designed to provide realistic yield expectations.
A core differentiator is ability to adjust strategies in real time. Traders can:
- Expand grid levels
- Adjust spacing
- Add capital
- Modify risk exposure
This allows users to respond to breakouts or shifting volatility without restarting the bot — a common limitation among existing solutions.
Martingale (DCA) Bot: Directional cycle-based automation
The Martingale (DCA) Bot is designed for traders anticipating directional market movement, particularly in bullish conditions.Unlike traditional accumulation-focused DCA strategies, WhiteBIT’s approach:
- Uses increasing order sizing during averaging
- Closes positions by cycle
- Allows profit reinvestment or asset accumulation
- Supports manual averaging intervention
This structure allows traders to manage drawdowns more efficiently, adapt safety orders, and scale capital allocation.
A notable differentiator is the ability to manually average positions if the bot becomes inactive between safety orders.
Automated trading tools have become standard across exchanges, and WhiteBIT focuses on improving flexibility, transparency, and capital management within established grid and DCA strategies rather than introducing new strategy models.

Nvidia Faces Class Action Over Crypto Mining Revenue Disclosure Gaps

These Clit Suction Toys Could Solve The Orgasm Gap

Michigan State hockey vs. UConn: Score updates, highlights and more


![BITCOIN... I AM TAKING ACTION RIGHT NOW [Exact trade....]](https://wordupnews.com/wp-content/uploads/2026/03/1774544463_maxresdefault-80x80.jpg)


-
 Crypto World6 days ago
NIO (NIO) Stock Plunges 6.5% as Shelf Registration Sparks Dilution Worries
-

 Fashion6 days ago
Weekend Open Thread: Adidas – Corporette.com
-
 NewsBeat1 day ago
Manchester United reach agreement with Casemiro over contract clause amid transfer speculation
-

 Politics6 days ago
Jenni Murray, Long-Serving Woman’s Hour Presenter, Dies Aged 75
-

 Crypto World5 days ago
Best Crypto to Buy Now: Strategy Just Spent $1.57 Billion on Bitcoin During Fear While Early Investors Quietly Enter Pepeto for 150x Potential
-

 Crypto World5 days ago
Bitcoin Price News: Bhutan Sells $72 Million in BTC Under Fiscal Pressure, but the Smart Money Entering Pepeto Sees What the Market Does Not
-

 Tech7 days ago
inKONBINI Lets You Spend Summer Days Behind the Register
-

 News Videos15 hours ago
Parliament publishes latest register of MPs’ financial interests
-

 Sports3 days ago
Remo Stars and Kano Pillars Strengthen Survival Hopes in NPFL
-

 Politics7 days ago
Gender equality discussions at UN face pushbacks and US resistance
-

 Business4 days ago
No Winner in March 21 Drawing as Prize Rolls to $133 Million for Next
-

 Sports3 days ago
Gary Kirsten Accuses Pakistan Cricket Board Of ‘Interference’, Mohsin Naqvi Responds
-

 Tech4 days ago
Give Your Phone a Huge (and Free) Upgrade by Switching to Another Keyboard
-

 Sports6 days ago
2026 Kentucky Derby horses, odds, futures, preview, date: Expert who nailed 12 Derby-Oaks Doubles enters picks
-

 Tech4 days ago
AI enters the chat: New Seattle dating app relies on tech to facilitate meaningful human connections
-

 Business7 days ago
DLocal: Entering 2026 At Escape Velocity
-

 Politics7 days ago
Scotland’s rejection of assisted dying is a victory for humanity
-
Business6 days ago
Columbia Sportswear enters $500 million credit agreement with JPMorgan Chase
-

 Tech5 days ago
Today’s NYT Connections Hints, Answers for March 22 #1015
-

 News Videos3 days ago
Ch 9 Financial Management Part 1 | Detailed One Shot | Class 12 Business Studies Boards 2026
You must be logged in to post a comment Login