
Crypto World
Bitcoin Signals Suggest a 6 Month Wait Before Liquidity Returns
Bitcoin price has rebounded slightly after recent selling pressure, yet broader technical signals remain cautious. The crypto king recently broke down from a triangle pattern, raising concerns of further downside.
While the move may appear to be stabilizing, underlying metrics suggest potential prolonged weakness.
Bitcoin’s Past Might Dictate Hints At Its Future
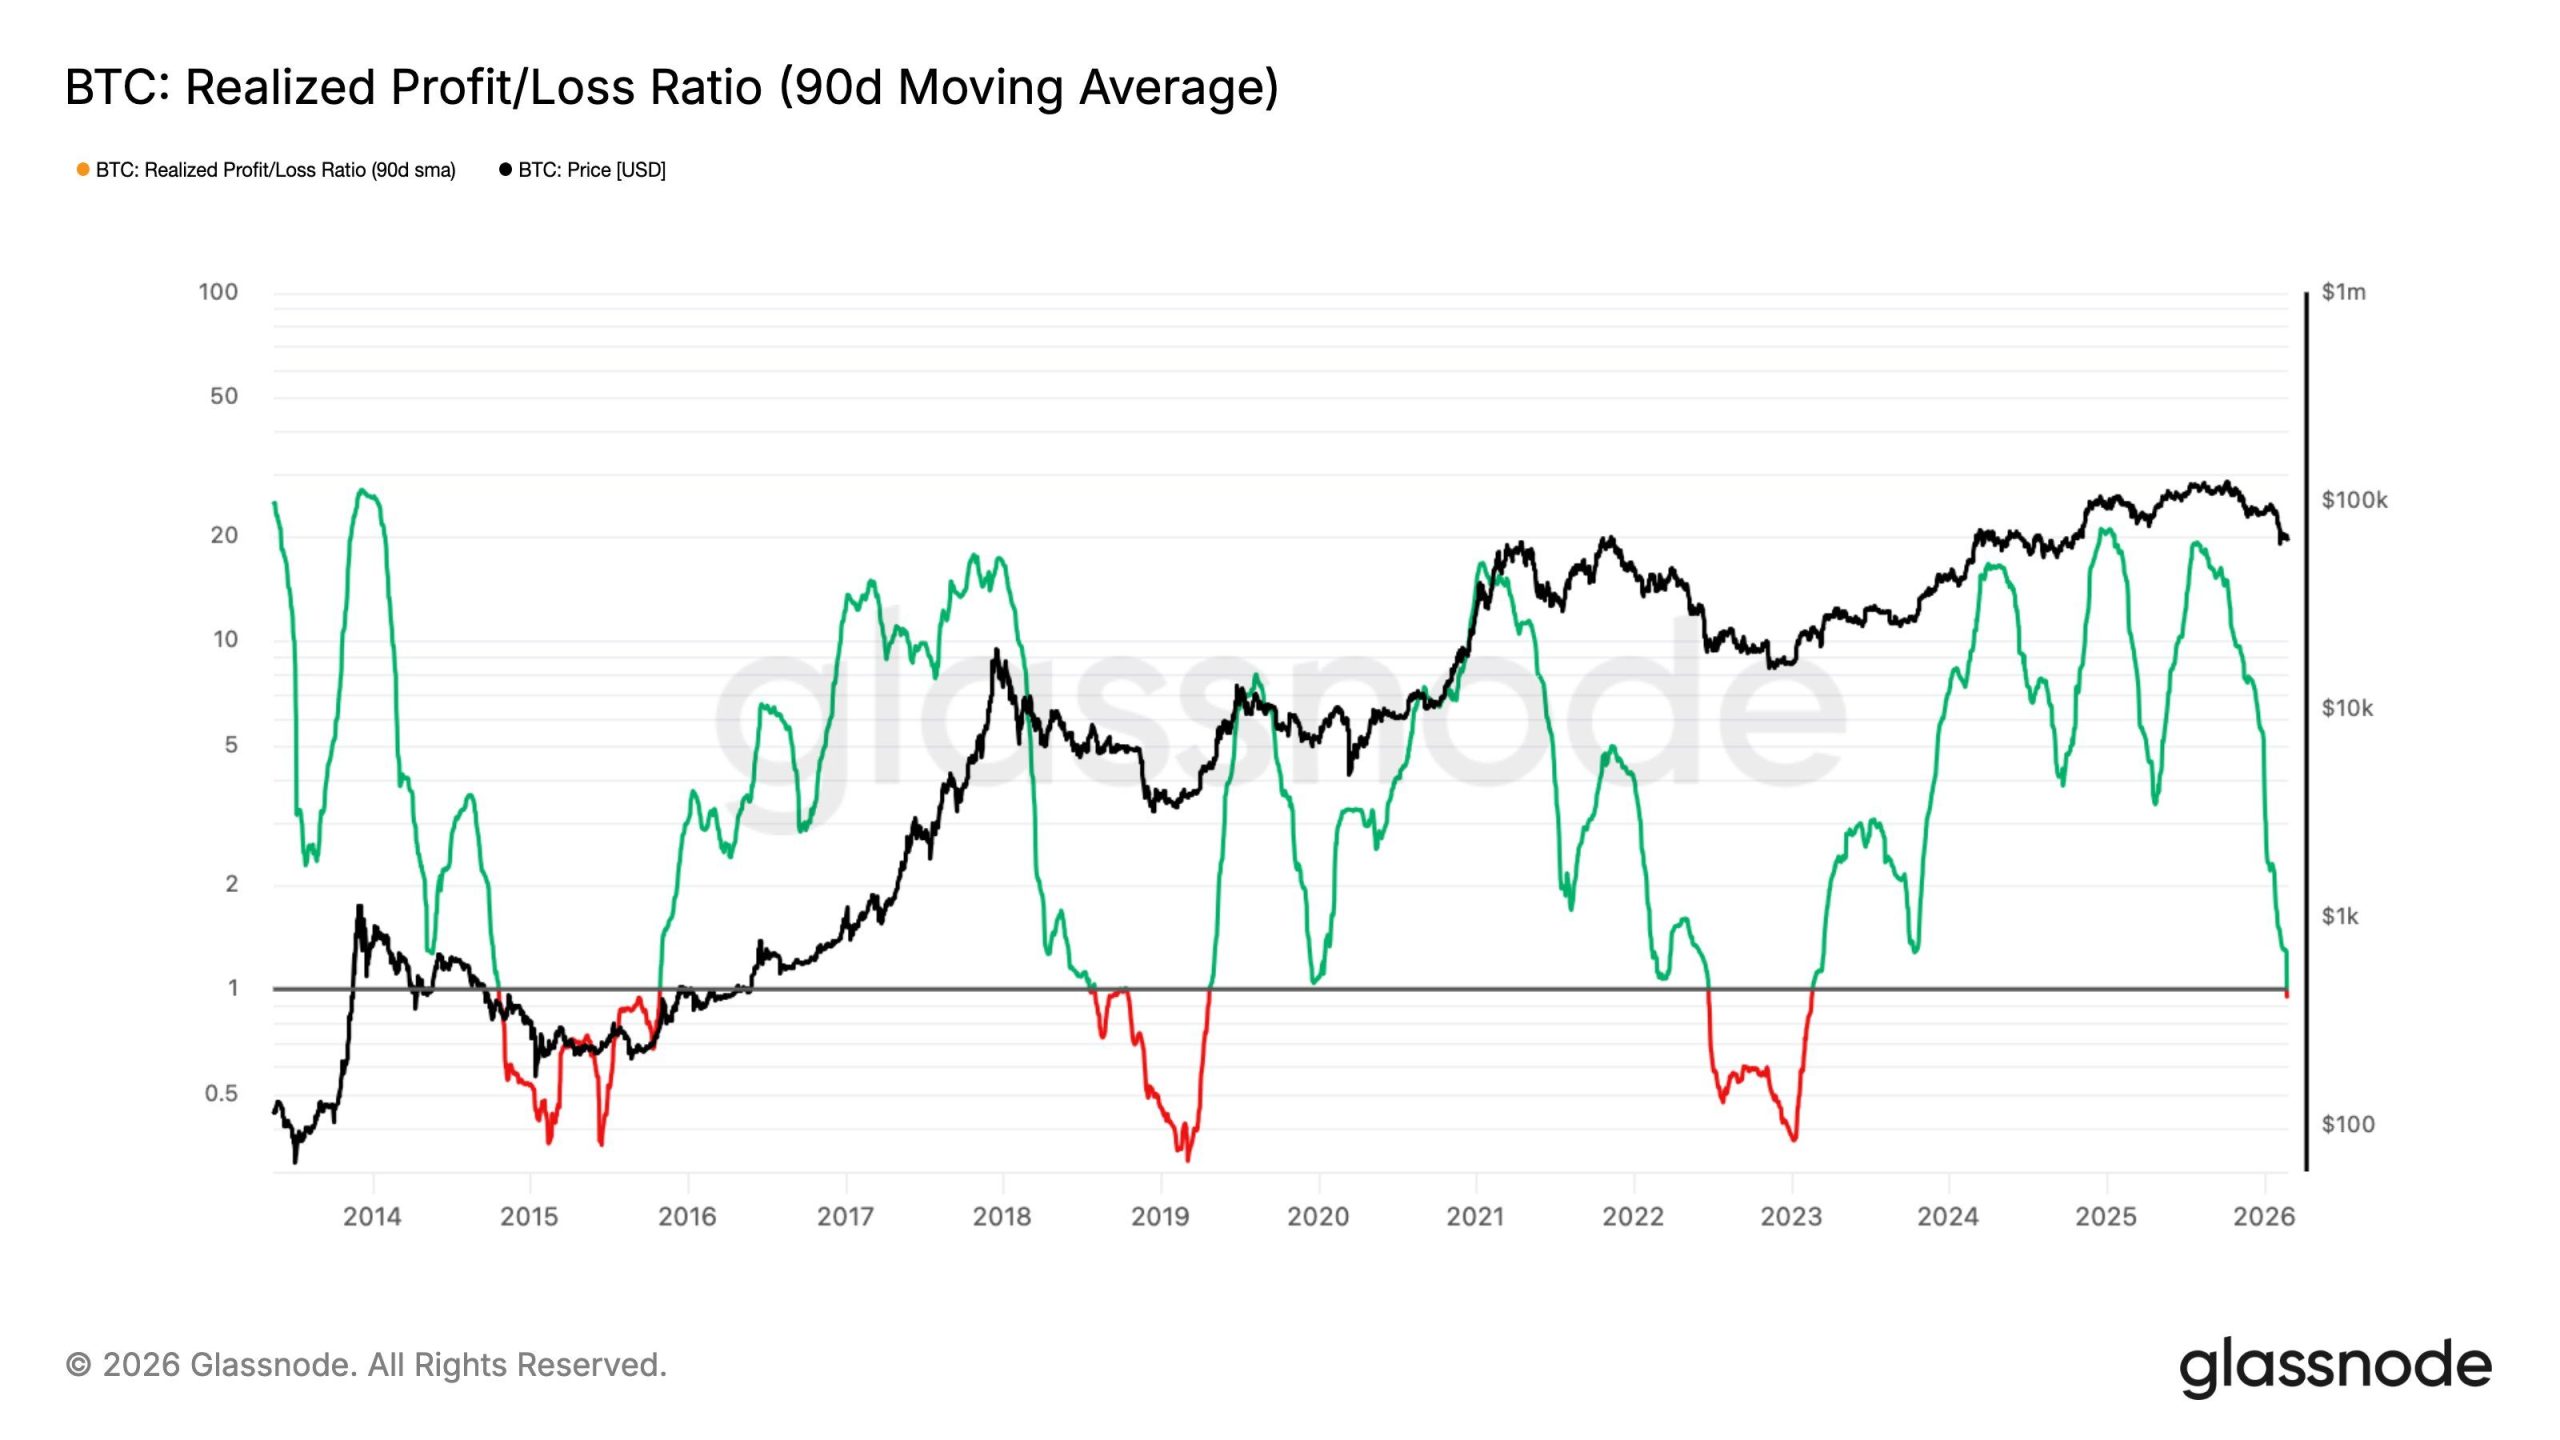
The Realized Profit/Loss Ratio (90D-SMA) has fallen below 1, signaling Bitcoin’s transition into an excess loss-realization regime. This metric measures whether investors are realizing more profits or losses over a rolling 90-day period. A reading below 1 confirms that losses dominate.
Historically, breaks below this threshold have persisted for six months or longer before recovering. Reclaiming levels above 1 has typically aligned with constructive liquidity returning to the crypto market. Until that shift occurs, sentiment may remain defensive and capital inflows limited.
Want more token insights like this? Sign up for Editor Harsh Notariya’s Daily Crypto Newsletter here.
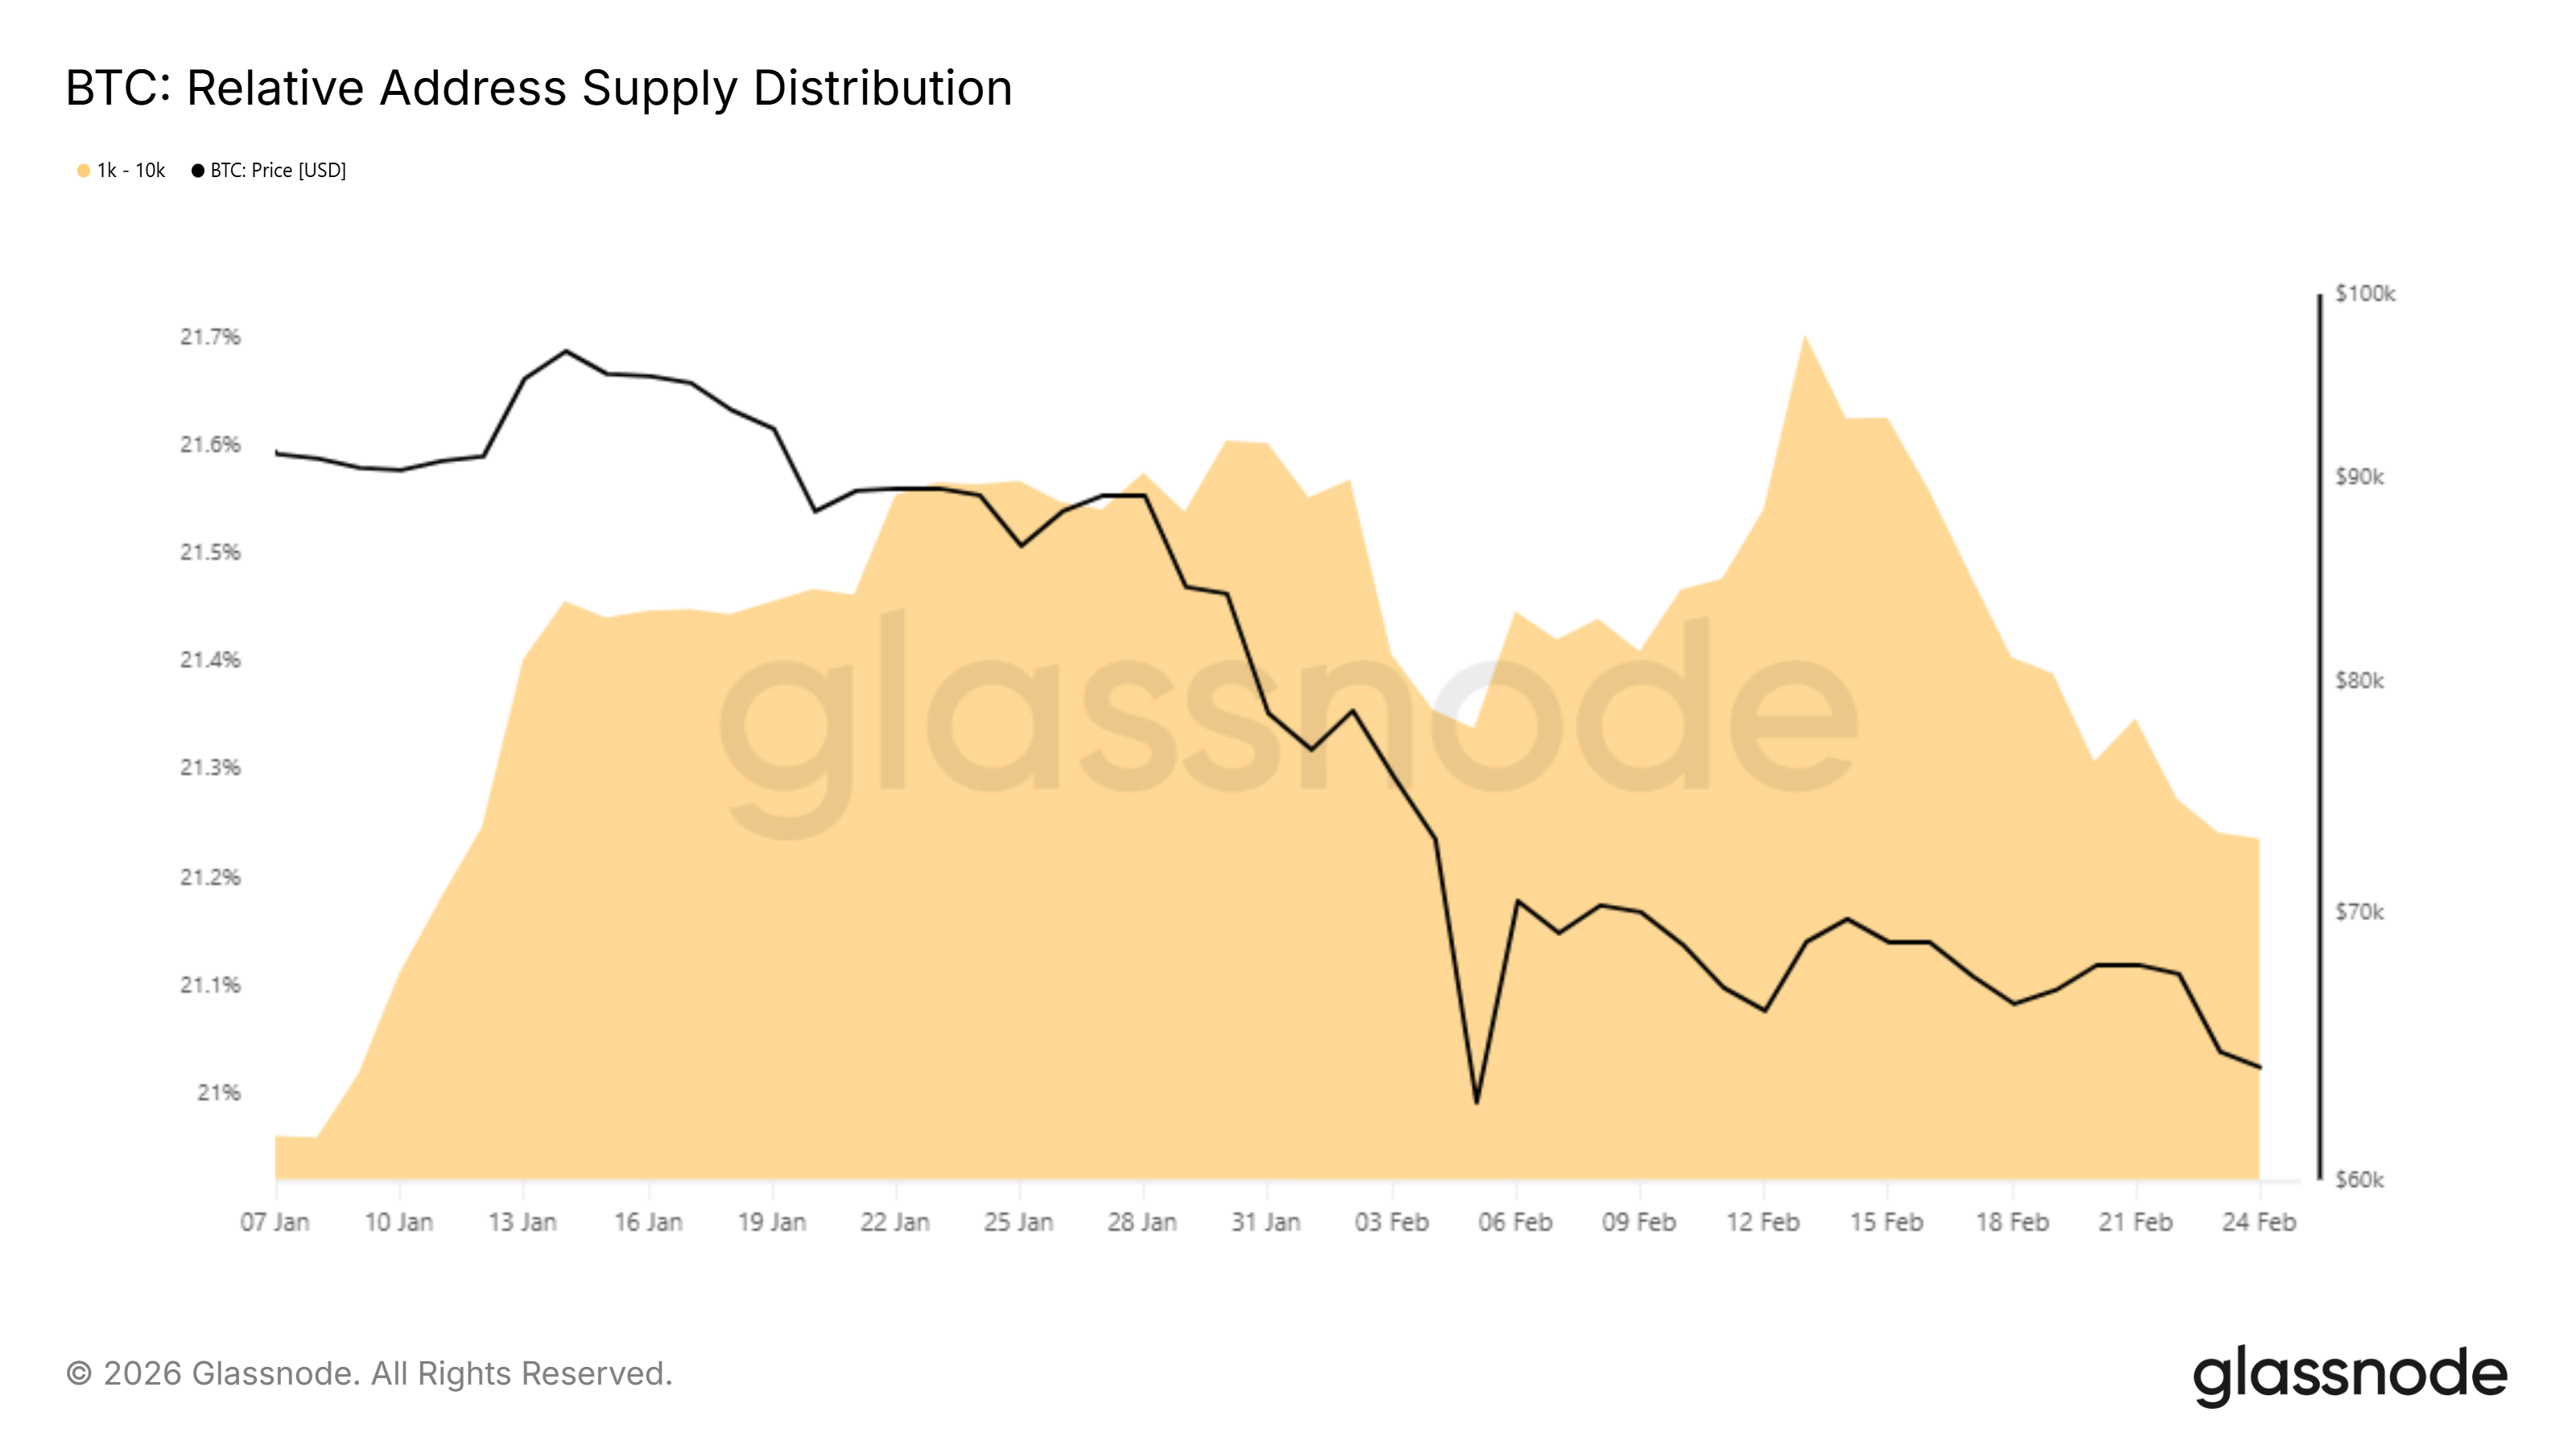
Supply distribution data reveals notable changes among large Bitcoin holders. Addresses holding between 1,000 and 10,000 BTC have gradually reduced exposure. Over the past 12 days, their share of total supply declined from 21.7% to 21.2%.
This shift represents a reduction of nearly 90,000 BTC, valued at approximately $5.8 billion. Although the pace of selling appears measured, distribution by large holders can weigh on price stability. Persistent offloading may limit upside attempts in the near term.
BTC Price Recovery Unlikely
Bitcoin is trading at $65,475 at the time of writing after bouncing from the $62,525 support level over the past 24 hours. The earlier triangle breakdown projected a potential 14% decline. However, immediate downside momentum appears to be slowing.
If macro bearish signals continue to dominate, Bitcoin could retest the $62,525 support. A decisive break below that level may expose BTC to the psychological $60,000 threshold. Losing this support could intensify panic selling and deepen the correction.
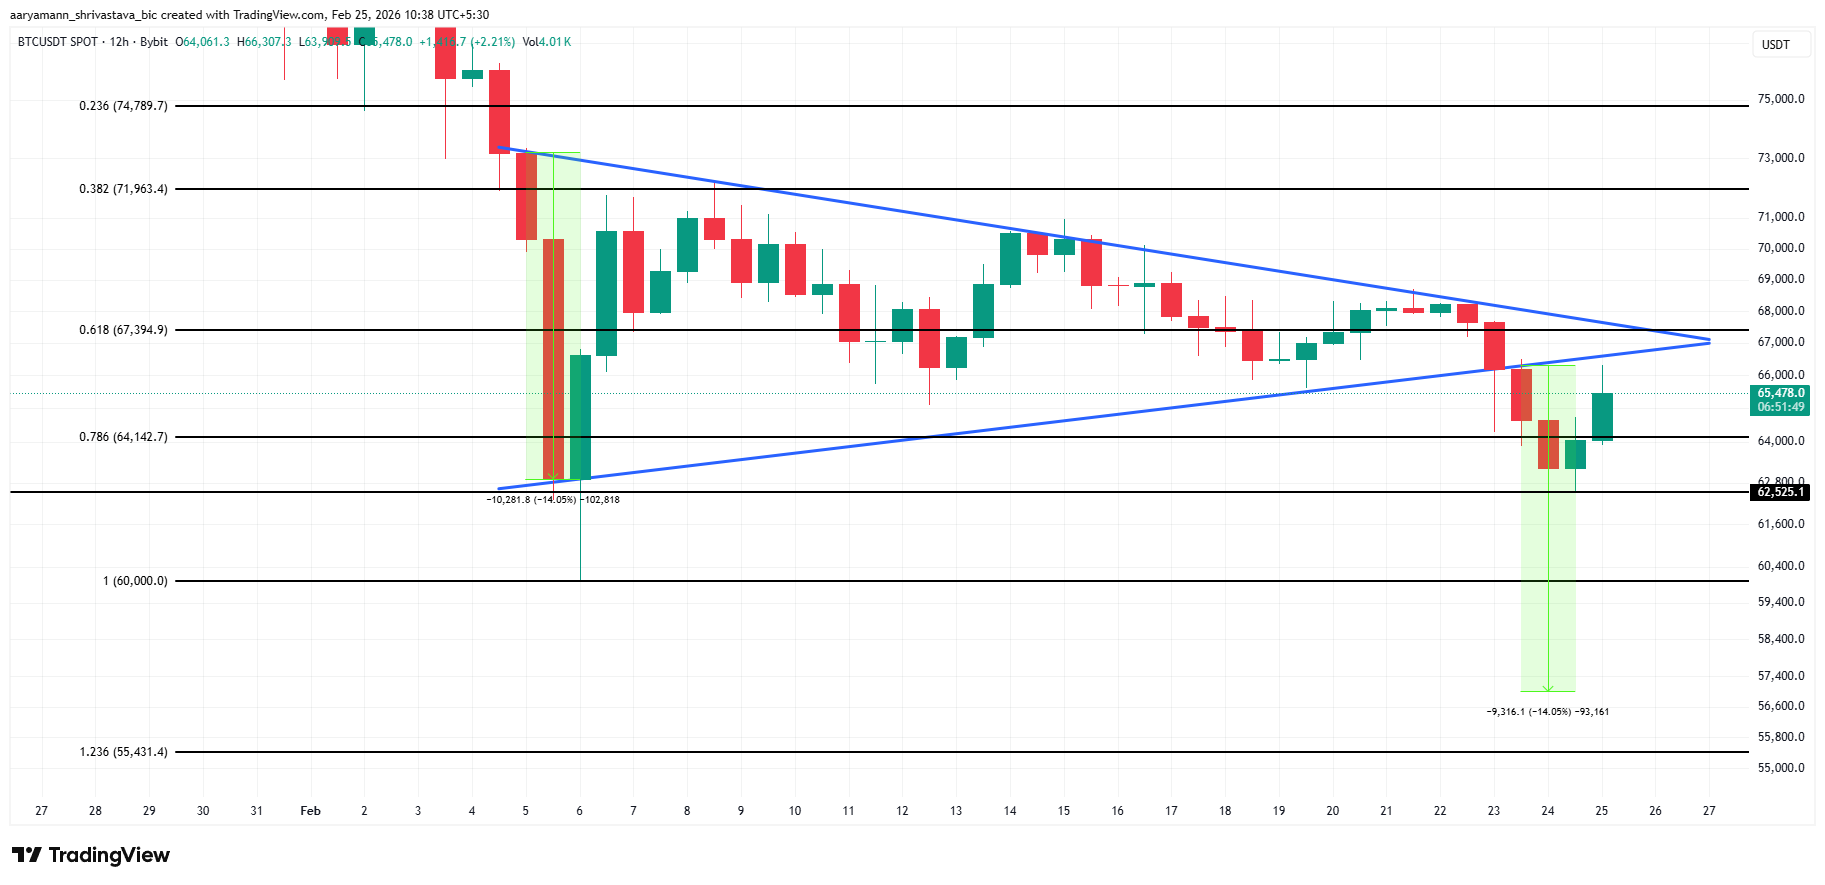
Conversely, renewed buying interest at current levels may shift short-term momentum. A breakout above the $67,394 resistance would invalidate the triangle pattern. Sustained strength beyond that point would signal improving structure for BTC and suggest a temporary bullish recovery despite broader liquidity concerns.

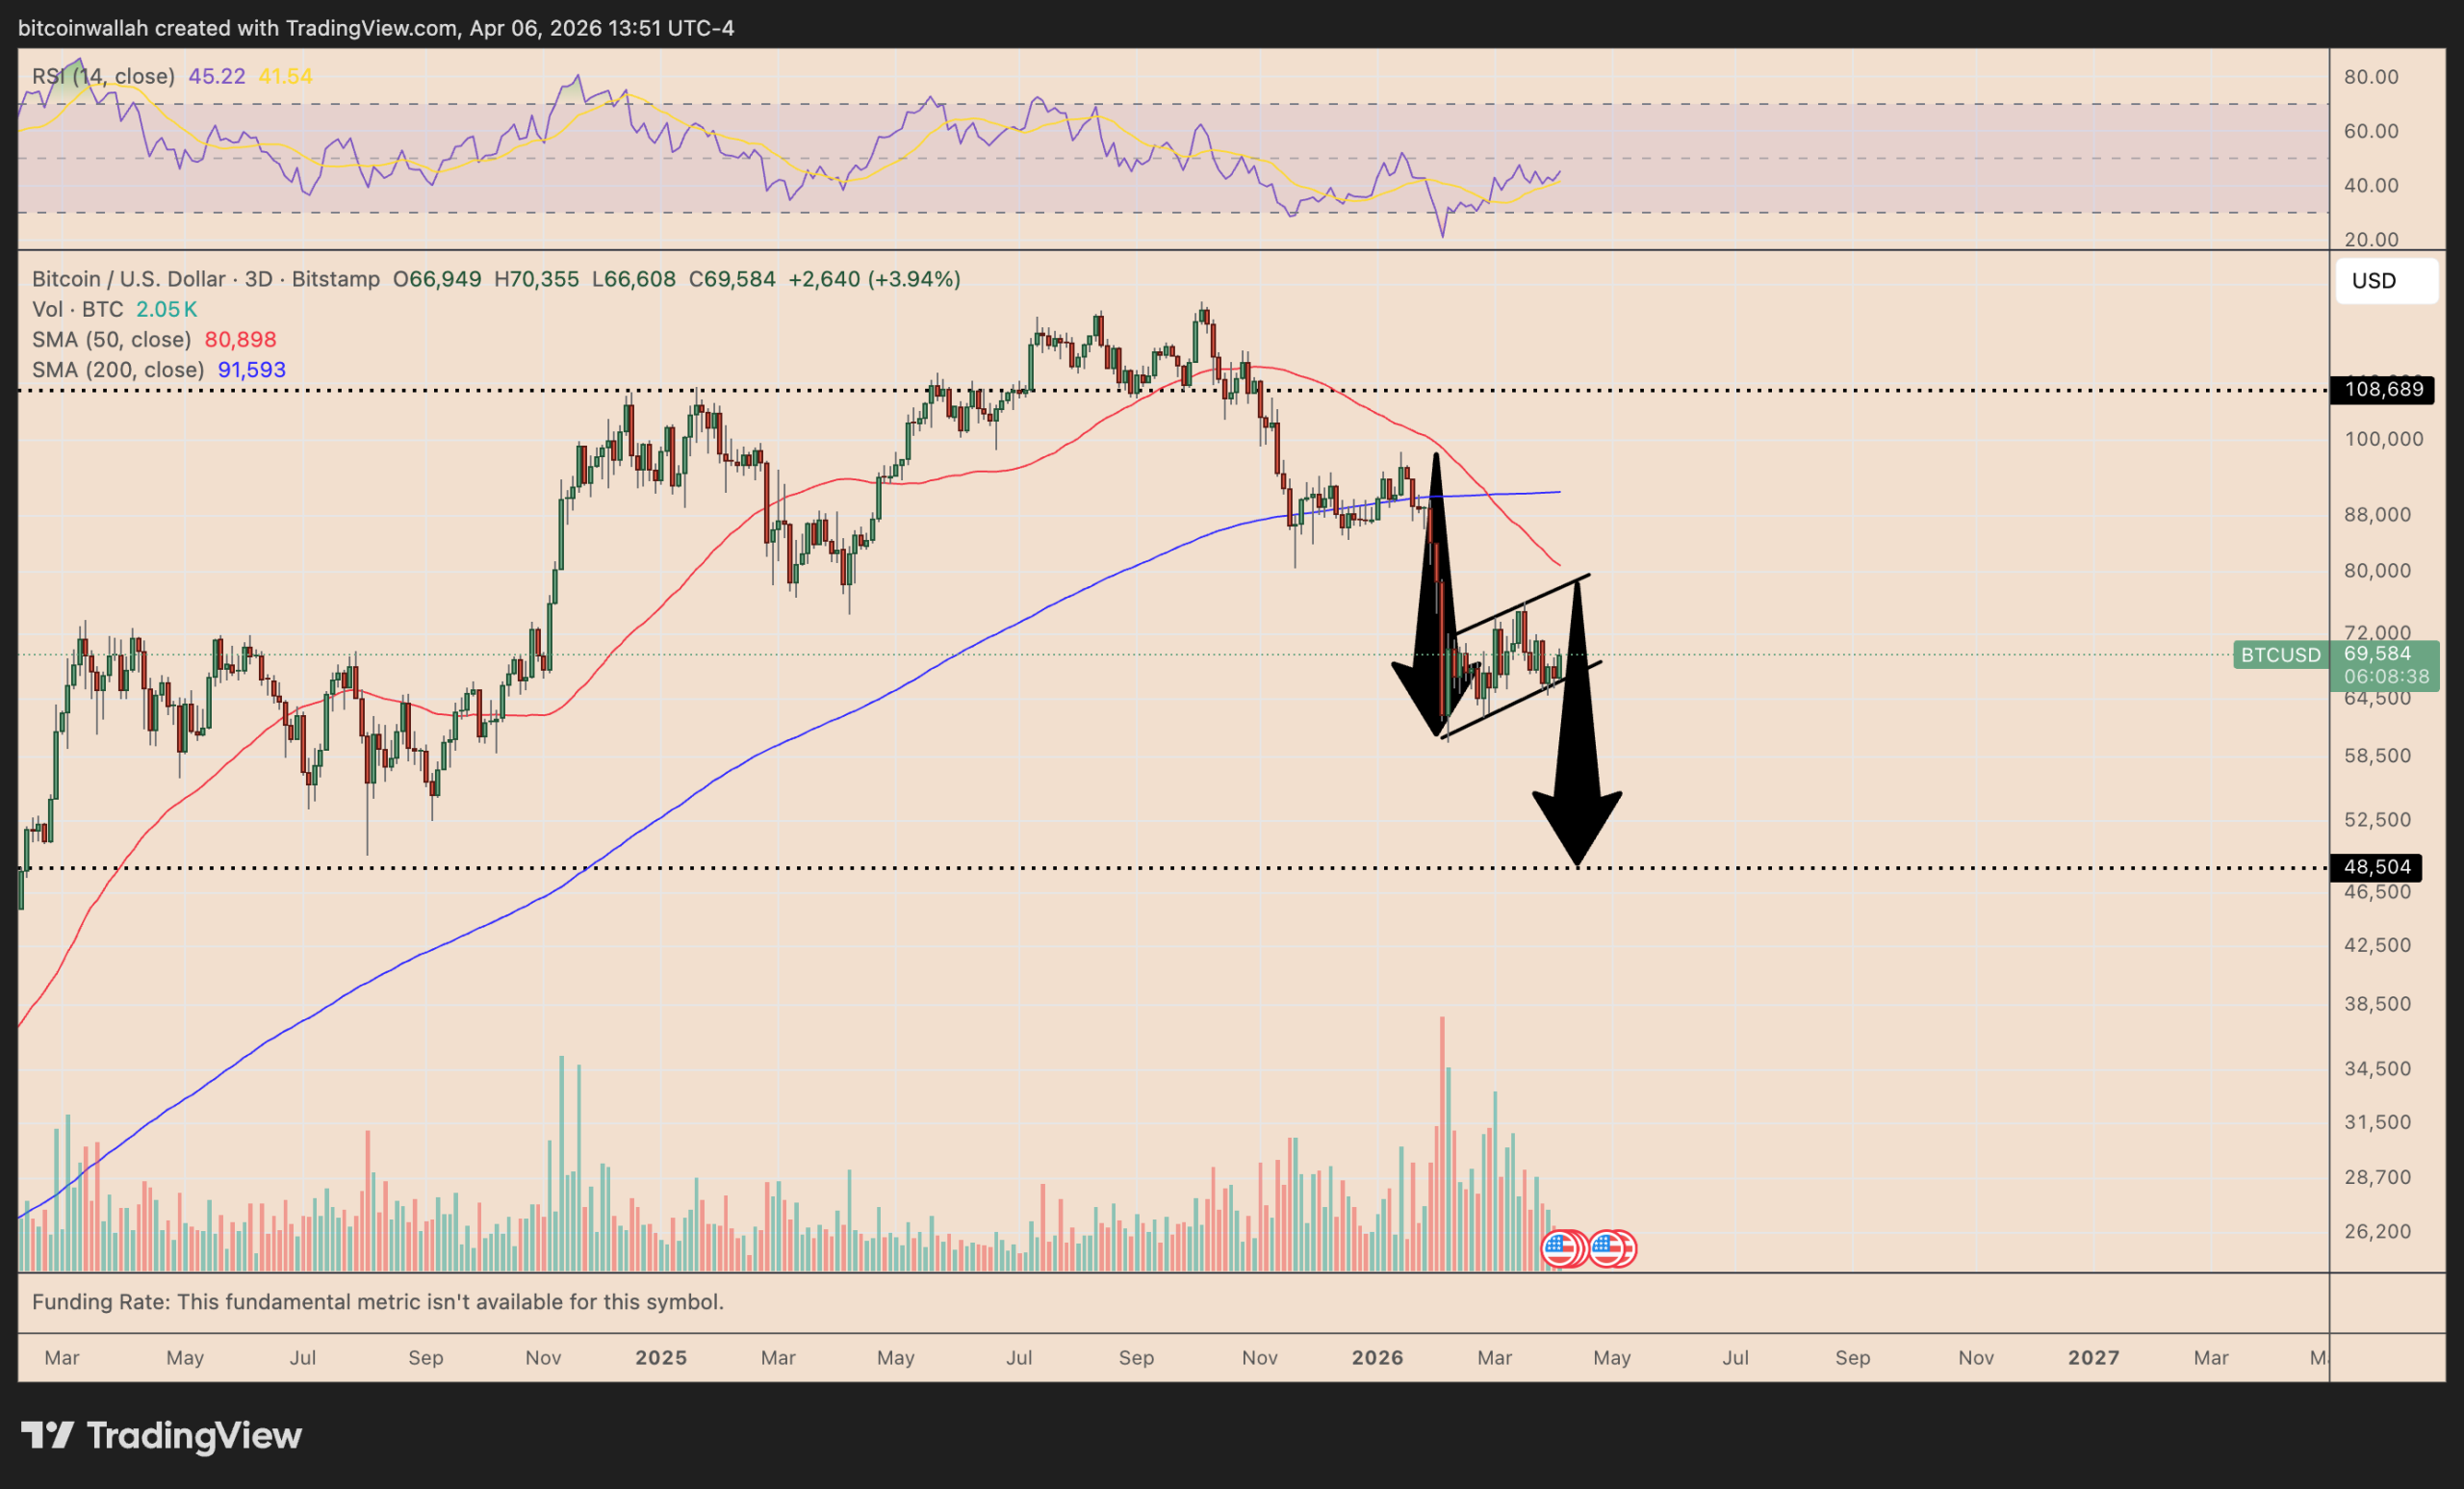
Bitcoin (BTC) is trading within a bear flag pattern that projects a breakdown toward the sub-$50,000 area, or roughly 30% below current levels. However, Michael Saylor’s Strategy could spoil the bears’ plans.

Key takeaways:
-
Bitcoin has avoided a bear flag breakdown for weeks as Strategy keeps buying BTC.
-
The setup now resembles Bitcoin’s 2018 bottom, when a bearish pattern failed and triggered a reversal.
Can Strategy’s BTC buying offset weak technicals?
Normally, a bear flag remains a bearish continuation pattern because there is not enough demand to overcome the broader downtrend.
In Bitcoin’s case, however, Strategy has been taking supply off the market faster than miners can replace it.
Since March 2, Strategy’s Bitcoin holdings have risen by 46,233 BTC, while miners have produced only about 16,200 BTC over the same period, meaning it has absorbed nearly thrice the new supply.

Much of that demand has come through STRC, Strategy’s variable-rate preferred stock. When STRC held near or above its $100 par value, Strategy kept issuing shares and accumulating BTC.
For instance, last week, Strategy raised $102.6 million through STRC sales to help fund a Bitcoin purchase worth over $330 million. BTC’s price has jumped by over 6.65% ever since.

During March 9–13, STRC sales raised about $776 million, enough to buy over 11,000 BTC, while Bitcoin rose more than 7% even as the S&P 500 fell 1.6%. The same period saw BTC’s price rising over 10.5%.
But when STRC slipped below par in mid-March, issuance slowed. Earlier below-par episodes had coincided with 25%–40% BTC pullbacks, including a nearly 40% drop over three weeks after a January pause.
Bitcoin’s long-term holders and whales drove much of the selling.
Bear flag failure could set stage for rally to $110,000
Bitcoin remains inside a bear flag after a sharp decline, but the pattern would begin to fail if price breaks above the upper trendline near the mid-$70,000 area.
That breakout would invalidate the immediate bearish continuation setup and shift focus to the bullish measured-move target near $108,000-$110,000.

A similar pattern failure occurred near Bitcoin’s 2018 bottom, when a rising wedge pattern led to a breakout instead of a breakdown.
Another factor supporting the upside case is Bitcoin’s position near its 200-week simple moving average (200-week SMA, the blue wave). In 2018, Bitcoin bottomed out near this level and rose by over 1,975% afterward.
As of 2026, the 200-week SMA has capped Bitcoin’s downside attempts successfully, raising the odds of a 2018-like bottom formation.
Related: Strategy’s STRC stock trading surge: How much Bitcoin can Saylor buy?
Some analysts anticipate BTC to rise to $400,000 if Strategy continues buying BTC at its current rate.
This article is produced in accordance with Cointelegraph’s Editorial Policy and is intended for informational purposes only. It does not constitute investment advice or recommendations. All investments and trades carry risk; readers are encouraged to conduct independent research before making any decisions. Cointelegraph makes no guarantees regarding the accuracy or completeness of the information presented, including forward-looking statements, and will not be liable for any loss or damage arising from reliance on this content.


An open-source AI job hunter built on Claude Code just auto-applied to hundreds of roles and actually landed a job, exposing why the real bottleneck is on-chain compute, not résumés.
Summary
- An open-source AI agent built on Claude Code sent more than 700 targeted job applications and “actually got him hired,” according to X host 0xMarioNawfal.
- The tool, Career-Ops, scans 45+ company career pages, scores roles, rewrites CVs in 14 “skill modes,” and batch-fires ATS-optimized PDFs while the user sleeps.
- As AI agents flood hiring pipelines, tokenized computational performance on networks like Bittensor, Render and FET could become the settlement layer for automated job hunting.
A viral clip shared by 0xMarioNawfal claims that “SOMEONE BUILT AN AI JOB SEARCH SYSTEM FOR CLAUDE CODE THAT SENT 700+ APPLICATIONS AND ACTUALLY GOT HIM HIRED,” and that “THE JOB HUNT JUST GOT AUTOMATED.”
The system in question, an open-source project called Career-Ops, is billed on GitHub as an “AI-powered job search system built on Claude Code” with 14 skill modes, a Go dashboard, PDF generation and batch processing, effectively turning the job hunt into an automated pipeline. A LinkedIn post summarizing the tool says it “scans multiple company career pages, rewrites your CV per job, and even fills application forms,” targeting firms like Anthropic, OpenAI and Stripe across 45-plus pre-configured employers.
Reaction on X underscores how fast AI agents are colonizing hiring. One user, Ofek Shaked, calls it “the future of job hunting,” adding that a simpler version “landed me 3 interviews” in a month. Another, Eugene Smarts, notes “that’s wild, imagine how much time that saves, job hunting is the worst,” while EchoWireDai warns that “If everyone automates applications… recruiters will just automate rejections.” Others highlight the quality constraint: investor Balvinder Kalon writes that “the real flex is getting the context right per company,” arguing that agents that “tailor each application to the job description, not just spray and pray” will be the ones that matter. Tools like Plushly, promoted in the same thread as a way to “auto apply to internships & jobs while you sleep,” show how quickly similar services are proliferating.
As systems like Career-Ops scale, their bottleneck is not résumés; it is compute. The GitHub repo describes an architecture that continuously scans job portals, runs multi-step Claude Code prompts, generates ATS-optimized PDFs via Playwright, and monitors everything from a terminal dashboard, turning each job search into thousands of model calls and browser automations. According to Bloomberg, AI has already become “unavoidable on both sides of hiring,” with most résumés never reaching a human and interviews increasingly led by bots, a shift workforce experts say forces applicants to “learn how to navigate a job market reshaped by it.” In another explainer on the “new rules of finding a job in 2026,” Bloomberg warns that mass-applying with generic AI hurts candidates, but using AI well can help them strategically target roles and refine materials, exactly the niche Career-Ops tries to occupy.
That compute demand is already visible in crypto markets. An MEXC research note on AI tokens highlights how Bittensor (TAO), Render (RENDER) and the Artificial Superintelligence Alliance’s FET token have led recent rallies, with TAO up nearly 35% in a week and Render and FET gaining roughly 25–32%, as traders bet on “agentic AI systems, autonomous software capable of performing tasks without human input.” These networks explicitly sell tokenized access to GPU and machine-learning resources: Render routes GPU rendering jobs across a decentralized network of providers, while Bittensor’s design, as CCN explains, aims to reward participants who supply and route high-quality machine-learning models, with price forecasts suggesting TAO could trade between $748 and $2,750 in long-term scenarios. As job-hunting agents evolve from scraping and form-filling to full-stack career copilots, routing their ever-growing computational load through tokenized compute layers becomes a rational way to meter, price and trade that performance rather than leaving it buried inside closed platforms.
The cultural flip is not lost on users. Commenter Gagan Arora notes that “We went from ‘AI will take your job’ to ‘AI will find your next job’ in about 6 months,” calling it “the irony” that the tool workers feared is now “the best tool for getting hired.” Bloomberg’s coverage of AI-led interviews points in the same direction: a study summarized by the outlet found that AI interviewers, randomly assigned to 67,000 job seekers, could outperform human recruiters in surfacing strong candidates, raising questions about where humans still add value in the funnel. For now, Wall Street expects AI adoption to increase hiring rather than crush it, with a Bloomberg Intelligence survey cited by Bloomberg News indicating that roughly two-thirds of financial firms foresee staff numbers rising initially as they roll out AI.
For crypto, the signal is simple: if agents are going to swarm both sides of the labor market, the underlying compute will become an asset in its own right. In a previous crypto.news story on AI tokens, analysts argued that projects like Bittensor and Render sit “at the center of the AI infrastructure narrative,” capturing value as demand for model inference and GPU cycles grows. Another crypto.news story on agentic AI in DeFi predicted that autonomous agents would eventually need on-chain reputations, budgets and compute allowances, paid in liquid tokens that track underlying GPU or model performance rather than abstract governance rights. The Claude-powered job hunter that just landed its creator a new role is a glimpse of that future: an early, messy, very human example of why the next phase of job hunting may run not just on prompts and PDFs, but on tokenized computational performance that turns raw AI horsepower into a tradable, programmable resource.
The synthetic dollar protocol is moving beyond its crypto basis trade roots into institutional lending, real-world credit, and equity and commodity perpetuals.
Ethena Labs is finalizing its first direct lending agreements with Anchorage Digital, Maple Institutional, and Coinbase Asset Management as part of a sweeping plan to diversify the assets backing its USDe synthetic dollar.
Under the agreements, Ethena would lend stablecoins from USDe’s reserves to facilitate overcollateralized loans originated by those entities, with borrower collateral held in secured triparty custody. Each loan will operate within parameters set by the Ethena Risk Committee, including minimum overcollateralization ratios, concentration limits, automatic liquidation thresholds, and tenors designed to minimize liquidity risk during large USDe redemption events.
Ethena framed the move as a natural extension of the stablecoin lending it already does on DeFi protocols like Aave and Morpho, but for institutional counterparties with only high-quality, immediately liquid collateral such as BTC and ETH.
Beyond the Basis Trade
The institutional lending push is one piece of a broader four-part diversification strategy Ethena outlined Monday, which also includes expanding real-world asset (RWA) exposure beyond tokenized Treasury bills, extending its delta-neutral framework into equity and commodity perpetuals, and exploring prime lending to trading firms.
The shift reflects how far USDe’s reserve composition has already moved. Perpetual futures positions, once the mainstay of USDe’s backing, now make up just 11% of the stablecoin’s reserves, with the rest allocated to stablecoin reserves and DeFi lending positions. Ethena recently proposed replacing its static 7-day unstaking cooldown with a dynamic model, arguing the fixed period no longer reflects the liquidity available to meet redemptions.
USDe’s circulating supply has contracted to approximately $5.9 billion from a peak above $14.6 billion before the October 10 crash that wiped more than $5 billion from its market cap.
Meanwhile, the protocol’s ENA token is up 9% over the past 24 hours, but has dropped 94% from its peak two years ago.

Equity and Commodity Perps
Perhaps the most novel element is Ethena’s plan to apply its basis trade methodology to equity and commodity perpetual futures — a market that has grown rapidly since Hyperliquid launched its HIP-3 framework in October 2025.

HIP-3 open interest has surged from $70 million at launch to over $2 billion, driven by non-crypto pairs such as equities, commodities, and indices. Ethena noted that gold perpetual funding rates on Binance averaged 24.6% in March, presenting a clear basis opportunity for delta-neutral operators.
On the RWA side, Ethena said initial allocations will likely be limited to AAA-rated CLOs, which have no history of defaults, with potential expansion into investment-grade corporate bond funds and short-duration credit products.
This article was written with the assistance of AI workflows. All our stories are curated, edited and fact-checked by a human.

The International Monetary Fund says tariffs don’t meaningfully fix trade gaps. Their impact is small and inconsistent.
At the same time, global current account imbalances are widening again. That points to rising economic strain between countries. For crypto, this matters. When trade tensions rise and policy tools fall short, capital often moves toward alternative assets like Bitcoin.
The IMF’s Key Findings
In a new policy paper, IMF researchers Pierre-Olivier Gourinchas and Christian Mumssen analyze the drivers of global imbalances.
Their conclusion is clear: traditional macroeconomic policies remain the dominant lever for addressing current account imbalances. Tariffs and industrial policies, by contrast, yield limited, and often counterproductive, results.
According to the IMF, tariffs only improve current accounts in rare circumstances, specifically when they are temporary. However, most tariffs are perceived as permanent or trigger retaliation.
As a result, people do not adjust their saving behavior, and the current account remains largely unchanged.
The paper warns that widening imbalances “have often preceded financial crises or abrupt reversals of capital flows.”
Fun Fact: The IMF notes that an escalation of tariffs does little to change current account positions but significantly lowers output across all regions. Everybody loses!
Why This Matters for Crypto
The IMF’s analysis paints a picture of structural instability. Consequently, several crypto-relevant dynamics emerge:
- Dollar Pressure: The US is running large fiscal deficits with large consumer spending. A weakening fiscal position could put long-term pressure on dollar confidence, potentially benefiting alternative stores of value like Bitcoin.
- Stablecoin Demand: As global trade tensions persist and underlying imbalances persist, businesses may increasingly turn to stablecoins for cross-border transactions. USD-pegged stablecoins offer dollar exposure without a direct dependency on the banking system.
- Safe Haven Narrative: The IMF explicitly warns of potential financial crises. Historically, such warnings have preceded periods where investors seek uncorrelated assets.
Outlook
The IMF calls for “synchronized adjustment,” where countries move together. However, such coordination has proven elusive. In the absence of coordinated action, market participants will seek their own solutions.
The IMF’s warning is clear: global imbalances are widening, tariffs won’t fix them, and disorderly adjustment could be “exceptionally costly.”
For crypto markets, this macro backdrop creates both risks and opportunities. The structural case for crypto as an alternative financial layer grows stronger as traditional policy tools fail to deliver.
The post IMF Warns Tariffs Fall Short as Global Trade Gaps Widen appeared first on BeInCrypto.


U.S. stocks inched higher on Monday, but beneath the smooth index closes, meme names, bitcoin proxies and Chinese ADRs traded like a late‑cycle minefield.
Summary
- U.S. stocks closed modestly higher Monday, with the Dow up 0.36%, the S&P 500 up 0.45%, and the Nasdaq up 0.5%.
- Tesla fell 2%, while AMC Entertainment surged 12% and MicroStrategy gained 6%, highlighting sharp divergences in high‑beta names.
- Chinese ADRs underperformed, with the Nasdaq Golden Dragon China Index down 0.2% and iQIYI off 4%.
U.S. equities finished Monday’s session slightly higher, with the Dow Jones Industrial Average rising 0.36%, the S&P 500 index adding 0.45%, and the Nasdaq Composite gaining 0.5%, according to Gate’s market data. The advance came even as individual names swung widely: AMC Entertainment jumped 12%, MicroStrategy climbed 6%, Advanced Micro Devices dropped 5%, and Tesla slipped 2%. Chinese‑focused stocks lagged, with the Nasdaq Golden Dragon China Index closing down 0.2% and iQIYI losing 4%.
Beneath the relatively calm headline moves, Monday’s tape showed classic late‑cycle dispersion, with meme‑linked and crypto‑sensitive names moving far more violently than the benchmarks. AMC’s 12% gain extended a recent rebound fueled by retail flows and short‑covering, while MicroStrategy’s 6% rise tracked ongoing strength in Bitcoin‑exposed equities after the software firm’s aggressive BTC accumulation left it trading as a leveraged proxy on the crypto market. By contrast, AMD’s 5% decline and Tesla’s 2% drop reflected pressure across high‑multiple growth and EV names, as investors rotated selectively within the tech and consumer‑discretionary complex.
The modest uptick in the S&P 500 and Nasdaq follows a strong 2025 in which the major U.S. indices posted double‑digit gains, according to recent data compiled by Reuters and LSEG. Analysts quoted in prior sessions have emphasized that with the S&P 500 already up more than 16% last year and the Nasdaq ahead over 20%, even small daily moves can mask significant stock‑level volatility as investors reassess earnings, rates, and geopolitical risks. Against that backdrop, Monday’s pattern — indexes up less than 0.5% while individual names swing 5%–12% — fits a market where stock‑picking and thematic positioning matter more than simple beta exposure.
Chinese internet and consumer names remained under pressure. The Nasdaq Golden Dragon China Index, which tracks U.S.‑listed Chinese ADRs, slipped 0.2% on the day, with iQIYI down about 4% alongside broader weakness in popular Chinese concept stocks. Recent sessions have seen sharper drops in the index — including declines of more than 2% on days when names like Alibaba, NIO, and XPeng fell between 3% and 6% — underscoring persistent skepticism over China’s growth outlook, regulatory risk, and U.S.‑China tensions.

World Liberty Financial and Aster DEX have announced a partnership. According to WLFI, USD1 will serve as the settlement asset for TradFi perpetual contracts on the platform.
Gold, silver, crude oil, and additional markets are planned.
Aster DEX confirmed the collaboration on X: “Aster and WLFI are working together to support closer ecosystem alignment, with both sides exploring integration across their respective tokens.”
Both teams indicated they are exploring deeper integration across their respective token ecosystems, suggesting the partnership could expand beyond settlement.
Fun Fact: USD1 has surpassed $4.6 billion in market cap and ranks fifth among stablecoin issuers by daily active addresses, ahead of PayPal and Ethena!
What USD1 Integration Means for Traders
Aster DEX offers perpetual contracts that allow traders to gain exposure to traditional assets through a DeFi interface. Adding USD1 as a settlement option expands the stablecoin’s utility beyond simple transfers.
For USD1, the integration creates a new use case: traders holding USD1 can use it directly for trading commodities perpetuals without converting to other stablecoins first.
Similarly, for WLFI, more USD1 utility translates to more ecosystem activity. As a result, each new integration adds another reason for users to hold and use the stablecoin.
USD1’s Expanding Footprint
The Aster DEX partnership is the latest in a series of USD1 integrations. Recent developments include:
- BitGo Mint added USD1 to its institutional stablecoin management platform.
- MEXC integrated USD1 across Launchpool, Savings, and as futures collateral.
- World Liberty Markets launched as a DeFi lending platform with USD1 as the primary asset.
USD1’s circulating supply has surpassed $4.6 billion, distributed across Ethereum (40.60%), BNB Chain (40.47%), and Solana (18.48%).
The partnership between WLFI and Aster DEX reflects a broader trend of stablecoins seeking differentiated use cases. Instead of competing solely on listings, USD1 is building integrations that create specific utility.
However, details on the full scope of the integration and timeline for the TradFi perpetual markets have not yet been disclosed. Nevertheless, both teams indicated further announcements are expected as the partnership develops.
The post Trump’s WLFI Lands Exclusive Deal: USD1 on Aster DEX appeared first on BeInCrypto.

Jamie Dimon, the CEO of JPMorgan Chase, used the bank’s annual shareholder letter to underscore how rapid technological advances are reshaping competition in finance. He highlighted artificial intelligence, data analytics and other advanced tools as central to the industry’s near- and long-term trajectory, signaling a shift toward more automated and data-driven financial services.
While blockchain and digital assets were not the letter’s sole focus, Dimon acknowledged that “a whole new set of competitors is emerging based on blockchain, which includes stablecoins, smart contracts and other forms of tokenization.” The remarks come as JPMorgan doubles down on its own blockchain initiatives, even as Dimon stresses that the bank’s long-term prosperity hinges on effectively deploying AI across its operations.
JPMorgan has been building out its in-house infrastructure, now branded Kinexys, a platform designed to enable near-instant fund transfers without traditional middlemen. The effort aims to scale to as much as $10 billion in daily transaction volume and has drawn notable corporate participants into its orbit. The bank has onboarded Mitsubishi Corporation of Japan and counts Qatar National Bank, Siemens, and BlackRock among its institutional clients. Beyond payments, Kinexys is being positioned as a broader tokenization platform, with JPMorgan signaling plans to extend into asset classes such as private credit and real estate.
Dimon’s notes arrive amid a larger policy debate in Washington over how digital assets should be regulated, particularly around stablecoins. The GENIUS Act, enacted last year, established a regulatory framework that many in the crypto industry expect will accelerate adoption by clarifying the rules for stablecoins and related activities. Yet broader market-structure legislation remains stalled in Congress. A key point of contention is yield-bearing stablecoins—banking groups warn that issuers offering interest-style returns could undermine financial stability if they operate outside traditional banking guardrails.
Key takeaways
- Tech-driven competition rising: Dimon frames AI, data and blockchain-enabled firms as a new frontier, even as JPMorgan emphasizes its own tech initiatives.
- Kinexys advances its agenda: JPMorgan’s blockchain platform targets up to $10B in daily volume and has attracted marquee clients, with tokenization at the core of its expansion plans.
- Regulatory clarity vs. stalled legislation: GENIUS Act provides a clearer framework for stablecoins, but wider market-structure bills remain uncertain in Congress.
- Industry tensions surface publicly: Dimon and Coinbase CEO Brian Armstrong have publicly debated crypto regulation, while banks advocate against yield-bearing stablecoins.
- Market context matters for adoption: The stablecoin market topped roughly $315B in Q1, a data point that regulators and market participants watch closely.
Kinexys as a real-world accelerator for tokenization
JPMorgan’s Kinexys protocol is being pitched as more than just a faster rails solution for transfers. By embedding near-instant settlement capabilities into corporate and institutional processes, JPMorgan envisions Kinexys as a gateway to broader asset tokenization. The onboarding of Mitsubishi Corporation in particular signals a strategic effort to attract multinational clients with complex cross-border needs, where speed and reliability translate into tangible capital efficiency gains.
Beyond Mitsubishi, Kinexys counts Qatar National Bank and other large institutions such as Siemens and BlackRock among its users. The breadth of these clients points to a practical use case: tokenized payments and settlements can trim intermediaries, reduce settlement risk and improve liquidity management across global networks. In JPMorgan’s framing, Kinexys is a stepping stone toward a larger tokenization ecosystem—one that could eventually encompass private markets such as private equity, real estate and other asset classes that traditionally require longer settlement cycles.
As JPMorgan positions Kinexys as both a payments platform and a broader tokenization layer, investors should watch for how quickly new assets—beyond cash equivalents—can be tokenized and traded within the network. The pace at which more clients sign on and the types of asset classes brought under Kinexys’ umbrella will be a telling indicator of JPMorgan’s broader hypothesis: that tokenization can unlock liquidity and improve capital efficiency at scale.
Regulatory currents shaping the crypto horizon
The JPMorgan letter arrives at a moment when policy makers are weighing a path forward for stablecoins and crypto markets. The GENIUS Act, which laid groundwork for stablecoin regulation and custody rules, is widely viewed as a factor that could hasten institutional participation in tokenized assets, provided issuers operate under clear compliance standards. By offering a regulatory scaffold, proponents argue that GENIUS reduces legal ambiguity for banks and fintechs exploring stablecoin-related services.
However, comprehensive market-structure reform remains stuck in Congress. Lawmakers are debating a range of issues—from how stablecoins should be treated within the broader financial system to who bears responsibility for liquidity and resilience during stress events. A point of friction is whether yield-bearing stablecoins should be permitted under the same framework as traditional bank deposits or whether separate regimes are warranted to prevent regulatory arbitrage.
Industry dynamics reflect these policy tensions. Dimon and Coinbase CEO Brian Armstrong have publicly traded criticisms over the direction of crypto regulation, underscoring divergent views on how to balance innovation with safety. Banking groups, including the American Bankers Association, have prioritized a push against yield-bearing stablecoins and have pressed for clarity and adherence to robust guardrails. The policy debate will likely influence how quickly institutions feel comfortable engaging in tokenized ecosystems and whether regulated banks will collaborate with on-chain infrastructure providers like Kinexys.
From a market perspective, the size and growth of the stablecoin sector remain central to the regulatory calculus. Data from industry trackers show the stablecoin market reaching into the hundreds of billions, with quarterly measurements illustrating continued expansion. Such momentum helps explain why lawmakers view stability and transparency as prerequisites for broader mainstream adoption, even as commentators remain wary of new forms of credit-like yield in non-bank structures.
What to watch next for JPMorgan and the broader ecosystem
As JPMorgan delegates its capital toward AI and data-driven processes while steering Kinexys toward broader tokenization, the coming quarters will reveal how aggressively the bank pursues asset tokenization beyond cash settlements. The pace of client onboarding, the breadth of asset classes brought under Kinexys, and the platform’s performance at scale will be critical indicators of the strategy’s viability.
On the regulatory front, observers will be listening for any concrete progress on market-structure legislation and for further clarity on stablecoin regulation. If lawmakers advance a clear, stability-focused framework, the adoption curve for tokenized assets and related financial products could accelerate across traditional institutions and fintechs alike. Conversely, continued stalemate or restrictive provisions could incentivize firms to pursue more private, permissioned models or to rely on bespoke bilateral arrangements, potentially slowing broad-market participation.
Beyond JPMorgan, the broader market will keep a close eye on how other banks, asset managers and technology firms calibrate their tokenization ambitions. Kinexys could become a reference case for how a major financial institution balances internal AI-driven efficiency with the external opportunities of asset tokenization, a dynamic that almost certainly will influence how investors assess risk, liquidity and regulatory exposure in fiat-to-token and token-to-token workflows.
In the near term, investors and industry watchers should watch for additional client announcements from Kinexys and any concrete expansions into new asset classes. They should also pay attention to regulatory signals—whether Congress pushes forward with comprehensive market-structure bills or if separate proposals gain traction—that could either lower or raise the barriers to institutional participation in tokenized ecosystems. For now, JPMorgan’s path suggests a dual bet: keep strengthening core AI-enabled operations while pursuing a tokenization play that could redefine liquidity and settlement for institutional finance.
The ongoing dialogue between technology, finance and policy will shape the next phase of crypto adoption. As Dimon and his peers navigate this evolving terrain, the question remains: how swiftly will tokenization scale from pilot programs to widely used financial infrastructure, and what will be the precise mix of regulation and innovation that enables it?


The risk management provider exits after three years, marking the third departure of a core contributor in two months.
Chaos Labs, the risk management firm that has “priced every loan on Aave since November 2022,” announced Monday that it is proactively terminating its engagement with DeFi’s largest lending protocol, citing a fundamental disagreement over how risk should be managed.
The departure makes Chaos the third core contributor to exit Aave’s operations in recent months, following BGD Labs’ exit on April 1 and the Aave-Chan Initiative’s wind-down announcement in early March.
In a forum post, Chaos Labs CEO Omer Goldberg named all three alongside TokenLogic as the contributor group whose “people, technology, and operational experience” produced Aave’s track record, and noted that Chaos is now the last remaining technical contributor from that cohort.
Budget Gap
Goldberg pointed to three factors behind the decision: the departure of other core contributors, which increased the operational burden; the expanded scope and legal liability introduced by Aave V4’s new architecture; and the fact that the firm has operated its Aave engagement at a loss for three years.
Aave Labs offered to raise the budget to $5 million to retain Chaos, but the firm estimated that a minimum of $8 million was necessary to cover V3, V4, and its institutional go-to-market work. Goldberg framed the figure as still below the 6-10% that traditional banks allocate to compliance and risk infrastructure.
“Budgets don’t reshape the threat landscape. The cost is the cost,” Goldberg wrote.
Aave founder Stani Kulechov responded on X, thanking Chaos for its contributions but pushing back on several elements of the firm’s account.
Kulechov said that in recent weeks, Chaos had been “exploring winding down its risk consultancy services business” and had already begun winding down agreements with other protocols. He said Aave Labs was “generally supportive” of doubling Chaos’ budget to $5 million but was not willing to approve $8 million without a separate addendum tied to demonstrated workload.
More pointedly, Kulechov said the disagreement extended beyond compensation. He said Aave Labs did not support other elements of Chaos’ proposal, including making Chaos the sole risk manager, replacing Chainlink with Chaos Labs’ own price oracles on all new deployments, and adopting Chaos Labs’ vaults — which he said are not yet audited — as the default for all B2B integrations.
“While we do not see issues with these Chaos products or their future viability, we strongly believe that, given the scale of the Aave protocol, it should maintain at least a two-layer risk management model and vendor lock-in free vaults,” Kulechov wrote.
He also disputed the characterization of V4’s risk implications, saying Aave Labs held multiple risk calls with Chaos employees before V4 went live, and that the feedback received during those sessions “does not align with the concerns expressed in their post.”
Deeper Misalignment
Beyond economics, Goldberg described a fundamental disagreement over how risk should be prioritized as Aave transitions to V4 — a protocol he characterized as entirely new, with a different smart contract codebase, system architecture, and liquidation logic that shares only a name with V3.
The firm argued that its purpose-built Risk Oracle infrastructure, which streams hundreds of parameter updates monthly across Aave’s markets, cannot simply be ported to a new architecture. When the architecture is rewritten from scratch, Goldberg said, the risk infrastructure must follow, requiring significant new investment in tooling, simulations, and operational capacity.
Chaos also raised concerns about legal exposure, noting there is no regulatory framework or safe harbor for DeFi risk managers and that liability remains undefined if something goes wrong.
Knowledge Drain
In a section titled “The Ship of Theseus,” Goldberg warned that the accumulated knowledge base behind Aave’s operation is being hollowed out.
“Core contributors who built and operated V3 have departed. Most of the accumulated operating knowledge that kept Aave running through three years of live markets has left with them,” he wrote.
He noted that migrating from V3 to V4 doesn’t halve the workload but doubles it, since both systems must be operated simultaneously during a transition that could take months or years.
He also highlighted that during the tenure of its current contributors, Aave grew from $5.2B to more than $26B in TVL, processed over $2B in liquidations, and facilitated more than $2.5T in cumulative deposit volume — all with zero material bad debt.
Governance Crisis Deepens
The departure caps a tumultuous stretch for Aave governance.
The dispute between the DAO and Aave Labs has been escalating since December, when a clash over fee distribution and tokenholder rights erupted on the governance forum.
That was followed by Aave Labs’ contentious “Aave Will Win” proposal requesting $51 million in development funding, which narrowly passed but exposed deep divisions among delegates.
Chaos Labs said it would follow up with a structured offboarding proposal to support continuity during the transition.
AAVE is trading near $96, up 5% in the past 24 hours amid a broader market rally, but down roughly 73% from its August 2025 high of $356.
This article was written with the assistance of AI workflows. All our stories are curated, edited and fact-checked by a human.
Polymarket USD replaces bridged USDC as part of an exchange-wide upgrade.
Polymarket on Monday unveiled Polymarket USD, a proprietary collateral token backed 1:1 by USDC that will replace bridged USDC.e as the settlement asset across the on-chain prediction market.
The new token is the centerpiece of what Polymarket called its most significant infrastructure change to date — a full exchange upgrade spanning new smart contracts, a rebuilt central limit order book, and updated developer SDKs, all rolling out over the next two to three weeks.
For most users, the frontend will handle wrapping automatically with a one-time approval prompt, Polymarket said. Power users and API traders will need to wrap their USDC or USDC.e into the new token via a Collateral Onramp contract.
Exchange Upgrade
Alongside the collateral migration, Polymarket is deploying CTF Exchange V2, an upgraded version of its core smart contract. The new contracts optimize trade matching, add support for EIP-1271 signatures, introduce builder codes for on-chain order attribution, and streamline fee collection and distribution, according to a developer breakdown shared alongside the announcement.
All existing order books will be cleared during a short maintenance window, with the exact date and time to be announced at least one week in advance.
Scaling for Growth
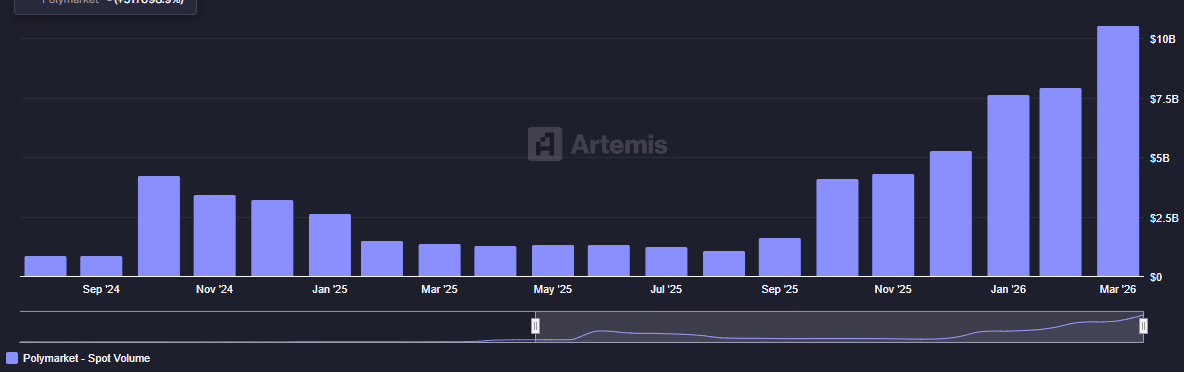
The overhaul arrives as Polymarket processes record volumes. The platform crossed $10 billion in monthly volume in March, its highest ever, according to Artemis. Weekly notional volume has consistently exceeded $1 billion through the first quarter.

The infrastructure push follows a series of milestones, including NYSE parent ICE’s $600 million follow-on investment and the launch of traditional asset markets via Pyth Network.
This article was written with the assistance of AI workflows. All our stories are curated, edited and fact-checked by a human.


On-chain researcher Andrey Sergeenkov found that only 2% of the 2.5 million wallets analyzed have ever made over $1,000.
84.1% of all Polymarket traders are in the red, according to new research published today, April 6, by independent on-chain analyst Andrey Sergeenkov.
The report looked at 2.5 million wallet addresses, analyzing data from on-chain transactions on Polygon, via Dune Analytics. Sergeenkov found that over the past year, only 2% of traders have ever made more than $1,000 in their entire history on the platform, and just 0.033% — or 840 addresses — have earned $100,000 trading on Polymarket.
Sergeenkov also took on the claim that traders can earn a living on Polymarket, analyzing the odds of consistently earning $5,000 per month — just below the average monthly salary in the U.S. — and found that those odds are less than 1% in any single month.
Sustaining profits is even rarer. “Most traders show up, trade for a short period, and leave,” the report summarizes. The odds of earning $5,000 a month drop with each consecutive month, the research found. Among the 6,600 traders who earned an average profit above $5,000 per month, just 2.6% stayed active for more than a year.
A separate study from December 2025 analyzing 124 million trades on Polymarket found that 70% were unprofitable.
The findings land as Polymarket continues its mainstream commercial momentum, earlier this month becoming MLB’s exclusive prediction market partner, as The Defiant reported.
Polymarket is currently the largest on-chain prediction market platform, and the second-largest more broadly, with $9.8 billion in notional trading volume over the past 30 days, following Kalshi with $12.5 billion, per Token Terminal.
Meanwhile, a new referral program as of this month is set to drive another wave of retail signups via influencers — a dynamic Sergeenkov warns could deepen the loss problem without better user education.
Prediction market volumes grew 130x from 2024 through 2025, and the sector has received increasing regulatory attention, especially in the United States. In recent months, the Trump administration’s CFTC has taken a clear stance in favor of federal oversight of prediction market platforms via the agency, recently launching a sweeping review of the sector.
Adding another layer to Polymarket’s ambitions, the platform has also just today unveiled Polymarket USD, a new proprietary stablecoin set to replace bridged USDC.e as the platform’s collateral token, as part of what the platform is calling a significant infrastructure upgrade.
As The Defiant has reported, Polymarket’s crowd-sourced odds are increasingly cited as among the most accurate forecasting tools available, a reputation that sits uneasily alongside these numbers for individual traders.
This article was written with the assistance of AI workflows. All our stories are curated, edited and fact-checked by a human.

Bitcoin May Hit $110K as Strategy Absorbs Nearly 3x New BTC Supply

19 Injured at Louisiana Parade After Driver Plows Into Crowd

Ripple XRP News – SWIFT JUST HANDED RIPPLE THE KEYS TO 11,500 BANKS!!!


-

 NewsBeat4 days ago
Steven Gerrard disagrees with Gary Neville over ‘shock’ Chelsea and Arsenal claim | Football
-

 Business4 days ago
No Jackpot Winner and $194 Million Prize Rolls Over
-

 Fashion3 days ago
Weekend Open Thread: Spanx – Corporette.com
-

 Crypto World5 days ago
Gold Price Prediction: Worst Month in 17 Years fo Save Haven Rock
-

 Business21 hours ago
Three Gulf funds agree to back Paramount’s $81 billion takeover of Warner, WSJ reports
-
Crypto World6 days ago
Dems press CFTC, ethics board on prediction-market insider trades
-

 Sports2 days ago
India men’s 4x400m and mixed 4x100m relay teams register big progress | Other Sports News
-

 Business5 days ago
Login and Checkout Issues Spark Merchant Frustration
-

 Tech7 days ago
EE TV is using AI to help you find something to watch
-

 Sports6 days ago
Tallest college basketball player ever, standing at 7-foot-9, entering transfer portal
-
Tech7 days ago
Daily Deal: StackSkills Premium Annual Pass
-

 Tech7 days ago
Flipsnack and the shift toward motion-first business content with living visuals
-

 Sports7 days ago
Women’s hockey camp eyes fitness boost, tactics ahead of WC 2026 campaign | Other Sports News
-

 Crypto World7 days ago
U.S. rule change may open trillions in 401(k) funds to crypto
-

 Tech6 days ago
How to back up your iPhone & iPad to your Mac before something goes wrong
-

 Politics7 days ago
Usha Vance: Disney Hats Over MAGA Caps?
-
Crypto World7 days ago
Valinor raises $25m to put private credit on-chain
-

 Business7 days ago
Functional benefits brewing in coffee innovation
-

 Tech7 days ago
What Are The Biggest Limitations Of Supercomputers?
-

 Crypto World6 days ago
Bitcoin enters the public bond market as Moody’s gives a first-of-its-kind crypto deal a rating
You must be logged in to post a comment Login