
Crypto World
Bitcoin slips to $64,000 as oil rally and ETF outflows pressure BTC



Key takeaways
- Bitcoin trades below $64,000 as stalled US-Iran negotiations weaken demand for risk-sensitive assets.
- Rising oil prices are increasing inflation concerns and expectations of another Federal Reserve rate hike.
- US spot Bitcoin ETFs recorded $144.67 million in net outflows on Monday, ending a five-day inflow streak.
Bitcoin (BTC) is struggling below $64,000 at the time of writing on Tuesday as rising oil prices and uncertainty surrounding the US-Iran negotiations weigh on market sentiment.
Weakening institutional demand has added to the pressure. US spot Bitcoin exchange-traded funds recorded net outflows at the beginning of the week, ending a five-day run of positive flows.
The combination of geopolitical uncertainty, renewed inflation concerns and softer ETF demand is keeping investors cautious and limiting Bitcoin’s ability to recover.
US-Iran deadlock pushes oil prices higher
Negotiations between the United States and Iran over a potential peace agreement and the reopening of the Strait of Hormuz appear to have reached an impasse.
US President Donald Trump responded to Iran’s conditions for a peace agreement with additional demands on Monday, including compensation for people killed in wars, attacks and protests, according to Reuters.
The rhetorical escalation could complicate diplomatic efforts and delay the reopening of the Strait of Hormuz, a critical route for global energy shipments.
Concerns about prolonged disruption have pushed oil prices higher while pressuring risk-sensitive assets such as Bitcoin.
A sustained increase in energy prices could lift production and transportation costs, creating renewed inflationary pressure. Higher inflation could give the Federal Reserve more reason to maintain restrictive monetary policy or raise interest rates.
Expectations of another Federal Reserve rate increase have strengthened alongside the rally in oil prices.
The CME FedWatch Tool shows that market participants are pricing in a 51.3% probability of a 25-basis-point rate hike at the Fed’s September meeting. That figure has increased from 44.1% on Friday.
Higher interest rates generally reduce demand for speculative assets by increasing borrowing costs and making interest-bearing investments more attractive. As a result, rising rate-hike expectations could continue to limit Bitcoin’s upside.
However, expectations could shift again in response to incoming inflation, employment and economic-growth data.
Institutional demand for Bitcoin began the week on a weaker footing. US spot Bitcoin ETFs recorded $144.67 million in net outflows on Monday, according to SoSoValue. The withdrawal ended five consecutive trading days of net inflows.
ETF flows are closely watched because they provide insight into demand from institutional and traditional-market investors. Sustained inflows can support Bitcoin by increasing spot-market buying, while persistent outflows can add selling pressure.
Monday’s outflow does not necessarily establish a broader trend. However, additional withdrawals throughout the week could deepen Bitcoin’s correction and further weaken investor sentiment.
Bitcoin price remains below key moving averages
Bitcoin trades near $63,916 at the time of writing on Tuesday after falling 1.44% during the previous session.
The cryptocurrency remains below a cluster of important Exponential Moving Averages, maintaining its bearish near-term structure.
The 50-day EMA at $64,625 represents Bitcoin’s nearest resistance. Above that level, the 100-day EMA at $66,795 and the 200-day EMA at $72,045 create additional barriers.
With all three moving averages positioned above the current price, BTC faces substantial resistance during any recovery attempt.
Momentum indicators also show a lack of decisive buying pressure. The Relative Strength Index stands near 48, slightly below its neutral midpoint of 50.
Meanwhile, the Moving Average Convergence Divergence line remains marginally below zero and close to its signal line. The setup reflects weak and largely directionless momentum rather than a confirmed bullish reversal.
Bitcoin must reclaim the 50-day EMA at $64,625 to improve its short-term outlook. A sustained break above this level could allow buyers to target the 100-day EMA at $66,795.

Further gains would bring the 200-day EMA at $72,045 into focus, followed by the broader horizontal resistance at $75,719.
On the downside, Bitcoin’s immediate support is located at $62,345. Buyers may attempt to defend this level if geopolitical and macroeconomic pressures continue.
A decisive daily close below $62,345 would strengthen the bearish outlook and potentially trigger a deeper correction toward the yearly low of $57,800, established on July 1.



XRP price prediction shows the asset trading at $1.006, down -3.2% on the day, hovering just above the psychological $1 line that traders keep circling like it’s the last life raft on a sinking deck. That’s the withheld part of this setup;
the token everyone expects to bounce is instead grinding against the floor while its peers rally. Something has to break, and the direction of that break decides whether XRP is setting up for a Wave 3 run or another leg down into deeper support.
Analyst EGRAG CRYPTO laid out a roadmap in a recent chart post showing XRP needs to clear $1.30–$1.60, then $1.96, to validate a Wave 3 move toward $3.00–$3.60.
Support sits at $1.00–$0.95, then $0.75, then $0.60–$0.52 if things get ugly. Meanwhile That Martini Guy flagged something odd: Bitcoin, Ethereum and Solana bounced last week while XRP fell about 5%, despite continued ETF inflows.
XRP Price Prediction: Can Ripple Hit $1.30 This Week?
XRP price prediction shows the asset trading at $1.006, off 1.34% in 24 hours, with a session range between $1.0038 and $1.0218, a tight band that signals indecision rather than conviction.
TradingView pegs the next resistance at $1.06, with upside targets stacked at $1.35 and $1.64 if momentum shifts. CoinGecko data shows XRP’s 24h low and high sitting right around the current price, confirming the market is coiled, not trending.
The bull case: XRP reclaims $1.06, then pushes through $1.30–$1.60 to confirm Wave 1’s high broke; that’s the trigger EGRAG CRYPTO says validates Wave 3 toward $3.00–$3.60.
The base case: XRP chops between $0.95 and $1.06 while the market waits for a catalyst. The bear case: $1.00 fails as support, sending price toward $0.75 and eventually the $0.60–$0.52 zone. For deeper context on the support structure, this technical breakdown maps out the bull, base, and bear scenarios in more detail.
Bitcoin Hyper Targets Early Mover Upside as XRP Tests Key Levels
XRP holders watching the $1 line know the pain of being early to a chart that refuses to move. Ripple’s ETF demand and rising RWA activity on the XRP Ledger have tokenized assets jumping to $4.06Bn across 373 assets from just $73M in January 2025, building a strong fundamental case, but price confirmation is a different beast entirely.
Waiting on Wave 3 to prove itself is a multi-week bet, not a trade. That’s pushed some capital rotation toward earlier-stage infrastructure plays where the upside math isn’t already capped by a multi-billion-dollar market cap.
Bitcoin Hyper ($HYPER) is building the first Bitcoin Layer 2 with full SVM integration, aiming to deliver smart contract speed faster than Solana itself while anchoring security to Bitcoin’s base chain.
The presale has raised $33,022,820.14 at a current token price of $0.0136845, with staking rewards live at launch (exact APY undisclosed). Its Decentralized Canonical Bridge targets one of Bitcoin’s biggest gaps, programmability, without sacrificing the network’s trust layer.
Visit the Bitcoin Hyper Presale Website Here.
This is not financial advice. Crypto markets are highly volatile and unpredictable. Always conduct independent research before making any investment decisions.
The post XRP Price Prediction: Ripple Sits at 18-Month Support Level, Will $1 Hold? appeared first on Cryptonews.


Two Prime’s loan to MARA carries a fixed interest rate of 7.65% and matures in August 2028. Blume said borrowing demand has increased in recent months, with institutions tapping bitcoin holdings to finance capital expenditure while retaining exposure to the asset.
The structures are also becoming more sophisticated. Recent regulatory filings show agreements with detailed provisions covering margin calls, collateral custody and liquidation, alongside a wider range of loan sizes and maturities.
Lenders including Ledn and Kraken have also expanded the market through asset-backed securities and warehouse facilities linked to bitcoin collateral, according to Blume.
The development could have implications beyond bitcoin lending as more financial assets move onto blockchain-based infrastructure.
“This core competency will grow increasingly relevant as the broader financial system comes on-chain,” Blume said, pointing to tokenized equities as one potential area of growth.
As more publicly traded companies add bitcoin to their balance sheets, the ability to borrow against those holdings is emerging as an increasingly important part of digital-asset corporate finance.
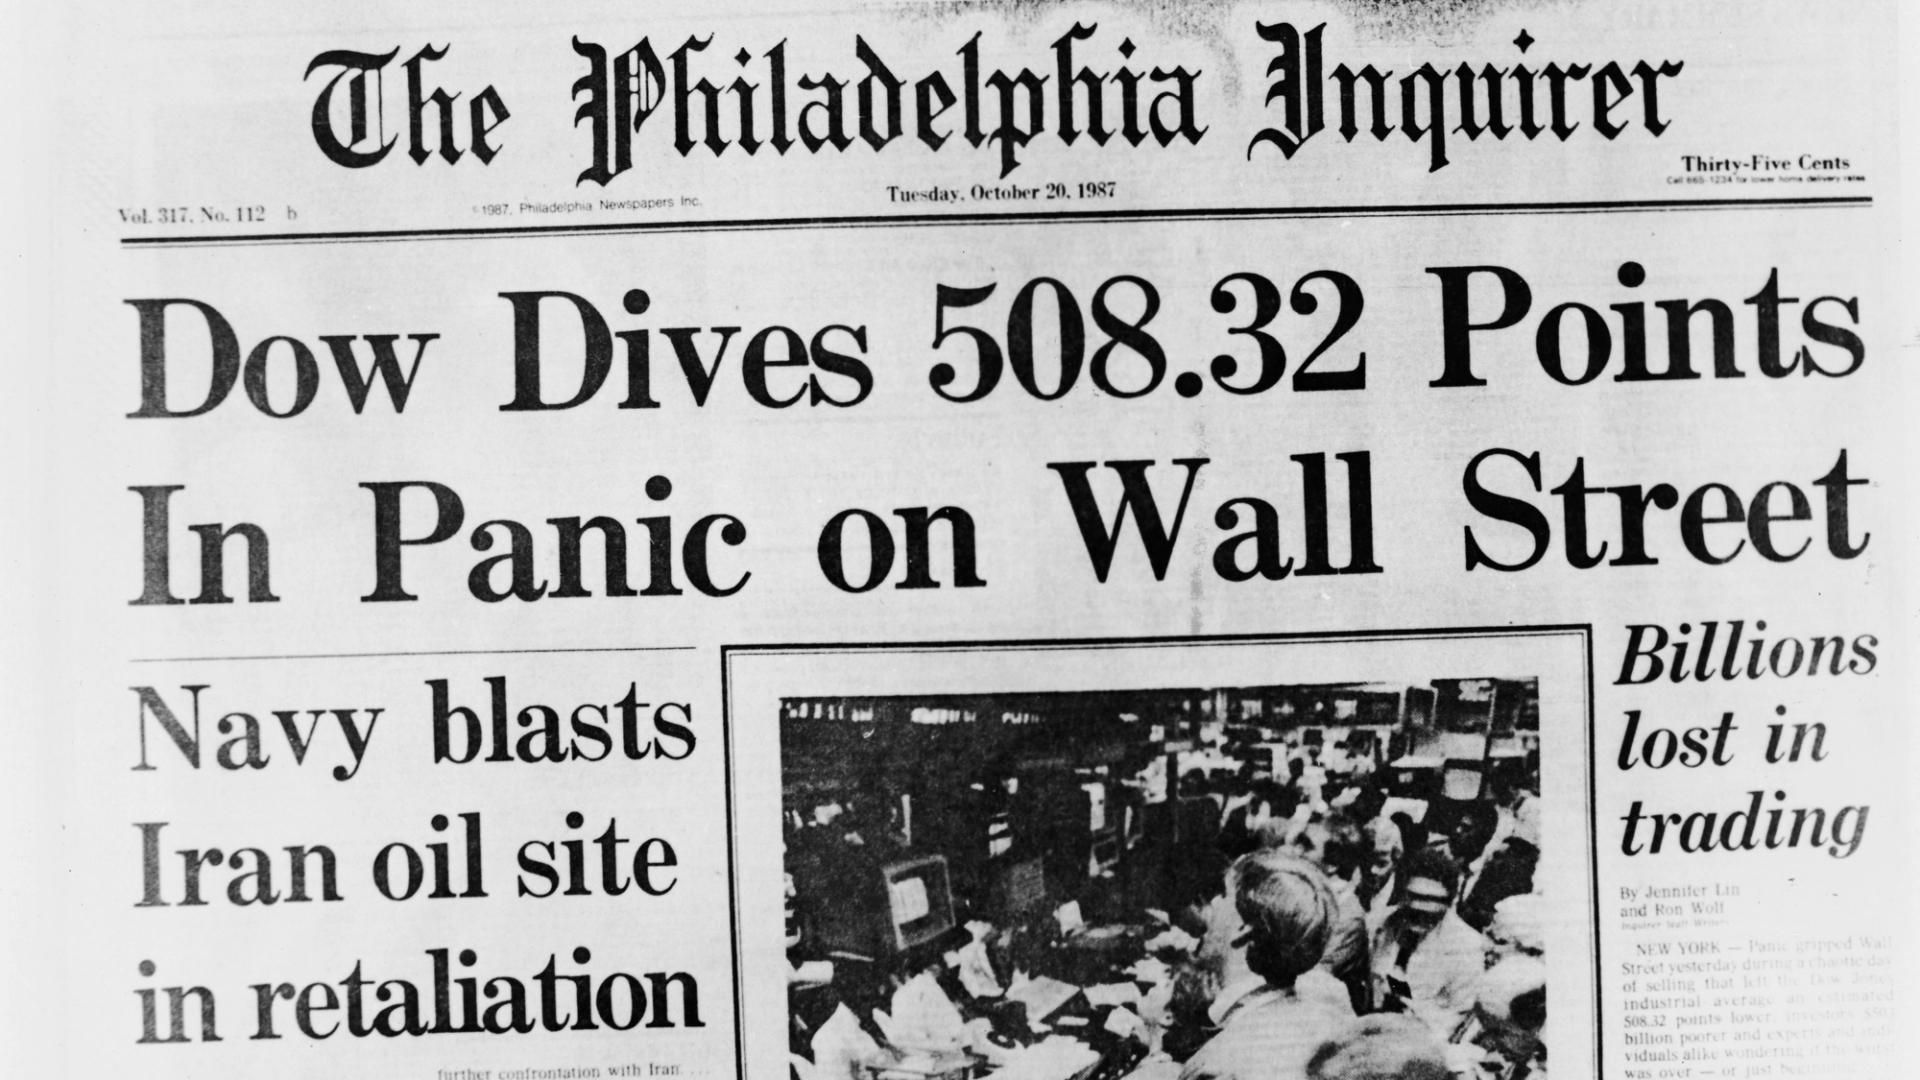
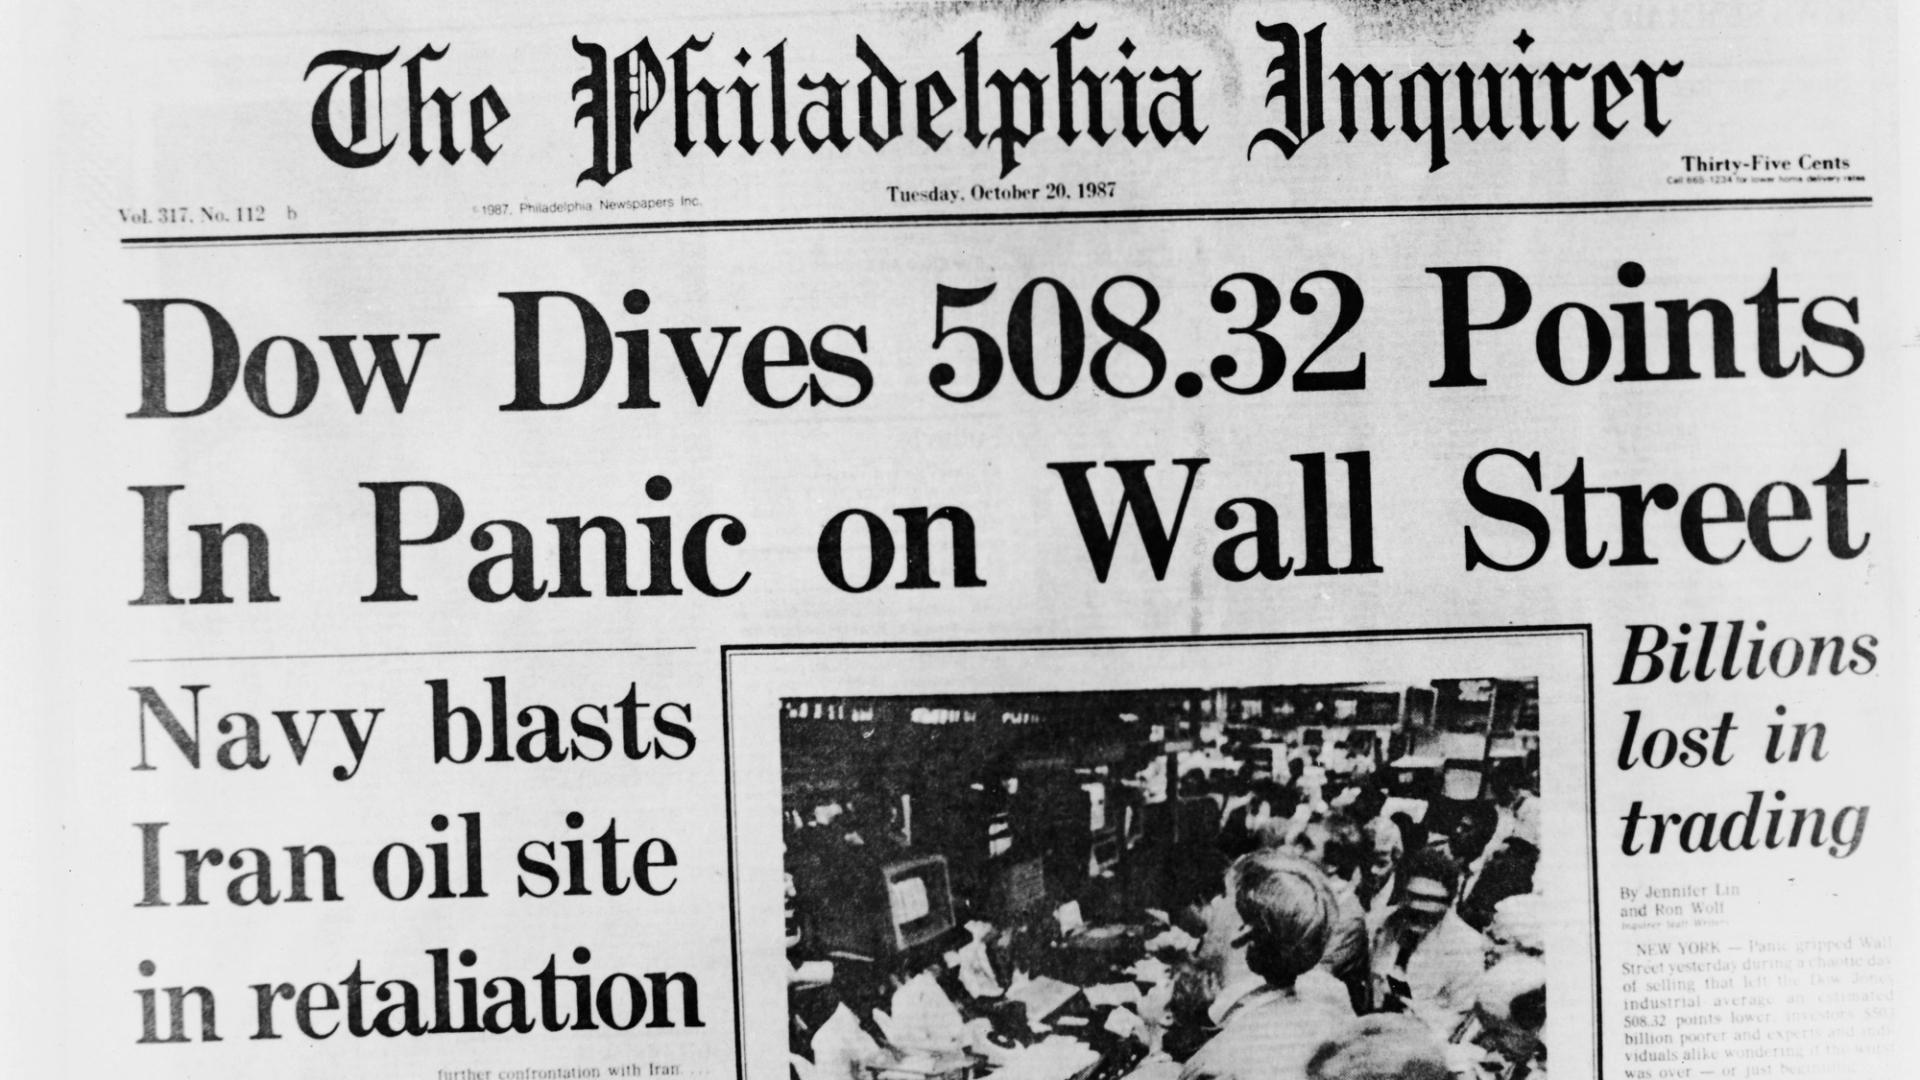
Financial markets’ risk-free rate, the yield on U.S. Treasury securities, is rising again. Crypto maximalists often dismiss this as background noise, but when the rate rises sharply, it often competes for capital with stocks and other assets. History shows that the resulting market adjustments tend to be painful.
Jurrien Timmer, director of global macro at Fidelity Investments, highlighted this dynamic in an X post, noting that rising Treasury yields from the 1960s through the mid-1990s made government bonds competitive with equities.
Investors who ignored the higher opportunity cost of capital learned the hard way from the 1987 crash, known as Black Monday. The Oct. 19 crash sent the Dow Jones Industrial Average plunging by 508.32 points, or 22.6%, in a single day. It’s still the largest one-day percentage drop in history.
Timmer’s reminder is timely, as yields have generally been rising since the Covid market crash in 2020, echoing the beginning of the multi-decade uptrend that started in the late 1950s. Right now, the 30-year yield is hovering at its highest level since 2007 and could rise further if Wednesday’s U.S. CPI beats estimates, validating higher-for-longer Fed interest-rate expectations.
Disclosure: This article does not represent investment advice. The content and materials featured on this page are for educational purposes only.
As XRP volatility persists, EX DeFi is attracting holders seeking passive income through cloud mining while maintaining long-term exposure to their digital assets.
Summary
- EX DeFi is attracting XRP holders seeking cloud mining income while maintaining their long-term digital asset positions.
- The platform offers automated mining contracts for assets including XRP, BTC, ETH and DOGE without requiring users to manage physical hardware.
- EX DeFi promotes diversified digital asset strategies as XRP holders look beyond price appreciation for potential passive income.
Last week, XRP trading volume and ETF inflows saw a marked decline — with ETF inflows dropping by 93% — further fueling investor caution.
Despite an improving regulatory environment for XRP, positive developments have not yet triggered a significant price surge. As ETF inflows slowed sharply, market demand for XRP waned, with institutions shifting some capital toward mainstream digital assets like Bitcoin and Ethereum.
While ETF approvals boosted XRP visibility, the 93% drop in inflows indicates that new capital entering the market is significantly lower than during periods of strong performance. The market may interpret this shift as a slowdown in institutional allocation, profit-taking by some investors, or a temporary rotation of funds into lower-risk assets.
Driven by market sentiment, XRP price retreated to recent lows, causing its market capitalization to shrink and resulting in the temporary loss of its position as the world’s fourth-largest digital asset. Heightened short-term volatility has prompted some investors to re-evaluate their XRP investment strategies.
Meanwhile, an increasing number of XRP holders are exploring alternative ways to generate returns and hedge against price pullbacks. Is it possible to mitigate the impact of short-term volatility while generating consistent, additional income from their XRP holdings?
Against this backdrop, the EX DeFi cloud mining platform is attracting growing investor interest. Through a cloud mining yield aggregation mechanism, users can explore diversified income streams, hedge against market volatility, and boost returns—moving beyond a sole reliance on XRP price appreciation.
Despite slowing ETF inflows, long-term prospects remain a focus
Although the recent slowdown in XRP ETF inflows has sparked concerns regarding short-term capital flows, this shift primarily reflects a decline in market risk appetite; it cannot serve as the sole basis for assessing XRP long-term fundamentals.
With Ripple securing MiCA authorization in Europe and the continued expansion of stablecoin and asset tokenization services via RLUSD and Ripple Mint, the infrastructure of the XRP ecosystem continues to mature. Simultaneously, developments on the XRP Ledger — particularly in areas like asset tokenization — are creating new use cases and potential avenues for growth within the ecosystem.
Despite a recent dip in secondary market trading activity and cautious sentiment among retail investors, demand for long-term digital asset allocation remains strong. As regulatory frameworks continue to mature, XRP future development remains a focal point for the market.
XRP volatility intensifies; EX DeFi emerges as a new option for investors
Amidst recent heightened volatility in XRP prices, an increasing number of XRP holders are turning to EX DeFi. They seek a way to generate stable passive income through a sustainable cloud mining model while maintaining their long-term digital asset holdings.
Compared to high-volatility leveraged trading or strategies that rely solely on price appreciation, EX DeFi cloud mining platform offers a more convenient way to engage with digital assets. Users do not need to deploy mining hardware or bear maintenance costs; they simply select a computing power contract that suits their needs to participate in the mining service.
About EX DeFi
Founded in 2021 and headquartered in the UK, EX DeFi operates in compliance with European regulatory frameworks such as MiCA and MiFID II. The platform continuously enhances transparency, operational standards, and user protection mechanisms, striving to provide a seamless digital asset service experience.
The platform employs a multi-layered security architecture, featuring:
- Annual financial and security compliance audits by PwC
- Digital asset custody insurance from Lloyd’s of London
- Enterprise-grade cybersecurity protection from Cloudflare and McAfee®
- Multi-layer encryption architecture, AI-driven risk management, and two-factor authentication (2FA)
How to earn daily rewards with EX DeFi
1: Register an Account
Visit the official EX DeFi website and sign up for free using an email address. New users receive a $17 bonus and can begin automated mining immediately.
2: Deposit Cryptocurrency
The platform supports various mainstream cryptocurrencies, including XRP, BTC, ETH, USDT, LTC, USDC, BCH, DOGE, and SOL. The deposit process is clear, transparent, and secure.
3: Select a Mining Contract
Choose a mining plan that fits a particular budget. The minimum deposit is just $100. Mining begins automatically once the system is activated.
4: Automatically Receive Daily Rewards
The platform offers 24/7 intelligent mining services and automatically distributes daily rewards. Users can easily earn passive income without any manual intervention.
Mining Contract Examples
BTC (Novice Trial Contract): Investment $100, Duration: 2 days, Daily Return: $4, Total Profit: $100 + $8
DOGE (Golden Shell Mini-Doge Pro): Investment $500, Duration: 6 days, Daily Return: $6.5, Total Profit: $500 + $39
BTC (Canaan-Avalon-A1466): Investment $1,000, Duration: 10 days, Daily Return: $13.4, Total Profit: $1,000 + $134
LTC (Bitmain Antminer L7): Investment $5,000, Duration: 20 days, Daily Return: $73.5, Total Profit: $5,000 + $1,470
BTC (Bitmain S19K-Pro): Investment $10,000, Duration: 30 days, Daily Return: $161, Total Profit: $10,000 + $4,830
Click here to visit the official EX DeFi website for more details on mining contracts.
Conclusion
Although the pace of institutional capital allocation into XRP ETF has recently slowed — indicating that investors remain cautious regarding current market risks — ETF capital flows are only one factor influencing XRP market performance. Ripple continued progress in areas such as regulation, stablecoins, asset tokenization, and the XRP Ledger ecosystem still provides a foundation worth watching for XRP long-term development.
For long-term XRP holders, short-term price volatility is difficult to avoid entirely. While keeping an eye on XRP’s future price performance, improving the utilization efficiency of digital assets through more diversified asset management strategies is also becoming a key focus for the market. The cloud mining yield aggregation mechanism of the EX DeFi platform offers XRP holders a new way to participate in the digital asset ecosystem and generate passive income.
Visit the official website now to start the cloud mining journey and earn up to $7,500 in stable daily income while mitigating the risks associated with XRP price volatility.
Disclosure: This content is provided by a third party. Neither crypto.news nor the author of this article endorses any product mentioned on this page. Users should conduct their own research before taking any action related to the company.

Cardinal Health (CAH) stock edged higher early Tuesday after the medical wholesaler reported adjusted earnings of $2.91 per share on $63.7 billion in fiscal fourth-quarter sales. On average, analysts polled by FactSet expected Cardinal to earn $2.42 a share and report $65.2 billion in sales. During the year-earlier period, Cardinal Health reported $2.08 earnings per share on $60.2 billion in…
Copyright ©2026 Investor’s Business Daily, LLC. All rights reserved. 87990cbe856818d5eddac44c7b1cdeb8


“No major financial center has yet built a framework that treats tokenized equities simultaneously as securities, blockchain-native tokens, and DeFi-composable assets,” said Brett Tejpaul, co-CEO of Coinbase Institutional, the exchange’s arm focused at institutional digital asset investors.
Coinbase have already established a footprint in United Arab Emirates before Tuesday’s regulatory approval. In 2023, the firm’s asset management arm initiated Project Diamond to let institutional investors issue and trade digital debt instruments using Base, Coinbase’s Ethereum-based blockchain network. Last, month, Mubadala Capital, the asset management arm of Abu Dhabi’s sovereign wealth fund, tokenized one of its private-market investment strategies through UAE-based infrastructure provider KAIO on blockchain including Base, with Coinbase itself taking exposure to the fund.
The Abu Dhabi operation will sit alongside Coinbase’s derivatives business in Dubai, the company said, giving it two bases in the UAE for expanding businesses outside the U.S.


Key takeaways
- Stellar has fallen below a critical support zone.
- The long-to-short ratio for XLM has declined to 0.94 and 0.90, respectively.
- The funding rate for XLM has turned negative, reflecting stronger demand for short positions.
XLM continues to underperform
Stellar (XLM) remains under pressure on Tuesday after recording modest declines during the previous session. XRP is drifting toward the psychologically important $1.00 level, while XLM has slipped below a key support zone.
Weakening derivatives-market indicators are limiting the prospects of an immediate recovery for XLM. Declining long-to-short ratios, negative funding rates and rising open interest suggest that traders are increasingly positioning for further price declines.
XLM’s long-to-short ratio has fallen to 0.90 on Tuesday, approaching its lowest level in more than a month.
A ratio below one indicates that short positions outnumber long positions, meaning more traders are betting that the assets will decline. The current readings suggest that bearish sentiment is particularly strong among XLM traders.
The falling ratios also indicate that confidence in a near-term rebound is weakening as both assets struggle to recover from their recent losses.
XLM technical forecast: XLM could dip to $0.1500
Stellar (XLM) trades near $0.161 on Tuesday, extending its decline below the short- and medium-term Exponential Moving Averages. The current structure keeps XLM’s near-term outlook bearish as buyers struggle to regain control.
The token remains below the descending trendline breakout level at $0.166, which now acts as immediate resistance. Its Relative Strength Index stands near 35, indicating weak buying momentum without placing XLM in technically oversold territory.
The Moving Average Convergence Divergence indicator also remains below its zero line, reinforcing the downside bias as XLM consolidates beneath its key moving averages.
If a recovery begins, XLM must first reclaim the descending trendline near $0.166. A sustained move above that level could allow buyers to challenge the horizontal resistance at $0.177.

The 50-day EMA at $0.178 and the 100-day EMA at $0.181 create a concentrated resistance zone that could limit further gains. Above these levels, the 200-day EMA at $0.193 represents a broader bearish pivot. Reclaiming this moving average would be necessary to signal a more meaningful change in trend.
On the downside, XLM’s next major support is located at $0.142. A decisive break below this level could accelerate the current decline and expose the token to further losses before buyers attempt to establish a new price floor.
TRON (TRX) is winning as a stablecoin settlement rail even as its Decentralized Finance (DeFi) economy contracts, a divide that is quite evident through the second quarter of 2026.
Record payment flows keep moving across the network, yet that liquidity is largely skipping its trading and lending venues. The chain now prospers on one front while thinning on another.
TRON Stablecoin Volume Climbs as On-Chain DeFi Cools
Tether (USDT) supply on TRON reached $87.9 billion at quarter-end, surpassing Ethereum (ETH), according to a Messari report. The network processed $2.1 trillion in USDT transfers over the period.
TRON’s total stablecoin market cap grew 4.1% to a record $89.2 billion, with USDT holding a 98.5% share. Average daily transfer volume rose 4.3% to $22.8 billion.
The flows read as utility rather than speculation. Stablecoin velocity held at 0.26, meaning roughly a quarter of the supply changed hands each day, a level that has been steady for five straight quarters.
Network usage set records, too. TRON averaged 11.8 million daily transactions, up 8.7%, and 3.6 million daily active addresses, up 11.7%. It cleared a record 14.6 million transactions on June 15.
Follow us on X to get the latest news as it happens
DeFi and DEX Activity Move the Other Way
In contrast, the on-chain economy shrank. TRON’s DeFi total value locked (TVL) slipped 1.9% to $4.4 billion during the quarter. JustLend, the largest protocol, fell 10.5% to $2.9 billion, cutting its share of network TVL from 72.9% to 66.5%.

Average daily volume across TRON’s decentralized exchanges (DEXs) fell 21.7% to $49.3 million. It marked the fourth straight quarterly decline, even as the chain’s dominance in stablecoin payments expanded.
“The decline remains consistent with the broader cooldown in onchain spot trading rather than a TRON-specific structural trend,” the analysts said.
Network fees moved the opposite way, rising 15.9% to $699.4 million. That was the first quarterly increase since an August 2025 governance change cut the energy unit price.
TRX ended the quarter near $0.32, essentially flat after an 11.6% gain in Q1, and now trades around $0.33. The altcoin remains about 23% below its record high.

The split raises a question about what actually drives the token. Settlement demand keeps setting records while on-chain trading dries up.
The price outlook may hinge on whether payment dominance ever converts into value for the token itself.
Subscribe to our YouTube channel to watch leaders and journalists provide expert insights
The post TRON Moved $2.1 Trillion in USDT Last Quarter, Yet TRX Didn’t Budge appeared first on BeInCrypto.
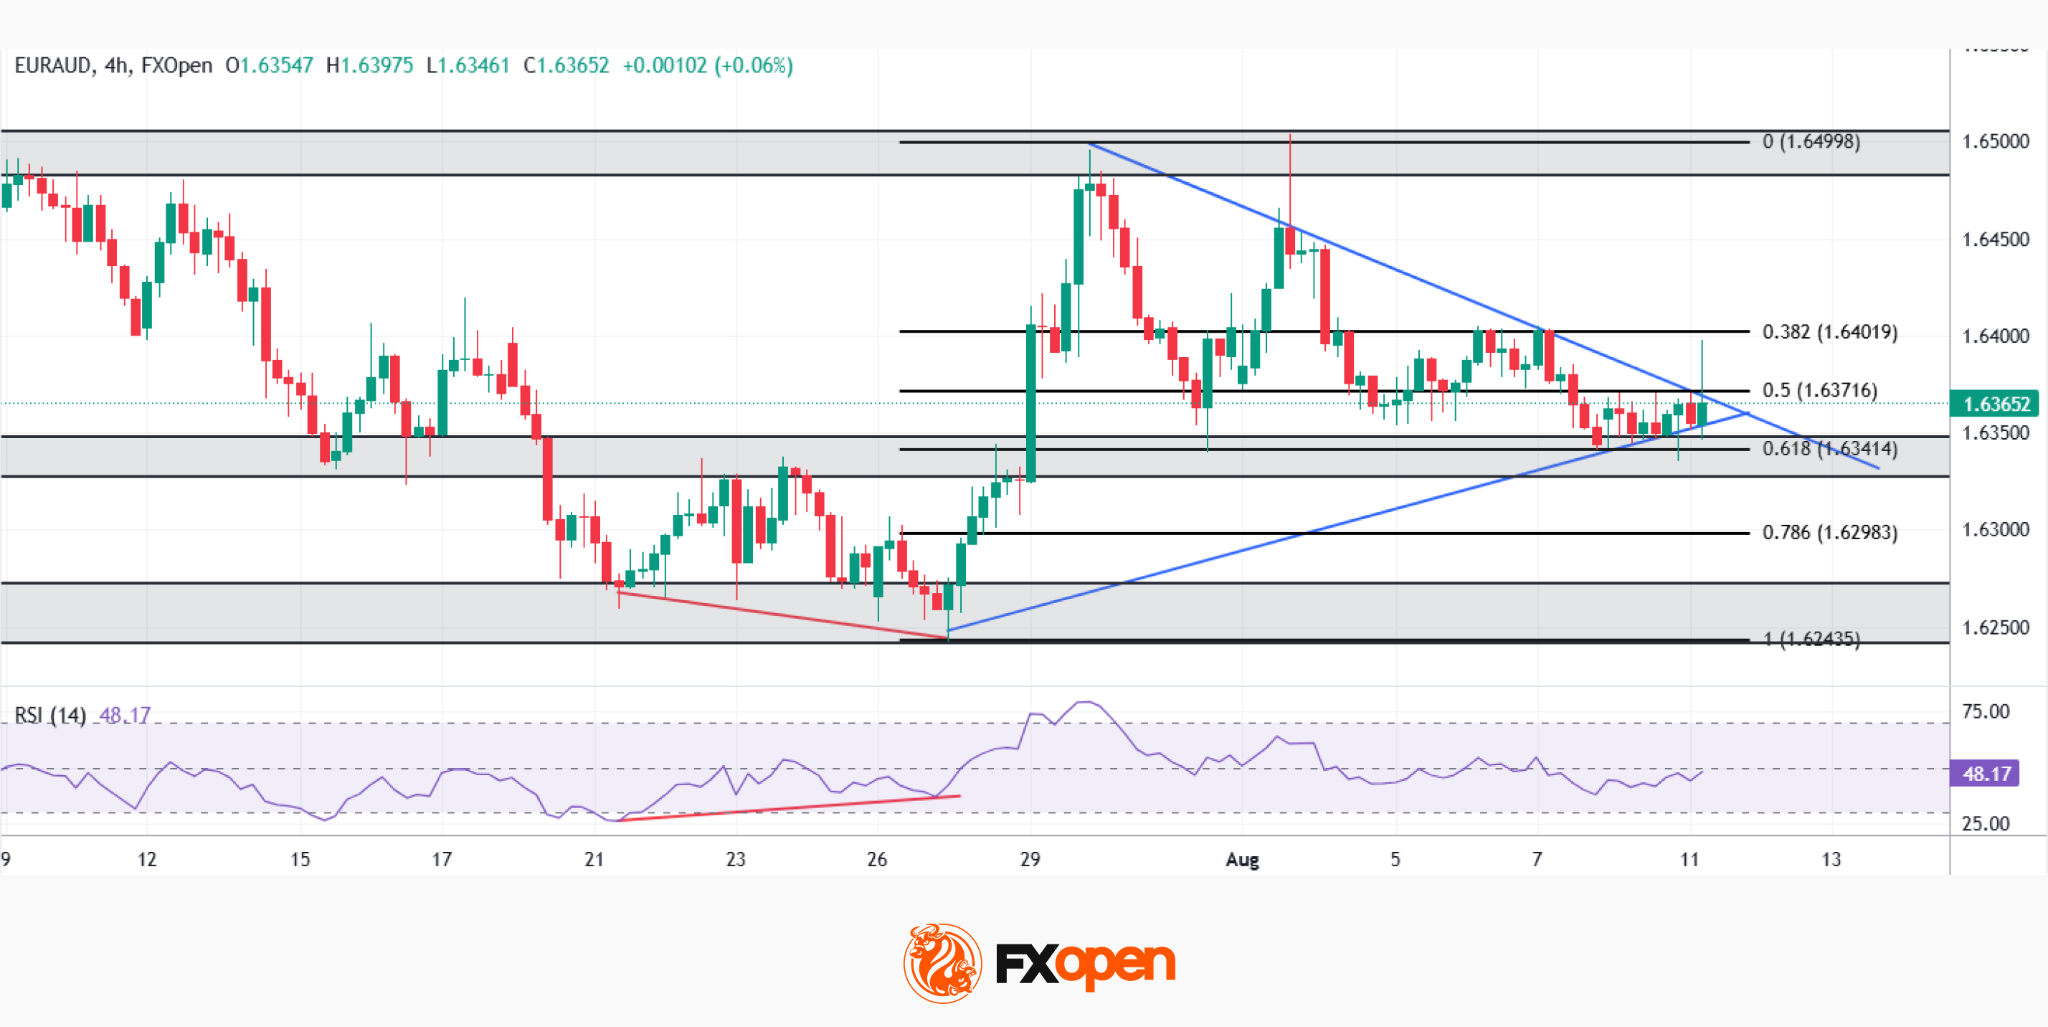
Overnight, the RBA held its cash rate steady at 4.35%, as widely expected after June’s inflation data came in softer than forecast at 3.8% headline. Yet the accompanying statement struck a notably cautious tone, warning that trimmed mean inflation remains elevated and largely unchanged from the March quarter, with oil and related commodities still trading above pre-conflict levels due to the ongoing Middle East crisis. With 55% of economists still expecting at least one further hike in 2026, the door to additional tightening remains firmly open.
The euro, meanwhile, holds a cautiously bullish tone after climbing to a seven-week high near $1.155 against the dollar. Eurozone Q2 growth of 0.4% offered support, though weaker retail activity and mixed inflation signals keep the ECB’s own path uncertain, with policymakers maintaining a deliberately cautious stance ahead of their September 15-16 meeting and giving no firm commitment to further hikes.
The result: two central banks in genuine holding patterns, each leaving the door open to more tightening while waiting for clearer data to justify the next move.
Technical Analysis of EUR/AUD
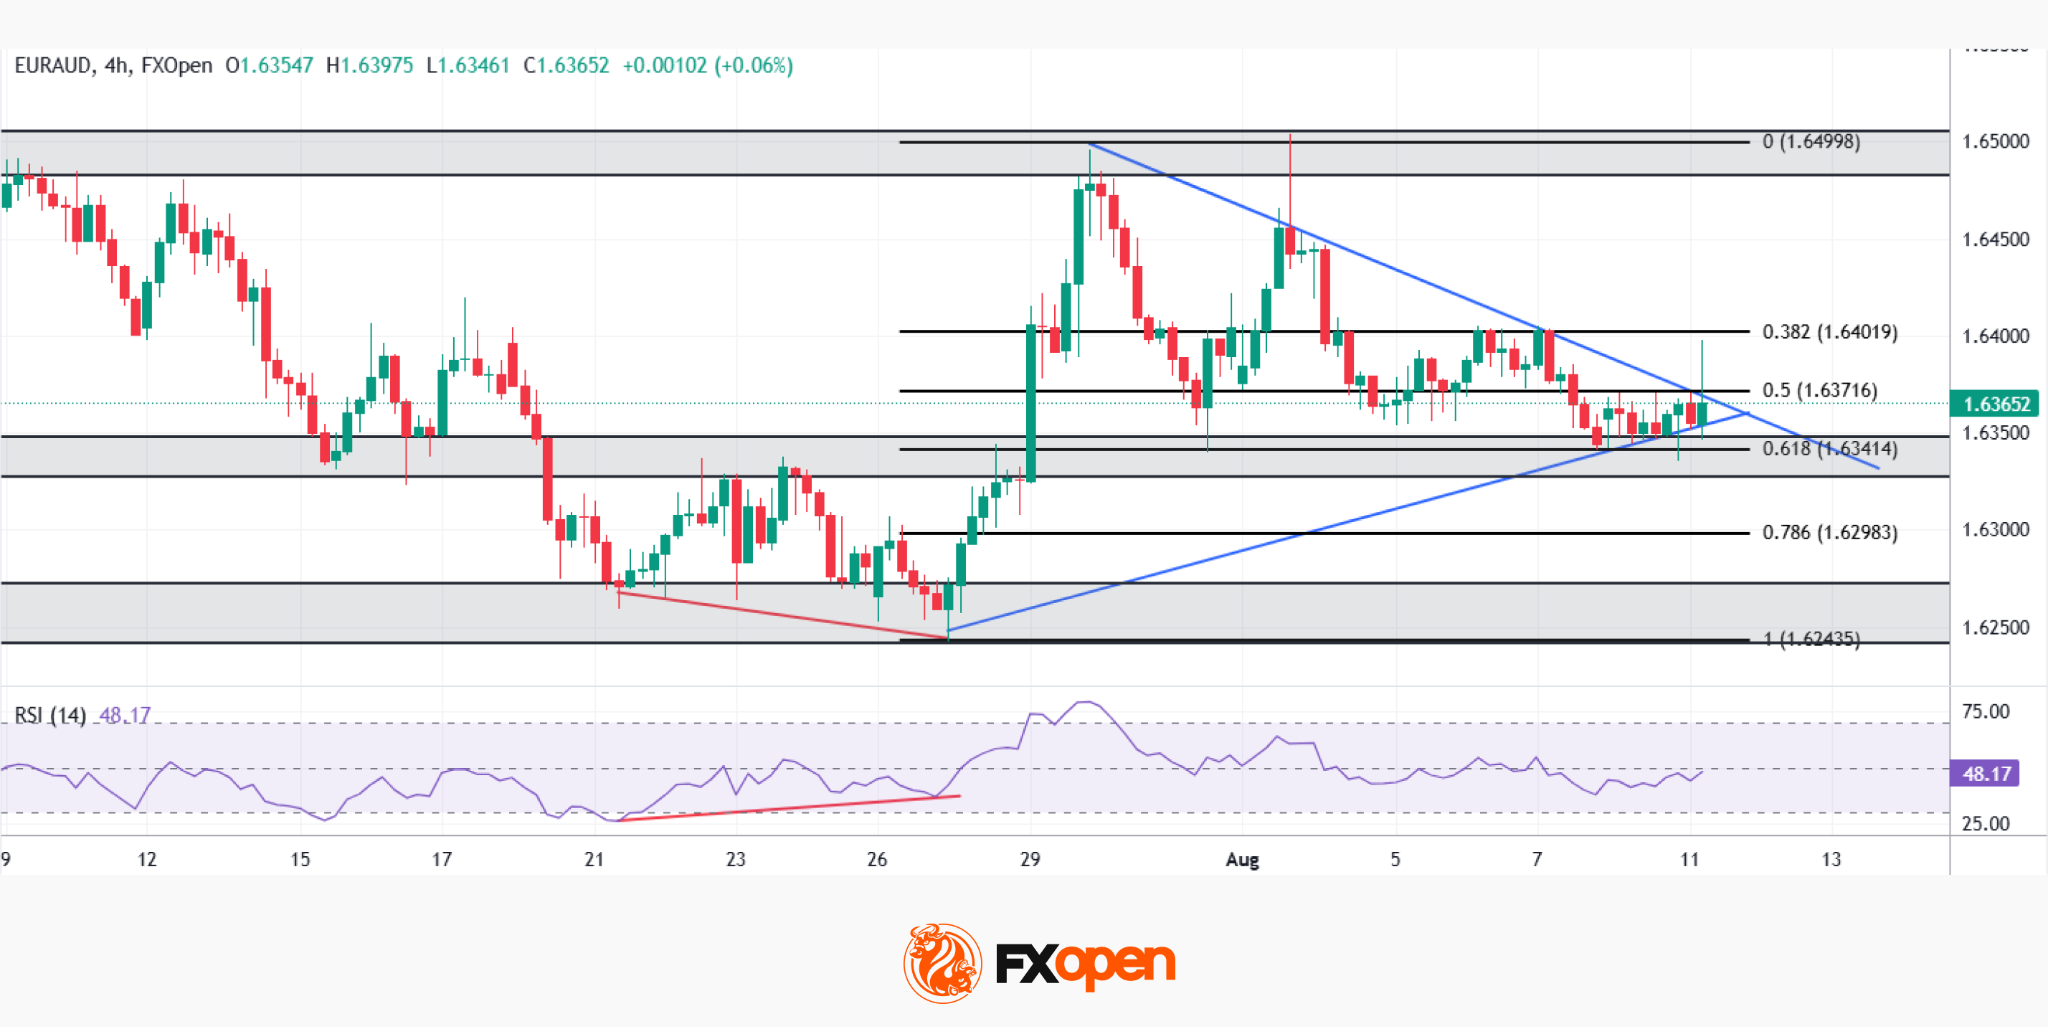
As EUR/AUD chart shows, the pair staged a strong rally from July’s lows near 1.6243, a move that followed a bullish RSI divergence, where price carved a lower low while the RSI printed a higher low. Since topping near 1.6500 in late July, price has been compressing into a symmetrical triangle, with a descending trendline and an ascending trendline converging right around the 0.5-0.618 Fibonacci zone near 1.6342-1.6372.
Bullish Scenario
Should buyers defend the ascending trendline and break above the descending one, the path would open toward the 0.382 retracement near 1.6402, with a stronger move potentially targeting a retest of the 1.6500 highs if momentum builds.
Bearish Scenario
Conversely, a break below the ascending trendline and the 0.618 retracement near 1.6341 would expose the 0.786 level near 1.6298, with a deeper slide risking a retest of the 1.6243 low that anchored the entire July rally.
With price coiled right at the apex of this triangle, and the RSI sitting in neutral territory after cooling from its earlier divergence, EUR/AUD looks poised for a decisive break—will the euro extend its late-July strength, or does the Aussie reclaim the upper hand?
Trade over 50 forex markets 24 hours a day with FXOpen. Take advantage of low commissions, deep liquidity, and spreads from 0.0 pips (additional fees may apply). Open your FXOpen account now or learn more about trading forex with FXOpen.
This article represents the opinion of the Companies operating under the FXOpen brand only. It is not to be construed as an offer, solicitation, or recommendation with respect to products and services provided by the Companies operating under the FXOpen brand, nor is it to be considered financial advice.
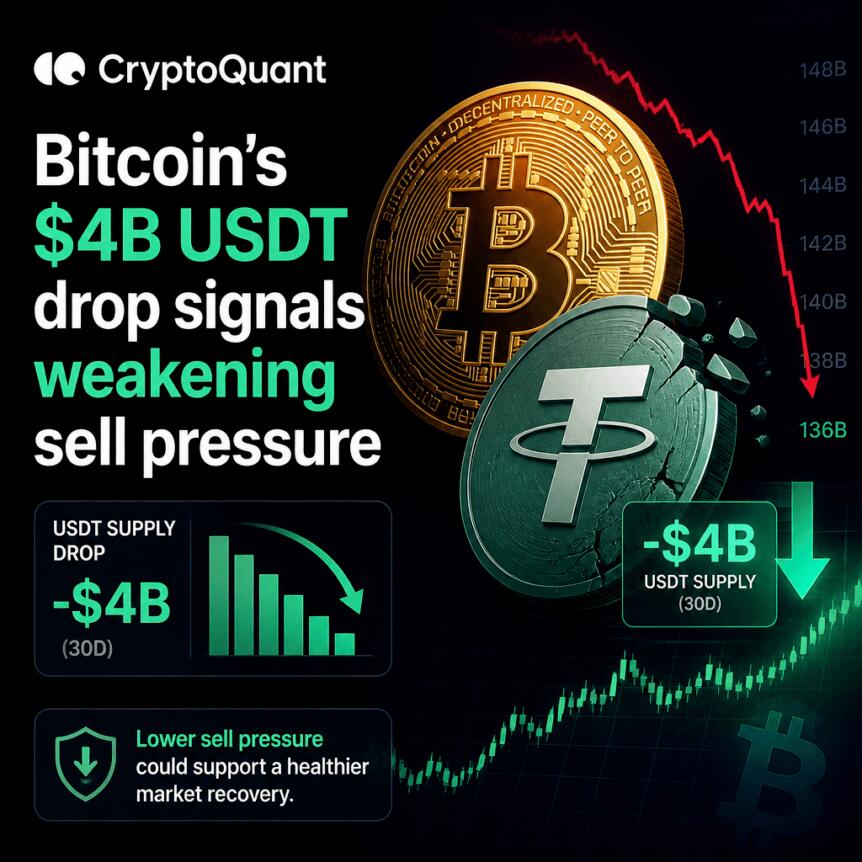
Bitcoin traders have increasingly looked to stablecoins for clues about where risk appetite is headed. A new data review from CryptoQuant highlights that Tether’s USDT has been shrinking in market value at an unusually fast pace—yet the same patterns in past bear markets suggest the selloff may be approaching its end.
According to CryptoQuant, USDT’s 60-day rolling market-cap change averaged about minus $4.88 billion as of Aug. 10, while the most recent 11-day window saw nearly $870 million of USDT supply disappear. The combination points to a liquidity retreat that typically pressures broader crypto performance, but it also aligns with the late-stage behavior of prior downturns.
Key takeaways
- CryptoQuant reports USDT’s 60-day market-cap contraction remains near $4 billion, one of its sharpest declines on record.
- Nearly $870 million of USDT supply vanished over the latest 11-day period, indicating the contraction is actively continuing.
- The steepest 60-day contraction phase previously peaked around July 13 at approximately minus $5.72 billion.
- CryptoQuant argues that the worst stablecoin drawdowns have historically occurred near exhaustion points rather than at the beginning of further acceleration.
- Weekly RSI divergence arguments from analysts like William Clemente echo a broader “late bear-market” narrative.
USDT contraction tightens crypto liquidity
In a CryptoQuant blog post published last week, the onchain analytics firm described USDT as undergoing “one of its sharpest contractions on record.” The emphasis is not just on the overall size of the decline, but on whether the process is still worsening.
CryptoQuant notes that the deterioration has accelerated “at the margin,” pointing to about $870 million in USDT disappearing over the latest 11-day period. It also frames the 60-day market-cap change metric as a way to gauge sustained redemption pressure rather than one-off redemptions.
From a market mechanics perspective, stablecoins often function as a bridge for capital across exchanges and trading pairs. When USDT supply contracts, liquidity can become less available, reducing the “dry powder” investors might use to buy dips—or to rotate into other risk assets.
CryptoQuant cautions, however, against assuming a clean cause-and-effect relationship between stablecoin flows and Bitcoin’s spot price. In its view, both can respond to the same broader risk-off conditions: redemptions may accelerate alongside spot selling, rather than predictively preceding it.
“The caution is that correlation between USDT flows and BTC price doesn’t settle causality,” CryptoQuant analysts said. They added that sustained USDT expansion has historically coincided with stronger Bitcoin price regimes, while prolonged contractions have aligned with weaker demand and deeper corrections.
Late-stage bear-market behavior, not necessarily a fresh leg down
The key analytical question for traders is whether the USDT drawdown is merely “history repeating” or whether it signals a new intensification of selling pressure. CryptoQuant’s answer leans toward the former.
Historically, the firm argues, the most pronounced phases of USDT contraction tend to occur toward the final chapters of macro downturns, when selling momentum begins to move closer to exhaustion than to further acceleration. In that framework, severe stablecoin redemptions become less a signal to short the next day and more an indicator that the market has already been tested heavily.
CryptoQuant also highlights a specific milestone in the recent contraction cycle: the steepest 60-day decline in USDT market cap completed on July 13, when it reached about minus $5.72 billion. That point matters because it offers a reference level for where “worst-case” pressure may have already been seen—meaning later readings could represent stabilization or easing rather than escalation.
Still, the data in the CryptoQuant update is not painting a picture of immediate normalization. The latest 60-day average remains close to the multi-billion-dollar contraction zone, suggesting liquidity conditions are tight even if selling intensity may be moderating at the margin.
RSI divergence arguments reinforce a “bottoming” thesis
While stablecoin contractions speak to liquidity and risk appetite, technical market indicators often shape how traders interpret timing. The CryptoQuant findings have added momentum to broader “late bear market” narratives, including comparative analysis that points to earlier cycle behavior.
Cointelegraph has reported that some market participants are increasingly aligning with the idea of a new Bitcoin macro bottom forming before the end of 2026, even if the near-term trend remains volatile. In the same broader discussion, independent analyst William Clemente has argued for a cautious “cheap but not done yet” view.
On Aug. 8, Clemente posted on X that he considers Bitcoin “cheap,” while allowing for the possibility of “a leg lower” at some point during the year. Two days later, he highlighted what he described as a bullish divergence between BTC/USD and the relative strength index (RSI) on weekly time frames.
That divergence is widely treated as a leading indicator in technical analysis—particularly because the strongest RSI divergence signals historically appeared during turning points, including at the end of the 2022 bear market. In Cointelegraph’s earlier coverage, RSI divergence was framed as a “classic” reversal signal that coincided with the conclusion of that drawdown cycle.
What to watch next: stablecoin flows and confirmation signals
If CryptoQuant’s interpretation is correct, the most concerning USDT drawdown phases may already have passed their peak, even if contraction continues in the background. For investors and traders, the practical question is whether the contraction rate keeps accelerating or whether it begins to flatten—especially relative to the steepest reading around July 13.
In the coming weeks, market watchers may want to track whether USDT’s 60-day market-cap change continues near minus $4 billion or starts moving toward less negative territory, as well as whether BTC’s technical picture—such as the weekly RSI divergence narrative—gets reinforced by actual trend stabilization rather than only indicator hints. The stablecoin/liquidity story may not be the sole driver of price, but it can shape how quickly the market regains the ability to absorb dips and rebuild demand.
ARC Raiders Trials: How to get Three Stars in ARC Raiders Trials: Season 5 Week 6 (August 11

Trump’s Financial Corruption, Explained

Asda announces major shake-up affecting 3,500 workers in UK


-

 Fashion4 days ago
Weekend Open Thread: Mattifying Sunscreen
-

 Fashion4 days ago
Frugal Friday’s Workwear Report: Cap-Sleeve Pointelle Crewneck Sweater
-

 Sports5 days ago
Jordan Coyle & Cordiamo take Laya Arena Stakes at RDS
-

 News Videos3 days ago
Can Astrology Help Find Gold and Silver Trends? A Financial Astrology Guide
-
 Business6 days ago
US stocks: Dow closes at record on Mideast optimism; SpaceX, AMD drag Nasdaq
-

 Politics5 days ago
Reform UK And Greens Sink To Lowest Favourability Ratings To Date
-

 Business7 days ago
Nvidia Stock Climbs 2.5% as Chip Sector Rally Builds Ahead of AMD Earnings, Nvidia’s Own Report Looms
-

 Tech6 days ago
OpenAI, Anthropic AI agents targeted real people and systems in cyber tests
-

 Crypto World7 days ago
Polymarket targets $20 billion valuation as competition heats up in prediction market sector
-

 Business6 days ago
Supply chain issues impact Ingredion
-

 Tech4 days ago
Rinn Pharma & Biopharma to join NordicPharmaTrain network
-

 Business2 days ago
How to Start a Cleaning Business: A Step-by-Step Guide
-
 Crypto World6 days ago
Dow and S&P 500 Hit Records on AI Earnings: When Will the Bubble Burst?
-

 Business2 days ago
Datadog: Best Of Breed For Multiple Reasons
-

 Business2 days ago
BDC Weekly Review: Private BDC Q2 Numbers Are Strong
-
 Crypto World7 days ago
Dollar Index Trapped at 100 as Hawkish Fed Meets Official Selling
-

 Business6 days ago
McDonald’s (MCD) Q2 2026 earnings
-

 Fashion6 days ago
The Bright Side of Black and White
-

 Fashion6 days ago
Suit of the Week: Me + Em
-
Sports5 days ago
Spider-Man: Brand New Day ending explained: Is Peter Parker alive?
You must be logged in to post a comment Login