
Crypto World
Bitcoin surges to $65,000 after $700 million in early Friday liquidations


Bitcoin rebounded sharply in Asia on Friday after a fresh wave of selling briefly pushed the token toward $60,000, extending a brutal drawdown that has now taken the world’s largest cryptocurrency more than 50% below its October peak.
BTC fell as much as 4.8% to around $60,033 during late U.S. hours, before snapping back to as high as $65,926. The move followed Thursday’s 13% slide, bitcoin’s steepest one-day drop since November 2022, when the collapse of Sam Bankman-Fried’s FTX triggered a marketwide panic.
The bounce came as liquidations surged again, clearing out leveraged positions that had built up during the week’s decline.
Roughly $700 million in crypto bets were wiped out over the past four hours, according to liquidation tracker CoinGlass, including about $530 million in long positions and $170 million in shorts. That mix suggests traders were first crushed on the way down, then caught leaning the wrong way on the rebound.
The move also appears to have drawn in spot buyers, with $60,000 acting as a psychological line that traders have been watching for weeks.
Damien Loh, chief investment officer at Ericsenz Capital, said the rebound points to “strong support” around that level, but warned sentiment remains fragile given the broader market backdrop.
Altcoins mirrored bitcoin’s whipsaw. Solana at one point fell as much as 14% before erasing those losses entirely within hours, shows how quickly risk appetite is flipping as liquidity thins and forced selling takes over.
The broader crypto market has been shaky since a series of liquidations in October rattled confidence, and the latest drawdown has been amplified by turbulence in global markets, where investors have been dumping speculative assets.
Bitcoin’s weakness is now spilling into crypto-linked balance sheets. Strategy, the company led by Michael Saylor, reported a $12.4 billion fourth-quarter net loss on Thursday, driven by mark-to-market declines in its bitcoin holdings.
Even with Friday’s bounce, traders say the market still looks like one being pushed around by leverage rather than conviction.

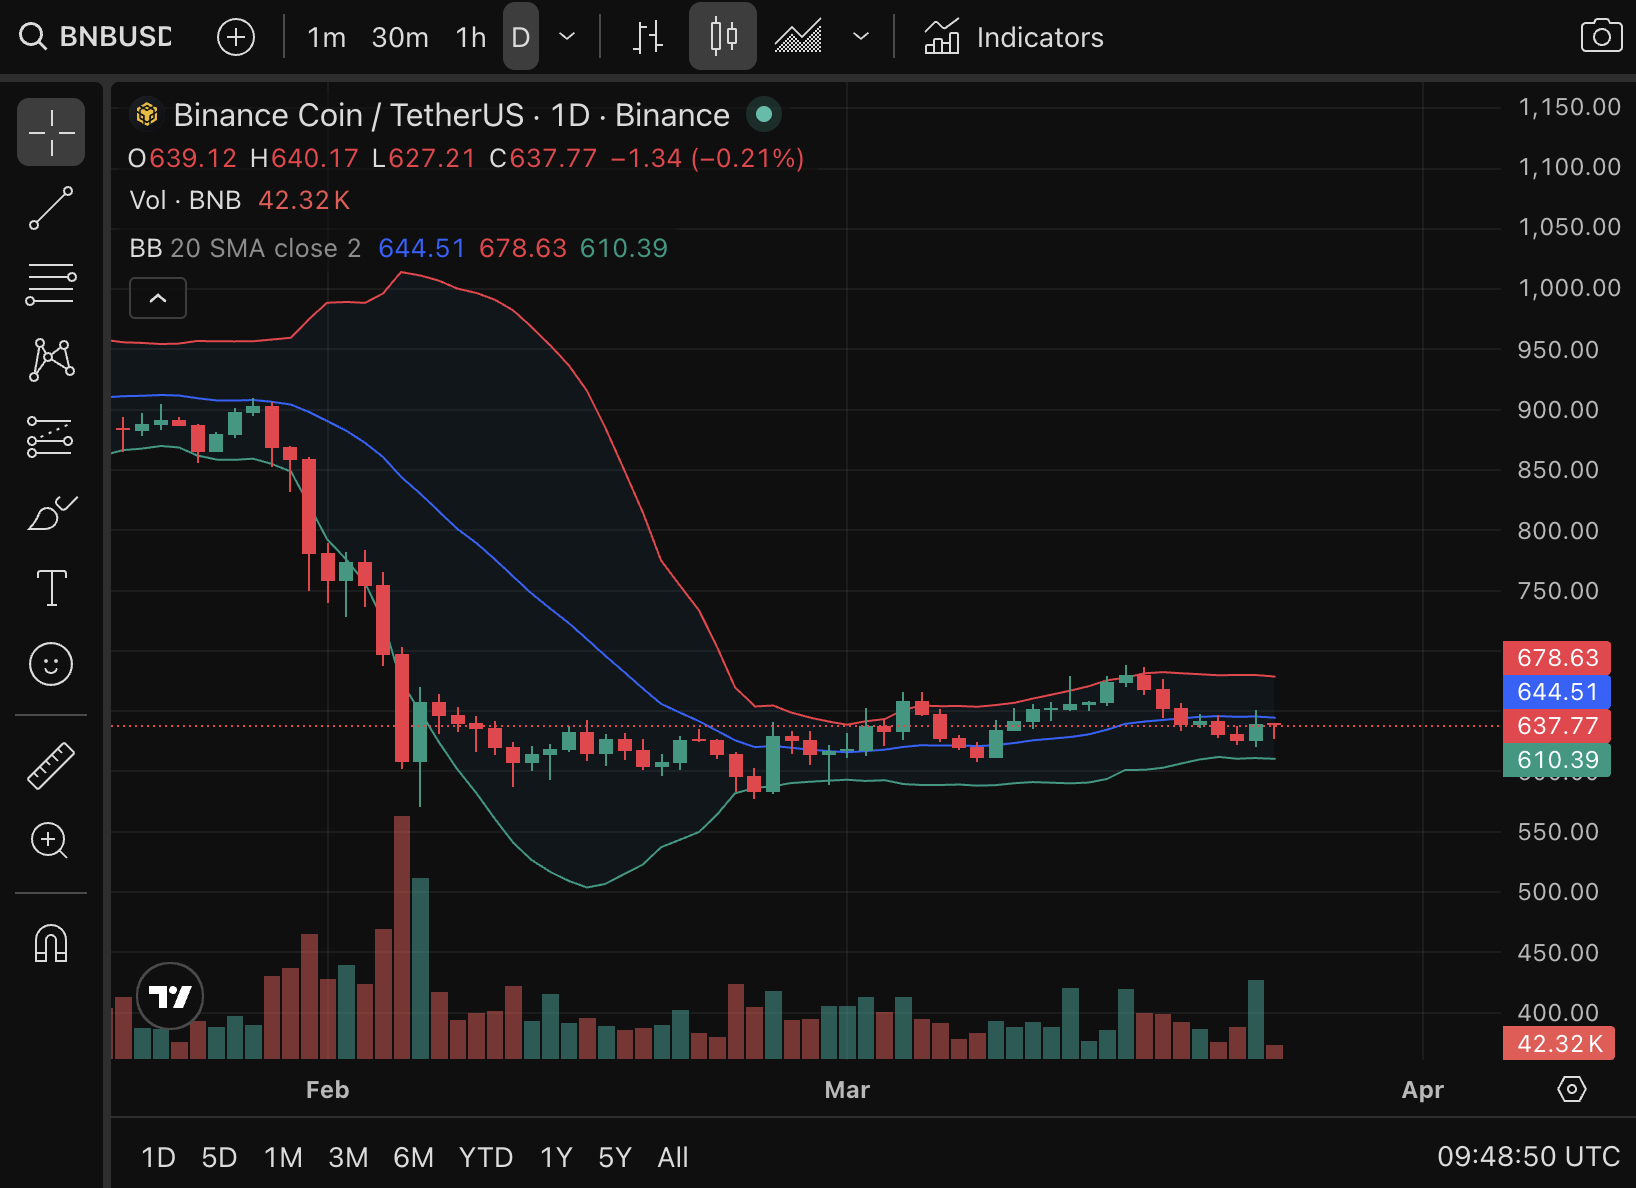
BNB price is trading at $634, posting more than 2% gain over the last 24 hours as prediction and momentum shift back to the buy side. The asset has recovered from its previous close, supported by trading volume of $1.6 billion.
This surge in participation suggests institutional rotation is active as the token has stabilized since last year. The market is asking one question: Is this a dead-cat bounce or the start of a run to the $728 monthly target?
The technical posture remains cautiously optimistic. While the crypto market displays volatility, BNB’s ability to hold above $620 indicates structural strength. We are now watching the immediate ceiling at $650. A clean break here validates the bullish thesis, while a rejection could see a retest of the $590 support bound.
Can Binance Coin Maintain Momentum Above $635? Here’s Our BNB Price Prediction
Current price action places BNB USD in a neutral-to-bullish zone. The Relative Strength Index (RSI) reads 50 on the daily, a level that leaves ample room for upside without triggering overbought alarms.
The immediate battleground is the 50-day moving average at $645, with BNB currently trading just below this pivot point. If bulls can reclaim this level on closing volume, the path opens toward the upper Bollinger Band at $678. Breaking this resistance is essential to unlocking the monthly forecast of $730, which represents a 13% potential upside. Conversely, failure here could see the price slip back toward the $590 lower band support.

Historical data reinforces the importance of the $648 resistance level. In previous cycles, volume confirmation above this price point has often preceded double-digit percentage rallies. We should monitor the volume metric; sustaining this liquidity is vital for breaking the psychological sell walls established earlier this quarter.
Discover: The best crypto to diversify your portfolio with
LiquidChain Targets Early Mover Upside as BNB Stabilizes
While BNB offers established stability with a forecasted 13% monthly upside, capital often rotates into infrastructure plays offering higher beta returns during recovery phases. The logic is simple: while large-cap assets like BNB battle heavy resistance at $650, emerging protocols solving fragmentation issues can capture aggressive speculation before price discovery matures.
This dynamic is drawing attention to LiquidChain ($LIQUID), a Layer 3 infrastructure project currently in its presale phase. Unlike standard Layer 2s, LiquidChain fuses Bitcoin, Ethereum, and Solana liquidity into a unified execution environment. The project has raised more than $600K to date, pricing its native token at $0.0143 with more than 1700% APY rewards.
The project’s premise addresses the liquidity fracture slowing down DeFi adoption. By acting as a Cross-Chain Liquidity Layer, it attempts to merge the security of BTC with the speed of SOL and the ecosystem of ETH.
Those interested in the protocol’s approach to verifiable settlement can research the LiquidChain presale here.
Disclaimer: Cryptocurrencies are high-risk assets. This article is for informational purposes and does not constitute financial advice. Invest only what you can afford to lose.
The post BNB Price Prediction: Monthly Target Challenges Resistance appeared first on Cryptonews.
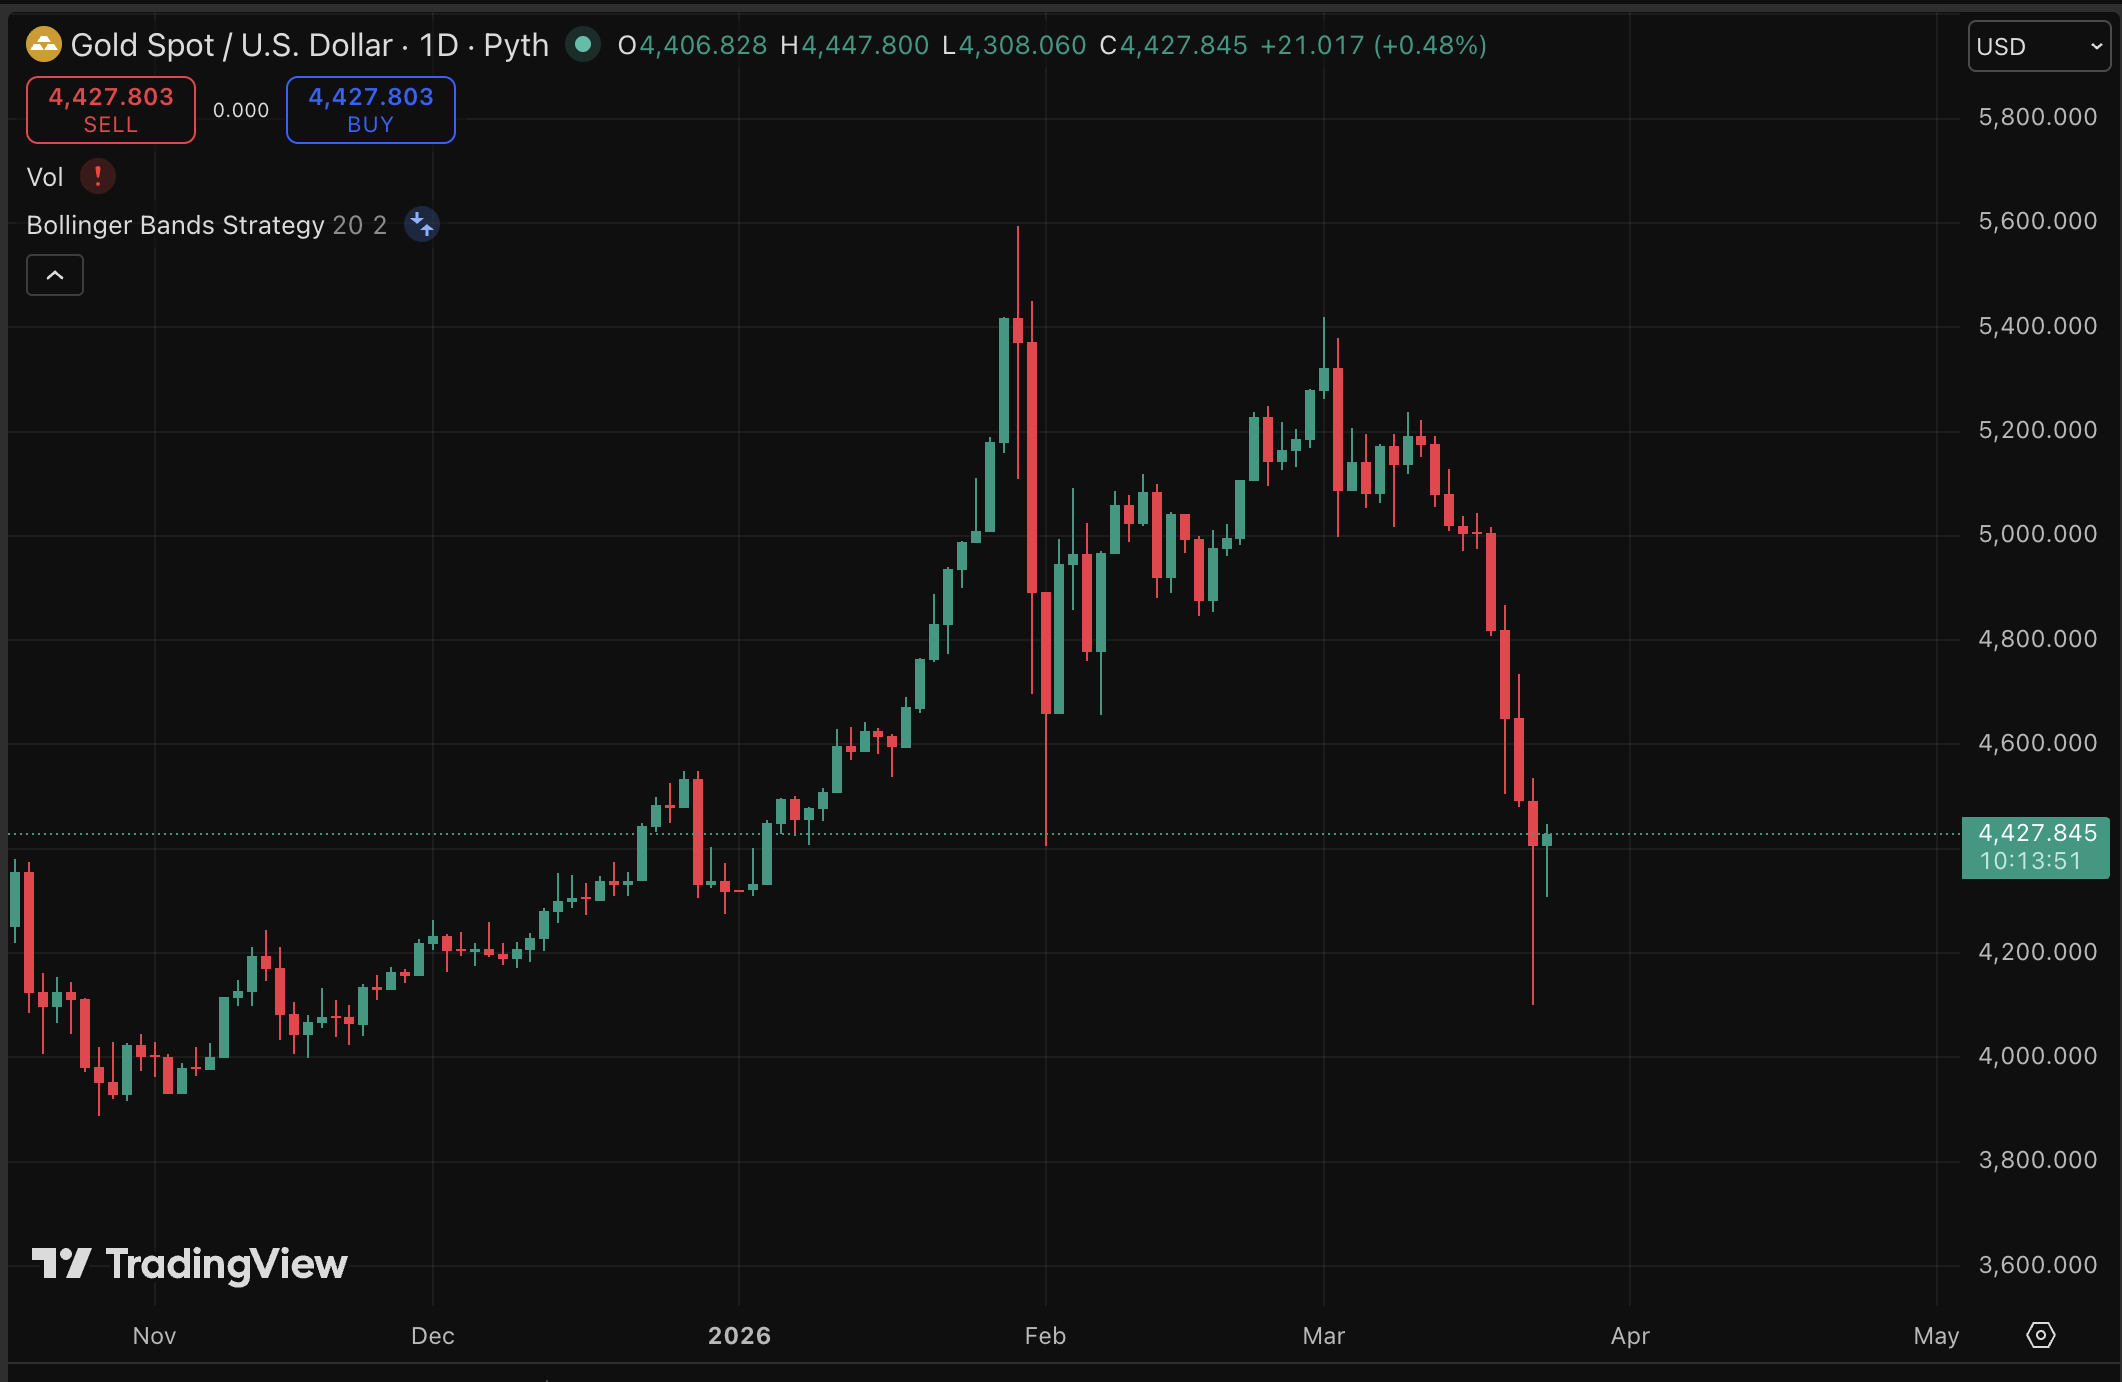
Safe-haven assets are defying historical correlations and analysis this week, with the gold price plummeting nearly 20% from its ATH while Bitcoin shows surprising relative strength in a risk-off environment.
As geopolitical tensions escalate, Bitcoin has retraced to trade at just at $71,000, it is significantly outperforming the precious metal, which has moved in lockstep.
This decoupling, usually, Gold rises during war scares, has left traditional investors scrambling. The market is digesting rapid-fire catalysts ahead of today’s G7 meeting. While legacy hedges bleed, on-chain data highlights specific pockets of immense speculation; AI-meme token SIREN surged 76.6% in 24 hours to $1.62. This volatility suggests capital isn’t leaving the ecosystem; it is rotating aggressively.
Discover: The best pre-launch token sales
Gold Price Analysis: A Signal To a Broader Liquidity Crunch?
The 20% drawdown in Gold prices from its ATH signals a liquidity crisis rather than a failed safe-haven narrative; investors are selling what they can, not just what they want to. Bitcoin’s dominance remains high at 58.6%, yet it faces immediate resistance at prior support levels.
Analysis of the gold price crash suggests that if XAU fails to reclaim its weekly support, the correlation with risk assets could deepen, dragging crypto lower in the short term.

Conversely, crypto-specific dynamics are painting a mixed picture. Santiment data predicts a potential “re-accumulation phase,” betting on a breakout triggered by upcoming regulatory clarity around the “Clarity Act.”
Technically, Bitcoin needs to reclaim the $72,000 zone to stabilize the altcoin bleed. If it fails, the 4.5% divergence between BTC and Gold may close rapidly. However, macro factors affecting silver and gold indicate that the traditional finance sector is currently under more stress than the digital asset market.
Discover: The best pre-launch token sales
LiquidChain Consolidates Cross-Chain Liquidity as Macros Widen
As traditional hedges like Gold falter and L1s struggle with fragmentation, smart money is increasingly targeting infrastructure plays that abstract complexity.
The thesis is simple: regardless of whether Bitcoin or Solana leads the next leg up, the rails connecting them will capture value. This narrative is driving early inflows into LiquidChain ($LIQUID), a Layer 3 infrastructure project designed to unify liquidity across Bitcoin, Ethereum, and Solana.
Unlike standard bridges that wrap tokens with high contagion risk, LiquidChain utilizes a “Deploy-Once Architecture.” This allows developers to write code once and access users and liquidity on all three major chains simultaneously using a Unified Liquidity Layer. The protocol promises verifiable settlement and single-step execution, addressing the exact fragmentation issues making current markets inefficient.
The presale data reflects this demand for infrastructure consolidation. LiquidChain has already raised more than $600K from early investors. The current entry price sits at $0.0143 with more than 1700% APY in staking rewards.
Disclaimer: Crypto is a high-risk asset class. This article is provided for informational purposes and does not constitute investment advice. You could lose all of your capital.
The post Gold Price Analysis: Crypto Decoulpling From Safe-Haven appeared first on Cryptonews.


Summary
- Research firm Bernstein says Bitcoin has likely found a cycle bottom and is reiterated its $150,000 year-end price target, describing the current drawdown as the “weakest bear case” in the asset’s history.
- BTC is trading around $70,668, roughly 40% below its all-time high, but Bernstein argues the correction reflects a temporary confidence crisis rather than any structural breakdown.
- Strategy (formerly MicroStrategy) — which holds approximately 3.6% of Bitcoin’s total supply, worth around $53.5 billion — has continued buying at recent lows, raising $7.3 billion in 2026 alone to expand its holdings.
Research and brokerage firm Bernstein, which manages approximately $867 billion in assets, declared on March 24 that Bitcoin’s (BTC) price bottom is likely in and maintained its end-of-2026 price target of $150,000 — implying more than a 100% gain from current levels — as the firm’s analysts argued the ongoing selloff is categorically different from every bear market Bitcoin has previously endured.
Lead analyst Gautam Chhugani described the current pullback as “the weakest Bitcoin bear case in its history,” pointing to what the firm sees as a temporary crisis of investor confidence rather than any deterioration in Bitcoin’s underlying fundamentals. With BTC trading around $70,668 at time of writing — down roughly 40% from its peak — Bernstein’s conviction remains intact.
A Different Kind of Drawdown
The framing is a deliberate break from how past bear markets have been characterized. Previous Bitcoin cycles saw far more violent collapses: the 2013 peak near $1,150 was followed by an 84% drawdown, the 2017 high of $20,000 preceded a 77% decline, and the 2021 peak near $69,000 gave way to a roughly 70% correction. By comparison, the current drawdown of around 40% looks restrained — and Bernstein argues it is, structurally speaking, far less dangerous.
The key differentiators, according to the firm, are the maturation of institutional flows and a more favorable policy environment. Spot Bitcoin ETF adoption continues to expand, corporate treasury participation is accelerating, and the U.S. political backdrop has shifted in a direction broadly viewed as supportive of digital assets. None of the systemic failures that defined 2022 — collapsed exchanges, insolvent lenders, contagion — are present in the current cycle.
Strategy and On-Chain Signals
Strategy’s continued accumulation at depressed prices is cited as a key supporting data point. The company now holds approximately 3.6% of Bitcoin’s total circulating supply, valued at around $53.5 billion, and has raised $7.3 billion in 2026 specifically to expand its Bitcoin treasury. Bernstein views Strategy as a high-beta vehicle with a structurally resilient balance sheet, noting that only an extreme scenario — BTC falling to $8,000 and remaining there for five years — would require any balance sheet restructuring.
On-chain data adds further context. Analyst Ali Charts pointed to Bitcoin approaching the 0.8 MVRV ratio band, a level situated between $56,000 and $60,000 that has historically served as a launchpad for major rallies: +963% in 2017, +261% in 2018, +1,126% in 2020, and +660% following the FTX collapse in 2022. CryptoQuant analyst Crypto Dan echoed the sentiment, arguing that reduced participation and fading retail interest are “textbook bear market” indicators — but historically, accumulation phases rather than exit points. “A bear market is not a time to give up. It is the time to prepare for the next bull cycle,” he wrote on X.
Where Analysts Diverge
Not everyone shares Bernstein’s confidence. VanEck CEO Jan VanEck told CNBC in early March that while a bottom may be forming, 2026 represents Bitcoin’s typical fourth-year bear cycle, consistent with historical halving patterns. Some traders argue that failure to reclaim and hold above $70,000 could open the door to a deeper leg lower, potentially retesting the $60,000 level that has emerged as the most closely watched structural support.
Bernstein’s $150,000 target, first established when Bitcoin was trading at significantly higher levels, aligns with a broader cluster of institutional 2026 price forecasts that include $150,000 from BSTR President Katherine Dowling and $180,000 from Ripple CEO Brad Garlinghouse. Longer term, Bernstein maintains a target of $1 million by 2033.


The issuer of the largest stablecoin by market cap has been under scrutiny for years for not conducting a full financial audit
Tether announced on Tuesday that it has engaged a Big Four accounting firm to conduct what the firm says is its “first full independent financial statement audit.” The issuer of USDT, the largest stablecoin by market cap with over $184 billion, did not name which specific firm would conduct the audit, and described it as potentially the largest inaugural audit in financial markets history.
The company, which reports a global user base of more than 550 million, said the engagement follows a competitive onboarding process during which multiple audit firms assessed Tether’s systems, internal controls, and financial reporting.
The move comes after years of criticism over Tether’s transparency practices. Rather than full audits, Tether has historically provided quarterly attestations from BDO Italia — a more limited form of financial review. In 2021, the Commodity Futures Trading Commission (CFTC) issued a $41 million fine over misleading claims that USDT was fully backed by U.S. dollars.
No timeline for completion of the audit was disclosed in today’s announcement.
As The Defiant reported in 2023, then-CTO Paolo Ardoino — now CEO — attributed the lack of a full audit in part to difficulties with auditing firms themselves.
More recently, both the EU’s MiCA framework for digital asset regulation and the U.S. stablecoin-focused GENIUS Act have included provisions calling for full reserve backing and transparent audits of stablecoin issuers, as The Defiant reported previously. In November, S&P Global downgraded USDT’s dollar-peg stability score to its lowest mark, citing growing exposure to higher-risk assets.
Tether credited the appointment of CFO Simon McWilliams in early 2025 as key to preparing the company’s internal architecture for a full audit, per today’s announcement. McWilliams said the firm was “selected through a competitive process because the organisation is already operating at Big Four audit standard.”
The announcement comes alongside Tether’s broader push into the U.S. market. Last August, the company hired Bo Hines, former executive director of the White House Crypto Council, as a strategic advisor overseeing its U.S. expansion. More recently, Tether invested $200 million in commerce platform Whop, building on the launch of its regulated U.S. stablecoin USAT, which it first unveiled in September.
This article was written with the assistance of AI workflows. All our stories are curated, edited and fact-checked by a human.
Key takeaways:
-
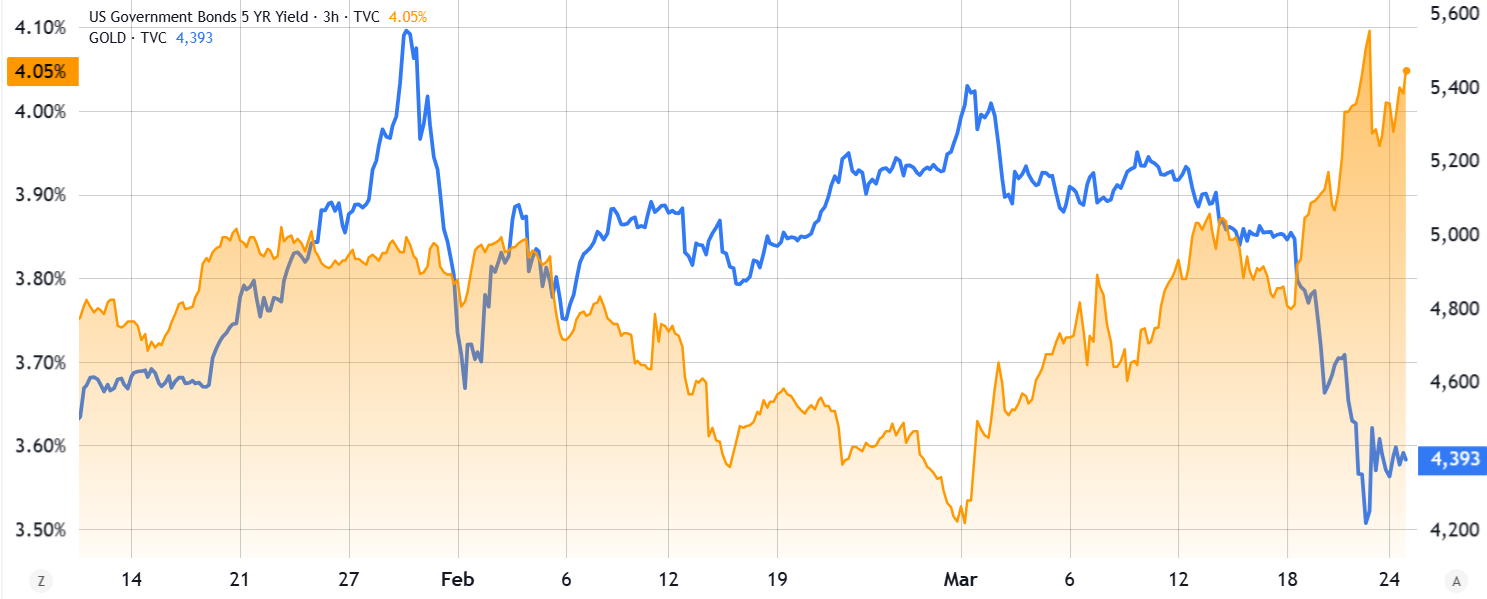
Investors dumped gold and bonds for cash as war-driven oil spikes and inflation forced a defensive market stance.
-
Rising yields and a 20% rate hike chance signal a tight outlook, leaving Bitcoin vulnerable amid soaring US debt.
Bitcoin (BTC) retested the $67,500 support level on Monday, a move that coincided with gold prices suffering their sharpest correction in over 50 years. Fears of a prolonged war in Iran and the inflationary impact of oil prices holding above $85 pushed investors to cut risk.

US Treasuries also faced a sell-off during this period, suggesting that traders aggressively built cash positions. Yields on the US 5-year Treasury jumped to 4.10%, marking a nine-month high as traders demanded better returns. With the S&P 500 hitting its lowest point in over six months on Monday, evidence suggested a broad rush to liquidity.
Cash is king amid economic uncertainty, while Bitcoin risks further downside
Investors appeared to be raising cash either to cover recent losses or to brace for further price drops across risk markets.

The ongoing war in Iran pushed oil prices past $90, creating inflationary pressure. The Wall Street Journal reported that the US planned to deploy roughly 3,000 troops to the Middle East to counter Iran’s influence over the Strait of Hormuz. Part of the decline in gold prices was likely linked to fading expectations for US monetary policy easing in the near term.

Bond market futures showed that the implied probability of the Federal Open Market Committee (FOMC) hiking interest rates by July surged to 20.5%, up from 0% just one week prior. Investors anticipated a cooling job market as high interest rates continued to reduce corporate expansion incentives.
Tech stocks fall, inflation hurts consumers
US legislators debated an additional $200 billion in funding to support the war in Iran, according to The Washington Post. Kevin Hassett, director of the US National Economic Council, stated that $12 billion had already been spent. Lawmakers did not authorize the war, and Congress showed growing unease with the military strategy, according to AP.
Meanwhile, the US national debt soared past $39 trillion, which further pushed consumers toward a cost-of-living crisis. Fear of excessive speculative investment in the artificial intelligence sector emerged after Reuters reported that ChatGPT maker OpenAI offered private-equity firms a guaranteed minimum return of 17.5% while the company remained largely unprofitable.

Some of the world’s largest tech companies faced losses of 10% or more over the past six weeks, including Google (GOOG US), Meta (META US), and IBM (IBM US). Thus, regardless of the sharp correction in gold prices, traders increasingly feared recession risks or a surge in inflation above the 4% fixed income returns.
Related: Bitcoin holders shift from panic to cash-buffer discipline as volatility deepens
The combination of declining stock prices and persistent inflationary pressure explained why investors aggressively sought the safety of cash positions.
Regardless of favorable Bitcoin onchain metrics, broader macroeconomic conditions remained unfavorable for sustainable bullish momentum. The decline in gold prices while investors offloaded US Treasuries served as a sign of risk aversion. The odds of a $66,000 retest remain a serious threat, at least until inflation and war expenses hold US monetary policy tight for a longer period.
This article does not contain investment advice or recommendations. Every investment and trading move involves risk, and readers should conduct their own research when making a decision. While we strive to provide accurate and timely information, Cointelegraph does not guarantee the accuracy, completeness, or reliability of any information in this article. This article may contain forward-looking statements that are subject to risks and uncertainties. Cointelegraph will not be liable for any loss or damage arising from your reliance on this information.
Circle stock fell 19% after the latest Senate draft of the Clarity Act included restrictions on stablecoin yield.
Crypto markets dipped slightly on Tuesday as geopolitical uncertainty persisted and investors considered the implications of the U.S. Senate’s revised draft of the crypto market structure bill, or Clarity Act.
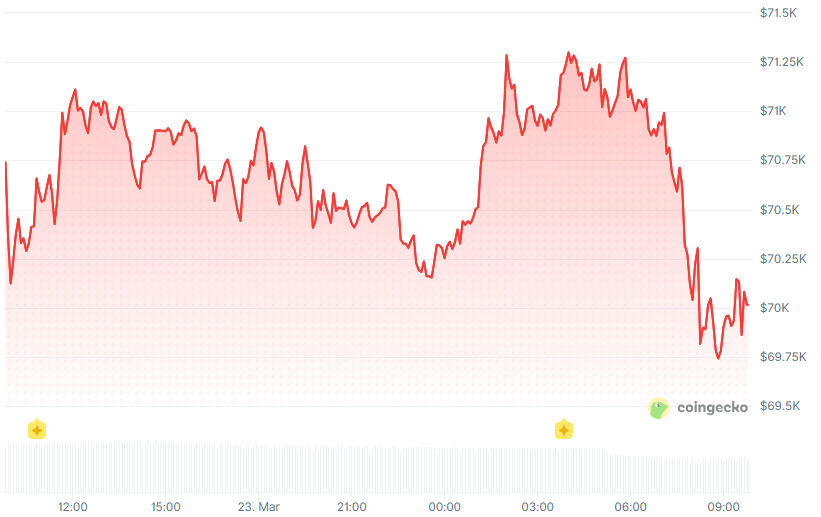
Bitcoin (BTC) is trading at around $70,000, down less than 1% over the past 24 hours. ETH and SOL fell 0.6% to $2,135 and $90, respectively. Meanwhile, Ripple (XRP) slipped 3%.

Total crypto market capitalization is down 0.2% to $2.48 trillion, according to Coingecko.
Bitcoin surged above $71,000 on Monday after President Donald Trump announced a five-day postponement of planned strikes on Iran’s power infrastructure, citing what he called productive talks with Tehran. However, Iran’s Fars news agency denied that any talks had taken place.
Clarity Act Draft Rattles Stablecoin Stocks
Circle stock plunged 19%, and Coinbase dropped 8% after details emerged from the latest draft of the Clarity Act, which would restrict stablecoin yield offerings. The revised language, crafted by Senators Angela Alsobrooks and Thom Tillis, would ban yield payments for simply holding a stablecoin while permitting narrowly defined activity-based rewards tied to transactions or platform usage.

Crypto industry insiders got their first look at the revised text during a closed-door review on Capitol Hill on Monday, according to Coindesk.
Big Movers
Nearly all of the Top 100 digital assets posted minor losses over the last 24 hours.
Today’s top gainers are Bittensor (TAO) and World Liberty Financial (WLFI), which surged 10%.
Monero (XMR) and Polkadot (DOT) are the biggest losers, down 5% and 4%, respectively.
Around 79,000 leveraged traders were liquidated for $153 million in the past 24 hours, according to CoinGlass. Bitcoin accounted for $46 million, while ETH made up $33 million.
Bitcoin exchange-traded funds (ETFs) recorded inflows of $163.5 million on Tuesday, snapping a three-day losing streak, according to SoSoValue.
The Crypto Fear & Greed Index sits at 11, indicating ‘Extreme Fear’, and has spent the bulk of March below 20, a prolonged stretch of pessimism not seen since the depths of the 2022 bear market.

Active, actively managed crypto exchange-traded products are emerging as the next frontier for institutional exposure, as the market moves beyond passive price-tracking funds. 21shares, a leading issuer in the space, argues that the asset class’s nascency makes it particularly amenable to portfolio-level management.
In an exclusive conversation, Duncan Moir, president of 21shares, outlined a strategy that blends bottom-up research on individual assets with quantitative and discretionary top-down risk controls to steer portfolios. The firm has been expanding its portfolio-management and trading ranks to support more sophisticated products, he said, reflecting a broader shift in the crypto ETP space toward active strategies.
We’ve had to hire and build out the team with people who have different trading and portfolio management expertise, but now we have a solid team and we think we’ll be able to deliver strong actively managed products.
Industry data underscore the trend: active exchange-traded products worldwide held nearly $1.8 trillion in assets by the end of 2025, according to data compiled by Morningstar and Goldman Sachs Asset Management.
Moir also pointed to the strategic role of FalconX, which acquired 21shares in October, as a force-multiplier for product development, particularly as the firm pursues more complex offerings.
Regional demand for crypto ETPs and ETFs remains uneven. In the United States, investor interest remains skewed toward the largest-cap crypto assets, while in Europe institutions are showing appetite for newer assets and the application layer beyond base-layer tokens. This divergence reflects a mature European investor base already holding BTC and ETH and looking to broaden crypto allocations with yield-oriented or theme-driven products.
In this environment, 21shares has rolled out Europe-listed ETP linked to Strategy’s preferred stock (STRC), offering exposure to a Bitcoin-focused capital strategy with a high-yield profile. The product has attracted strong early interest across regions as investors seek straightforward exposure to yield via traditional brokers.
Crypto ETPs evolve beyond passive exposure
As the crypto ETP and ETF market matures, issuers are moving beyond simple price tracking, with more complex structures emerging across the US and Europe.
One area gaining traction is staking, a process that allows investors to earn yield by locking up crypto assets to help secure blockchain networks. In October, Grayscale introduced staking across its ETPs, making its Ether funds among the first US-listed spot crypto ETFs to offer staking rewards while extending the feature to its Solana trust pending ETP approval.
In March, asset manager BlackRock launched a Nasdaq-listed Ethereum product that incorporates staking, combining spot Ether exposure with yield generation. The fund recorded $15.5 million in trading volume on its first day.
As new exchange-traded products come to market, Moir said 21shares evaluates potential launches based on three factors: internal research, client demand, and broader market trends, with its research team identifying early opportunities and institutional feedback helping gauge interest. This triad helps determine whether a niche, single-asset product or a broader thematic offering best fits conviction and demand.
Among examples of the approach in practice is 21shares’ Bitcoin-and-gold ETP. Cross-listed in London and live for several years, Moir notes that the product has delivered some of the strongest risk-adjusted returns among European ETPs, illustrating the appeal of balanced exposure across flagship crypto and traditional stores of value.
From a portfolio perspective, the combination “just makes total sense,” he added, citing diversification benefits across Bitcoin and gold.
What’s next for crypto ETPs and investors
The evolving landscape suggests investors can expect more nuanced structures, including yields and staking rewards embedded in traditional brokerage-accessible formats. The FalconX deal accelerates product development by providing deeper execution capabilities and liquidity to support a broader range of strategies. As institutions in Europe deepen their crypto allocations and U.S. issuers explore tiered yield and application-layer exposures, the market will likely see a steady cadence of launches that blend traditional finance rails with crypto’s distinct yields and risk profiles.
Looking ahead, the conversation centers on how regulators will shape access to staking-based products, how quickly large-cap and next-generation assets receive broad market validation, and how issuers balance risk controls with the demand for yield-driven strategies. For investors, the key watchpoints are whether new products deliver clear, repeatable performance across cycles, and how cross-border listings and collaborations—such as 21shares’ integration with FalconX—affect liquidity, pricing, and transparency in the evolving crypto ETP ecosystem.
Readers should watch regulatory clarity in major markets and the pace of institutional adoption as 21shares and peers press forward with more sophisticated, yield-focused offerings that aim to turn crypto exposure into scalable, traditionally accessible investment strategies.

Key Takeaways
- Micron shares declined approximately 15% across four consecutive trading sessions following exceptional Q2 fiscal 2026 results
- Quarterly revenue reached $23.86 billion, representing nearly a 200% surge from the prior year’s $8.05 billion
- According to CEO Sanjay Mehrotra, current production capacity meets only 50% to 66% of major customer demand
- Competitor SK Hynix announced plans for an $8 billion EUV equipment investment and potential $10 billion U.S. stock listing — intensifying competitive dynamics
- Leading Wall Street firms including Bank of America, Morgan Stanley, and JPMorgan elevated their price projections following the earnings announcement
Micron delivered exceptional quarterly results last week. Wall Street’s reaction? A double-digit decline.
Following the release of Q2 fiscal 2026 earnings on Wednesday, Micron shares have experienced consecutive daily losses spanning four trading sessions. The negative price action has left many observers perplexed, particularly considering the impressive financial metrics.
Quarterly revenue totaled $23.86 billion — representing approximately a threefold increase from the $8.05 billion Micron generated during the comparable quarter last year. Management also projected gross margin percentages hovering around 80% for the upcoming quarter.
Despite the recent downturn, Micron shares have surged more than 300% over the trailing twelve months. The memory chip manufacturer stands as the sole technology company among America’s top 10 market leaders posting year-to-date gains, while Oracle and Microsoft have both retreated over 20%.
Citi’s semiconductor analyst Atif Malik attributed the selloff primarily to investor profit-taking. “Higher FY27 capex and peak gross margin concerns (81% > Nvidia’s 75%) likely induced some profit taking after a strong stock run into the print,” he noted.
Production Capacity Lags Behind Customer Requirements
CEO Sanjay Mehrotra spoke openly about current supply constraints during an interview with CNBC’s Squawk on the Street on Thursday.
“Memory today is very tight supply and supply cannot be brought up that easily,” he explained. Major clients are presently obtaining only “50% to two-thirds of their requirements.”
This supply squeeze stems directly from artificial intelligence demand. Micron, SK Hynix, and Samsung collectively dominate the high-bandwidth memory segment that powers AI processors from manufacturers such as Nvidia and AMD.
The explosion in AI infrastructure investments has elevated memory pricing while keeping availability constrained. Mehrotra indicated the company’s robust financial performance directly mirrors these market dynamics.
Major financial institutions including Bank of America, Morgan Stanley, and JPMorgan raised their valuation targets for Micron following the quarterly disclosure, suggesting analysts remain optimistic about longer-term prospects despite near-term share price weakness.
South Korean Rival Escalates Competition
Compounding investor concerns this week, SK Hynix unveiled two significant strategic initiatives that unsettled Micron shareholders.
The Seoul-based chipmaker submitted regulatory documentation on Tuesday revealing intentions to acquire approximately $8 billion worth of extreme ultraviolet (EUV) lithography systems from ASML through the end of 2027 — representing a substantial commitment to advanced manufacturing capabilities.
Simultaneously, Korea Economic Daily published reports indicating SK Hynix is evaluating a potential U.S. stock exchange listing that could generate up to $10 billion in capital. U.S. investors presently face restricted access to SK Hynix equity, with most exposure limited to over-the-counter trading or exchange-traded funds such as the iShares MSCI South Korea ETF.
A domestic U.S. listing could fundamentally alter investment flows within the memory semiconductor sector. SK Hynix currently commands a forward price-to-earnings multiple of approximately 4.8 times, compared to Micron’s 5.3 times valuation, based on FactSet data.
During Tuesday’s midday trading session, Micron shares declined an additional 2.4%, prolonging the post-earnings retreat to four consecutive sessions.


Morgan Stanley will let clients trade tokenized versions of U.S. stocks and ETFs on its internal ATS from late 2026, tying into SEC pilots at DTCC and Nasdaq for on‑chain settlement.
Summary
- Morgan Stanley plans to enable tokenized issuance and settlement for selected blue‑chip U.S. stocks and ETFs on its alternative trading system in H2 2026, running alongside traditional shares.
- The move rides a tokenized stock market that has grown to about $800m in value and $1.8b in monthly volume, with roughly 50,000 monthly active and 130,000 total holding addresses.
- It fits a broader U.S. shift: the SEC has given DTCC’s DTC a three‑year window to custody tokenized securities and approved a Nasdaq pilot for tokenized stock settlement without changing trading rules.
Morgan Stanley plans to switch on tokenized stock trading for institutional clients on its internal alternative trading system in the second half of 2026, a significant escalation of Wall Street’s push to bring traditional equities onto blockchain rails. Amy Oldenburg, the bank’s head of digital assets strategy, told a panel at the Digital Asset Summit in New York on Tuesday that the ATS — which currently handles listed stocks, ETFs and American depositary receipts — will allow certain securities to be issued and settled in tokenized form alongside their conventional counterparts. “This is not FOMO,” Oldenburg said in separate comments reported by AOL, describing the rollout as “a very managed and stepped journey” tied to a broader modernization of Morgan Stanley’s trading and settlement infrastructure.
The plan positions Morgan Stanley to sit directly in the middle of the fast-growing tokenized stocks segment, where on-chain representations of U.S. equities have reached roughly $800 million in market value and about $1.8 billion in monthly trading volume as of December 2025, according to ChainCatcher’s market research. That same research notes around 50,000 monthly active addresses and 130,000 total holding addresses in tokenized equities, a sign that usage is moving beyond niche experiments and into regular portfolio construction for offshore and crypto-native investors. For Morgan Stanley’s ATS, the initial phase will likely focus on tokenized blue-chip U.S. stocks and ETFs, with Oldenburg previously signaling interest in connecting the bank’s wealth clients and advisory channels to a broader lineup of digital securities over time.
Morgan Stanley’s move lands in a regulatory environment that has turned sharply more accommodating to tokenized securities. In late 2025, the U.S. Securities and Exchange Commission granted a no-action letter to the Depository Trust & Clearing Corporation (DTCC), allowing its Depository Trust Company unit to custody and recognize tokenized stocks, bonds and other real-world assets on selected blockchains for a three-year period. This effectively gave DTCC permission to run tokenization services at scale and paved the way for mainstream broker-dealers and banks to plug into on-chain settlement without abandoning the existing market structure.
More recently, the SEC approved a pilot for Nasdaq to support tokenized stock trading, letting participants choose tokenized settlement while keeping the same order book, priority rules and shareholder rights as traditional equities. ChainCatcher notes that the Nasdaq pilot is designed to “explore the feasibility of on-chain settlement without changing the trading structure,” a model that closely mirrors Morgan Stanley’s plan to add tokenized legs into an existing ATS rather than create a separate crypto-only exchange. In parallel, Morgan Stanley has filed for spot Bitcoin and Solana ETFs, is preparing a native Bitcoin custody and trading platform, and, according to RootData and CryptoRank, is developing a digital wallet to support tokenized assets — suggesting that tokenized stocks are one pillar in a broader multi-asset digital securities roadmap.

Quick Overview
- AeroVironment introduced the Locust X3 directed-energy laser platform for countering unmanned aerial threats
- Shares declined 2.3% during midday trading session following the announcement
- The weapon system delivers 20kW to over 35kW of laser power and features multi-platform deployment capability
- Operating costs are significantly reduced compared to conventional interceptors due to elimination of ammunition requirements
- Company financials reveal robust 17.3% three-year revenue expansion but challenged profitability margins
AeroVironment (AVAV) revealed its newest anti-drone technology Tuesday, though investors responded with lukewarm enthusiasm.
The defense contractor introduced the Locust X3, a directed-energy weapon platform engineered to identify, track, and neutralize small-to-medium unmanned aircraft systems and select ground-level targets. Share prices retreated 2.3% by midday in New York trading, even as the S&P 500 remained relatively unchanged.
The Locust X3 employs laser technology delivering between approximately 20 kilowatts and exceeding 35 kilowatts of power. Integrated software handles autonomous detection, tracking, and engagement operations.
Deployment flexibility spans ground-based vehicles, stationary installations, and naval vessels, providing versatility across diverse operational theaters. AeroVironment emphasizes the platform’s modular architecture, enabling future upgrades and seamless integration with current defense infrastructure.
Economics represent a crucial advantage. Traditional interceptor systems demand physical ammunition replenishment, while this laser platform enables unlimited engagements without reload constraints. This capability becomes particularly valuable when confronting large formations of inexpensive hostile drones.
Foundation in Military Collaboration
AeroVironment indicated the Locust X3 leverages experience from previous U.S. Army program deployments. The architecture also supports Department of Defense objectives for unified cross-platform compatibility.
Shares traded at a price-to-book multiple of 2.3, approaching the lower boundary of its five-year range. Wall Street analysts maintain a consensus price target of $315.62. The Relative Strength Index (RSI) registered 39.89, approaching oversold conditions.
Profitability Challenges Despite Revenue Growth
The company has achieved 17.3% compound annual revenue growth across the trailing three-year period, demonstrating strong top-line momentum. Profitability metrics present a contrasting narrative—operating margin stands at -5.9% with net margin at -13.93%.
Balance sheet strength appears solid, featuring a current ratio of 5.51 and minimal leverage with a debt-to-equity ratio of 0.19. Return on equity, however, reflects negative performance at -7.55%.
Institutional investors control 65.49% of outstanding shares, indicating substantial confidence from large asset managers. Insider ownership measures 2.47%.
Volatility considerations include a beta coefficient of 2.03, categorizing the stock as high-volatility. The Piotroski F-Score of 3 suggests potential operational challenges.
Insider activity showed 10 selling transactions during the previous three-month period, a metric warranting attention.
The Beneish M-Score of -0.83 indicates some financial reporting concerns. Meanwhile, the Altman Z-Score of 5.61 signals strong balance sheet stability and low bankruptcy risk.
The Locust X3 represents [[LINK_START_3]]AeroVironment[[LINK_END_3]]’s continued expansion into counter-unmanned systems and directed-energy capabilities, market segments experiencing heightened defense spending interest.
AeroVironment maintains a market capitalization near $9.96 billion.
Shakur Stevenson insists the toughest fight of his career has already happened: “He was your best hope”
5 Built-In iPhone Apps You Probably Don’t Use, But Should

crypto futures trading #crypto #bitcoin #trading #shorts


-
 Crypto World4 days ago
NIO (NIO) Stock Plunges 6.5% as Shelf Registration Sparks Dilution Worries
-

 Fashion4 days ago
Weekend Open Thread: Adidas – Corporette.com
-

 Politics4 days ago
Jenni Murray, Long-Serving Woman’s Hour Presenter, Dies Aged 75
-

 Crypto World3 days ago
Best Crypto to Buy Now: Strategy Just Spent $1.57 Billion on Bitcoin During Fear While Early Investors Quietly Enter Pepeto for 150x Potential
-

 News Videos6 days ago
RBA board divided on rate cut, unusually buoyant share market | Finance Report | ABC NEWS
-

 Crypto World3 days ago
Bitcoin Price News: Bhutan Sells $72 Million in BTC Under Fiscal Pressure, but the Smart Money Entering Pepeto Sees What the Market Does Not
-

 Politics7 days ago
The House | The new register to protect children from their abusers shows Parliament at its best
-

 Tech5 days ago
inKONBINI Lets You Spend Summer Days Behind the Register
-

 Crypto World6 days ago
Canada’s FINTRAC revokes registrations of 23 crypto MSBs in AML crackdown
-

 Sports2 days ago
Remo Stars and Kano Pillars Strengthen Survival Hopes in NPFL
-
 NewsBeat6 days ago
Residents in North Lanarkshire reminded to register to vote in Scottish Parliament Election
-

 News Videos6 days ago
PARLIAMENT OF MALAWI – PAC MEETING WITH REGISTRAR OF FINANCIAL ON AMARYLLIS HOTEL – INQUIRY LIVE
-

 Politics5 days ago
Gender equality discussions at UN face pushbacks and US resistance
-

 Business2 days ago
No Winner in March 21 Drawing as Prize Rolls to $133 Million for Next
-

 Business6 days ago
Who Was Alex Pretti? 5 Key Facts About the ICU Nurse Killed by Federal Agents in Minneapolis
-

 Sports2 days ago
Gary Kirsten Accuses Pakistan Cricket Board Of ‘Interference’, Mohsin Naqvi Responds
-

 Tech2 days ago
Give Your Phone a Huge (and Free) Upgrade by Switching to Another Keyboard
-

 Sports4 days ago
2026 Kentucky Derby horses, odds, futures, preview, date: Expert who nailed 12 Derby-Oaks Doubles enters picks
-

 Tech7 days ago
Subnautica 2 might finally be entering early access in May
-
Sports6 days ago
Vikings Free Agency Enters Phase 2 with Key Questions
You must be logged in to post a comment Login