
Crypto World
Bitget CEO Gracy Chen Shares H1 2026 Remarks Highlight Company’s Strategy


Bitget, the world’s largest Universal Exchange (UEX), has published CEO Gracy Chen’s mid-year address, outlining the company’s long-term vision for a more connected financial system powered by tokenization, artificial intelligence, and universal market access.
The leadership’s insights come as trading behavior continues to evolve beyond crypto alone. During the first half of 2026 the platform witnessed the shift, about 52% Bitget users now hold both stocks and crypto, 35% hold gold and other precious metals while 51% users use AI-powered tools. This highlights the growing demand for platforms that bring global markets together leveraging emerging tech.
Rather than becoming an “asset supermarket,” Bitget aims to remove the friction that separates financial markets. The letter outlines four principles guiding that strategy: improving capital efficiency, delivering global assets through a crypto-native experience, expanding financial access through products such as tokenized assets and pre-IPO investing, and simplifying trading through AI-powered automation.
“Our focus has pivoted from being a crypto exchange to a holistic universal provider,” said Gracy Chen, CEO of Bitget. “Our platform removes barriers that divided financial markets for decades. Users can now access crypto, stocks, CFDs, gold and do more with their capital 24/7.”
Bitget’s conviction on tokenization reshaping capital markets is based on Chen’s 10% tokenization vision, while highlighting products such as Stock+ and Reality as early examples of how blockchain infrastructure can make investing more accessible and efficient.
Artificial intelligence forms the second major pillar of the vision. As AI evolves from analysis toward execution, Chen described a future where users define investment goals and risk parameters while intelligent systems handle market monitoring and trade execution. Bitget now serves more than one million AI trading users alongside more than one million copy trading users, following the rollout of products including GetClaw and the GetAgent Playbook.
Closing the address, Chen described Bitget’s broader mission as extending financial opportunity beyond traditional institutional channels, calling it the shift from banking the unbanked to brokering the unbrokered.
Read the full “Break the Unbreakables” address here, or watch the address on Bitget’s X.
About Bitget
Bitget is the world’s largest Universal Exchange (UEX), serving over 125 million users and offering access to over 2M crypto tokens, 500+ tokenized stocks, ETFs, commodities, FX, and precious metals such as gold. The ecosystem is committed to helping users trade smarter with its AI agent, which co-pilots trade execution. Bitget is driving crypto adoption through strategic partnerships with LALIGA and MotoGP™. Aligned with its global impact strategy, Bitget has joined hands with UNICEF to support blockchain education for 1.1 million people by 2027. Bitget currently leads in the tokenized TradFi market, providing the industry’s lowest fees and highest liquidity across 150 regions worldwide.
For more information, visit: Website | X | Telegram | LinkedIn | Discord
Risk Warning: Digital asset prices are subject to fluctuation and may experience significant volatility. Investors are advised to only allocate funds they can afford to lose. The value of any investment may be impacted, and there is a possibility that financial objectives may not be met, nor the principal investment recovered. Independent financial advice should always be sought, and personal financial experience and standing carefully considered. Past performance is not a reliable indicator of future results. Bitget accepts no liability for any potential losses incurred. Nothing contained herein should be construed as financial advice. For further information, please refer to our Terms of Use.
The post Bitget CEO Gracy Chen Shares H1 2026 Remarks Highlight Company’s Strategy appeared first on BeInCrypto.


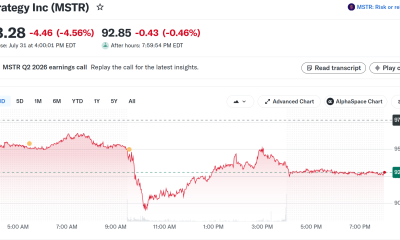
Strategy CEO Michael Saylor told investors that the preferred dividend tied to Strategy’s STRC shares will stay at 12% for August, despite STRC trading well below its $100 par value through July.
In a Saturday post on X, Saylor framed STRC as an income-oriented vehicle that he says can help investors “stretch your income,” while indicating that the semi-monthly dividend schedule approved earlier this year will continue. Strategy’s chief then reiterated a longer-term target price range for the preferred shares, even as market pricing suggests investors are still demanding a discount.
Key takeaways
- Strategy’s STRC preferred dividend will remain at 12% for August, according to Michael Saylor.
- August will mark the second month in a row that STRC dividends are paid semi-monthly, following a June shareholder vote.
- STRC shares closed at $89.46 on Friday, trading below $100 par value throughout July.
- Management has continued to state a corporate objective for STRC to reach and hold around $99–$100 over time.
- Strategy says it has built a sizable cash reserve to fund preferred payouts as it monetizes Bitcoin.
Dividend guidance holds steady even as STRC trades at a discount
While Strategy’s STRC preferred shares ended July below their stated $100 par value, shareholders were told that the August dividend will not increase. Michael Saylor made that point in a Saturday X post, continuing the company’s pitch that STRC is designed to provide a steady income stream for investors.
The 12% dividend rate is not a one-off adjustment: it follows a dividend change earlier in the cycle. In June, Strategy shareholders approved changes that moved STRC to a semi-monthly payment cadence. As a result, August will be the second month that the dividend is paid on that more frequent schedule.
On the market side, STRC ended Friday at $89.46, up 5.42% for the month that began with a dividend increase. According to the article, the daily trading volume on Friday was about two-thirds of STRC’s usual daily average—suggesting participation was fairly active, but not at peak levels.
Management’s messaging has also stayed consistent with its longer-term plan. On Friday, Strategy CEO Phong Le reiterated that the company’s “corporate objective is for STRC to trade at $99-$100 over time,” without offering a specific timeline for when that target could be met.
Cash reserve strategy tied to Bitcoin treasury and preferred obligations
Beyond dividend arithmetic, the company’s stability message appears to be supported by its Bitcoin treasury and liquidity planning. Saylor posted on Sunday that “Bitcoin Drive engaged,” a phrase he used alongside a chart of Strategy’s BTC purchases from Saylortracker.com, signaling the company’s ongoing buying activity.
That matters because Strategy’s preferred dividend economics are linked to how it finances obligations while its Bitcoin holdings remain exposed to market volatility. Last week, Strategy reported an $8.22 billion second-quarter net loss, which the report attributed largely to an $8.32 billion unrealized loss tied to movements in the price of its Bitcoin holdings during the quarter.
Even with that drawdown, Strategy said it has built a cash reserve intended to help cover preferred stock payouts after the launch of its BTC monetization program. The figures cited in the article include a $3.75 billion U.S. dollar reserve. Strategy also stated that the reserve is enough to cover more than two years of preferred dividend payments and interest obligations.
In practical terms, that guidance is meant to reduce concerns that near-term Bitcoin price fluctuations could immediately disrupt the dividend. Traders may still price STRC based on expected returns and relative risk, but a defined liquidity buffer can influence how investors interpret the sustainability of the payout.
Discount-to-par repurchases and the $99–$100 over-time goal
Another point investors are watching is how Strategy manages the preferred share discount. The article says Strategy recently repurchased $25 million of its STRC preferred shares at a discount to par and intends to continue buying the securities while they trade below $100.
This approach aligns with management’s public objective for STRC to trade closer to par over time. However, the market continues to price the shares significantly lower: with Friday’s close at $89.46, the gap to $100 remains substantial. That spread reflects uncertainty about timing—how quickly any pathway to par could play out, and whether dividends alone are enough to close the valuation gap.
Le’s repeated comment that the objective is $99–$100 over time, without specifying when, highlights the central tension: Strategy is emphasizing financial buffers and ongoing BTC-driven support, while the preferred market is still setting prices around a discount that persists through July.
Investors therefore have two parallel items to track. First is the dividend rate itself—now confirmed to stay at 12% for August. Second is whether Strategy’s buybacks and any treasury policy changes translate into steady demand for STRC preferred shares that could narrow the discount.
What to watch next for STRC holders
Going forward, STRC investors should monitor the next dividend payment cycle for August and pay close attention to whether Strategy follows through on continued preferred repurchases while the shares remain below par. At the same time, any updates related to “BTC monetization” and treasury allocation could influence how markets assess the company’s ability to fund preferred obligations during periods of Bitcoin volatility.


Ripple Director of Engineering Vijay Khanna urged XRP Ledger node operators on Aug. 2 to install xrpld version 3.2.1 after developers observed a validator manifest flood on July 31.
Summary
- July 31 manifest flooding prompted xrpld 3.2.1 while XRP Ledger continued closing ledgers normally throughout.
- Four safeguards now cap manifest size, message batches, outbound sharing and unknown-key cache growth network-wide.
- Operators should upgrade, verify xrpld is running, then restart again to clear persisted manifests safely.
The hotfix limits how nodes process, store and share data received from unknown validator identities.
The XRP Ledger continued closing ledgers normally during the event, according to XRP Ledger Operations. The available evidence therefore points to pressure on node resources and peer-to-peer communications rather than a confirmed loss of funds, altered transactions or failure of ledger consensus. Developers have not published a CVE identifier or financial-loss estimate connected to the incident.
XRPL 3.2.1 limits the manifest flood route
Validator manifests are cryptographically signed records that connect a validator’s stable master identity to the temporary key it uses for daily validation messages. When operators rotate those temporary keys, they publish a new manifest signed by the master key so other nodes can verify the change.
Before the hotfix, nodes could accept, cache and rebroadcast validly structured manifests associated with validator keys they did not recognize. An attacker could exploit that behavior by producing many unknown identities and forcing peers to spend memory, storage, bandwidth and processing capacity handling the data. The public code record describes the flaw as a problem with manifest propagation.
The official xrpld 3.2.1 release is dated July 31 and was published as the latest signed release early on Aug. 1. It contains six commits across 13 changed files, including four commits that directly restrict untrusted manifest handling.
Four safeguards reduce resource-exhaustion risk
The first safeguard rejects an oversized validator manifest before the node fully decodes it. That reduces the processing work an attacker can trigger by sending individual objects larger than the software expects.
The second limits the number of untrusted manifests carried in one network message. The cap applies when nodes receive the data and when they prepare manifest messages for peers. Oversized batches are dropped without automatically disconnecting an unpatched peer, which helps upgraded and older nodes remain connected during the rollout.
A third change limits the number of unknown validator identities held in a node’s manifest cache. The final code sets the maximum at 100. Once that capacity is reached, the software rejects manifests tied to new unlisted keys while continuing to process trusted or previously recognized validators.
The patch also changes how untrusted manifest information is retained and propagated. Trusted validator data remains available because the restrictions target unlisted peer gossip rather than manifests from configured or approved validators. This distinction allows normal validator key rotation to continue while blocking unchecked cache growth.
Node operators must complete a second restart
Khanna advised validators and other infrastructure operators to upgrade to version 3.2.1 “as soon as possible.” His instructions call for a normal software update, followed by a wait of one to two minutes and a check that xrpld is running. Operators should then restart the service again.
The second restart is important for nodes that may have retained unknown manifests before installing the fix. Updating changes future handling, while restarting the corrected server helps ensure old in-memory or previously retained data does not continue affecting operations.
Operators may also need to confirm that their systems trust Ripple’s current package-signing key. The release notes state that Ripple rotated the GPG key used to sign xrpld packages on Feb. 18. Existing installations that have not trusted the replacement key may not receive automatic upgrades successfully.
The update applies to infrastructure providers rather than ordinary XRP holders. Users do not need to move XRP, change wallet keys or create new accounts because of the manifest issue. Exchanges, custodians, wallet back ends, data providers and businesses that run their own XRPL servers should instead confirm their node versions and restart status.
The post-mortem will determine the incident’s scope
XRP Ledger Operations said a technical “post-mortem will follow soon.” As of Aug. 2, the project had not published that report, so the identity of the sender, the volume of manifests transmitted and the exact resource use across affected nodes remain undisclosed.
The report should also clarify when developers first detected the activity, whether any nodes became unavailable and how quickly operators adopted version 3.2.1. Although ledgers continued closing, slow patch adoption could leave individual servers exposed to renewed flooding even when the shared ledger remains operational.
The hotfix arrives shortly after XRPL’s larger version 3.2.0 rollout. That release, issued on June 15, renamed the reference server from rippled to xrpld and introduced infrastructure changes that required operators to update software and service configurations.
As previously reported, version 3.2.0 initially spread faster among validators than across the broader node network. The manifest flood adds a new reason for remaining operators to move beyond that release and install the hotfix.
Meanwhile, in related coverage, David Schwartz moved his XRPL infrastructure to version 3.2.0 as developers prepared the network for the new server naming and protocol features. Earlier, as crypto.news reported, node operators also faced a version 3.1.3 deadline tied to an amendment activation.
The next verified updates will be the promised post-mortem and fresh software-adoption data. Until then, the confirmed response remains limited to the 3.2.1 release, its four manifest controls and the request for operators to complete the upgrade and restart process.


Bloomberg Intelligence senior ETF analyst Eric Balchunas said on Aug. 2 that the Coldcard security failure strengthens the case for U.S. spot Bitcoin ETFs, especially for investors who want long-term price exposure without managing private keys.
Summary
- Galaxy traced 1,367.05 BTC across 4,585 addresses, valuing observed Coldcard losses near $88.6 million total.
- Balchunas argued institutional custody makes Bitcoin ETFs preferable for investors seeking only long-term price exposure.
- ETF investors avoid seed management but surrender direct ownership, payments, and round-the-clock Bitcoin network access.
His comments followed Galaxy Research’s estimate that three suspected attack waves drained 1,367.05 BTC, worth about $88.6 million, from 4,585 addresses.
Balchunas wrote, “Yes, an ETF fixes this,” while noting that some self-custody advocates dismiss the funds as “paper bitcoin.” That is his view on custody, not evidence that investors have moved money into ETFs because of the incident. U.S. markets were closed when he posted the weekend comments, leaving no verified post-comment fund-flow reaction.
Coldcard drain renews the Bitcoin ETF argument
Block’s Bitcoin engineering team found that a firmware integration error routed random-number generation through a deterministic MicroPython fallback instead of the intended hardware source. Its report said Mk2 and Mk3 devices on vulnerable firmware added no cryptographic entropy through that path. Later models used a limited secure-element reseed.
Coinkite’s security advisory covers Mk2 and Mk3 firmware from version 4.0.1 through 4.1.9, plus seeds generated on Mk4, Mk5 and Q devices before their fixed releases. The company released corrected firmware, but warned that updating software does not repair seeds created earlier. Users must generate a new seed and move their funds.
Galaxy’s latest estimate covers three suspected draining waves. The third removed 207.7294 BTC from 1,912 addresses and followed a different transaction pattern. Galaxy called $88.6 million its “estimated observed size,” meaning the figure remains an on-chain estimate rather than a final total confirmed by Coinkite or law enforcement.
Balchunas also questioned whether a reportedly small hardware-wallet company should protect life-changing sums. He called the reported staffing level “a red flag.” Coinkite has not publicly confirmed the headcount cited in his post, and company size alone does not establish whether a security system is adequate.
U.S. spot Bitcoin ETFs remove seed-management risk
A spot Bitcoin ETF removes the investor from seed creation, firmware updates, backups and wallet migration. The fund and its service providers manage those duties. BlackRock says its iShares Bitcoin Trust ETF, or IBIT, simplifies the operational and custody work involved in holding Bitcoin directly. IBIT reported $46.52 billion in net assets on July 31 and charges a 0.25% sponsor fee.
IBIT’s SEC filing says Coinbase Custody holds the trust’s private keys in segregated cold-storage wallets. It also names Anchorage Digital Bank as an additional custodian that BlackRock may use. The filing describes limited employee access, external control reviews and a process in which no single custodian employee has access to complete private keys.
Fidelity uses Fidelity Digital Assets to custody Bitcoin for its Wise Origin Bitcoin Fund. Such products let U.S. investors gain exposure through brokerage, trust and tax-advantaged accounts without operating a hardware wallet. That can matter to advisers and retirement investors who only seek price exposure.
However, the term “regulated ETF” needs context. IBIT is an SEC-reporting, Nasdaq-listed product, but BlackRock states that the trust is not registered under the Investment Company Act of 1940. It therefore does not receive every protection that applies to conventional registered mutual funds and ETFs.
Bitcoin ETFs transfer custody risk instead of erasing it
The ETF structure replaces individual seed risk with institutional custody, operational and counterparty risk. IBIT’s annual filing warns that hackers, employee misconduct, technical failures or unauthorized transfers could still cause losses. It also says Coinbase’s shared insurance may be insufficient for every possible event.
The filing states that shareholders cannot bring direct claims against the Bitcoin custodian under the custody agreement. No party guarantees all trust assets or service-provider obligations. These disclosures do not show that ETFs are less secure than personal wallets. They show that the risk moves to institutions and contractual arrangements.
ETF shareholders also own securities rather than spendable Bitcoin. IBIT shares trade on Nasdaq, and redemptions occur through authorized participants in baskets of 40,000 shares. Retail investors cannot withdraw ETF holdings to a personal address, make Bitcoin payments or transact whenever the network is open.
As previously reported in crypto.news’ Bitcoin ETF explainer, the wrapper offers easier access and professional custody but removes direct ownership and 24/7 use. In related coverage, a technical review of the Coldcard bug found that the failure involved seed generation rather than phishing or physical theft.
The $89M drain is not yet an ETF inflow catalyst
Balchunas’s argument may appeal to investors who only want Bitcoin’s price performance. The incident may also encourage holders to divide funds among personal wallets, multisignature setups and regulated custodians instead of relying on one device or provider. These remain possible responses rather than confirmed investor behavior.
Still, no verified data shows that the Coldcard drain has created new Bitcoin ETF demand. BlackRock’s latest official figures cover July 31, before Balchunas’s Aug. 2 comments. IBIT’s NAV fell 2.78% that day, but the move cannot be tied solely to the wallet incident.
The next U.S. trading session may show whether ETF flows change, although one day of activity would not prove a connection. Bitcoin prices, economic conditions and portfolio rebalancing also drive fund creations and redemptions.
Crypto World
Legacy crypto on-ramps and bridges will disappear as payments become invisible, Fun CEO says


While those applications have become increasingly visible, the infrastructure that enables deposits, withdrawals and settlement has largely remained behind the scenes.
Fun is one of the companies building that infrastructure. The firm said it powers 100% of deposits and withdrawals on Polymarket and deposit flows into Aave’s largest vaults, while processing more than $3 billion in monthly transaction volume.
The company has raised more than $75 million to date.
From payment rails to funding flows
Fine said today’s crypto payments ecosystem remains unnecessarily fragmented, with developers forced to stitch together different card processors, banking partners, crypto assets, blockchains and bridges to create funding experiences.
Instead of relying on individual payment rails, platforms should optimize around the end goal of getting users funded as quickly and seamlessly as possible, he says.
“In Web2, payments are highly fungible,” Fine said. “In Web3, they’re much more complex because every payment method behaves differently. Teams keep rebuilding the same infrastructure over and over again instead of building unified optimized funding flows.”
That shift means many existing crypto payment businesses risk becoming obsolete, according to Fine. Companies built around converting fiat into crypto or moving assets between blockchains are solving an intermediary step that users never cared about in the first place, he argued.
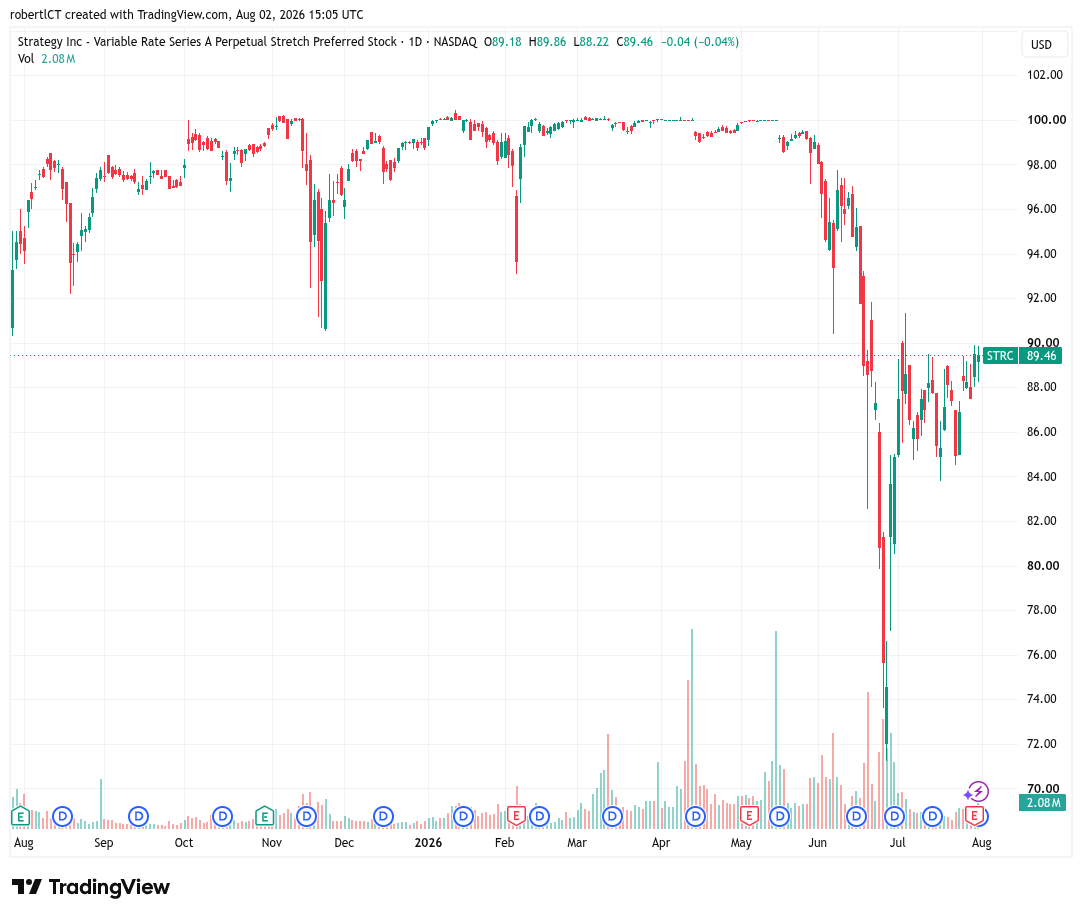
While Strategy’s preferred STRC shares ended July well below their $100 par value, investors were told that their August dividend will not increase, holding at 12%.
Executive chairman Michael Saylor delivered the news in a tweet on Saturday, continuing to pitch STRC as a way to “stretch your income.” August will be the second month that the dividend will be paid semi-monthly after shareholders approved that change in June.
STRC shares closed at $89.46 on Friday, clocking a 5.42% price increase for the month which began with a dividend hike — 50 basis points to 12% — after a poor stock performance in June. The volume on the Nasdaq-traded shares on Friday were about two-thirds of their daily average.

STRC shares continued to trade significantly below their $100 par value in July.
Source: TradingView
On Friday, Strategy CEO Phong Le reiterated that management’s “corporate objective is for STRC to trade at $99-$100 over time,” without elaborating when investors might expect that to transpire.
Related: Bitcoin ETFs end July in the green despite late-month selling
Building cash reserve to make preferred payouts
Saylor, however, did take to social media on Sunday to dangle the possibility that the company will be making an announcement of a change in its Bitcoin treasury holdings. “Bitcoin Drive engaged,” read his X post, following a familiar pattern of posting a chart of Strategy’s BTC buys from Saylortracker.com to start off the week.
Last week, Strategy reported an $8.22 billion second-quarter net loss, driven primarily by an $8.32 billion unrealized loss on its Bitcoin (BTC) holdings as the cryptocurrency’s price declined during the quarter.
The Bitcoin treasury company said it has built a $3.75 billion cash reserve to support preferred stock payouts following the launch of its BTC monetization program.
Strategy also said it has built a $3.75 billion U.S. dollar reserve, enough to cover more than two years of preferred dividend payments and interest obligations. The company recently repurchased $25 million of its STRC preferred shares at a discount to par and said it intends to continue buying the securities while they trade below $100.
Magazine: Here’s why the CLARITY Act’s ethics deal may be so hard to reach


Minnesota’s prediction market ban remained blocked on Aug. 2, one day after the law was scheduled to take effect.
Summary
- July 27 injunction keeps Kalshi and Polymarket operating while Minnesota’s preemption case continues in court.
- Walz barred state employees from using confidential information to trade prediction markets for private benefit.
- Fairshake reported $126.97 million cash on hand through June, amplifying crypto’s broader election influence nationwide.
U.S. District Judge Katherine Menendez granted a preliminary injunction on July 27 to the Commodity Futures Trading Commission, Kalshi and Polymarket US. The order prevents Minnesota from enforcing its new statute against CFTC-registered designated contract markets while three related cases continue.
The Minnesota law would make it a felony for businesses to create, operate or intentionally support covered prediction markets. It also reaches certain data providers, payment services and advertisements. Menendez found that the plaintiffs were likely to succeed on at least part of their federal preemption claim because many event contracts may qualify as swaps under the Commodity Exchange Act.
Court win protects federal markets, but only for now
The ruling does not settle the dispute. Menendez found that the CFTC’s exclusive jurisdiction probably covers a “considerable swath” of contracts offered by Kalshi and Polymarket. However, she also said the platforms had not shown that every listed event contract meets the federal definition of a swap. Any permanent injunction could therefore protect fewer products than the current order.
Minnesota Attorney General Keith Ellison said prediction markets are “gambling, plain and simple.” That remains the state’s legal position, not a final court finding. Kalshi responded that “States cannot ban things that they don’t have jurisdiction over.” The company’s statement likewise reflects its interpretation of federal law rather than the case’s final outcome.
The injunction only covers the new prediction market statute as applied to CFTC-registered markets. It does not decide whether Minnesota can apply older gambling laws to individual sports or entertainment contracts. The Department of Public Safety has not said whether it views the platforms as illegal under those existing provisions or whether another enforcement action is underway.
As previously reported, the current relief will remain in place until the district court reaches a final decision unless a later order or appeal changes it. The court could ultimately distinguish between contracts with financial or economic consequences and products that more closely resemble ordinary wagers.
Walz shifts Minnesota’s focus to insider trading
Governor Tim Walz responded one day after the ruling with Executive Order 26-09. It prohibits covered state employees, including the governor, lieutenant governor and agency commissioners, from using nonpublic or confidential government information to trade prediction-market contracts for private benefit.
The order does not cover the legislature, courts, independent elected officials or several boards and commissions. Walz encouraged those institutions to adopt similar policies. It becomes effective 15 days after publication in the State Register and filing with the secretary of state.
A new federal enforcement case also shows that CFTC oversight does not leave manipulation entirely unpoliced. On July 31, the agency ordered former U.S. Representative George Santos to disgorge $17,569.98, pay a $17,500 penalty and accept a three-year trading ban over manipulative activity in a State of the Union event contract.
The CFTC order said Santos traded on whether he would attend the speech while making misleading public statements about his plans. The agency said those statements moved contract prices in a direction that favored his positions.
Meanwhile, as crypto.news reported, Kalshi has introduced employer disclosures, risk scoring and expanded surveillance for higher-risk contracts. The company said it blocked more than 100 potential insider trades and made 20 law-enforcement referrals during the first quarter of 2026. Those remain company-reported figures.
U.S. politics could pull crypto lawmakers and PACs into the fight
The Minnesota ruling could give pro-crypto lawmakers another example for arguing that national financial markets need one federal framework. The CLARITY Act does not regulate prediction markets directly. However, its supporters are also seeking a larger CFTC role in U.S. digital asset oversight. Senate lawmakers released updated market-structure text on July 22 after the Banking Committee advanced the measure in May.
The court dispute also creates a counterargument for lawmakers wary of expanding the commission’s mandate. A July 21 Senate letter asked the Government Accountability Office to review a reported 25% reduction in CFTC staffing and weaker enforcement activity. Critics could argue that Congress should not widen the regulator’s duties without ensuring it has enough staff to oversee both digital assets and fast-growing event markets. This is a political inference based on the agency’s expanding workload and the staffing concerns raised in Congress.
The case does not involve Fairshake or another crypto PAC. Still, it could shape campaign arguments surrounding candidates supported by the industry. FEC records showed that Fairshake held approximately $126.97 million in cash at the end of June and had spent $74.25 million during the current two-year reporting period.
In related coverage, Protect Progress spent more than $2 million in Michigan’s 13th District race, where challenger Donavan McKinney tied crypto lobbying to President Donald Trump’s business interests. Similar campaign attacks could connect support for broader CFTC authority with the Trump family’s prediction-market relationships.
Kalshi named Donald Trump Jr. a strategic adviser in January 2025. Polymarket later added him to its advisory board when his investment firm, 1789 Capital, took a stake in the company. Those corporate relationships are confirmed, although they do not prove that the White House directed the CFTC’s Minnesota litigation.
Sports-law attorney Daniel Wallach described the change in federal policy as “classic regulatory capture.” That is his assessment, not a judicial or regulatory conclusion. However, the family relationships may give opponents of pro-crypto candidates a clearer campaign message about industry access, federal authority and possible conflicts.
Conflicting state cases keep national rules unsettled
Minnesota is one part of a wider federal-state contest. The CFTC has filed cases against several states to defend what it calls exclusive jurisdiction over registered prediction markets. Yet courts have not produced one nationwide answer. Minnesota’s injunction favored the platforms, while rulings involving Wisconsin and Washington allowed state gambling challenges to advance.
New York added another case on July 31 by suing Kalshi and alleging that its platform operates as unlicensed gambling. The state seeks an injunction, restitution, penalties and forfeiture of alleged gains. Those claims remain allegations that Kalshi can contest in court.
The CFTC’s proposed prediction-market rule is another key track. The public comment period closed on July 27. The proposal would define “gaming,” establish factors for public-interest reviews and create a process lasting as long as 90 days for certain event contracts. The commission has not issued a final rule.
There’s rarely a big altcoin gainer during the current market conditions, in which every breakout attempt is halted in its tracks. This is particularly true for weekend moves, as the market tends to freeze on Saturday and Sunday.
The latest example came in the past 36-48 hours. Even though the situation in the Middle East continues to develop quickly, with Trump claiming a Hormuz Strait deal is in the making and Iran refuting his statement once again, BTC and most altcoins have remained sluggish.
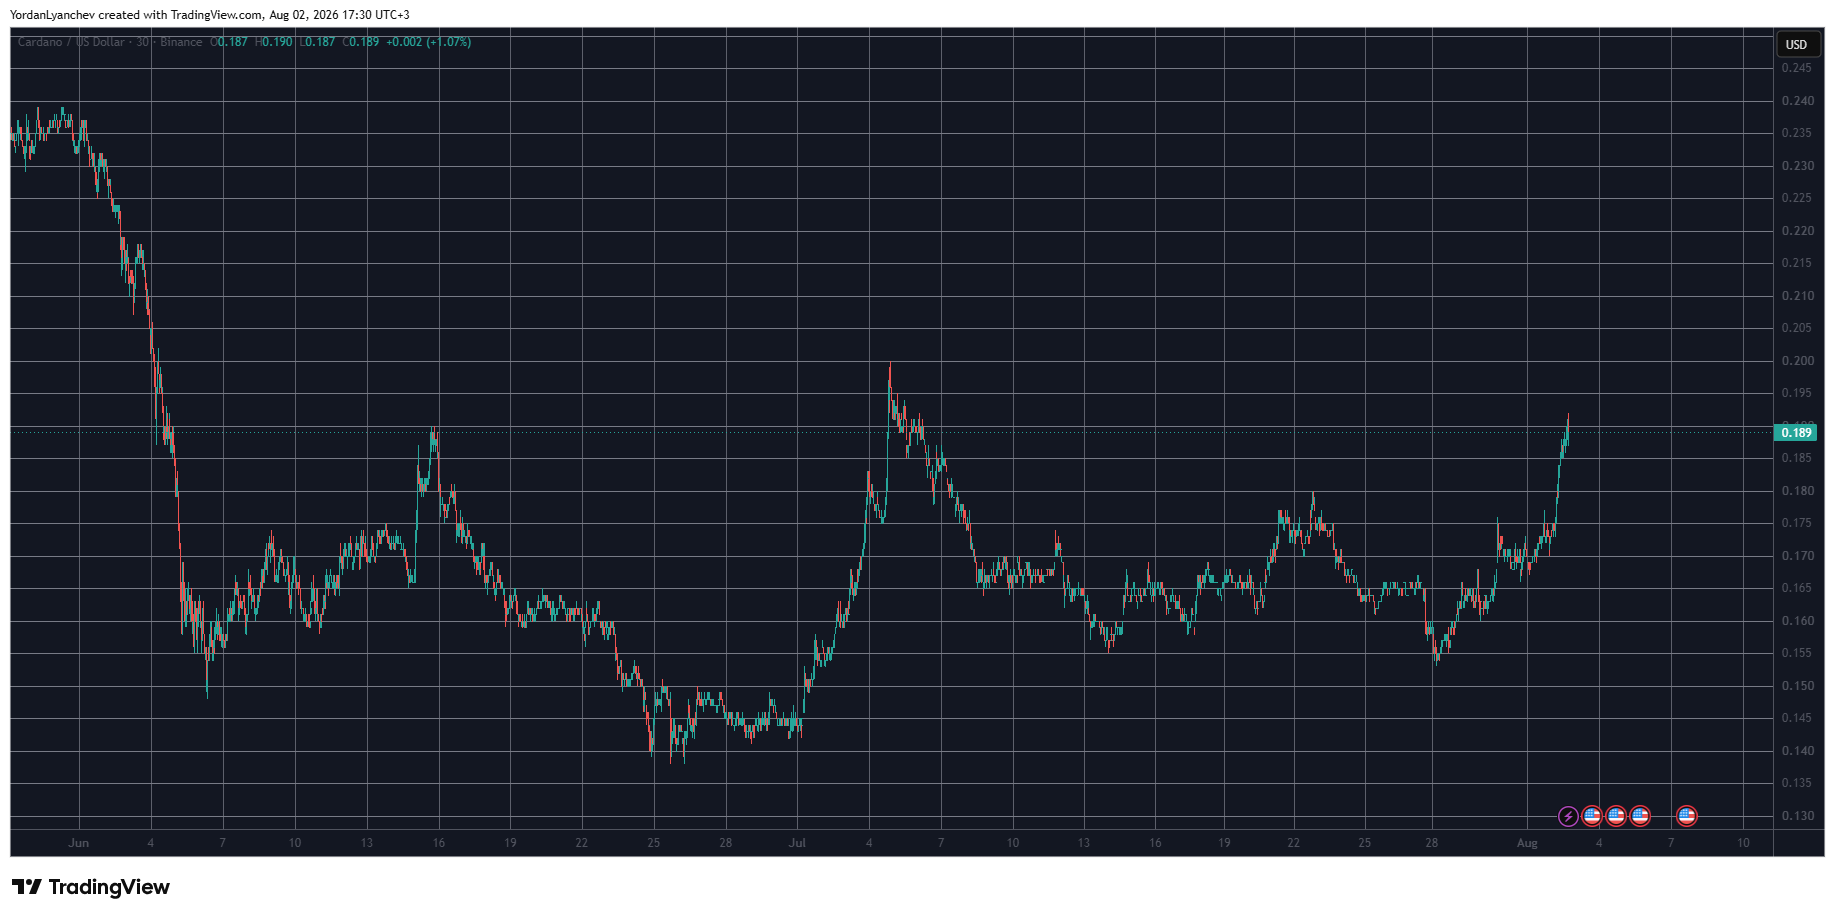
However, Cardano’s ADA has emerged as the clear winner this weekend, gaining over 9% and jumping past $0.19 hours ago for the first time in almost a month. Here’s the most likely reason and what could follow next.
Whales Are Buying
Since we are excluding a rally from the broader market, perhaps the most obvious reason behind ADA’s impressive resurgence over the past day has been the recent behavior of whales. These large market participants, who can influence the underlying asset’s price moves with big purchases or sales, have gone on an accumulation spree.
Santiment Intelligence data shared by Ali Martinez shows that whales have scooped more than 240 million ADA in less than a week. Their total holdings went to 14.55 billion before retracing slightly.
The analyst concluded that this substantial acquisition has helped fuel the asset’s notable 22% surge in the past five days, while the rest of the market stagnates.
Whales loaded up. Cardano took off.
Over 240 million $ADA have been accumulated in the past five days, helping fuel a 22% price surge per data from @SantimentData. pic.twitter.com/6Q6P6luBZn
— Ali Charts (@alicharts) August 2, 2026
Major Breakout Knocking on the Door
Another analyst going under the X moniker, Gerla, noted that ADA is “knocking on the door of a major breakout.” Their chart shows that ADA is fighting for the $0.19-$0.20 resistance level now, which capped its previous breakout attempt last month.
However, the bullish RSI divergence and the completion of an inverse head-and-shoulders suggest that ADA finally has the strength to overcome that obstacle and aim at the next one, positioned at around $0.30.
ZAYK Charts was even more bullish, indicating that a successful surge past the first resistance level could pave the way for another leg up toward $0.50.
The post Why Is Cardano (ADA) Up 9% Today While the Crypto Market Stalls? appeared first on CryptoPotato.
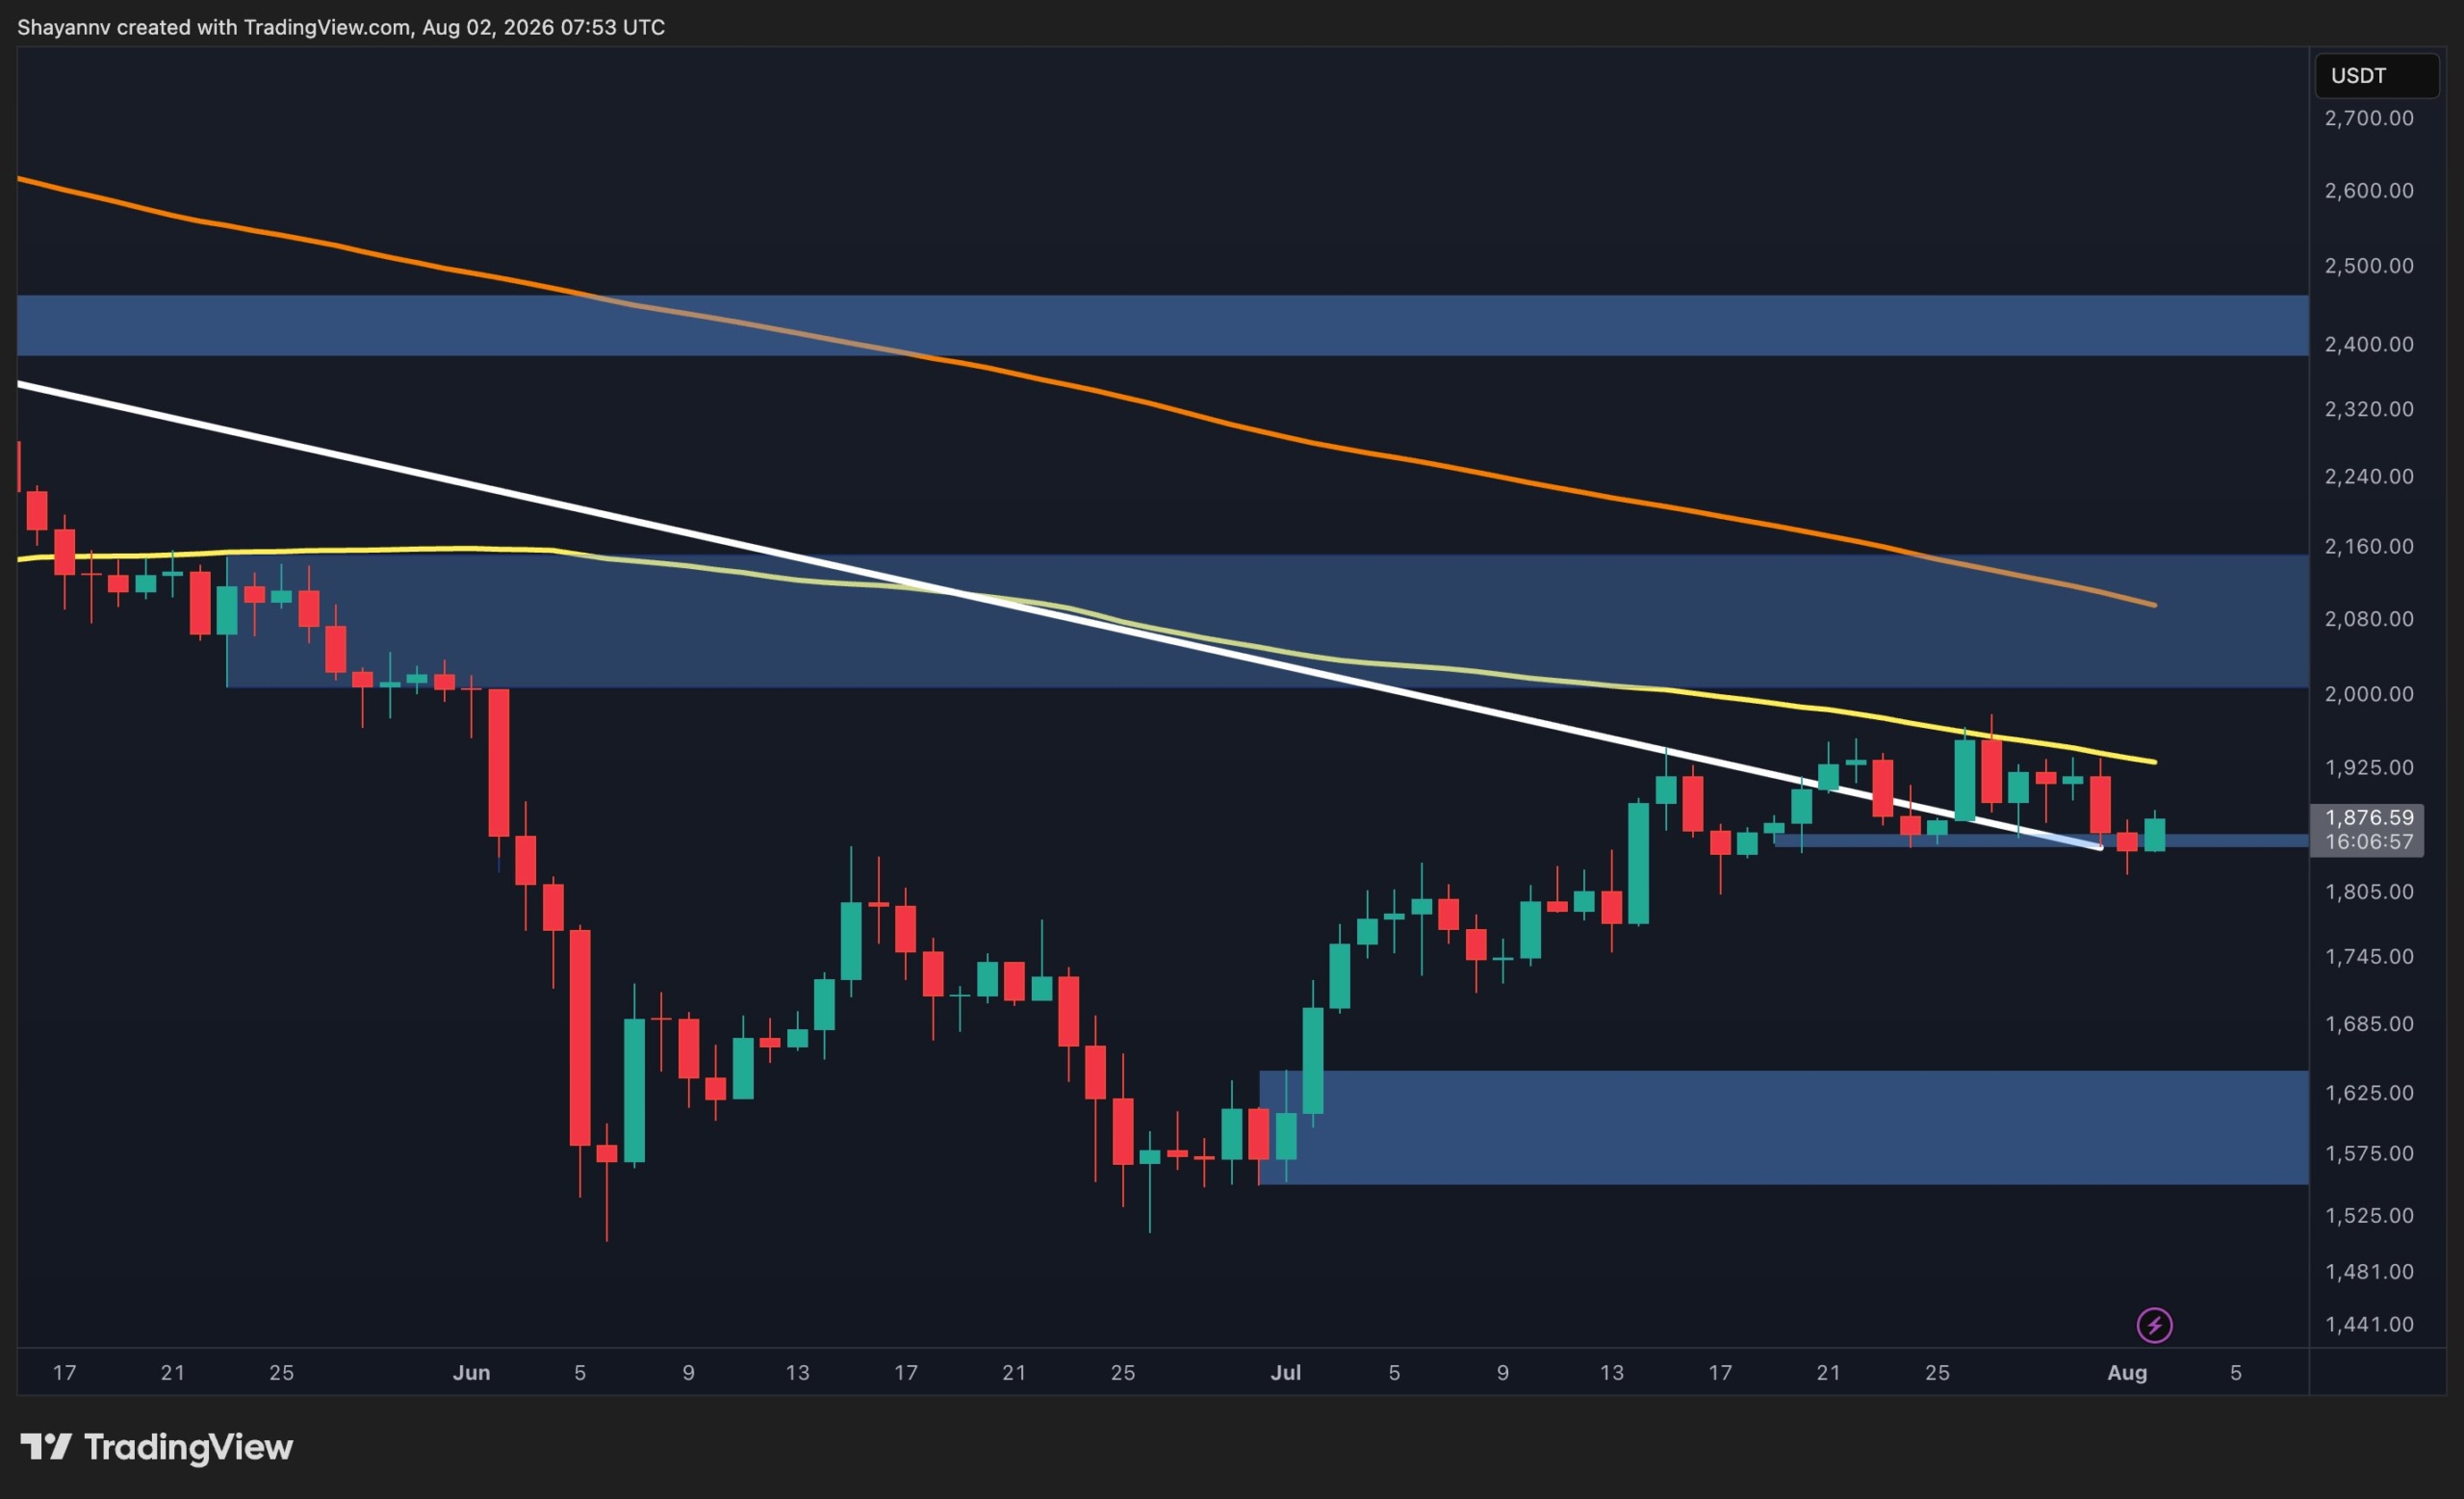
After several failed attempts to extend its recovery, Ethereum is beginning to show signs of exhaustion beneath the major100-day MA. The latest rejection from this zone has weakened short-term momentum and increases the probability of a broader pullback if key support levels fail to hold.
Ethereum Price Analysis: The Daily Chart
On the daily timeframe, ETH’s outlook is gradually shifting toward a bearish bias after multiple failed attempts to reclaim the 100-day moving average. The repeated rejection from this dynamic resistance around $1.95K, combined with the emergence of bearish daily candles, suggests buyers are losing momentum.
Meanwhile, Ethereum continues to struggle with the descending channel, with the upper boundary represented by the white trendline serving as the most critical support.
If sellers manage to push the price back inside this channel, it would confirm a bearish continuation and likely trigger a deeper decline toward the $1.56K to $1.64K demand zone. On the upside, bulls must first reclaim the $1.88K to $1.91K resistance area before attempting another move toward the 100-day MA near $1.95K.
ETH/USDT 4-Hour Chart
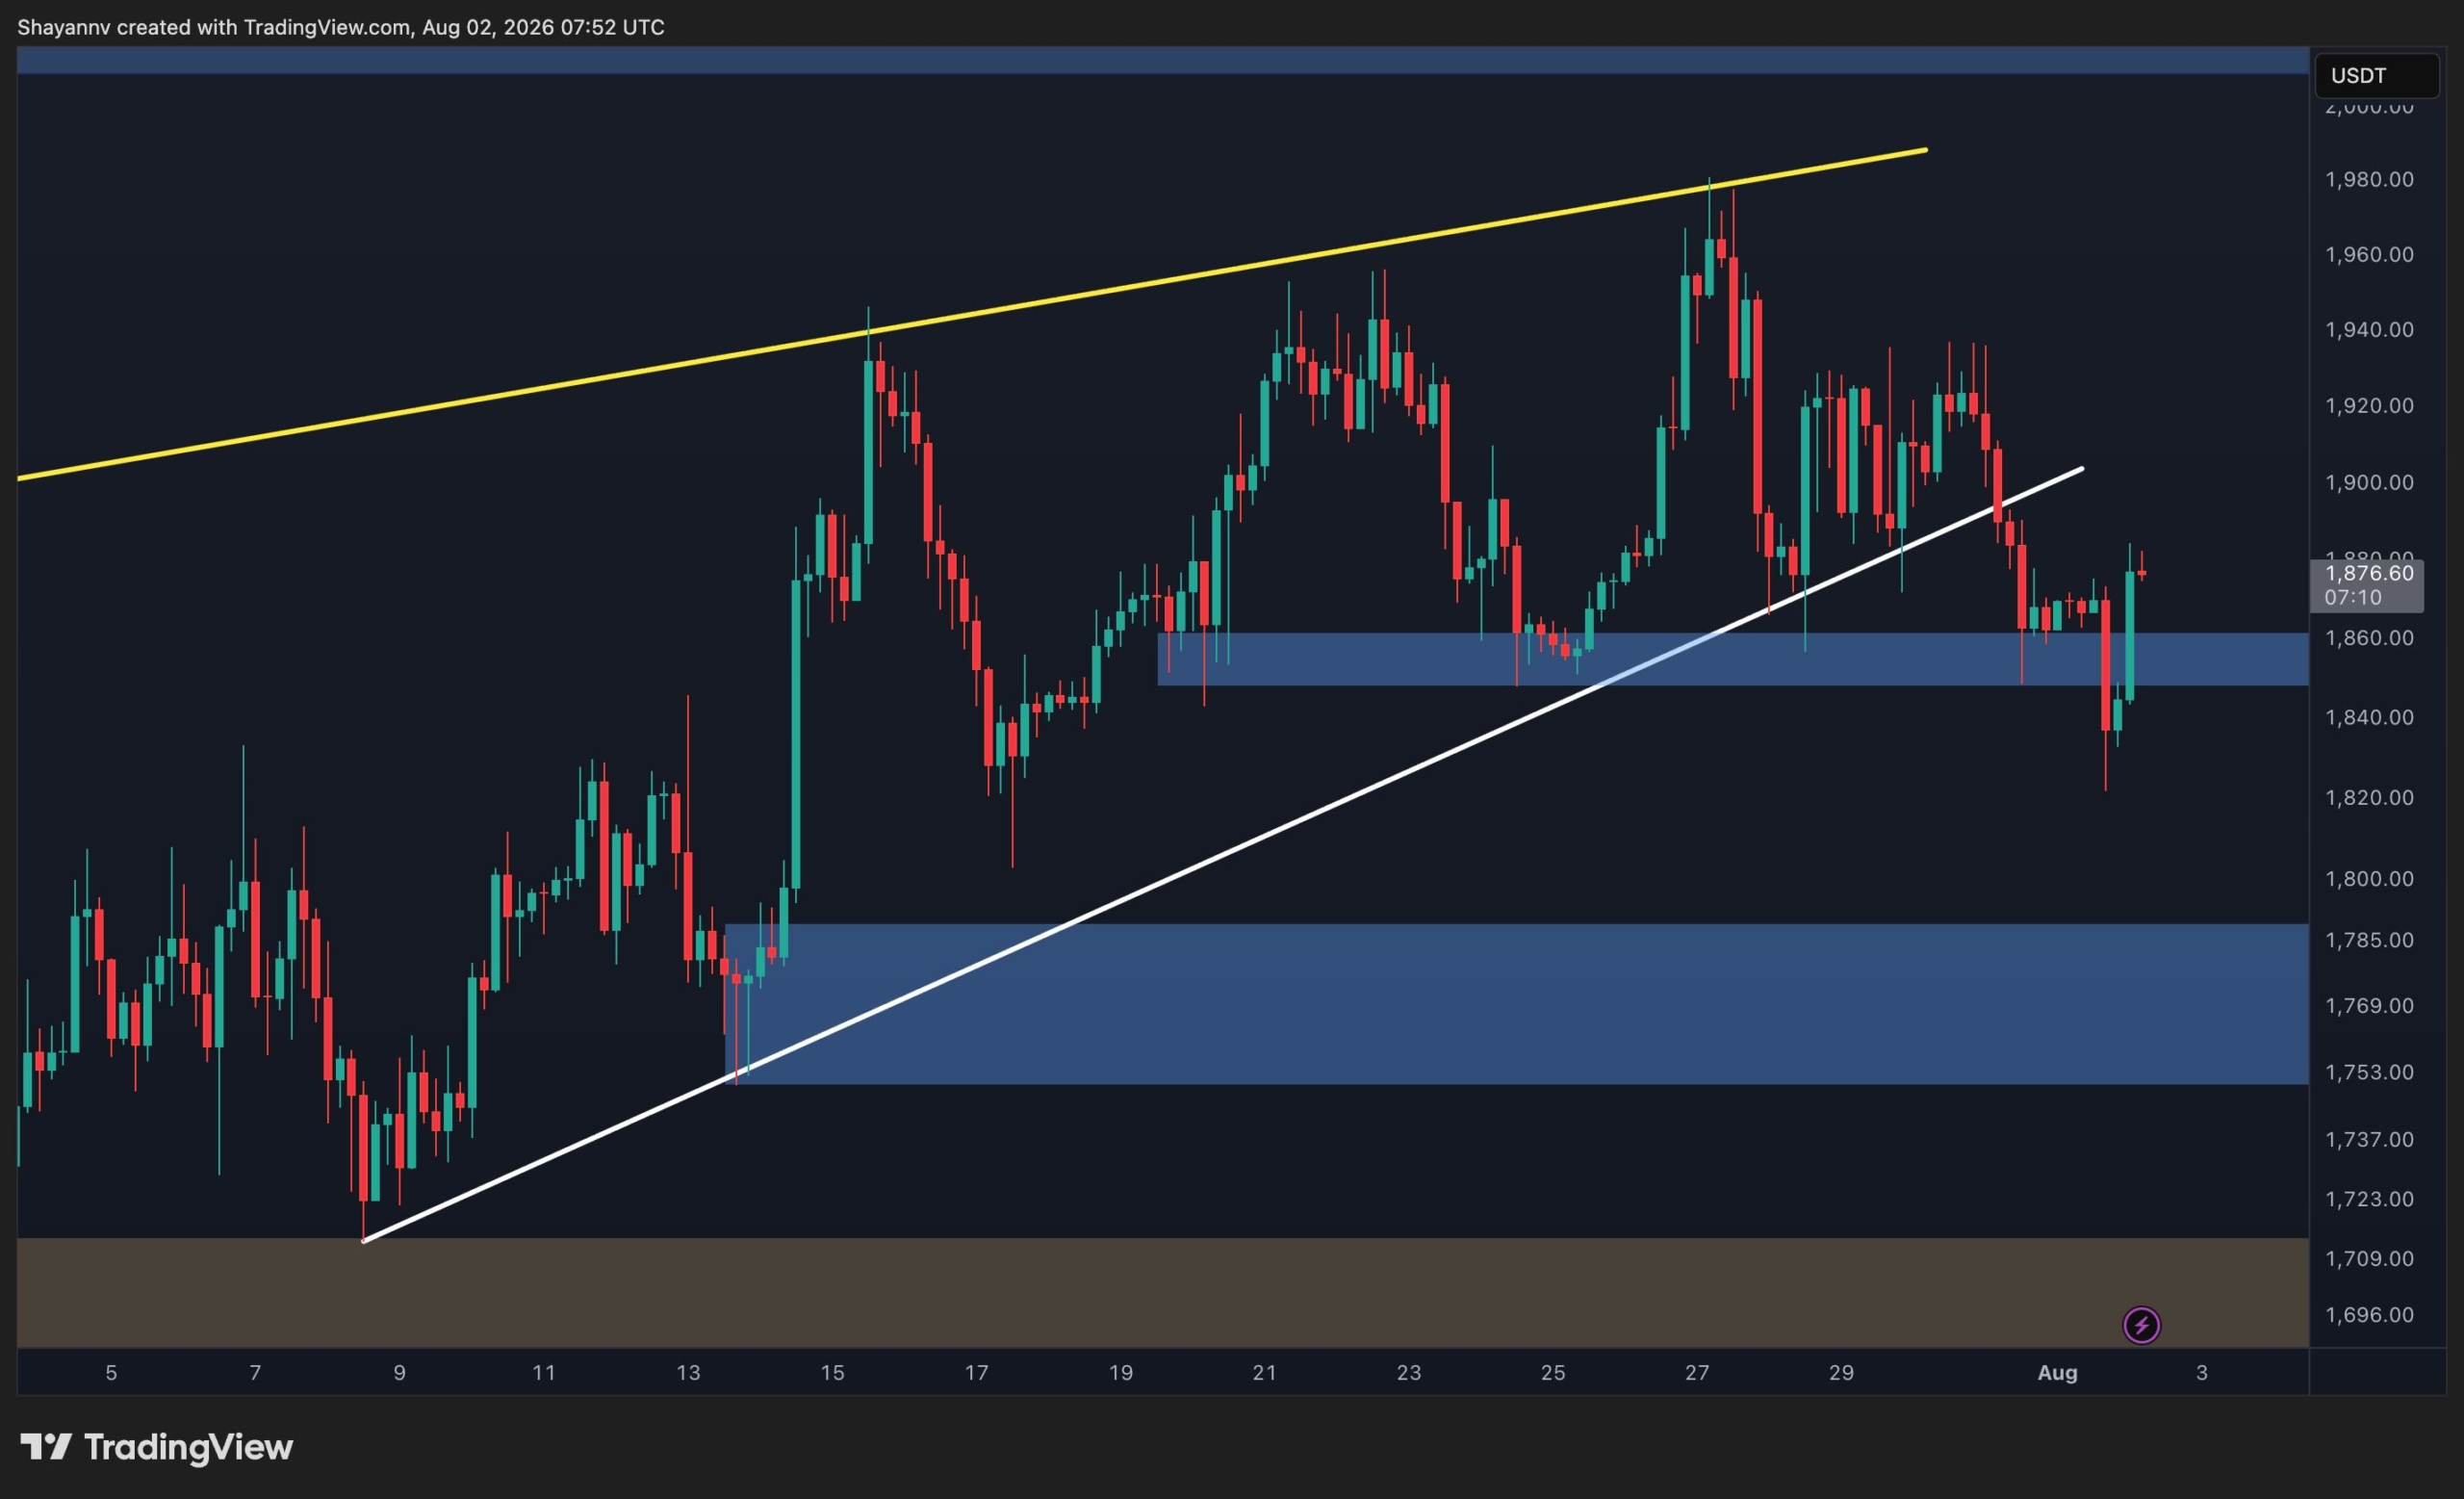
The 4-hour chart has turned more bearish after Ethereum broke below its ascending trendline, signaling that buyers have lost short-term control. This breakdown shifts the focus toward lower support levels unless bulls can quickly reclaim the broken structure.
The first support now lies within the $1.85K to $1.87K demand zone, where price is currently attempting to stabilize. Losing this area would likely accelerate the decline toward the next major demand zone between $1.75K and $1.79K.
On the other hand, the $1.88K to $1.91K supply zone has become the primary threshold for buyers. A successful reclaim of this region would invalidate the immediate bearish scenario and could allow Ethereum to challenge the descending resistance and the 100-day moving average once again.
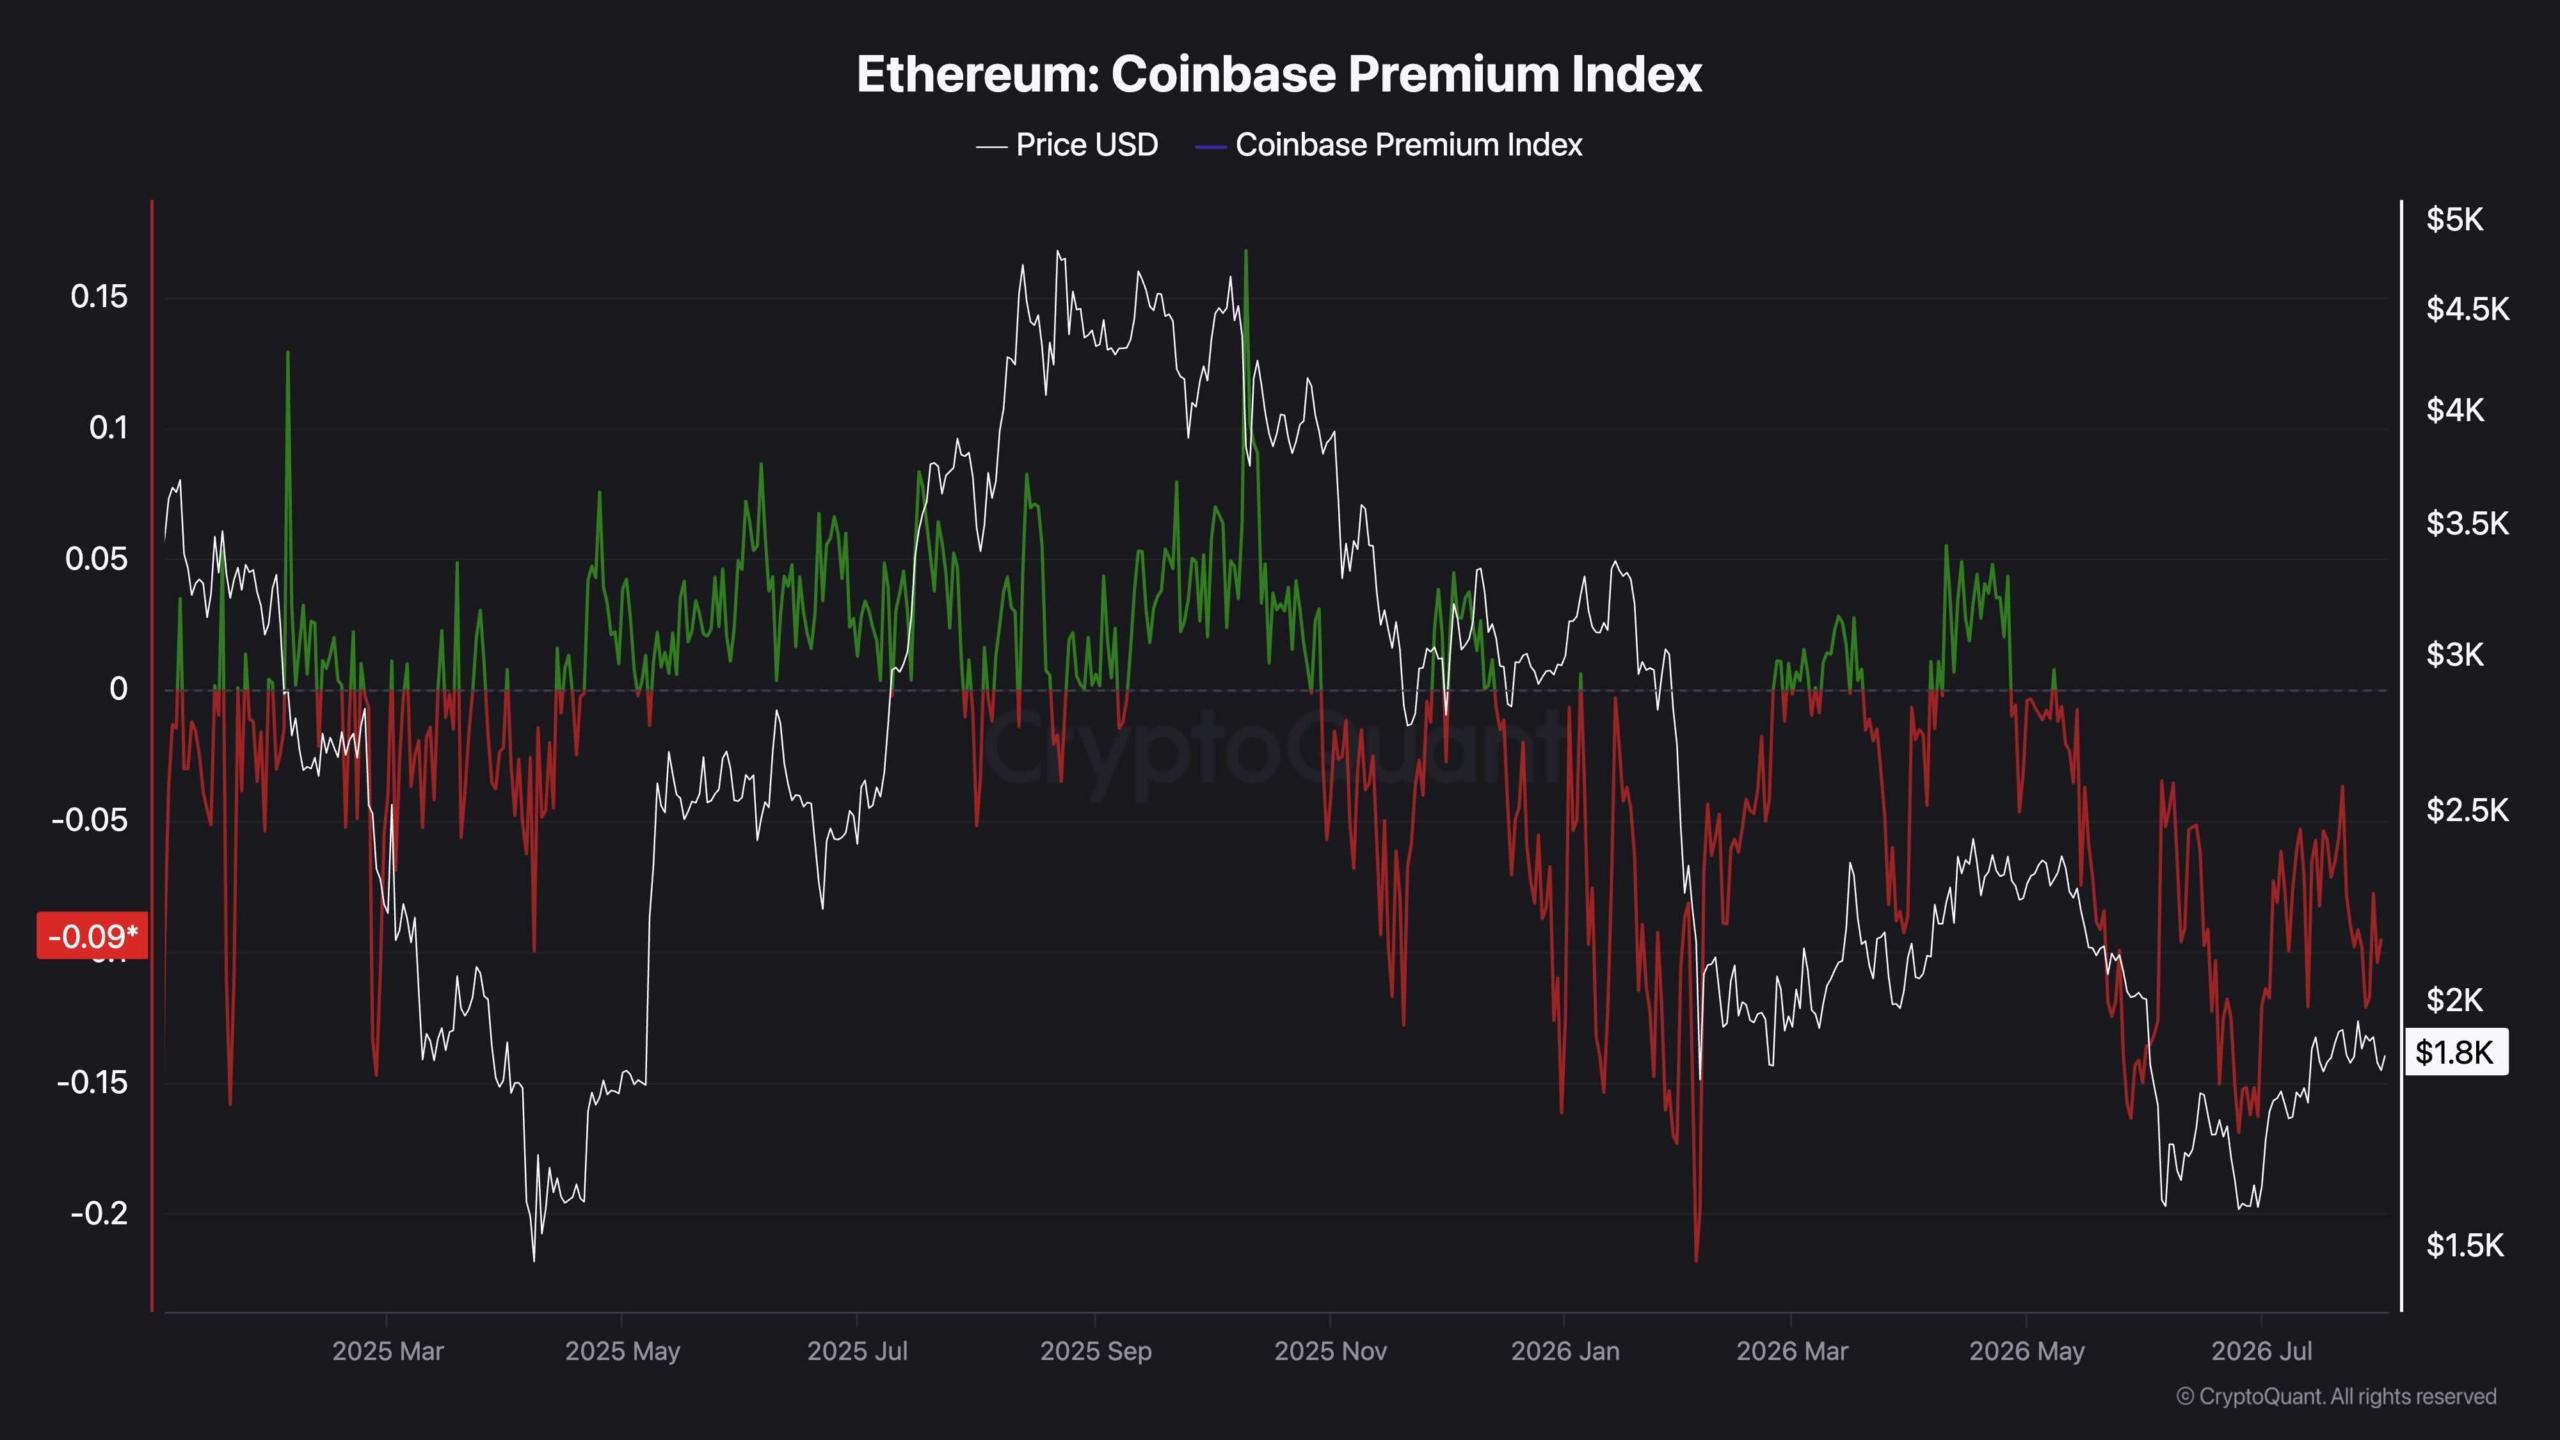
Sentiment Analysis
The Coinbase Premium Index remains in negative territory, indicating that Ethereum continues to trade at a discount on Coinbase relative to other major exchanges. This persistent negative premium suggests buying pressure from U.S.-based institutional participants remains relatively weak despite the recent recovery.
Historically, sustained positive readings have accompanied stronger bullish phases, whereas prolonged negative values often reflect cautious institutional sentiment. Until the premium returns to positive territory and remains there consistently, the current rebound may struggle to develop into a sustained uptrend, leaving Ethereum vulnerable to additional downside pressure if technical support levels begin to fail.
The post Ethereum Price Analysis: ETH’s Double Rejection at $2K Spells More Trouble Ahead appeared first on CryptoPotato.
Ripple’s XRP remains under steady selling pressure as the latest rebound attempts continue to lose momentum. The recent price action suggests sellers are maintaining control, while buyers are once again being forced to defend a critical support area.
Ripple Price Analysis: The Daily Chart
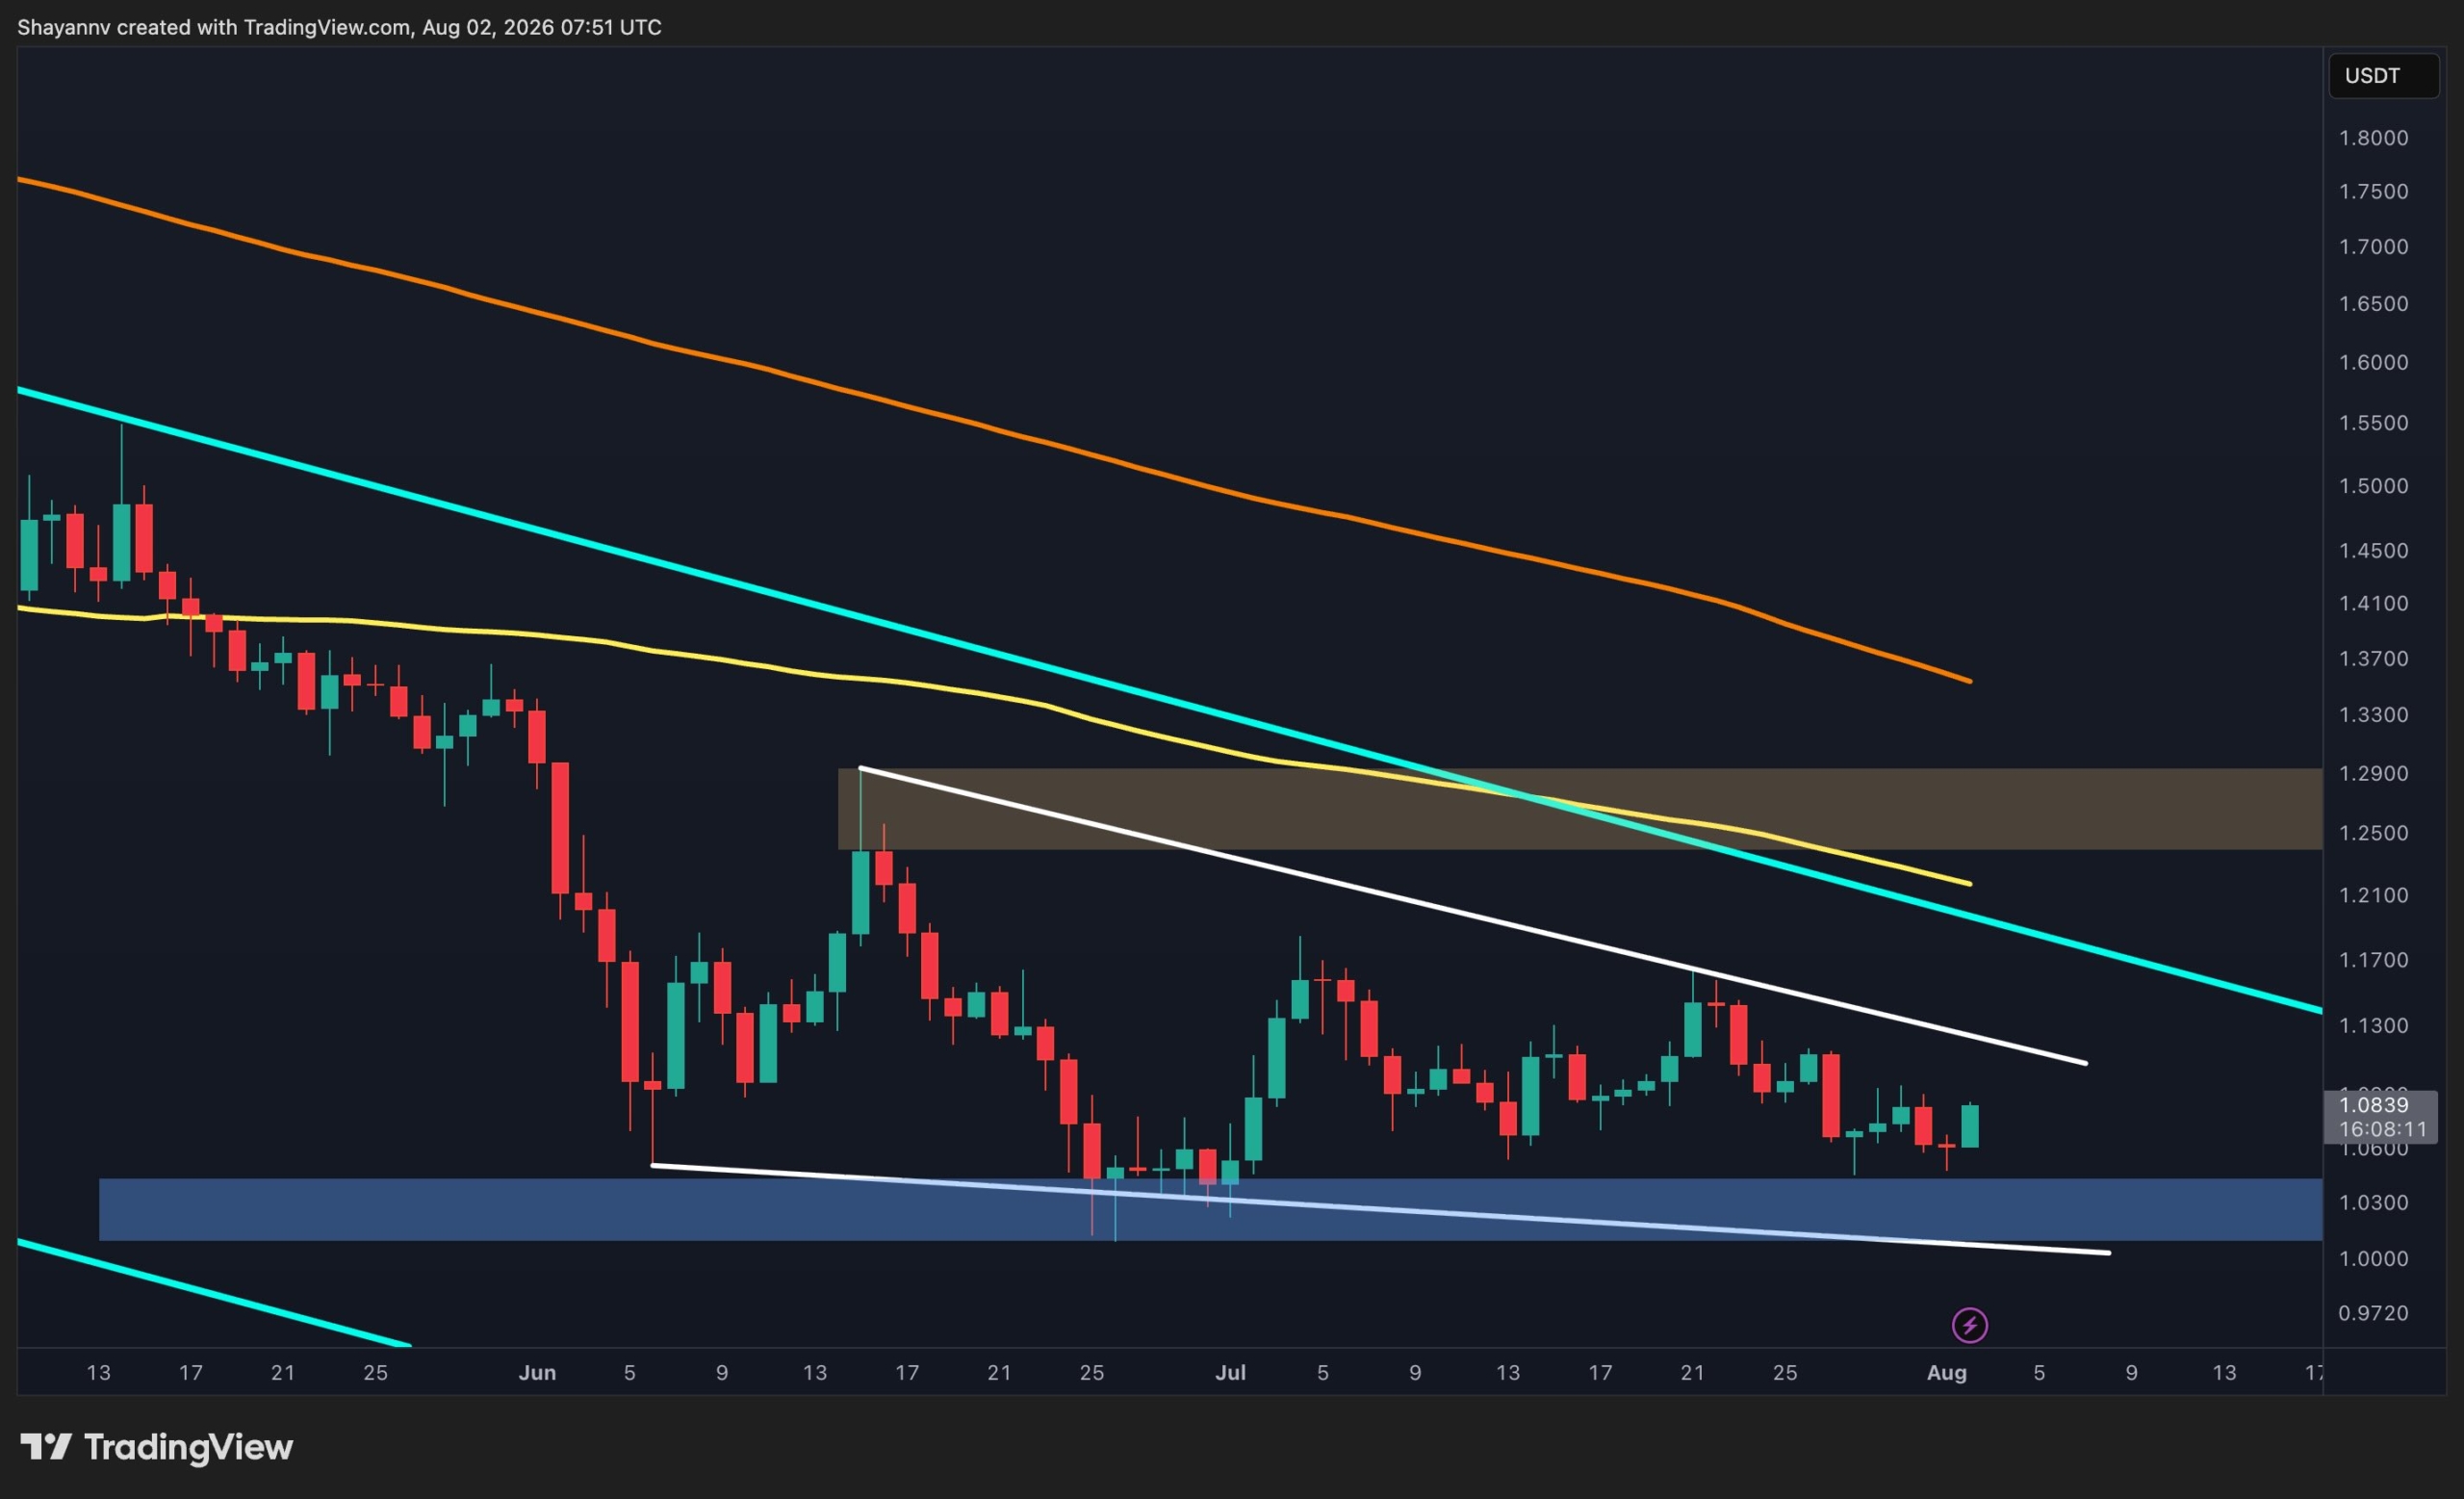
The daily chart shows little improvement compared to the previous analysis. The asset continues to trade beneath the descending resistance trendline while remaining well below the major moving averages, preserving the broader bearish market structure.
The latest candles indicate that sellers remain in control after another failed recovery attempt, pushing the price back toward the key demand zone around $1.01 to $1.04. This support has repeatedly prevented a deeper decline over the past several weeks, making it the most important level to monitor.
As long as XRP remains below the descending trendline and the main resistance between $1.24 and $1.29, the broader outlook favors continued weakness. A decisive breakdown below the $1.01 to $1.04 support zone would likely accelerate the decline toward the next major support around $0.89.
XRP/USDT 4-Hour Chart
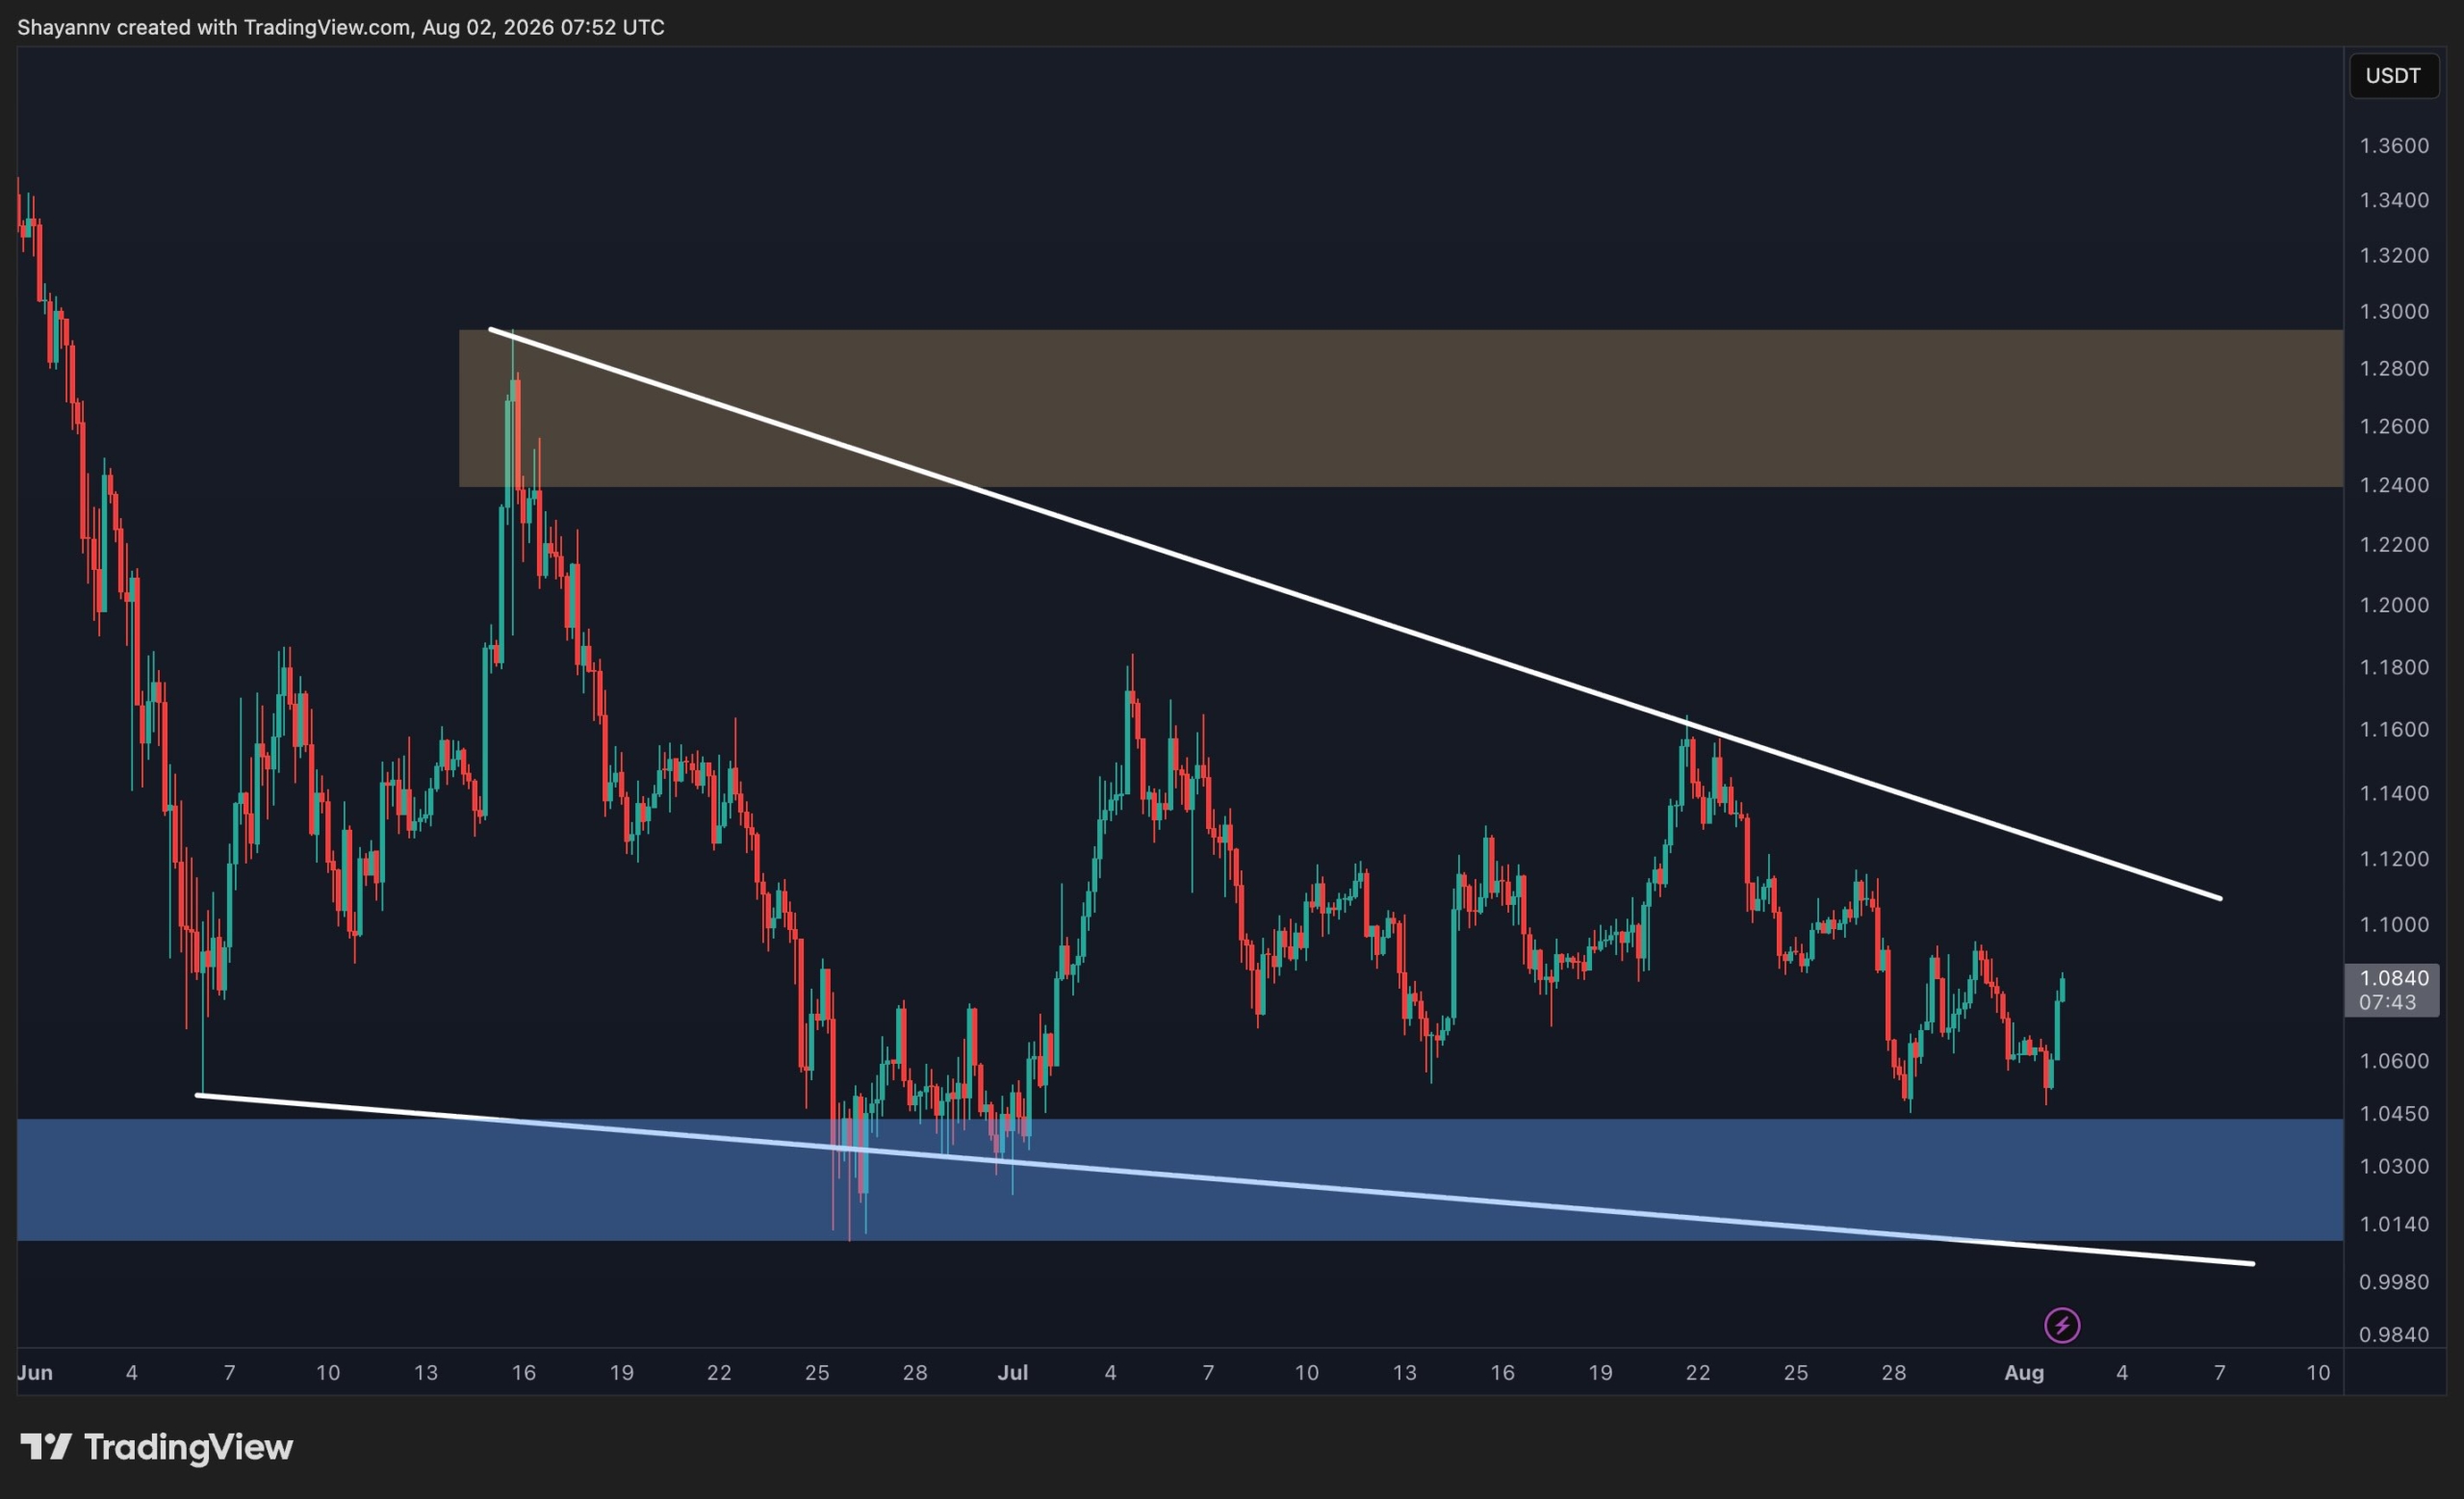
On the 4-hour timeframe, rather than recovering from support, XRP has continued to print lower highs and lower lows while remaining capped by the descending resistance trendline.
The recent rejection near $1.09 was followed by another decline toward the $1.01 to $1.04 demand zone, showing that buyers have yet to regain control. This area remains the last significant short-term defense for the bulls.
If this support fails, the bearish momentum is likely to intensify and extend the decline toward lower levels. Conversely, buyers would first need to reclaim the descending trendline before any meaningful recovery toward the $1.24 to $1.29 resistance zone could be considered. Until then, rallies are likely to face selling pressure and remain corrective in nature.
The post XRP Price Analysis: Is a Drop Below $1 Inevitable as Sellers Stay in Control? appeared first on CryptoPotato.
Bitcoin continues to trade without a decisive directional bias as both buyers and sellers defend key technical levels. Until one side forces a confirmed breakout, the current environment is likely to remain dominated by range-bound price action and short-term liquidity grabs.
Bitcoin Price Analysis: The Daily Chart
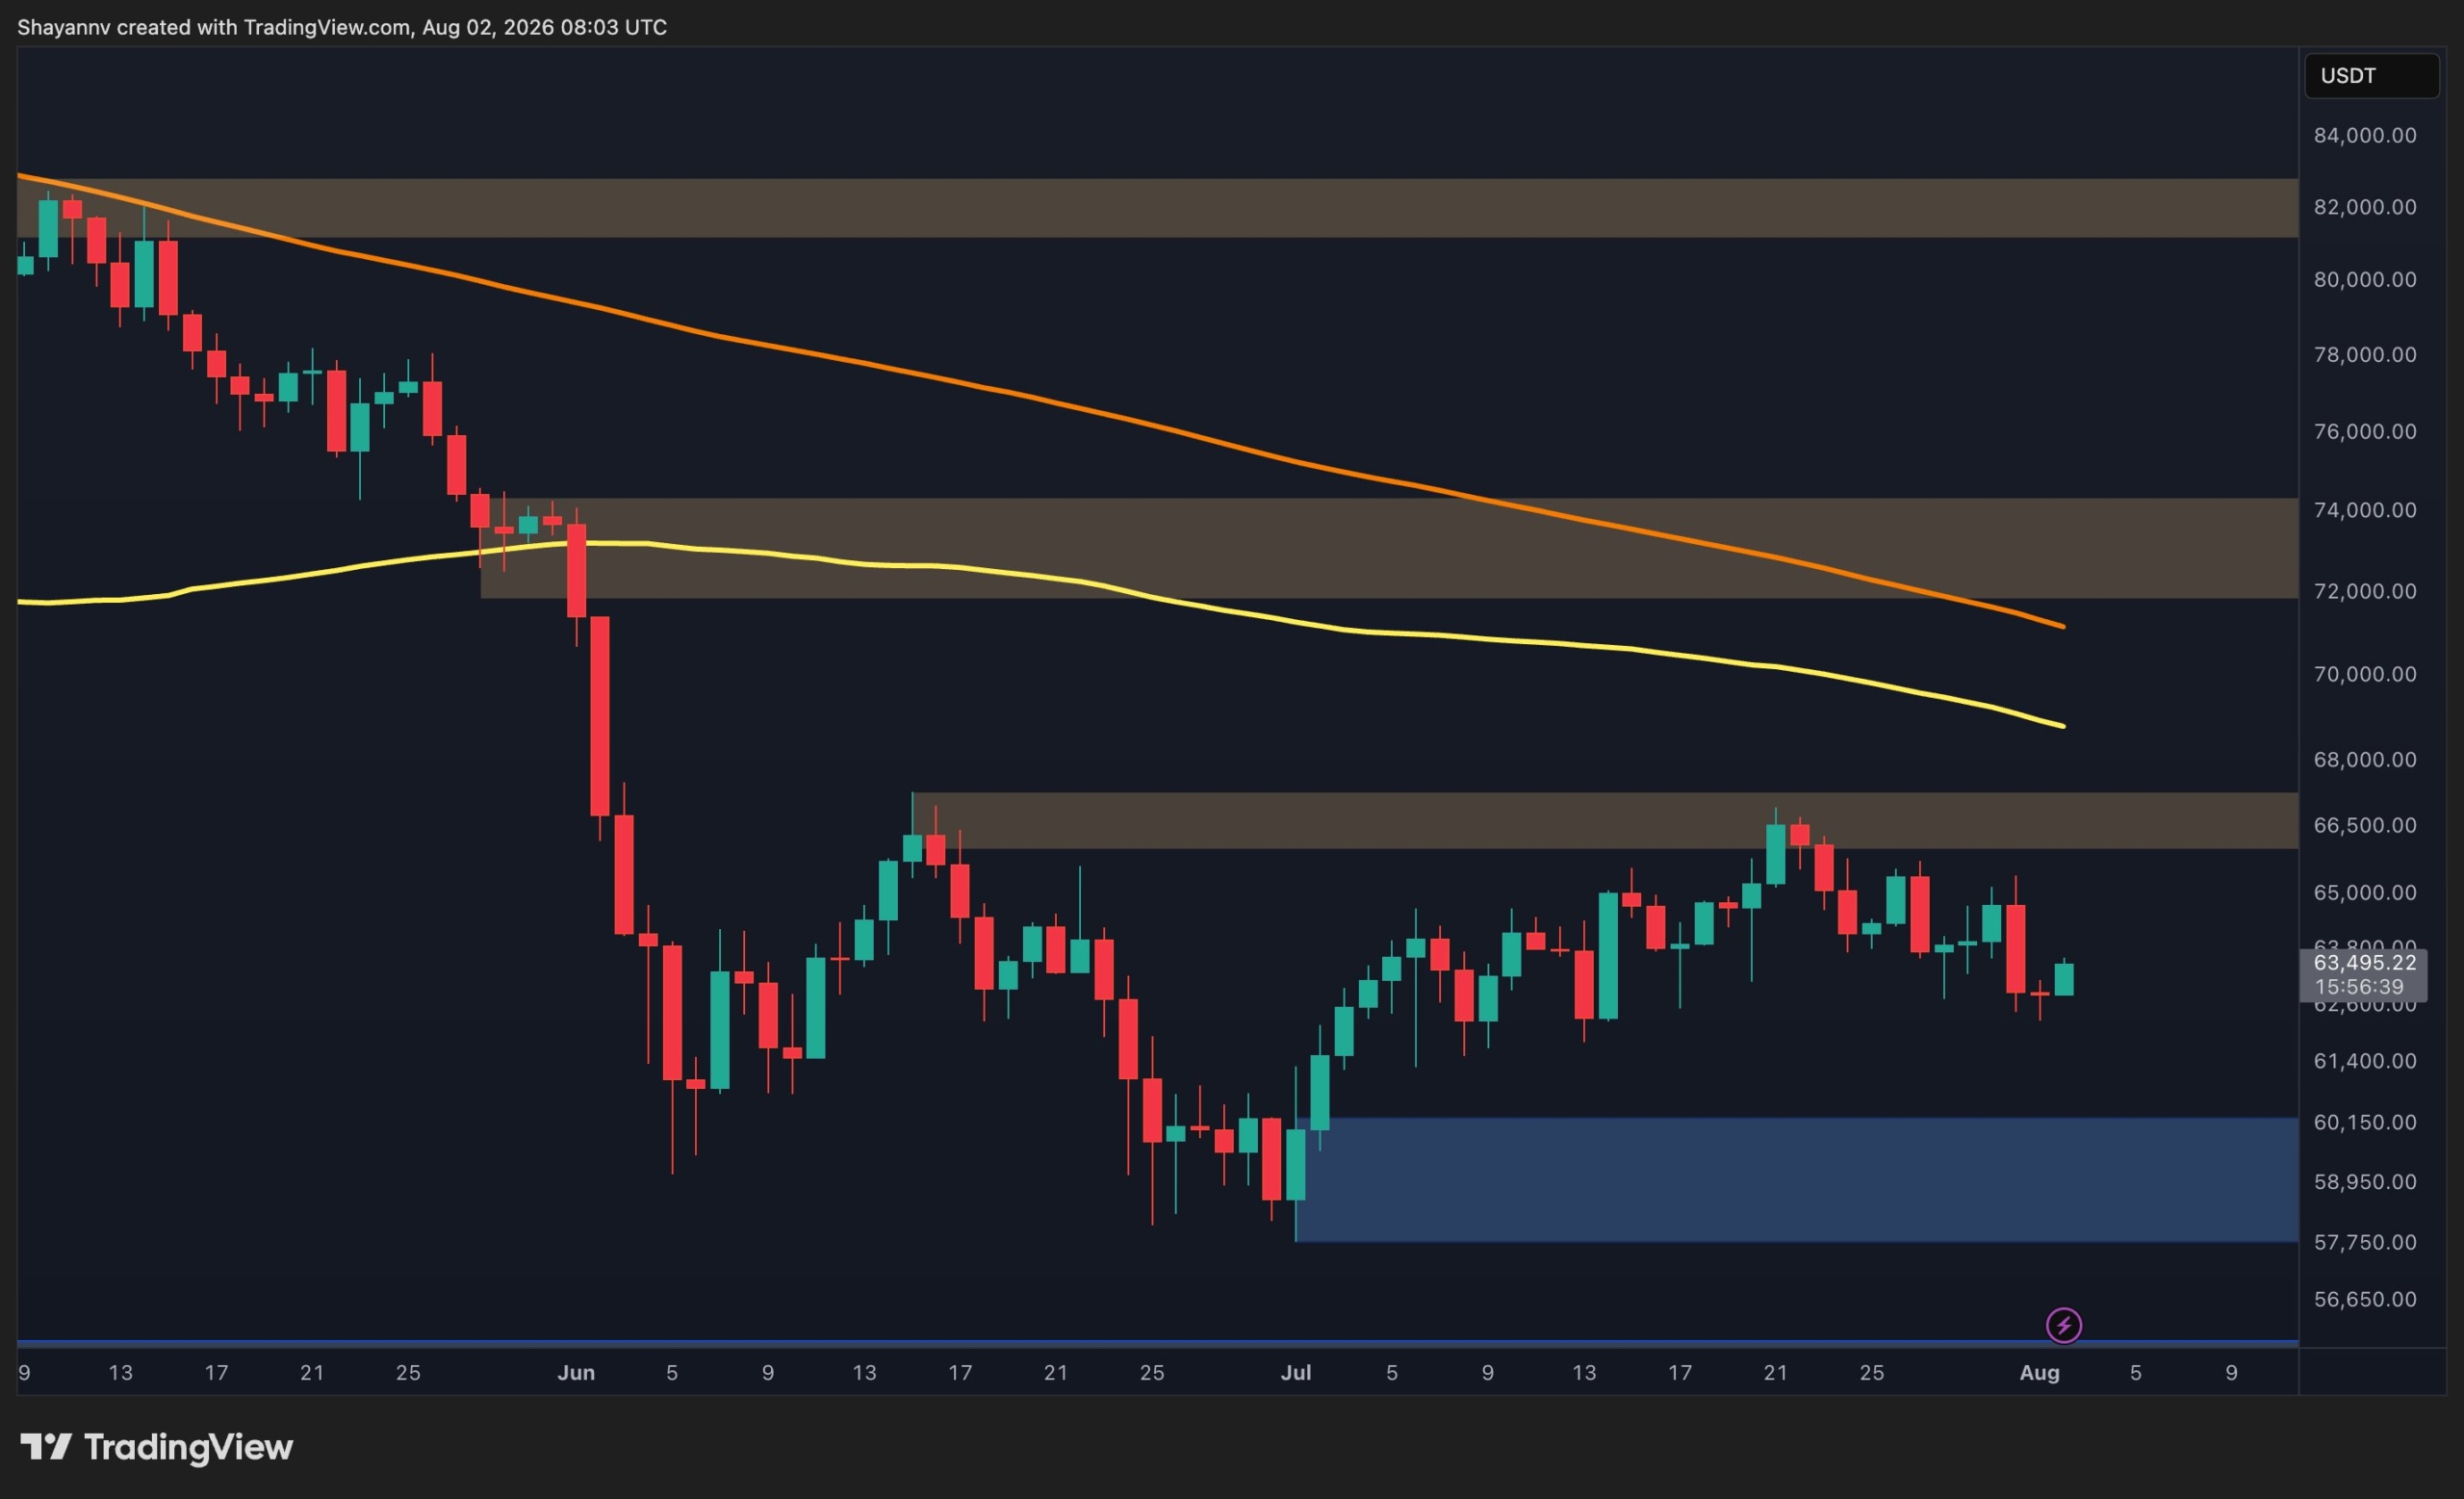
The daily chart suggests Bitcoin is still locked in a prolonged consolidation phase between the major support around $57.8K to $60.2K and the primary resistance at $66.2K to $66.8K. Despite several attempts by both buyers and sellers, neither side has managed to establish a sustained trend beyond these boundaries.
This type of market structure typically favors liquidity sweeps and stop hunts around local highs and lows before a genuine directional move develops. As long as the asset remains trapped between these two zones, traders should expect continued choppy price action rather than a sustained trend.
A confirmed breakout above the $66.2K to $66.8K resistance could trigger another leg toward the higher resistance around $72K to $74K. Conversely, losing the $57.8K to $60.2K demand zone would invalidate the current consolidation and expose Bitcoin to a deeper correction.
BTC/USDT 4-Hour Chart
On the 4-hour timeframe, Bitcoin is trading inside an even tighter range within the broader daily consolidation. Buyers continue defending the support region at $61.8K to $62.2K, while sellers repeatedly cap rallies below the resistance around $64.9K to $65.6K.
Holding above the buyers’ defense could allow another recovery attempt toward the upper boundary of this range. However, the recent sequence of lower highs indicates that sellers still hold a slight advantage, making a breakdown below the $61.8K to $62.2K support zone the more likely scenario if buying momentum continues to weaken. Such a move could accelerate selling pressure toward the lower boundary of the broader daily range.

Sentiment Analysis
The two-week liquidation heatmap shows a notable concentration of liquidity just beneath Bitcoin’s recent lows. This suggests futures market participants have been actively defending that area, with buyers stepping in to absorb selling pressure whenever the price approaches the lower liquidity cluster.
At the same time, a substantial pool of liquidity remains above the market around the $66K to $67K region, indicating that both sides still have attractive liquidation targets. As long as Bitcoin remains inside its broader consolidation, the price is likely to continue oscillating between these liquidity zones before a decisive breakout determines the next major trend.

The post Bitcoin Price Analysis: Will the Next Liquidity Sweep Push BTC Below $60K? appeared first on CryptoPotato.

Promising Moroccan footballer, 24, drowns while swimming to Ceuta

What Is Financial Literacy? (Explained in 60 Seconds)
Specialist rescue teams deployed as Fleadh funfair ride stops mid-air


-
 Sports7 days ago
Commonwealth Games boxing: Jadumani Singh seals dominant 5-0 win over Pakistan’s Sumama Rehman to enter quarter-finals | Commonwealth Games News
-

 Business4 days ago
Why Trees Belong on the Risk Register
-

 Fashion2 days ago
Weekend Open Thread: Wit & Wisdom
-

 Tech7 days ago
Intel is reversing course and bringing hyper-threading back to its server chips
-

 Politics2 days ago
Meta enters AI-training agreement with far-right ‘propaganda rag’ Newsmax
-

 Politics6 days ago
Luke Littler dismantles Gerwyn Price to retain title in Blackpool
-
 Crypto World1 day ago
MicroStrategy Post-Earnings CLARITY Act Push Could Add New Catalyst for Its Stock
-

 Politics5 days ago
The Part of the Electric Transition Nobody Wants to Discuss
-
 Entertainment5 days ago
‘Stargate’ Creator’s New Sci-Fi Series Returns for Season 3 Tomorrow
-

 News Videos7 days ago
BITCOIN JUST ENTERED THIS CRITICAL ZONE…
-

 Business4 days ago
Major shareholder moves on Canyon
-

 News Videos3 days ago
Bitcoin Enters the 3rd Stage of the Bear Market
-

 Crypto World1 day ago
XRP Ledger v3.3.0 brings five institutional features
-

 Crypto World5 days ago
Kraken Enables Retail Access to Jersey Mike’s IPO via Tokenized Shares
-

 Tech6 days ago
New macOS Sequoia & Sonoma security updates for older Macs
-

 News Videos5 days ago
Claude: Build Financial Dashboards in Minutes (2026)
-

 Politics3 days ago
Luke Littler’s dominance sparks GOAT debate
-

 Sports3 days ago
Seema Kaliramna Wins Discus Throw Bronze, Takes India’s CWG Medals Tally To 17
-

 Business5 days ago
Johnson & Johnson agrees to $5.5B settlement over talc cancer claims
-

 Crypto World7 hours ago
Crypto PAC spending tops $2M in Michigan House race
You must be logged in to post a comment Login