
Crypto World
BlackRock and Fidelity Dominate U.S. Bitcoin ETF Flows


TLDR
- BlackRock’s IBIT and Fidelity’s FBTC account for the majority of recent U.S. spot Bitcoin ETF inflows.
- On January 14, IBIT and FBTC captured over 90% of the $840.6 million total inflows.
- Similar concentration appeared on April 17 and May 1, with the two funds absorbing most new capital.
- Bitcoin is down about 29% year-to-date, yet IBIT and FBTC continue to dominate allocation days.
- Smaller ETFs such as EZBC, HODL, BRRR, and BTCW often record single-digit million daily flows.
BlackRock and Fidelity now command most new allocations into U.S. spot Bitcoin exchange-traded funds. Recent flow data shows the two firms absorb the bulk of daily inflows and shape overall direction. The pattern has strengthened through 2026 as other issuers record limited activity.
Bitcoin ETFs Flows Concentrate Around Two Issuers
When U.S. spot Bitcoin ETFs launched in January 2024, investors chose from more than a dozen products. However, flow data now shows BlackRock and Fidelity capture most institutional allocations. Farside Investors’ data highlights repeated sessions where the pair dominated inflows.
On January 14, spot Bitcoin ETFs drew $840.6 million in net inflows. BlackRock’s iShares Bitcoin Trust attracted $648.4 million, while Fidelity’s Wise Origin Bitcoin Fund added $125.4 million. Together, they represented over 90% of that day’s total inflows.
On April 17, total inflows reached $663.9 million across all products. IBIT secured $284 million, and FBTC collected $163.4 million. The two funds accounted for roughly two-thirds of new capital entering the sector.
On May 1, the trend continued as total inflows hit $629.8 million. IBIT contributed $284.4 million, and FBTC added $213.4 million. Combined, the pair drew nearly $500 million of the day’s allocations.
Bitcoin has declined about 29% year-to-date, which has pressured the broader crypto ETF complex. Between mid-May and early June, several sessions recorded heavy net outflows. Despite weaker sentiment, IBIT and FBTC frequently absorbed or limited redemptions.
Scale and Liquidity Define the Two-Firm Structure
BlackRock manages over $10 trillion in global assets and maintains wide distribution networks. Fidelity also operates one of the largest U.S. brokerage and retirement platforms. These structures support trading volume, liquidity, and access for advisers and institutions.
Many buyers include registered investment advisers, hedge funds, family offices, and pension consultants. For these allocators, issuer reputation and liquidity weigh heavily in product selection. As a result, many treat IBIT and FBTC as default vehicles for Bitcoin exposure.
Meanwhile, smaller funds post modest daily flow figures. Franklin Templeton’s EZBC, VanEck’s HODL, Valkyrie’s BRRR, and WisdomTree’s BTCW often record single-digit-million inflows. In many sessions, their flows do not alter the total sector direction.
Bitwise’s BITB and Ark’s ARKB also trail the two largest funds this year. Earlier in 2026, Trump Media & Technology Group withdrew plans for a proposed spot Bitcoin ETF. The withdrawal followed intensified competition led by BlackRock and Fidelity.
During volatile sessions, capital shifts primarily into or out of IBIT and FBTC. When investors buy aggressively, most inflows concentrate in those products. When selling increases, their activity often determines whether the sector records net inflows or outflows.


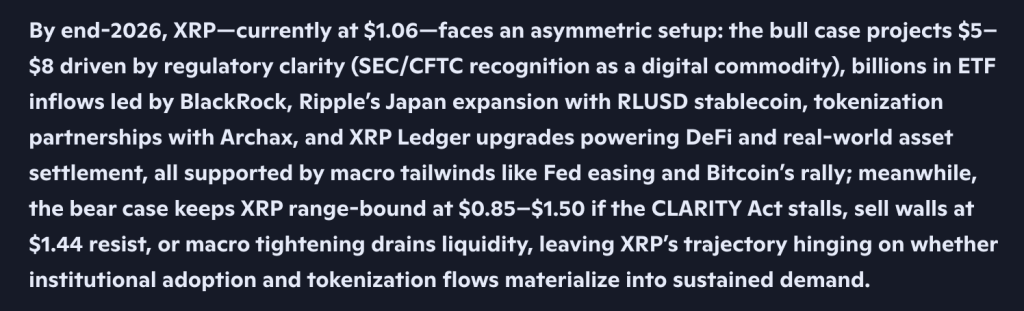
Microsoft Copilot AI is not easing into this predicts. By the end of 2026, XRP at $1.06 faces a bull case projecting $5 to $8, a level that treats regulatory approval as the trigger for a genuine repricing rather than a gradual climb.
Regulatory clarity sits at the center of the case. SEC and CFTC recognition of XRP as a digital commodity would remove the legal fog that has followed this asset for years.
Billions in ETF inflows, led by BlackRock, are identified as the second pillar. That kind of institutional entry point did not exist in any prior XRP cycle.
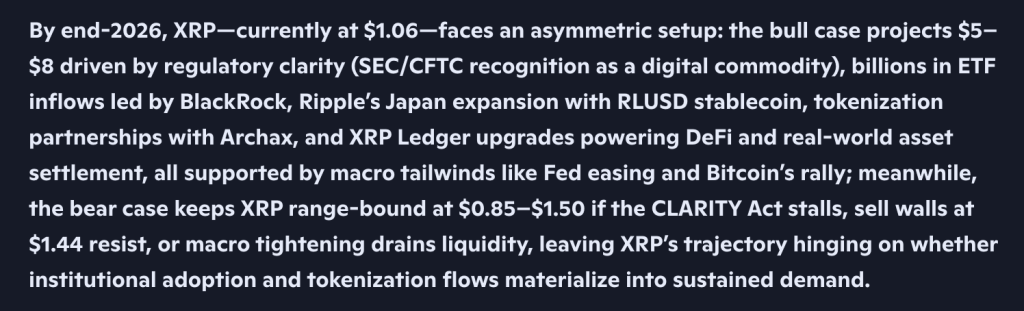
Ripple’s own business expansion adds real-world weight. Japan’s expansion with the RLUSD stablecoin, tokenization partnerships with Archax, and XRP Ledger upgrades powering DeFi and real-world asset settlement all point toward genuine utility rather than speculative volume.
Macro tailwinds round out the bull case. Fed easing and a Bitcoin rally are cited as examples of broader conditions that tend to lift every major asset at once, including XRP.
The bear case is specific about where the price gets stuck. If the CLARITY Act stalls, XRP stays range-bound at $0.85 to $1.50, with a sell wall at $1.44 acting as the ceiling that keeps rejecting advances.
Macro tightening that drains liquidity from the system is named as the other real risk. Copilot frames the entire outcome as hinging on one question: whether institutional adoption and tokenization flows actually materialize into sustained demand rather than staying announcements.

XRP Is Sitting Right On The Floor Of Its Own Bear Case
Price closed at $1.05989, down 0.50%, in a session ranging between $1.04395 and $1.06630. That places XRP almost exactly at the lower boundary of the range this same prediction describes as the bear scenario.
Zoom out and the decline since December has been long and largely uninterrupted. XRP peaked near $2.40 in January, then broke down through February in a sharp single move, gapping from above $2.10 to under $1.70 in a matter of days.
Since that crash, price spent months compressing within a slowly narrowing range between roughly $1.30 and $1.60, then broke lower in June, sliding toward $1.00. The recovery attempt in July has been shallow, stalling near $1.20 before rolling back to current levels.
Support sits right here at $1.00, the psychological floor XRP is testing directly. Below that, there is little chart history to lean on before price would be trading in territory not seen this entire period.
Resistance stacks at $1.20, then $1.30, then the heavier ceiling near $1.44 that Copilot’s own bear case names as the sell wall. Momentum here is weak, with price grinding along its lows rather than building any base for a reversal.
For any part of this bull case to gain traction, XRP first needs to reclaim $1.44, a level it has not closed above since May. Until that happens, this chart is doing exactly what the bear case describes, sitting on the floor rather than building toward the ceiling.
Here is what Copilot AI Predicts For LiquidChain’s Near Future
Every cycle has a moment where waiting becomes the most expensive decision you can make. That moment is now.
Bitcoin, Ethereum, and XRP are all pinned under the same resistance they have been testing for weeks. The macro unlock is perpetually one data point away. The institutional money keeps arriving next quarter. Large-cap traders waiting for a breakout are queuing for a decision that belongs to someone else entirely.
Grok AI has identified what experienced cycle traders already act on. Capital that registers as statistical background noise at Bitcoin’s market cap can completely reprice a small, undiscovered project.
The asymmetry is not complicated. It lives in the distance between what something is genuinely worth and what the market has currently assigned it. The moment that distance gets noticed, it collapses. Before that moment, it is fully open.
Cross-chain fragmentation has been quietly taxing every DeFi participant since the first bridge went live. Bitcoin, Ethereum, and Solana were engineered independently with zero shared infrastructure and no design intent to communicate.
Every transaction crossing those ecosystem boundaries absorbs the cost of that decision in fees, failed execution, and slippage that hits before settlement even begins. The bridge industry did not fix this problem. It built a business model on top of it.
LiquidChain removes the business model entirely. Three networks unified inside a single execution layer. One deployment reaches all of them simultaneously. No cross-chain tax is extracted from any interaction anywhere.
Copilot AI predicts it as a coin worth watching. The presale sits at $0.01454 with just over $860,000 raised.
Execution is unproven. Adoption is an open question. Established assets offer a smoother path toward a ceiling that the entire market can already see. LiquidChain is the entry point that stops existing once the market finds it.
The post Microsoft Copilot AI Just Dropped the Most Bullish XRP Prediction of 2026 appeared first on Cryptonews.


Every chain announcement leads with a transaction number. On a network charging $0.0002, 1 million transactions represents $200 of economic activity and a weekend of testing. The metric that headlines every milestone is the one that survives the least scrutiny, and the analytics platforms already know it.
Summary
- Transaction counts are the most-cited blockchain metric and among the least informative, because a count measures events, not value, and says nothing about what those events were worth.
- On networks with fees measured in fractions of a cent, the cost of generating enormous counts is trivial, so testing, scripts, and incentive farming produce numbers indistinguishable from commerce.
- A concrete case: a network processing 1.4 million transactions at a fixed fee near $0.0002 generated roughly $280 in total network fees, a figure that reframes the milestone entirely.
- Fee subsidies compound the distortion in both directions, inflating activity while suppressing the revenue that would otherwise reveal its scale.
- The analytics platforms that publish these numbers already flag the problem in their methodology notes; the caveat simply never reaches the press releases that cite them.
There is a number in almost every blockchain announcement, and it is almost always the first one: transactions processed. 1 million in the first week. 4 million. 3.6 million a day. Cumulative counts in the billions. The number is easy to produce, easy to compare, and easy to understand, which is precisely why it dominates. It is also, on most modern networks, close to meaningless as a measure of whether anything of consequence is happening, and the reason is arithmetic, not opinion.
A transaction count multiplied by a fee approaching zero equals an economic activity level approaching zero. Networks designed for cheap transactions have made the headline metric cheap to manufacture, and the industry has continued citing it as though the cost of generating it had not collapsed. This guide walks the arithmetic, explains what counts actually measure, catalogues the three ways they get inflated, and sets out the metrics that survive the same scrutiny.
The arithmetic that breaks the metric
Take a real example instead of a hypothetical, because the numbers make the argument better than any abstraction.
A blockchain designed for payments charges a fixed transaction fee of approximately $0.0002. It announced a milestone: more than 1 million transactions initiated by automated software agents, a figure that grew to roughly 1.4 million. The announcement was covered as evidence of an emerging machine-payments economy.
Now multiply. 1.4 million transactions at $0.0002 each produces roughly $280 in total network fees. Not per day. In total, across the entire milestone being celebrated.
That figure is not a criticism of the technology, which works, or of the strategic thesis behind it, which is defensible. It is a measurement. It says that whatever the 1.4 million transactions represent, they represent about the fee revenue of a modest lunch, and that a single developer running an integration test suite in a loop over a weekend could produce a six-figure transaction count for the price of a coffee.
The same arithmetic applies wherever fees are negligible. A chain processing 4 million transactions in its first week at similar fee levels has generated something in the hundreds of dollars. A chain reporting 3 million daily active transactions has told you almost nothing about whether that activity has value, because it costs almost nothing to create.
What a count actually measures
If not commerce, what does a transaction count measure? Three things, in descending order of usefulness.
Capability: A network that has processed millions of transactions has shown it can. Throughput claims are frequently theoretical, and a real count is evidence the infrastructure functions under load. This is genuinely worth knowing, and it is what most milestone announcements are actually entitled to claim.
Interest: People or programs are doing something on the network. That is not nothing, particularly for a new chain competing for developer attention, and the direction of the number over time carries some signal about whether attention is growing or fading.
Enthusiasm, subsidised or otherwise: Where incentives exist, whether airdrop farming, fee subsidies, or points programmes, the count measures the incentive, not the underlying demand. When the incentive ends, the count reveals what it was.
What a count does not measure is economic activity, user adoption, revenue, or product-market fit. A network can rank first in transactions and last in every metric that pays for anything, and several have.
Three ways counts get inflated
The distortions are systematic, not occasional, and knowing them lets you discount a headline in the right direction.
Testing and automation. Development activity, integration testing, bot loops, and automated scripts generate transactions indistinguishable from user activity in a raw count. On expensive networks this self-limits, because testing at scale costs real money. On cheap networks it does not self-limit at all. Some unknowable share of any low-fee chain’s count is machines talking to themselves, and the honest position is that nobody outside the team knows the proportion.
Incentive programmes. Airdrop farming, points systems, and volume-based rewards produce transactions whose purpose is to be counted. The pattern is recognisable in the data, since farming activity clusters in wallets with no other behaviour and collapses when the programme ends, but it is not visible in the headline.
Fee subsidies. Several chains launch with a period during which transactions are free or heavily subsidised. This inflates counts and suppresses fee revenue simultaneously, which is the worst combination for anyone trying to assess the network, because the metric that looks best is inflated and the metric that would correct it is artificially depressed. A chain running a 90-day subsidy is a chain whose first 90 days of data cannot be compared to anything, including its own subsequent performance.
One further complication that applies to every count: system transactions. Some architectures generate protocol-level transactions in every block that no user initiated. Analytics platforms exclude these precisely because including them inflates figures, but not every source cited in an announcement applies the same filter.
The analytics platforms already say this
The most useful confirmation of the argument is that the platforms producing these numbers document the caveat themselves, in the methodology notes that headlines never carry.
One major Layer 2 analytics provider states directly that transaction count can be artificially inflated through spam or micro-transactions that do not represent meaningful activity, notes the problem intensified as Layer 2 costs fell, and recommends the metric be analysed alongside chain revenue or transaction costs on the reasoning that users facing real fees are less likely to spam.
The same provider excludes system transactions from its counts and explains why. Other on-chain data platforms make similar points, placing transaction volume alongside fee revenue, stablecoin presence, and developer activity precisely because no single 1 of them is sufficient.
That is the whole argument, published by the people best positioned to know, sitting in documentation that the press release citing their dashboard does not reproduce. The information is not hidden. It is simply one layer below where the number gets quoted.
Where the metric came from
The transaction count’s dominance is partly an inheritance, and knowing its origin explains why it stopped working, not why it was ever chosen.
In Bitcoin’s early years, transaction count was a reasonable proxy for adoption. Block space was scarce, fees were real, and every transaction represented someone deciding the network was worth paying to use. The metric measured what it appeared to measure because the cost of generating it was non-trivial and the supply of it was capped. Ethereum inherited the convention for the same reasons, and through the period when gas fees regularly reached double-digit dollars, a rising transaction count meant rising willingness to pay.
Two changes broke the link. The first was scaling: rollups and high-throughput chains reduced per-transaction costs by orders of magnitude, which was the entire point and an unambiguous success, and which simultaneously removed the economic filter that made counts meaningful. A metric whose validity depended on transactions being expensive stopped being valid when transactions stopped being expensive.
The second was competition for attention. As the number of chains multiplied, each needed a comparable number to argue with, and transaction count was the only metric every chain reported in the same units. Comparability beat accuracy, as it usually does, and the industry standardised on the figure that was easiest to place in a table instead of the one that answered the question.
The result is a metric that was appropriate for the conditions it was designed under and has been carried, unmodified, into conditions where those assumptions no longer hold. That is a common failure in measurement generally, and the correction is equally common: state the cost alongside the count, and the number becomes informative again.
The metrics that survive
Replace the count with a short set that resists manufacture, in rough order of how hard each is to fake.
Fee revenue: The most robust single number, because it is the count multiplied by what people were actually willing to pay. Real fee revenue cannot be manufactured cheaply, since manufacturing it costs exactly what it reports. Where a network is subsidising fees, note that the figure is suppressed and will reprice when the subsidy ends.
Value settled: The dollar amount moving through the network, which distinguishes 1 million dust transfers from 1 million payments. This is the metric that separates a payments chain doing its job from a payments chain being tested.
Stablecoin balances held on the chain: Money parked on a network is a statement of intent that costs something to make, and it is considerably harder to fake than activity. A chain with rising resident stablecoin supply has users who chose to keep funds there.
Active addresses, with a caveat: Better than raw counts, worse than it looks, because address creation is nearly free. Useful in combination, misleading alone, and always worth checking for the concentration pattern that indicates farming.
Retention: Whether the addresses active last month are active this month. Almost nobody publishes it, which is itself informative.
How to read a chain announcement
Four questions, applied in order, will correctly discount most headlines in under a minute.
What did those transactions cost in total? Multiply the count by the fee. If the answer is small, the count is a capability claim, not an economic one, and should be read as such.
Is a subsidy running? If fees are free or discounted, both the activity figure and the revenue figure are artefacts of the programme rather than of demand, and no comparison to another chain or another period is valid.
Are there incentives attached? Points, airdrops, and volume rewards produce transactions for the purpose of being counted. Check whether a programme is live before treating growth as organic.
What is the fee revenue, and is it growing? This is the question that reframes everything else, and it is usually available on public dashboards even when the announcement omits it.
None of which means transaction counts should be ignored. They are a real measure of a real thing: that a network functions and that something is happening on it. The error is treating a measure of activity as a measure of value on networks specifically engineered to make activity nearly free.
The industry built chains where transactions cost almost nothing and then kept using transaction counts as the headline, and the gap between those two facts is where most of the confusion in chain comparisons now lives.
What good disclosure looks like
Not every project reports this way, and recognising the ones that do is a useful shortcut, because a network confident in its economics tends to publish the numbers that would embarrass a network that is not.
Good disclosure names the fee environment alongside the activity. A chain reporting transaction counts during a subsidy period, and saying so, is telling you how to read its own figure. A chain reporting counts and fee revenue together lets you do the multiplication without hunting for the 2nd number. A chain publishing value settled instead of transactions is reporting the metric that resists manufacture. None of that costs anything except the willingness to be measured on a harder number.
Poor disclosure is recognisable by omission, not by falsehood. The figures cited are usually accurate; what is missing is the context that would size them. A milestone announcement that reports a count, does not mention an active fee subsidy, does not state the fee level, and does not link to revenue data is not lying. It is presenting the most flattering true number available and leaving the reader to find the rest, which most readers do not.
The same asymmetry runs through comparisons between chains. Rankings by transaction count place networks with different fee levels, different subsidy states, and different system-transaction accounting on one table as though the numbers were commensurable. They are not, and the ranking usually rewards whichever network has made transactions cheapest, which is a design choice rather than an achievement. Any comparison worth making normalises for cost, and almost none of the widely circulated ones do.
One last point about why this metric persists despite everyone in a position to know understanding its limits.
Transaction counts survive because they satisfy every constituency at once. They are easy for a network to produce, easy for a journalist to write, easy for a reader to compare, and, critically, they almost always go up. Fee revenue can fall. Value settled can fall. Retention can be embarrassing. A cumulative transaction count is monotonic by construction, which makes it the only headline metric guaranteed never to deliver bad news.
That property explains the shape of most chain communications. Cumulative figures appear more often than daily ones, because cumulative figures cannot decline. Counts appear more often than revenue, because counts are less sensitive to whether anyone is paying. Records are announced at intervals instead of trends being published continuously, because records are selected and trends are not.
None of this requires anyone to lie, and mostly nobody does. It requires only the ordinary practice of reporting the truest flattering number available, which every organisation in every industry does. The reader’s job is to know which number that is, and in blockchain announcements it is almost always the transaction count. When a network leads with revenue instead, that choice is itself the most informative thing in the release.
Frequently Asked Questions
Why are transaction counts considered unreliable?
Because a count measures events rather than value, and on networks with fees measured in fractions of a cent, generating enormous counts costs almost nothing. Testing scripts, automated loops, and incentive farming produce transactions indistinguishable from genuine commerce in a raw count, so the number can grow substantially without any underlying economic activity.
Can you give a concrete example?
A payments-focused network charging roughly $0.0002 per transaction announced 1.4 million transactions initiated by software agents. Multiplied out, that represents approximately $280 in total network fees. The technology worked, and the milestone was real, but the economic weight of the activity was a rounding error, which the headline figure did not convey.
What do transaction counts actually tell you?
Three things: that the network can process transactions at that scale, which is a genuine capability claim; that some level of interest or activity exists; and, where incentives are running, how effective those incentives are. They do not tell you about economic value, revenue, user adoption, or whether the activity continues once incentives end.
How do fee subsidies affect the numbers?
They distort both directions at once. Free or discounted transactions inflate activity while suppressing the fee revenue that would otherwise reveal its scale, which means a chain running a subsidy produces data that cannot be compared to other networks or to its own later performance. A 90-day subsidy makes 90 days of metrics uninterpretable.
Do analytics platforms acknowledge this?
Yes, in their methodology documentation. One major Layer 2 data provider states that counts can be artificially inflated through spam and micro-transactions, notes the problem worsened as costs fell, excludes system transactions from its figures, and recommends reading counts alongside chain revenue. That caveat rarely appears in the announcements citing the dashboards.
What metrics are more reliable?
Fee revenue first, because manufacturing it costs exactly what it reports. Then value settled, which distinguishes dust transfers from payments; stablecoin balances resident on the chain, since parked money is a costly statement of intent; active addresses with concentration checks; and retention, which almost nobody publishes
Are transaction counts completely useless?
No. They are a real measure of throughput and a rough indicator of direction, and for a new network showing that infrastructure functions under load, that is worth reporting. The error is treating a measure of activity as a measure of value on networks specifically designed to make activity nearly free.
How should I read a chain milestone announcement?
Multiply the count by the fee to size the economic activity, check whether a fee subsidy or incentive programme is running, and look up the network’s actual fee revenue on a public dashboard. Those three checks take about a minute and correctly discount most headlines in this category. This is educational information, not investment advice.
Disclaimer: This article is for information and educational purposes only and does not constitute financial or investment advice. Network metrics, fee levels, and subsidy programmes change frequently, and figures cited reflect data available at the time of writing. Always do your own research. Information is accurate as of July 29, 2026.


Robinhood (HOOD) topped Wall Street’s second-quarter expectations, but shares fell about 4% in after-hours trading, adding to their 3.1% decline during Wednesday’s session.
The online brokerage reported adjusted earnings per share of $0.62, well ahead of analysts’ $0.43 estimate, while revenue climbed 32% from a year earlier to a record $1.31 billion, narrowly topping the $1.29 billion consensus forecast.
The results reflected strength across Robinhood’s expanding product lineup, even as crypto trading cooled. Crypto revenue fell 38% year over year to $100 million from $160 million, while transaction revenue was lifted by surging options, equities and prediction markets activity.
“Whether it’s the Robinhood Chain, Robinhood Ventures, or Trump Accounts, our product velocity is focused on one goal: making everyone an owner,” Vlad Tenev, Chairman and CEO of Robinhood, said in a statement.
The second quarter marked one of Robinhood’s biggest product pushes in recent years. The company launched Robinhood Chain, a blockchain network that supports tokenized U.S. stocks for eligible European customers as part of its push to bring traditional financial assets onchain.

Bitcoin extended its positive run last week with a minor 1% weekly gain, marking its fourth straight weekly advance for the first time since April. Even so, the rally showed signs of losing momentum after a sharp midweek reversal weakened buying pressure.
The cryptocurrency climbed to a weekly high of $67,000 on Tuesday before dropping 5% as short-term holders sold near their breakeven level. The decline reinforced resistance overhead and showed that buyers are still struggling to push Bitcoin beyond its recent trading range.
Institutional Demand Remains Under Pressure
According to the latest Bitfinex Alpha report, the short-term holder cost basis has stabilized near $68,500. The metric had gradually moved closer to spot prices over the past month. Analysts said this level has become a key resistance area that will likely require stronger demand for Bitcoin to break above it.
So far, that demand has remained limited despite recent ETF inflows. The report said institutional participation continues to weaken. Specifically, CME Bitcoin futures fell below $6 billion, while options reached a September 2023 low.
ETF flows also reflected that softer demand beneath the surface. Despite this, US spot Bitcoin ETFs recorded a third straight week of net inflows totaling $33.9 million. However, they also saw $465.2 million in outflows on Thursday and Friday, while BlackRock’s IBIT turned net negative.
Macro Risks Add to Bitcoin’s Cautious Outlook
Another sign of softer institutional participation is the Coinbase Premium Index, which has remained below zero for more than 60 consecutive trading days. Bitfinex described current market conditions as a typical summer slowdown, with 30-day spot trading volumes at just 62.4% of their yearly average.
Beyond weaker market activity, broader economic conditions are adding uncertainty to Bitcoin’s outlook. Rising US diesel prices continue to pressure transport and production costs, raising the risk that inflation could remain elevated.
Meanwhile, higher inflation could complicate the Federal Reserve’s policy path, while futures markets assign about a one-in-three chance of a rate hike at this week’s FOMC meeting.
The report also noted that the US 10-year real yield has climbed to 2.43%, approaching a level that could pressure risk assets. As a result, Bitcoin remains range-bound between $63,000 and $68,500, awaiting stronger demand or fresh catalysts.
The post Bitcoin’s Four-Week Winning Streak Faces Test as Demand Softens appeared first on CryptoPotato.

US law enforcement advocacy groups are asking the White House to revise provisions in the Senate’s proposed Digital Asset Market Clarity (CLARITY) Act, specifically targeting language that would affect how “developer” guidance is handled under the bill’s Blockchain Regulatory Certainty Act (BRCA) component. The push comes as Congress heads toward a month-long recess, tightening the timeline for any legislative movement.
According to a Tuesday report by Politico, the National Association of Assistant US Attorneys and the National District Attorneys Association sent a letter to the White House urging changes to BRCA provisions related to developers. The groups want adjustments to guidelines that, as described in the reporting, would not require developers to “create, expand, or modify criminal liability under Federal law.”
Key takeaways
- Law enforcement groups have proposed edits to BRCA language in the CLARITY Act, with a focus on how developer-related guidance intersects with criminal liability.
- White House crypto adviser Patrick Witt said the proposed language is far from the Trump administration’s position and suggested the effort was not the product of “productive negotiations.”
- Senator Catherine Cortez Masto is reported to be pressing the White House to address BRCA provisions before any Senate vote.
- Senate Majority Leader John Thune had not scheduled a CLARITY vote before the chamber’s August recess as of Wednesday, narrowing the odds of final passage soon.
Law enforcement groups press for developer-language revisions
The Politico report says the letter was sent by two US prosecutors’ organizations to the White House, requesting modifications to BRCA provisions inside the CLARITY Act. The specific change outlined in the reporting centers on language that would constrain how guidelines regarding developers might affect federal criminal liability.
While the letter’s request is framed around developer-related provisions, the underlying implication is broader: how Congress chooses to draw lines between regulatory guidance and criminal exposure for participants in the digital asset ecosystem. For developers and related technical contributors, the difference between “regulatory guidance” and “criminal liability” is not merely academic—it can influence how legal teams structure compliance programs and how risk is assessed for future product changes.
The timing also matters. Politico reported the proposals with only days left before the Senate moves toward a state-work period and a month-long recess, a window that tends to limit complex floor negotiations on contested bills.
White House response raises questions on negotiation dynamics
After coverage of the proposed changes surfaced, White House crypto adviser Patrick Witt commented on the matter via social media. As reported, Witt said the provisions were “not even close” to the Trump administration’s position and suggested the changes were not the result of “productive negotiations.”
That response signals the White House may view the law enforcement groups’ requests as misaligned with the administration’s drafting approach—or as an attempt to shift the bill without reaching a common negotiating position first.
Separately, Politico reported that Senator Catherine Cortez Masto has been pushing the White House to address BRCA provisions before any potential vote. If her position reflects broader Democratic concerns, the White House’s willingness to adjust BRCA language could determine whether CLARITY can clear remaining hurdles.
Ethics fight and legislative schedule complicate passage
Beyond the developer-language dispute, the CLARITY Act has faced pushback from many Democrats tied to ethics rules in the bill, including rules connected to US President Donald Trump’s crypto investments. The report cited that Trump’s investments netted him $1.4 billion in 2025.
As of Wednesday, Senate Majority Leader John Thune had not scheduled a vote before the Senate breaks for state work periods. According to the schedule cited in the reporting, state work periods are expected to run from Aug. 7 to Sept. 14, leaving a short stretch for any procedural steps that often determine whether major legislation can reach the floor.
One procedural reality highlighted by political observers is that even if CLARITY were ready to be taken up immediately, finishing the process before the recess could be difficult. Anne Kelley, a partner at Mercury Strategies, wrote on X that completing the required steps—cloture, an amendment process, a second cloture, and up to 30 hours of debate—would be extremely challenging without unanimous consent to waive process, which she said is rare on contested bills.
For investors and market participants, that procedural friction can matter as much as the policy itself. When deadlines compress and ethics and developer-language debates remain unresolved, the bill’s direction can become harder to predict, and timelines for regulatory clarity may slip—regardless of how markets initially react to policy headlines.
Why BRCA’s regulator-shift plan remains central
One of the major goals of the CLARITY Act, as described in the reporting, is to change the regulatory purview over digital assets away from the US Securities and Exchange Commission (SEC) and toward the Commodity Futures Trading Commission (CFTC). The CFTC is described as having fewer enforcement and oversight tools and resources compared with the SEC, while both agencies are reported to be understaffed at the leadership level—specifically noting only one CFTC chair and three SEC commissioners.
That regulator-shift is one of the core reasons CLARITY is likely to remain controversial. Different agency mandates can translate into different approaches to enforcement priorities, compliance expectations, and the practical meaning of “market structure” rules for tokens and exchanges. As a result, debates over “developer” provisions and ethics rules are not separate from the regulatory center of gravity—they interact with how policymakers think the bill should function and who should have authority.
It also raises an immediate question for readers: if BRCA language—particularly around developer-related liability constraints—is being negotiated through law enforcement input, what does that mean for the broader regulatory architecture lawmakers are trying to establish? For developers and firms building on-chain infrastructure, the answer could shape both legal exposure and how they interpret future compliance requirements as CLARITY moves (or stalls).
With the Senate calendar narrowing and political disagreements persisting, the next developments to watch are whether the White House signals openness to BRCA edits and whether Senate leadership can align procedural timing with remaining ethics and policy disputes. Until then, CLARITY’s fate may hinge less on consensus about the end goal and more on whether negotiators can reconcile competing views fast enough to move the bill before recess complicates the process again.
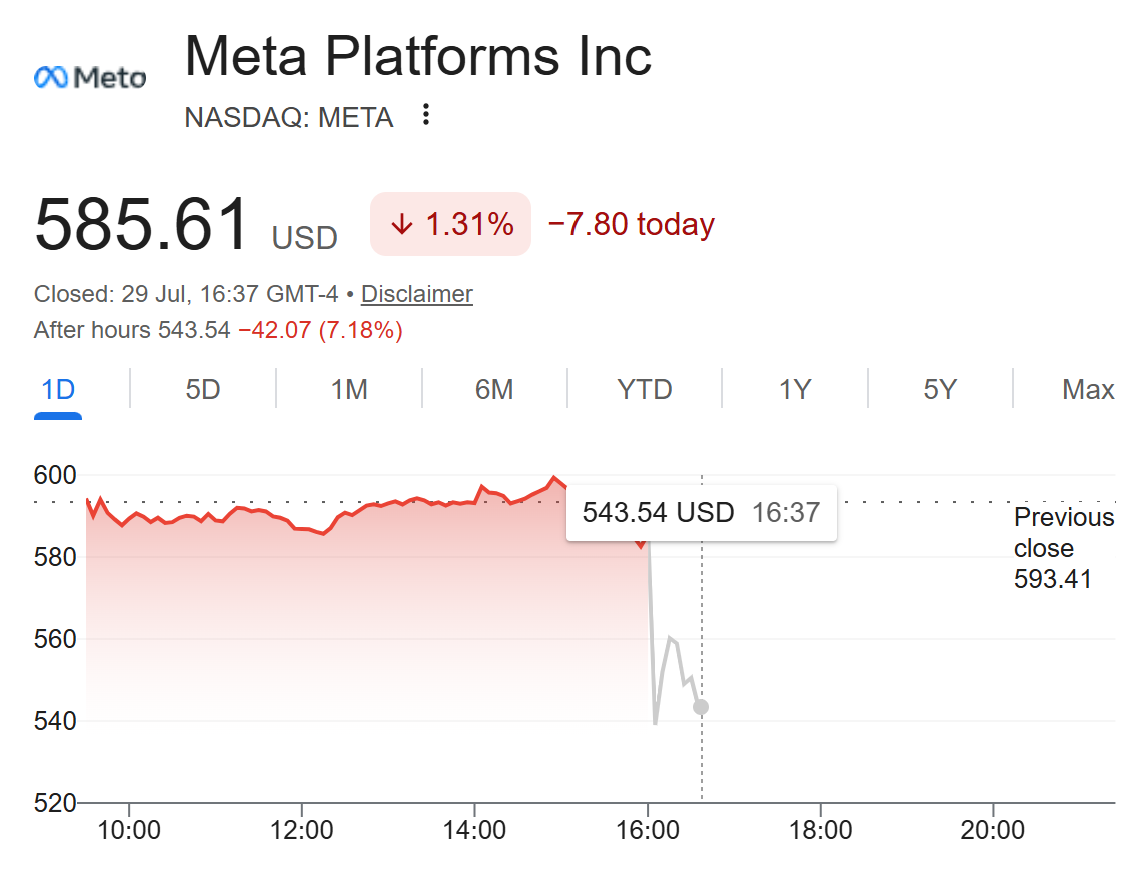
Meta Q2 earnings beat Wall Street on revenue but missed on profit, as AI infrastructure spending, legal charges, and severance costs pushed the operating margin down to 31% from 43%.
Shares fell 5.06% to $556 in after-hours trading on Wednesday, according to Benzinga, as investors weighed a higher capital spending outlook against shrinking free cash flow.
Meta Q2 Earnings Beat Hides a Margin Squeeze
Revenue reached $60.80 billion, up 28% year over year and ahead of the roughly $59.50 billion analysts expected. Diluted earnings landed at $6.18 per share, down 13% from $7.14.
Costs told the other half of the story. Total expenses jumped 55% to $42.03 billion, including $2.40 billion in legal charges and $1.18 billion in severance tied to a May headcount reduction.
Operating income fell 8% to $18.78 billion. Ad demand stayed healthy, with impressions up 14% and average price per ad up 12%, yet neither was enough to hold the margin.
User growth also held up. Family daily active people averaged 3.60 billion in June, a 3% rise from a year earlier.
Filings across the sector had already flagged AI capex draining cash before this week’s reports.
Capex Guidance Climbs Toward $145 Billion
Meta raised the floor of its 2026 capital expenditure range to $130 billion from $125 billion and kept the ceiling at $145 billion. Full-year expense guidance now starts at $165 billion.
The quarter shows why. Capital expenditures hit $31.08 billion, and operating cash flow of $31.86 billion left only $784 million in free cash flow, against $8.55 billion a year ago.
Most of that money is going into data centers. Meta and BlackRock unveiled a $14 billion data center venture in El Paso, Texas, this week.
The tax outlook tightened as well. Meta now expects a rate of 15% to 17% for the rest of 2026, up from a prior 13% to 16%.
“AI is accelerating our core business today, powering our next generation of products, and opening the door to entirely new enterprise opportunities,” read an excerpt in the release, citing Mark Zuckerberg, Meta founder and chief executive.
Follow us on X to get the latest news as it happens
Will the Stock Surge From Here?
META stock dropped by over 7% after market after market to $543.54 after closing Wednesday at $585.61.

The bull case rests on guidance. Meta expects third-quarter revenue of $61 billion to $64 billion and still projects full-year operating income above the 2025 result.
The bear case rests on the balance sheet. Long-term debt grew to $83.66 billion from $58.74 billion in December, and Reality Labs lost another $4.62 billion.
Legal risk sits on top of that. Meta flagged youth-related trials in the United States this year that may ultimately produce a material loss.
Sentiment across the sector is split. Microsoft’s Azure growth beat landed the same evening, a sign that investors will still fund AI spending when revenue follows it.
Crypto traders track these reports because the AI trade sets risk appetite. A Big Tech selloff hit crypto in June, and Bitcoin (BTC) traded near $63,409 on Thursday, down 0.7% over 24 hours.
Apple reports Thursday. Its spending commentary should show whether Meta’s margin squeeze is company specific or the price every large cloud operator now pays.
The post Meta Revenue Beats, But AI Spending Crushes Profit Margins: Will the Stock Surge? appeared first on BeInCrypto.
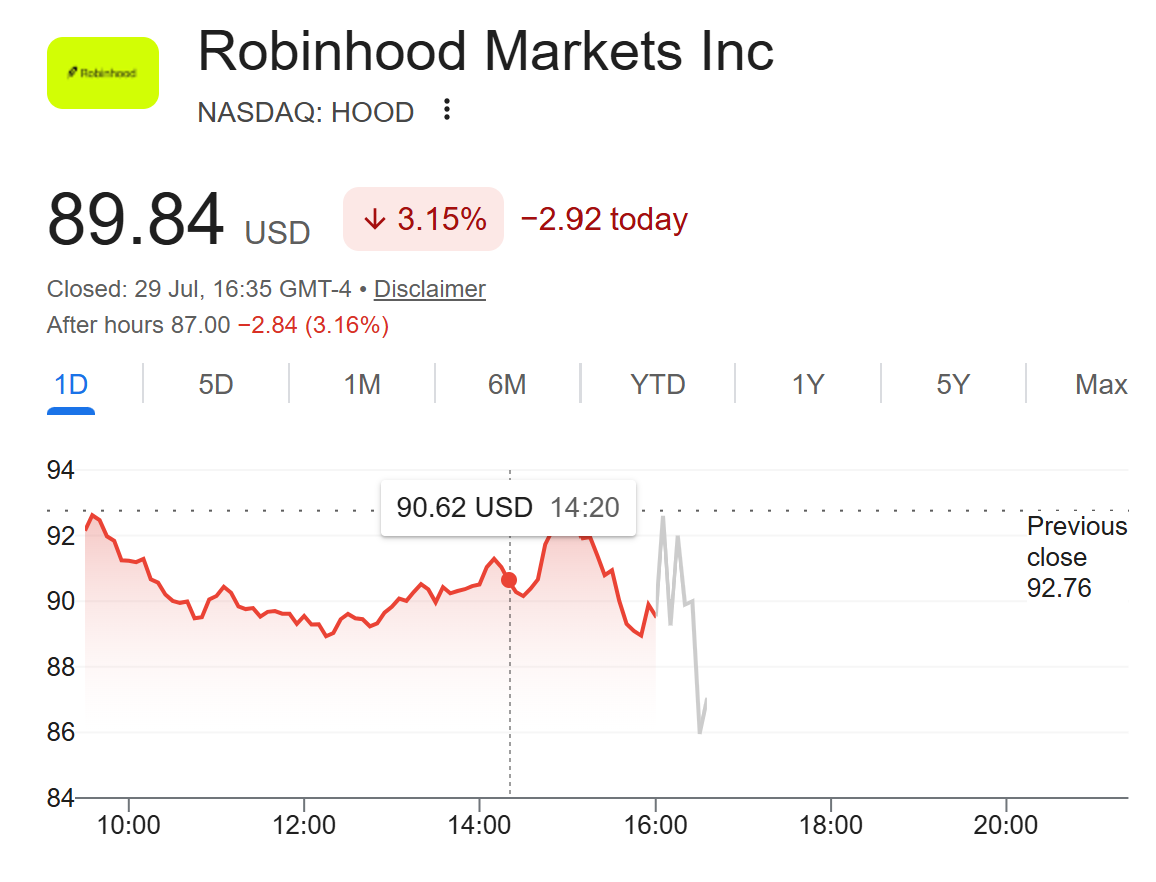
Robinhood reported $100 million in second quarter cryptocurrency transaction revenue, topping the $86.6 million analyst consensus even as the line fell 38% from a year earlier.
The beat landed inside a record quarter. Total net revenues rose 32% to $1.31 billion, while diluted earnings per share climbed 48% to $0.62.
Robinhood Crypto Revenue Cleared a Bar That Had Already Dropped
Expectations were modest going into Wednesday’s release. Crypto revenue had already fallen 47% in the first quarter to $134 million.
The second quarter figure slipped another 25% from that level. Trading activity accounts for most of the decline.
Robinhood App crypto notional volumes fell 35% year over year to $18 billion. Bitstamp contributed $22 billion, taking the combined total to $40 billion.
The wider market has not recovered. Bitcoin trading near $63,559 sits roughly 46% below its level a year ago.
Robinhood opened a crypto stock earnings week that also brings Coinbase and Strategy results on Thursday.
Prediction Markets Carried the Record Print
Transaction based revenues rose 44% to $776 million. Event contracts delivered $156 million, more than 10 times the year ago figure.
Options revenue climbed 29% to $342 million. Equities revenue nearly doubled to $129 million.
Crypto now supplies under 8% of total net revenues. Two years ago it was one of the company’s headline growth stories.
The customer base kept widening behind those numbers. Funded customers reached 28.4 million and Robinhood Gold subscribers hit a record 4.8 million.
“The business is firing on all cylinders. We delivered record revenues and drove new highs across equity, option, and event contract volumes, as we continue to win market share,” Shiv Verma, Chief Financial Officer of Robinhood, in the earnings release.
Follow us on X to get the latest news as it happens
HOOD Slipped Even as the Numbers Beat
Robinhood shares closed Wednesday at $89.84, down 3.15% on the day. The stock eased further to $87.00 in after hours trading.

Earnings quality may explain some of the hesitation. The $0.62 diluted EPS included $0.14 of gains tied to the deconsolidation of Robinhood Ventures Fund I.
Management is still funding crypto regardless. The quarter brought the public mainnet launch of Robinhood Chain, an Ethereum Layer 2 built for tokenized real world assets.
That network has already climbed the fee tables, with Robinhood Chain application fees reaching $25 million in a single week this month.
Robinhood also debuted Robinhood Earn, its first onchain lending product, rolled out stock tokens across more than 120 countries, and closed the WonderFi acquisition in Canada.
Perpetual futures went live in the European Union during the quarter. The company flagged plans for a crypto offering in the United Kingdom.
The company lowered its 2026 adjusted operating expense and share based compensation outlook to a range of $2.675 billion to $2.775 billion.
Whether the crypto line stabilizes may matter less to the share price than whether event contract volumes keep compounding at this pace.
The post Robinhood Crypto Revenue Tops Estimates Despite 38% Drop, How Will Stock React? appeared first on BeInCrypto.

Crypto markets are moving into what ARK Invest analyst Lorenzo Valente describes as the industry’s “biggest consolidation phase yet,” driven by investor selectivity and a shift in where application revenues flow. In an X post on Wednesday, Valente argued that only a small set of protocols and platforms with clear product-market fit are capturing a growing share of demand—while weaker projects face closures or forced restructuring.
Valente pointed to concentration in crypto application revenue as a key signal. He cited Hyperliquid and Pump.fun as together accounting for about 67% of total crypto application revenue, and said that adding Ethena brings the top three’s combined share to nearly 80%, describing this as record-high concentration.
Key takeaways
- Revenue concentration is rising: Valente estimates Hyperliquid and Pump.fun make up ~67% of crypto application revenue, with the top three nearing ~80% when Ethena is included.
- Capital is getting more selective: Valente says it’s increasingly harder for exchanges and projects without strong product-market fit to attract funding.
- Industry shakeout is likely to intensify: He expects more mergers and acquisitions, shutdowns, and restructuring, including Chapter 11 filings.
- Exchange closures are already reinforcing the theme: Recent operational wind-down plans from multiple venues align with consolidation pressures.
Why investors are picking winners
Valente’s core argument is that investor behavior is changing alongside market maturity. As capital becomes more discerning, projects that fail to demonstrate sustained usage or a defensible niche are finding it increasingly difficult to secure financing or maintain growth. In his view, this accelerates attrition: weaker products either shut down or get absorbed, leaving a smaller set of dominant protocols behind.
While consolidation is not a new pattern in crypto, Valente framed the current period as unusually pronounced—especially when measured by application revenue share. By emphasizing top platforms’ increasing dominance, he suggested that the sector is not merely pruning inefficient competitors, but also concentrating economic returns into fewer hands.
Revenue concentration and the “record-high” claim
To make the case, Valente highlighted specific platforms and their estimated contribution to crypto application revenue. According to his post, Hyperliquid and Pump.fun account for roughly 67% of total crypto application revenue. When Ethena is added, the top three approach nearly 80% combined.
The practical implication for users and builders is straightforward: if revenue is increasingly concentrated, liquidity, incentives, partnerships, and developer attention may also cluster around the same dominant venues and protocols. That can create a reinforcing cycle—success brings more of the ecosystem’s resources—making it harder for new entrants to gain traction.
Valente also described the consolidation he expects ahead as “extremely bullish” for crypto, implying that a cleaner market structure could improve resilience and investor confidence, even if the transition is disruptive for teams that don’t survive the competitive narrowing.
Source: Lorenzo Valente
Exchange wind-downs add pressure from the infrastructure layer
Valente’s consolidation thesis comes as several exchanges have recently announced plans to wind down operations or end services, underscoring the broader challenge of sustaining activity in an increasingly competitive environment.
Last week, BitMEX said it would shut down its exchange in September following a strategic review by owner HDR Global Trading. The exchange cited insufficient trading interest and noted that it had accelerated delisting of trading pairs and derivative contracts ahead of the closure. Earlier coverage details the shutdown decision and the delisting rationale: BitMEX shut down its exchange.
Days later, BitMart announced it would end trading services on Aug. 26 and then wind down completely in January 2027. The exchange attributed the decision to an evaluation of operating conditions, the market environment, and its future strategic direction. This plan is described in earlier reporting: BitMart wind-down timeline.
Together, these announcements illustrate consolidation occurring not only through market share at the application level, but also at the venue level—where competitive pressures can force even established names to reduce offerings or exit entirely.
Mergers and acquisitions show consolidation can be strategic
Alongside closures, acquisitions are also contributing to industry consolidation. Valente’s expectations for more mergers and acquisitions are consistent with how some players are expanding rather than withdrawing.
Earlier this month, Bybit launched a locally operated exchange in Indonesia after acquiring a majority stake in digital asset firm NOBI. The move expands Bybit’s footprint in one of Asia’s largest crypto markets, illustrating a different pathway for consolidation: larger operators absorbing or partnering with local entities to gain access and scale.
Related coverage: Bybit launches in Indonesia after NOBI acquisition
What to watch next
As consolidation pressures build, the next signal to monitor is whether revenue concentration keeps widening toward a small set of dominant applications while more exchanges restructure or exit. Valente expects that pattern to accelerate—so investors, traders, and builders should pay close attention to which platforms keep attracting usage as the industry prunes weaker competitors.
Crypto World
Ethereum Price Prediction: L2 Ecosystems Lose Their TVL as Robinhood Chain Activity Drops
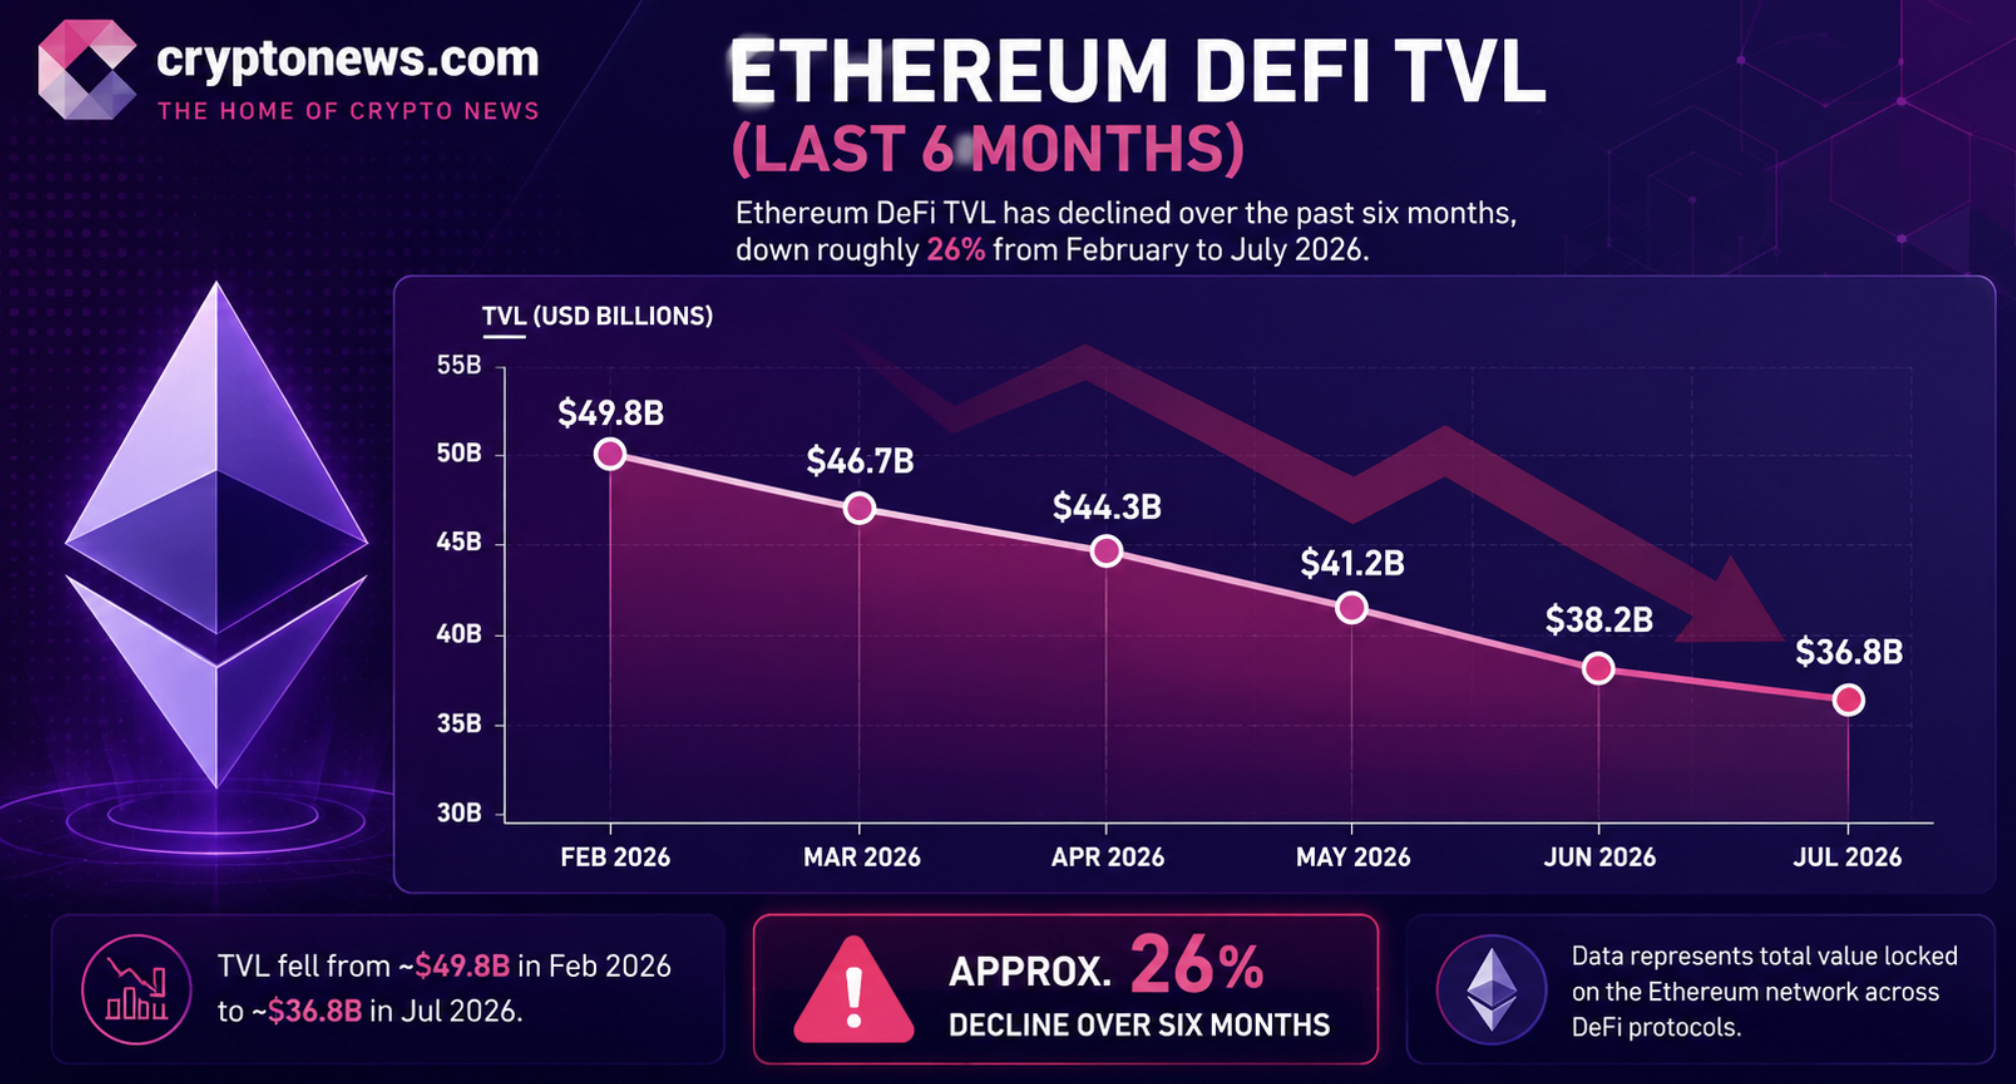
Ethereum is trading at $1,920, but while price action remains relatively calm, the underlying picture looks more complicated for its prediction. Total value locked across Ethereum Layer 2 networks has slipped to roughly $5 billion, wiping out much of the 2024 expansion and returning to levels last seen in 2023. If L2s were meant to drive Ethereum’s next growth phase, that slowdown raises fresh questions.
The Robinhood Chain story captures that tension. The Arbitrum-based Layer 2 bridged roughly $141 million in ETH during its first two weeks. It also briefly overtook Ethereum L1 and Base in 24-hour DEX volume, reaching about $877.6 million. However, the network returned only around $4,000 in fees to Ethereum during its first week, fueling debate over how much value L2s actually sends back.
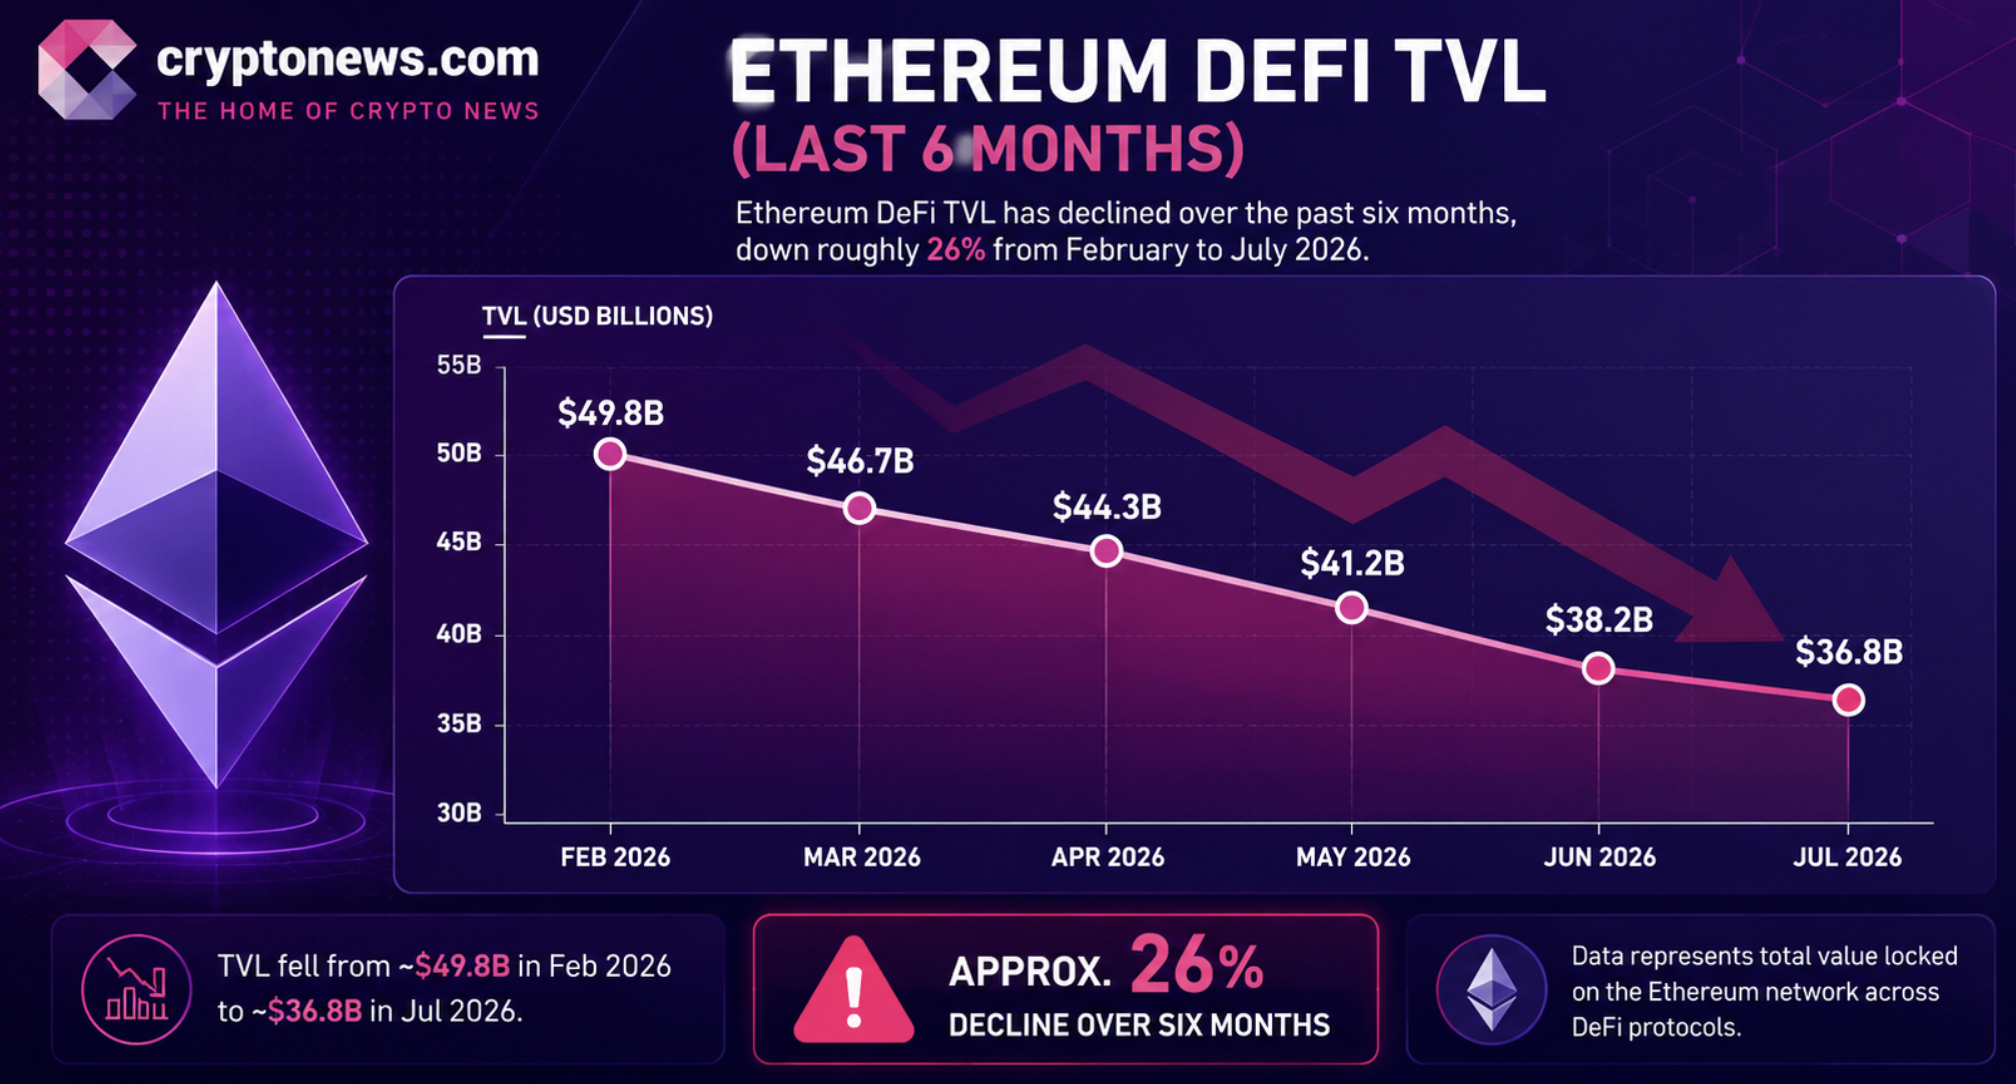
Some analysts argue Robinhood Chain’s $4.5 billion in DEX volume during its first week reflects activity shifting away from Ethereum’s base layer. Meanwhile, Optimism, Base, and Arbitrum still account for about $4.8 billion, or 96%, of the remaining Layer 2 TVL. Even so, the steady decline in total TVL remains difficult to ignore.
Meanwhile, the Ethereum Foundation has lost several senior leaders this year. At the same time, institutions including DTCC and JPMorgan continue expanding tokenization efforts across multiple blockchains instead of focusing only on Ethereum. ETH also remains range-bound, while derivatives positioning has cooled, suggesting traders still lack conviction for a decisive breakout.
Discover: The Best Crypto to Diversify Your Portfolio
Ethereum Price Prediction: Reclaim $2,050 Resistance This Week?
At $1,920, ETH is trading slightly above the $1,850 to $1,900 short term demand zone that many analysts identified as key support. The latest session ranged between $1,880 and $1,930, highlighting continued price compression. Meanwhile, derivatives positioning remains subdued, reflecting limited conviction from both bulls and bears.
The first resistance zone sits around $2,036 to $2,050. A decisive move above that could expose the 0.236 Fibonacci level near $2,134. Beyond that, $2,377 and $2,572 remain the next technical milestones. On the downside, $1,780 remains the key support, while $1,742 is the next major level if sellers regain control.

The bullish case remains straightforward. Holding above $1,900, improving derivatives sentiment, and stronger institutional activity on Layer 2 networks could support a move toward $2,050 and eventually $2,134. However, buyers still need fresh momentum before that scenario gains traction.
The base case still favors consolidation between $1,850 and $2,050. Layer 2 TVL remains a headwind, while no clear catalyst has emerged to break the current range. A daily close below $1,780 would weaken the short-term outlook and shift attention toward $1,742.
Robinhood’s prediction markets add another perspective. Only 22% of participants expect ETH to finish above $3,500 this year, while 54% anticipate a move below $1,500 at some point. That split highlights genuine uncertainty rather than one-sided bearish sentiment. Macro conditions also remain capable of reshaping the technical picture with little warning.
Trade Ethereum on Bybit and Get a Chance to Win Our $1,000 USDT Airdrop
LiquidChain Targets Early Mover Upside as Ethereum Tests Key Levels
ETH hovering below key resistance while L2 value leakage accelerates is exactly the environment where infrastructure capturing cross-chain activity, rather than betting on a single chain’s dominance, becomes a more interesting allocation question. The L2-versus-L1 value capture debate is real, and it does not resolve neatly in Ethereum’s favor in the short term. That dynamic is worth watching for rotation setups.
LiquidChain is positioning directly against the fragmentation problem at the root of this debate. The project is a Layer 3 infrastructure play, and its core proposition is fusing Bitcoin, Ethereum, and Solana liquidity into a single execution environment through what it calls a Unified Liquidity Layer.
The view is different from the third layer. — LiquidChain (@getliquidchain) July 27, 2026

You’ll understand soon. pic.twitter.com/P2WOELSTjI
With Liquid, developers only deploy once and access all three ecosystems; settlement is verifiable; execution is single-step. The presale is currently priced at $0.01484, with $920K raised to date.
Features like Deploy-Once Architecture address the exact developer fragmentation that the Robinhood Chain / Arbitrum / Base proliferation keeps making worse. Ethereum’s own infrastructure consolidation trends underscore why cross-chain abstraction has a credible thesis here.
Research LiquidChain further here.
Discover: The Best Token Presales
The post Ethereum Price Prediction: L2 Ecosystems Lose Their TVL as Robinhood Chain Activity Drops appeared first on Cryptonews.

Law enforcement groups backed by key Democrats have suggested some changes to the CLARITY Act that would make it easier to prosecute some crypto software developers.
However, White House officials still feel like the suggestions made fall short of what they want.
Trump’s Crypto Adviser Rejects Proposal
Trump’s crypto adviser, Patrick Witt, dismissed the proposal, saying claims that they were the result of “productive negotiations” with the White House and Treasury were far from the truth. He added that the administration had made its position clear to Sen. Catherine Cortez Masto for weeks and that the latest revision was “not even close” to meeting its expectations.
A report from Politico shows that two major groups representing U.S. prosecutors have submitted fresh changes to the White House, aiming to break months of deadlock over the CLARITY Act.
“Newest language is the culmination of productive negotiations with law enforcement, the White House, and Treasury, and we feel good about the chance to resolve this issue once and for all,” said Masto in a statement.
The proposal focuses on the Blockchain Regulatory Certainty Act (BRCA), with the new language removing provisions that could protect developers from criminal prosecution in some cases. At the heart of the dispute is whether law enforcement should hold crypto developers responsible for crimes committed on the platforms they build.
The Trump administration says that the authorities should protect builders who do not hold customer funds to encourage innovation. On the other side, critics and law enforcement groups disagree, warning that the current language could make it easier for financial crimes to go unchecked.
New York Attorney General Letitia James also shares the sentiment, having recently said that the CLARITY Act could weaken state enforcement against crypto fraud. According to her, this is because the legislation would limit the state’s ability to hold digital asset firms accountable for crimes.
Police Groups and Security Officials Rally Behind Clarity Act
Not everyone seems to be against the latest revision, though. The Fraternal Order of Police, the largest police organization in the U.S., recently dropped its objections and backed the crypto bill after previously raising concerns about the BRCA.
The report also says several other groups have backed the legislation, including the National Organization of Black Law Enforcement Executives and the Federal Law Enforcement Officers Association.
Last month, over 160 former national security, intelligence, and other officials also wrote a letter to the Senate in support of the bill, arguing that it would strengthen efforts to combat illicit finance in the crypto space.
The post Trump’s Crypto Adviser Rejects CLARITY Act Developer Proposal appeared first on CryptoPotato.

Free Rein Coffee taps into protein trend

Microsoft Copilot AI Just Dropped the Most Bullish XRP Prediction of 2026

Oscar De La Hoya names the next great Mexican American superstar: “He’s the one”


-

 Fashion5 days ago
Weekend Open Thread: Brooks Brothers
-
 Sports3 days ago
Commonwealth Games boxing: Jadumani Singh seals dominant 5-0 win over Pakistan’s Sumama Rehman to enter quarter-finals | Commonwealth Games News
-

 Tech3 days ago
Intel is reversing course and bringing hyper-threading back to its server chips
-

 Crypto World7 days ago
Ethics, other provisions in crypto Clarity Act to be further discussed
-

 Politics2 days ago
Luke Littler dismantles Gerwyn Price to retain title in Blackpool
-

 Crypto World4 days ago
Ripple bought a bank in pieces. The $4 billion audit
-

 Business2 hours ago
Why Trees Belong on the Risk Register
-
 Entertainment5 days ago
A New Post-Apocalyptic Gundam Anime Series Blasts Into SDCC
-

 News Videos3 days ago
BITCOIN JUST ENTERED THIS CRITICAL ZONE…
-

 Politics2 days ago
The Part of the Electric Transition Nobody Wants to Discuss
-

 Sports6 days ago
2026 3M Open leaderboard: Scottie Scheffler finds putter in Round 1, sits three back
-

 Fashion6 days ago
16 Dresses for the High Summer Event
-

 News Videos6 days ago
The Peugeot Family: How 200 Years of an “Old Money” Dynasty Died in A Boardroom
-

 Business18 hours ago
Major shareholder moves on Canyon
-

 Crypto World4 days ago
XRP Ledger adds $2.6B as RWA inflows rank second
-

 Politics3 days ago
Spain sweeps the board at 2026 World Cup with individual awards
-

 Crypto World6 days ago
Uniswap (UNI) pushes deeper into tokenized RWAs with permissioned trading pools
-
 Entertainment1 day ago
‘Stargate’ Creator’s New Sci-Fi Series Returns for Season 3 Tomorrow
-
Crypto World7 days ago
SEC Agrees to Overhaul Recordkeeping After Settling Coinbase Lawsuit Over Gensler’s Lost Texts
-

 Tech5 days ago
Anthropic launches Claude Opus 5, a cheaper AI model for coding, agents and enterprise workflows
You must be logged in to post a comment Login