

Crypto World
BlackRock Bitcoin ETF Holdings Hit Record 806,700 BTC Worth $63.7 Billion

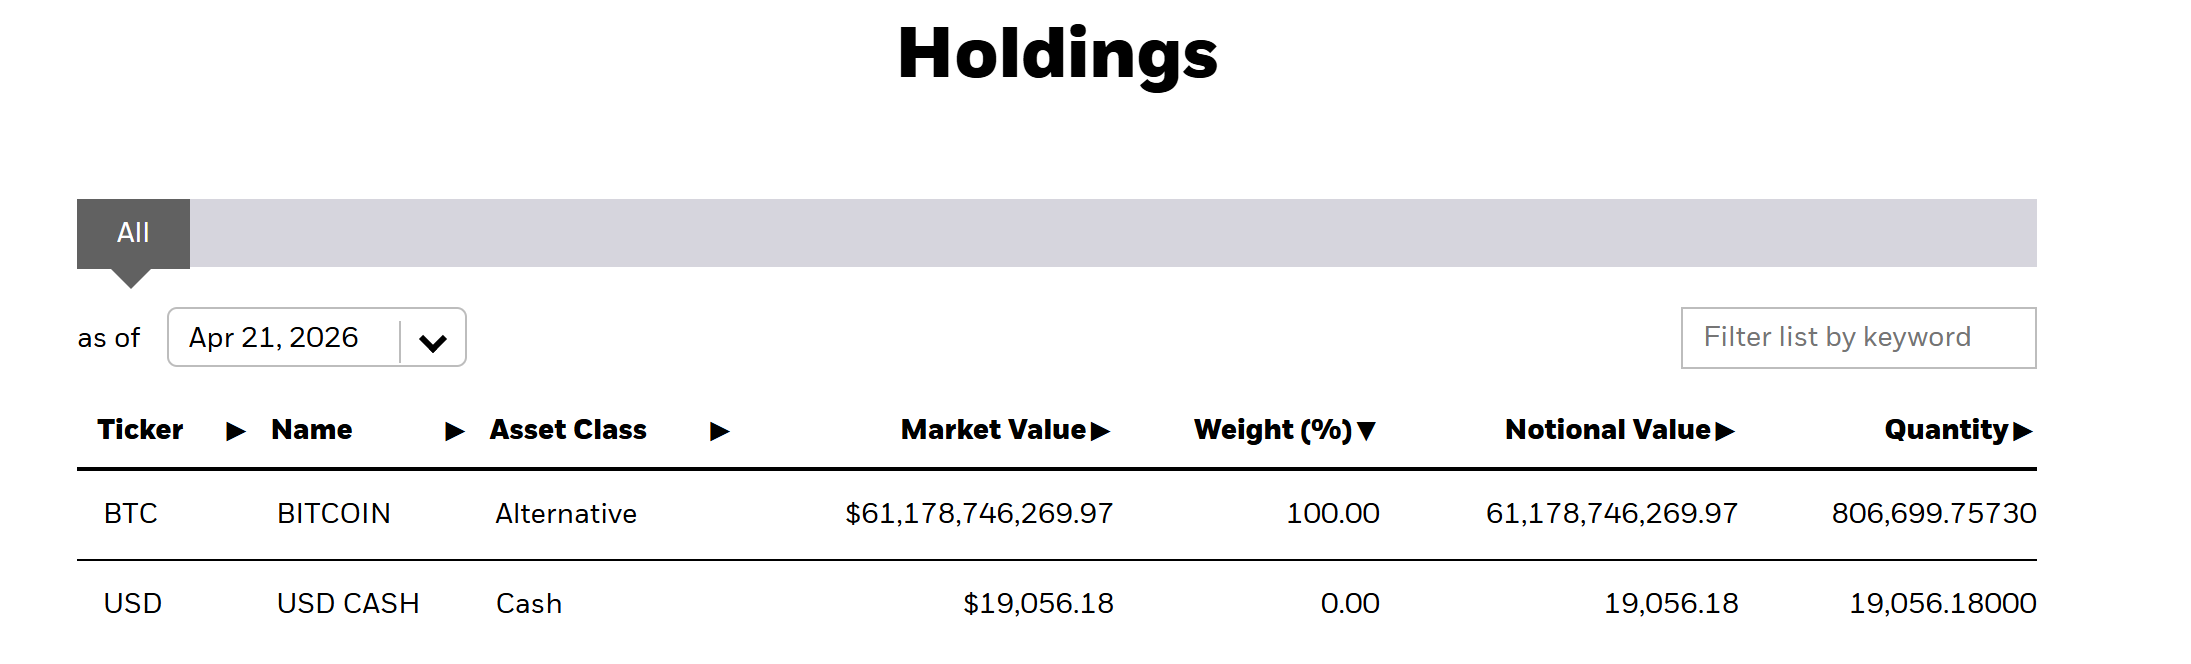
BlackRock’s iShares Bitcoin Trust (IBIT) has accumulated 806,700 Bitcoin (BTC) worth approximately $63.7 billion. The total marks a new all-time high for the world’s largest spot BlackRock Bitcoin ETF.
The record follows nine consecutive trading days of net inflows, during which IBIT added roughly 21,500 BTC. Institutional demand for regulated Bitcoin exposure continues to grow as BTC trades near $78,000.
BlackRock’s IBIT Dominates US Bitcoin ETF Market
BlackRock’s fund now commands roughly 49% of total US spot Bitcoin ETF assets. That puts it well ahead of Fidelity’s FBTC and Grayscale’s GBTC.
The ETF recorded net inflows on 48 of 62 trading days during Q1 2026. Those flows totaled an estimated $8.4 billion for the quarter.
The buying pace picked up in mid-April. IBIT attracted $291.9 million on April 15 and $269.3 million on April 10, according to ETF flow data. That sustained demand pushed total holdings past the 800,000 BTC mark for the first time.
Across the broader market, US spot Bitcoin ETFs have reversed four months of capital flight. The group accumulated roughly $2 billion over four straight weeks of positive net inflows. IBIT contributed approximately $1.7 billion of that total.
MicroStrategy Reclaims Largest Holder Title
Despite the IBIT record, the fund is no longer the single largest corporate Bitcoin holder. MicroStrategy Inc. recently surpassed the ETF with 815,061 BTC on its balance sheet. The firm reclaimed a lead it had lost in Q2 2024.
The Michael Saylor-led firm has bought aggressively this month, adding 13,927 BTC for roughly $1 billion on April 13 alone. The gap between the two now sits at approximately 8,300 BTC.
BlackRock is also broadening its crypto product lineup. The asset manager recently filed an amended S-1 with the SEC for a Bitcoin income ETF under the ticker BITA. The proposed fund would generate yield through a covered call strategy tied to IBIT.
With both IBIT and MicroStrategy continuing to add BTC, the race between the two largest institutional holders may intensify through Q2.
The post BlackRock Bitcoin ETF Holdings Hit Record 806,700 BTC Worth $63.7 Billion appeared first on BeInCrypto.


A closely watched chart pattern has flipped bullish, and at least one analyst says it mirrors the setup that preceded some of the biggest altcoin rallies on record.
According to trader Mark Chadwick, the pattern has historically occurred just before rallies of between 2,000% and 10,000%.
Altcoins Flash Their Strongest Setup in Years, Analysts Say
Chadwick posted on X on May 13 that the altcoin market is showing “one of the cleanest setups we’ve seen since 2020.” In his view, alts have spent months consolidating along a long-term ascending support line, absorbing selling pressure without breaking down, and now momentum is starting to flip.
“That’s historically how Alt Season starts,” he wrote.
He pointed to the 2020-2021 cycle as the clearest comparison, saying that when similar signals appeared then, they pushed many major alts up by “2,000-10,000% within months.”
He also cited the Russell 2000 hitting all-time highs as corroborating evidence that broader risk appetite is returning, arguing that capital rotation out of safer assets and into higher-beta plays is already starting.
That view is quite similar to that shared by another analyst, Michaël van de Poppe, who said earlier in the week that altcoins are currently trailing Bitcoin by one to three weeks and that if the pattern continues, they could start posting gains between 100% and 300%, depending on liquidity conditions and market momentum.
Some on-chain data also offered backing for Chadwick’s thesis, with crypto analyst Darkfost noting that altcoin performance among tokens listed on Binance has returned to levels not seen since September 2025.
Per his data, about 21% of Binance-listed altcoins have now reclaimed their 200-day moving averages. In February, only 2% of those assets held above that level. However, he was careful not to overstate the trend.
“It is far too early to start calling an altseason; the road ahead is still long and liquidity remains constrained,” he pointed out.
Liquidity and Regulation Remain Central Concerns for Traders
Despite the improving charts, some market watchers are still pointing to weak liquidity as a major obstacle for a bigger rally.
Darkfost himself noted that the crypto market has become heavily diluted, with at least 51 million altcoins now in circulation, with 46% of those tokens on Solana, while 36% are on Base and 10% are on BNB Smart Chain.
Macroeconomic concerns are also still weighing on sentiment. Darkfost cited the ongoing US-Iran conflict and inflation worries as factors that are still putting pressure on risk assets.
At the same time, traders are closely watching developments in Washington, with Chadwick, in an earlier post, suggesting that the Digital Asset Market Clarity Act of 2025 could encourage more institutional participation in crypto markets if it paves the way for clearer market structure rules.
The bill is scheduled for markup tomorrow, but has been hit with multiple amendments as well as more than 8,000 letters from members of the American Bankers Association opposing its stablecoin yield provisions.
The post 10,000% Gains? Why One Analyst Says the Strongest Altcoin Setup in Years Is Here appeared first on CryptoPotato.

Aave DAO is seeking approval to integrate Babylon protocol for native Bitcoin collateral in Aave V4, eliminating reliance on wrapped BTC or custodial intermediaries.
Crypto World
Dogecoin Price Prediction Signals Gains for 2026 as Whale Holdings Hit Record, but Pepeto’s Listing Could Create the Bigger Millionaires
The latest dogecoin price prediction data shows Dogecoin holding a bullish structure after whale wallets loaded a record $11.6 billion worth of tokens earlier this month, and the breakout above every major moving average still holds two weeks later.
Capital continues rotating into altcoins as Bitcoin stays above $80,000, and Pepeto is pulling fresh presale attention with nearly $10 million raised, the presale 97% filled, and a Binance listing expected ahead.
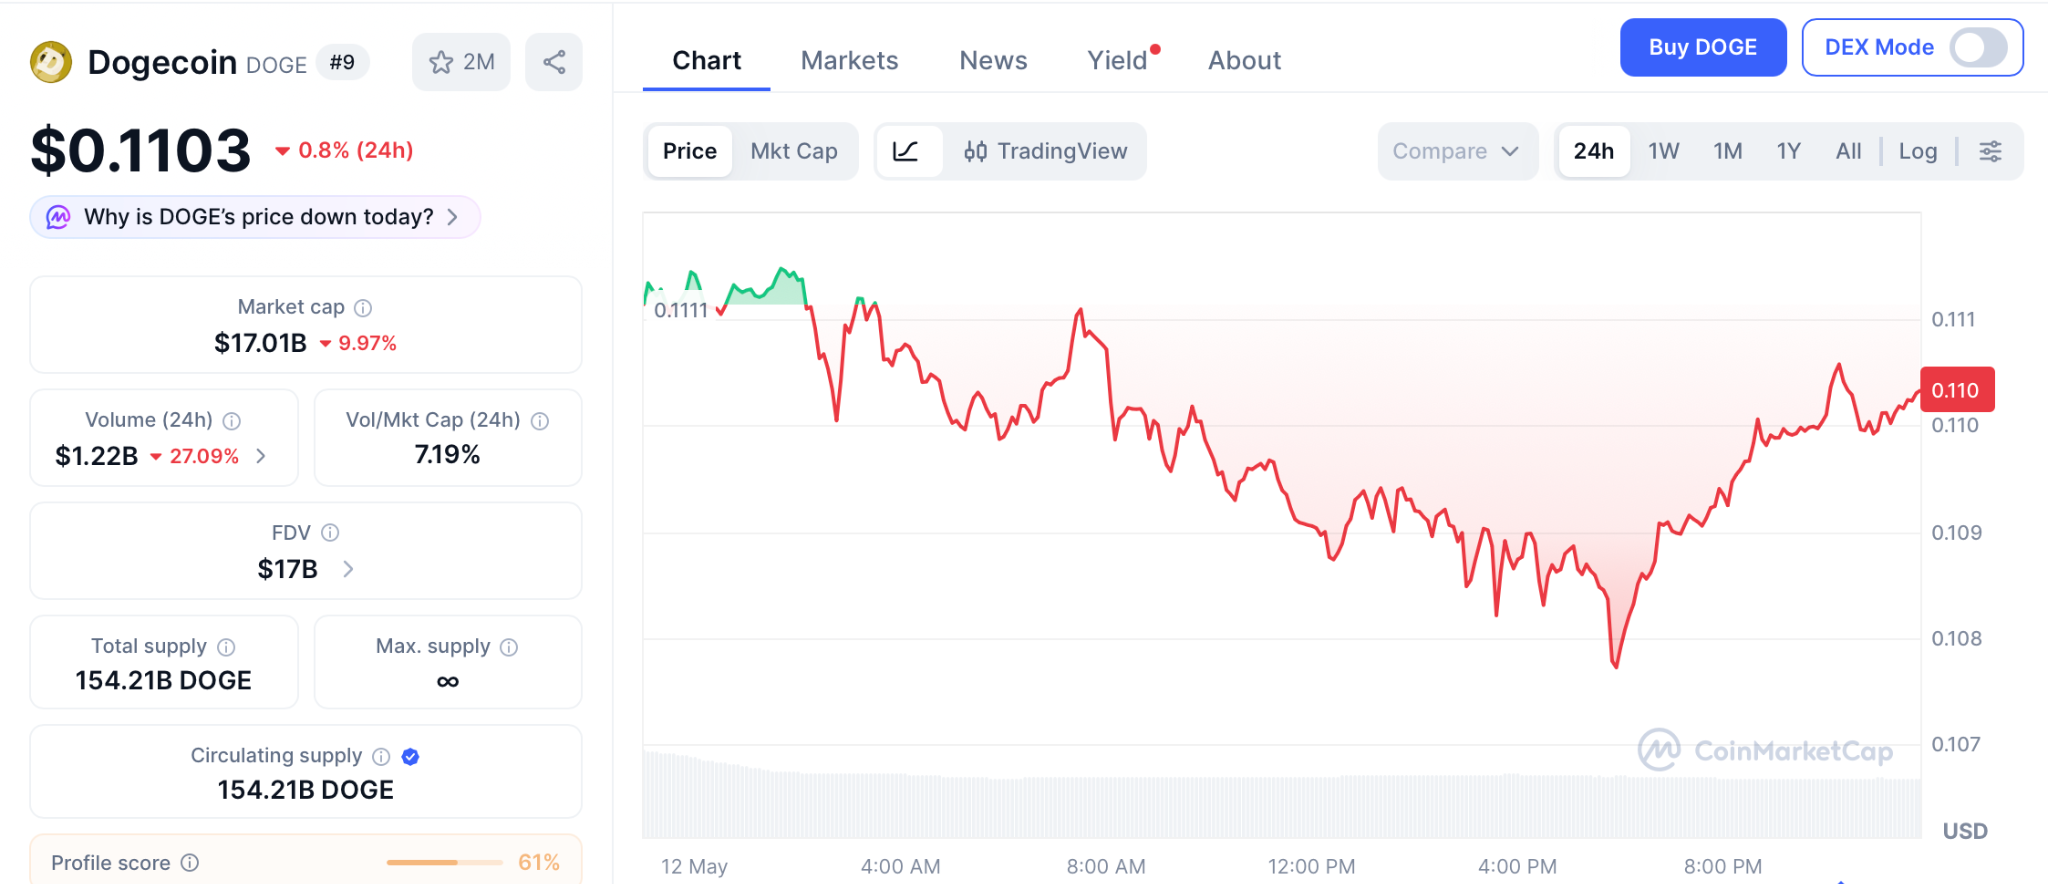
According to Santiment data, the 149 largest Dogecoin wallets now hold 108.52 billion tokens worth $11.6 billion, the highest on record. Dogecoin trades at $0.1103 today after clearing every major moving average in early May for the first time since October 2025, and the breakout structure is holding.
Several dogecoin price prediction models point to a test of $0.118 resistance next, and CoinMarketCap confirms whale accumulation hit a six month high again on May 12.
Dogecoin Price Prediction and Pepeto Lead the Crypto Entries Worth Watching in 2026
Pepeto Builds a Working Exchange Before Listing Day While the Market Chases Price Targets
The crypto market rewards people who enter before the rest of the crowd catches on, and that is exactly what is happening with Pepeto right now at $0.0000001868 before the expected Binance listing changes that number for good.
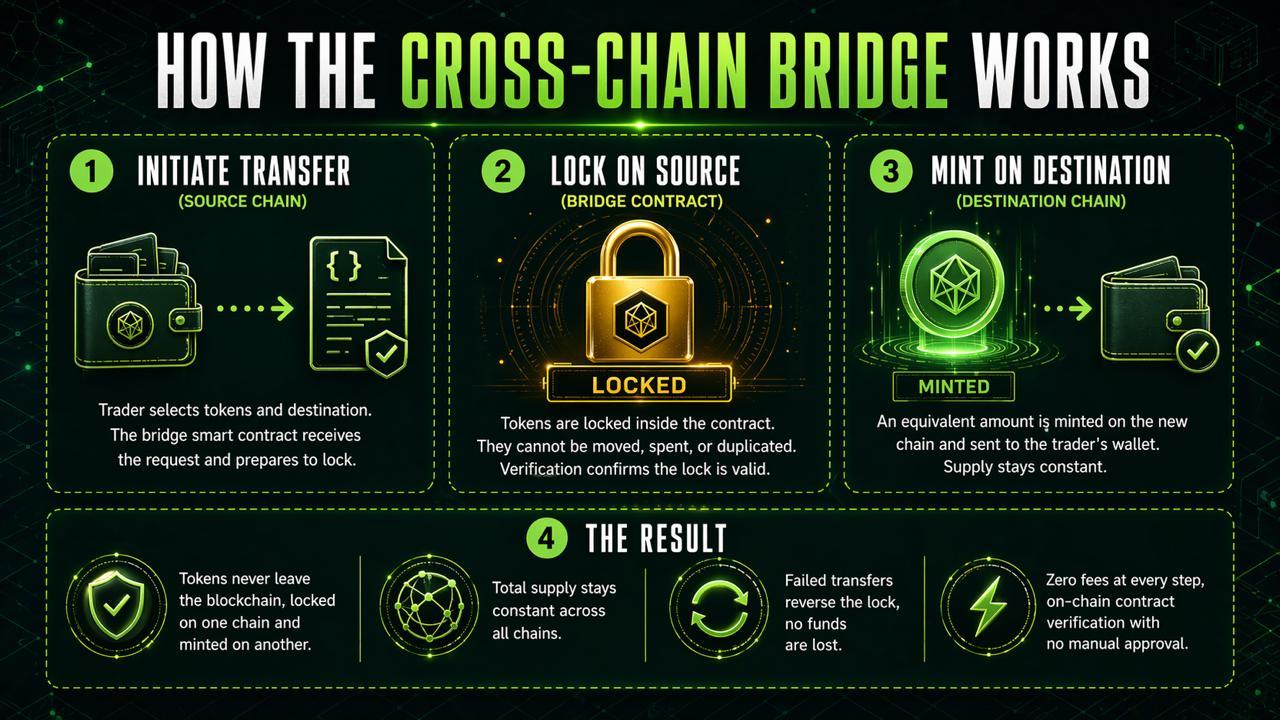
The PepetoSwap exchange already runs zero fee trading, the cross chain bridge already sends assets between networks at zero cost, and 173% staking APY is already compounding tokens for holders who arrived first, which means the platform that most presales promise to build after launch is the platform Pepeto built before asking anyone to buy in.

SolidProof audited every contract, and the Pepe cofounder who took the original PEPE token to an $11 billion market cap with zero tools is steering this one with a full suite of working tools behind it. The presale has pulled in nearly $10 million, stages are clearing in under 48 hours, and the smart contract is 97% filled.
When the last token sells the buy window closes automatically with no warning and no countdown, and the Binance listing follows within days. The exchange price takes over at listing, and the presale buyers are the ones sitting on the returns that the rest of the market will spend the cycle calculating.
Dogecoin Price Prediction
The dogecoin price prediction for the rest of 2026 carries real weight right now. Dogecoin trades at $0.1103 with a market cap of $17 billion according to CoinMarketCap, and the token is holding above its 50 day and 100 day exponential moving averages after printing a cup and handle pattern on the daily chart.
Resistance sits at $0.118 where the 0.618 Fibonacci level lines up with a long term descending channel, and clearing that opens a path toward $0.155 by year end based on CoinCodex models. Support holds at $0.087.
The outlook gets stronger if spot ETF inflows stay positive and the X Money integration or the June SpaceX IPO turn speculation into real announcements, because that could push Dogecoin back toward its 2025 high near $0.27.
Conclusion
The dogecoin price prediction points to Dogecoin running toward $0.15 by late 2026, and that kind of move from a large cap delivers about 40% returns over months of waiting. The original PEPE token reached an $11 billion market cap with zero products behind it, and Pepeto was built by the same cofounder with a working exchange, bridge, and 173% staking already in place, so the math from presale to listing points at returns that a 40% large cap move will never touch.
Nearly $10 million already flowed in, the smart contract is 97% filled, and when the last token sells the buy window closes automatically with no warning. That means the gap between today’s presale price and tomorrow’s listing price could disappear overnight, and every wallet that waited will spend the rest of the cycle calculating what they lost by hesitating over a decision that cost nothing but a few minutes.
The wallets that entered early on PEPE, Shiba Inu, and BNB all say the same thing: the hardest part was not finding the project, it was pressing the button before the crowd arrived. Pepeto is that moment right now, and the listing is days away.
Click To Visit Pepeto Website To Enter The Presale

FAQ
What is the latest dogecoin price prediction for 2026?
Dogecoin trades at $0.1103 with analysts targeting $0.155 by year end if the cup and handle breaks $0.118 resistance. Whale wallets hold a record $11.6 billion.
Why are analysts watching Pepeto alongside the dogecoin price prediction?
Pepeto raised nearly $10 million with a working exchange, 173% staking, and the Binance listing days away. The 97% filled presale closes automatically.
Disclaimer: This is a Press Release provided by a third party who is responsible for the content. Please conduct your own research before taking any action based on the content.

Crypto World
One in Four Americans Now Use Crypto as Everyday Utility Goes Mainstream, NCA Report Finds
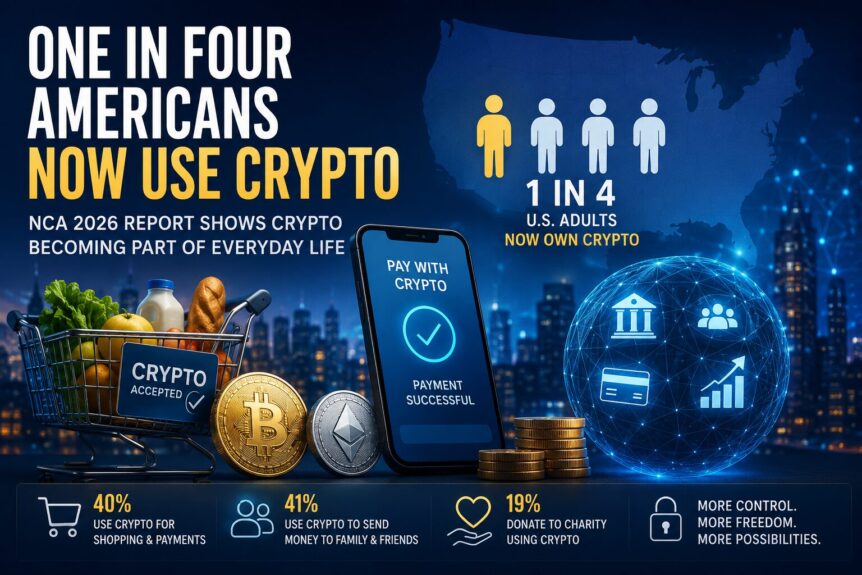
Crypto adoption in the United States is continuing to accelerate, with digital assets increasingly moving beyond speculation and becoming part of everyday financial life, according to the National Cryptocurrency Association’s newly released 2026 State of Crypto Holders Report.
The study, conducted with The Harris Poll among 10,000 U.S. cryptocurrency holders, found that more than 67 million Americans now own crypto, representing roughly one in four U.S. adults. That figure marks an increase of 12 million holders compared to 2025.
Beyond the growing number of holders, the report points to a broader transformation in how Americans are actually using crypto. While investing remains a major driver, usage is rapidly expanding into payments, peer-to-peer transfers, gaming, donations, and business activity.
Speaking with Crypto Breaking, Ali Tager, VP of External Affairs at the National Cryptocurrency Association (NCA), said the industry is entering what she describes as an “everyday utility” phase.
Crypto Usage Is Expanding Beyond Investing
One of the report’s standout findings is that 54% of crypto holders say digital assets have increased their financial independence.
According to Tager, this shift reflects a much deeper evolution in the relationship people have with money and financial systems.
“Crypto usage patterns are diversifying beyond investing and entering a phase of everyday utility,” Tager said.
The report found:
- 40% of holders now use crypto for shopping and payments
- 41% use it to send money to family and friends
- 19% have made charitable donations using crypto
Tager explained that many users are increasingly attracted to crypto because it offers:
- 24/7 access to assets
- faster transactions
- greater financial control
- alternative ways to participate in the economy
“Just like with any other innovation, from AI to smartphones to the internet, these tools become mainstream when we stop focusing on the technology itself and start using it because it solves our everyday problems more efficiently,” she added.
The “Everyday Utility” Era Has Arrived
According to the NCA, crypto’s evolution is no longer theoretical.
Tager shared several examples from the report showing how Americans across different states and professions are using blockchain technology in practical ways:
- ranchers in Wyoming using blockchain to verify humane livestock treatment claims
- artists in California earning royalties directly through blockchain marketplaces
- investors accessing tokenized real estate opportunities
- families using crypto to help manage everyday expenses and medical bills
“Crypto is benefitting people from all walks of life in all kinds of ways,” Tager said.
The report also revealed:
- 54% of holders use crypto in relation to groceries
- 41% connect crypto with travel-related spending
- 39% use it to help cover fuel costs
“When a technology stops feeling novel and starts feeling useful, you don’t notice it crossing over, it just does,” Tager added.
At the same time, she acknowledged that challenges remain, including volatility, trust concerns, and friction around onboarding new users.
Female Participation in Crypto Continues Rising
The report also highlighted a major demographic shift among newer crypto adopters.
Female participation has increased significantly compared to previous years. Among people who entered crypto between 2025 and 2026, women represented 42% of new holders, compared to 34% among earlier adopters.
According to Tager, increasing accessibility and integration with familiar financial systems are helping reduce barriers to entry.
“As crypto becomes integrated into trusted platforms and financial services, it feels more familiar and less complex,” she explained.
The report found that trust tends to rise when crypto becomes connected to mainstream financial brands and platforms such as PayPal, Visa, and traditional banks.
The study also challenges several stereotypes around crypto ownership:
- 90% of holders earn less than $500,000 annually
- 23% earn less than $75,000 per year
- adoption is spreading across construction, manufacturing, retail, technology, and finance sectors
- ownership is growing across Gen Z, Gen X, Boomers, and older generations
Education Remains One of the Industry’s Biggest Challenges
Despite rising adoption, education remains one of crypto’s largest barriers.
According to the report, many Americans still avoid crypto because they simply do not understand how it works or how to use it safely.
Tager said this is one of the core reasons the NCA was created.
“The number one barrier to entry for non-crypto holders in America is that they don’t understand it,” she said.
The organization currently offers:
- free crypto education courses
- interactive beginner lessons
- wallet simulators
- educational podcasts focused on simplifying crypto concepts
Even among existing users, demand for education remains high. Roughly one-third of current crypto holders said they still want more learning resources and practical guidance.
“Accessible resources focused on real-world use cases is what moves the needle,” Tager added.
Regulation, Stablecoins and Payments Could Drive the Next Wave of Adoption
Looking ahead over the next several years, the report suggests mainstream adoption will likely be driven by a combination of:
- payments
- stablecoins
- clearer regulation
- institutional integration
- broader merchant adoption
According to the study:
- 84% of holders expect crypto payments to become common within five years
- 42% believe traditional finance integration would increase trust
- 39% say clearer regulation would strengthen confidence in crypto
Tager believes all of these factors are likely to work together rather than independently.
“Consumers are increasingly looking for practical, everyday ways to use their crypto,” she said.
The report also found that many large retailers in the United States are already accepting crypto payments at checkout.
At the same time, Tager warned that public perception remains heavily influenced by misinformation and sensationalized narratives online.
“When the loudest voices reduce crypto to a caricature, it becomes harder for people to separate fact from fiction,” she said.
“Some may jump in too quickly without understanding it. Others may dismiss the tool entirely without realizing the benefits.”
The National Cryptocurrency Association said it plans to continue expanding educational initiatives and partnerships designed to help Americans better understand how crypto works and how it can be used responsibly in everyday life.
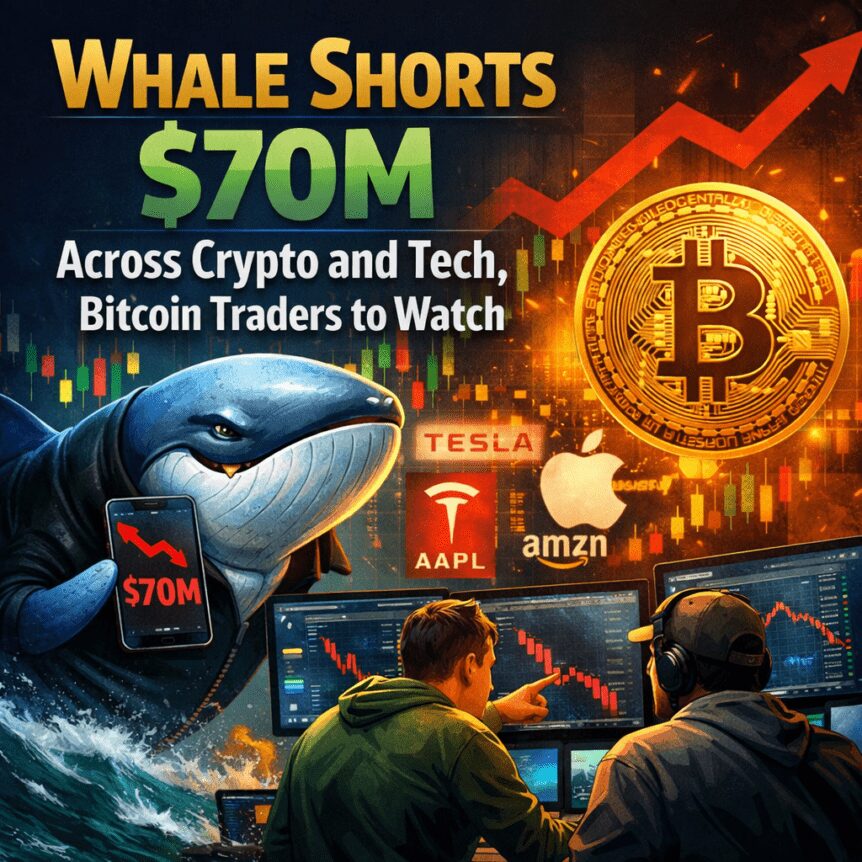
Bitcoin faced a pullback below the $80,000 mark as macro pressures—chiefly elevated oil prices and a heavy-handed liquidity backdrop from the Federal Reserve—added to the fragility of recent upside moves. In the midst of this environment, a Hyperliquid whale opened a roughly $70 million short position across cryptocurrencies and synthetic tokens tied to major technology stocks, stamping a clear bearish tilt on several risk-on assets even as some on-chain traders previously profited from long bets.
Data points and attributions for the move point to a long-running, algorithmically flavored trading approach within the Hyperliquid ecosystem. The new short, traced to the address 0x8def…992dae, is widely reported to be associated with Loracle, an early contributor to Hyperliquid. The development matters not only for price action but for how traders are framing risk in a market still grappling with macro headwinds and a shifting liquidity backdrop.
Key takeaways
- A Hyperliquid whale opened a ~$70 million bearish position across crypto assets and synthetic tokens tied to major tech equities, signaling a technical pivot amid ongoing macro noise.
- The same trader has a track record of profitable bets, including prior long positions in Bitcoin, Zcash, and Toncoin that yielded about $9.2 million over two weeks, underscoring the contrast between short-term tactical bets and longer-running convictions.
- Over the past week, the whale has accumulated a $49 million short on HYPE and expanded into a $12.5 million Bitcoin short plus $8 million in SNDK- and Nasdaq-100-linked synthetic tokens, while maintaining a $1.7 million long in a gold-backed stablecoin—reflecting a nuanced, risk-on/risk-off mix.
- Analysts emphasize the trades appear algorithmic with typical holding periods under a week, suggesting the moves are driven by short-term technical setups rather than a fundamental macro thesis against risk-on assets.
Unpacking the wager and its context
In a market where every macro signal can ripple through crypto prices, the new short position signals more than a single trader’s inclination—it points to a broader debate about timing and resilience. The trader’s blitz of bearish bets across HYPE and Bitcoin, paired with exposure to synthetic tokens tracking major tech names, hints at a liquidity-driven, hedged stance rather than a simple conviction that equities will crash. While Bitcoin has had its own narrative in recent sessions, the position underscores how correlated assets—and their derivatives—can be shuffled in response to short-term price dynamics.
Specifically, the wallet’s activity over the past week included a sizable $49 million short on HYPE, expanding into a $12.5 million short in Bitcoin and an $8 million allocation in synthetic tokens linked to Sandisk and the Nasdaq-100 Index. Yet the same account showed a $1.7 million long in a gold-backed stablecoin, suggesting a measured approach that blends downside bets with hedges against volatility in the broader crypto complex. On the profit side, the trader has historically booked gains from bullish bets as well—the Bitcoin, Zcash, and Toncoin long closed recently yielded a reported $9.2 million over two weeks, and a separate oil-linked synthetic token trade produced about $3 million in profit after a nine-day hold.
What does this mix tell investors? First, the activity illustrates a propensity for rapid, short-cycle moves rather than a long-term directional bet. Analysis from app.trade.xyz depicts an algorithmic trading style with repeated patterning: positions are opened with the expectation of quick reversals or fades, then closed as momentum signals shift. In other words, the liquidity environment—and its microstructures—may be driving capital allocations that look technical more than fundamental.
Macro backdrop: oil, inflation, and the Fed’s balance sheet
The price environment is not helping to calm market nerves. Brent crude has traded above the $100 per barrel threshold as geopolitical frictions—especially in the Middle East—keep supply concerns elevated. Such dynamics feed into inflation expectations, complicating the Federal Reserve’s policy calculus at a moment when liquidity conditions remain a focal point for market participants. In this context, traders are watching for how the Fed will respond to growing inflation pressures and to the broader demand for safe, scarce assets as fixed-income competition intensifies.
Monetary policy signals have grown more complex. The Fed has been actively expanding its balance sheet, purchasing bonds and mortgage-backed securities to ease liquidity strains in the financial system. While this approach can provide near-term relief to counterparties and market infrastructure, it also fuels inflationary pressures and reduces the central bank’s room to maneuver for rate cuts. The persistence of such a balance sheet expansion tends to recalibrate risk appetites across asset classes, potentially altering the relative appeal of fixed income versus scarce, non-yield-bearing stores of value like Bitcoin over the medium term.
From a market structure perspective, a weaker demand for U.S. Treasuries—amid rising inflation expectations and ongoing fiscal pressures—can paradoxically bolster Bitcoin’s macro narrative as a non-sovereign store of value with a fixed supply. If Treasuries become less dominant in global portfolios, capital could rotate into assets perceived as hedges against monetary dilution. That dynamic, however, operates on a longer horizon and depends on how quickly inflation resilience, growth, and policy normalization interact in the coming months.
What this means for traders and builders
For traders, the latest hyper-liquidity move underscores the importance of monitoring the on-chain footprints of large, algorithmically driven players. Even as a single wallet’s bets may not define a trend, they can amplify near-term volatility, particularly when the trades touch instruments tied to equities through synthetic tokens. In that sense, the episode highlights the continuing relevance of cross-asset liquidity, derivatives, and the sensitivity of crypto markets to macro news flow and liquidity shifts.
For developers and investors, the episode reinforces several practical takeaways. First, the interplay between oil prices, inflation expectations, and central-bank balance sheets remains a critical driver of risk appetite. Second, market participants should be mindful of algorithmic strategies that operate on very short timeframes, which can cause abrupt reversals even when longer-term fundamentals seem supportive. Finally, while Bitcoin may benefit from a narrative shift toward scarcity in the face of weaker Treasuries demand, the path to a durable uptrend requires stability in macro conditions and credible progress on inflation and growth trajectories.
Beyond the immediate moves, observers will want to watch two key questions: Will the Fed’s liquidity stance remain accommodative long enough to sustain a broad risk rally, or will inflation pressures force a policy shift that caps risk assets? And will Bitcoin’s role as a macro diversification tool gain traction if Treasuries complexity continues to erode investor confidence? The answers will shape whether the current on-chain activity is a one-off hedging maneuver or a harbinger of a broader regime shift for crypto markets.
In the near term, market watchers should monitor the next set of price actions around Bitcoin and related assets, especially in relation to macro data releases and evolving liquidity conditions. While the Hyperliquid whale’s latest bets are notable, they are one piece of a larger mosaic—one that will unfold as traders balance technical setups against the evolving inflation and policy backdrop.
The biggest meme coin by market capitalization has jumped by double digits over the past 30 days, increasing its dominance in its niche.
However, certain technical indicators suggest the bears may soon regain control.
The Incoming Correction?
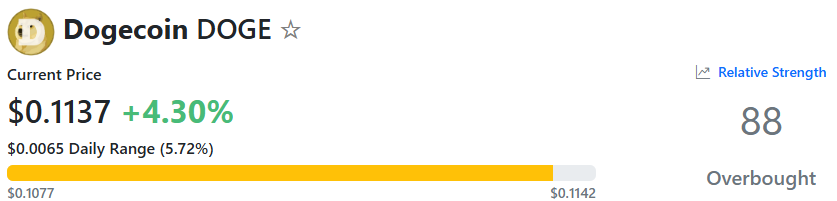
As of press time, DOGE trades at around $0.114 (according to CoinGecko), representing an impressive 8% increase on a two-week basis and a 25% surge for the month. In fact, it has outperformed many leading cryptocurrencies, including Bitcoin (BTC) and Ethereum (ETH), over these time frames.
Nonetheless, the renowned analyst Ali Martinez tempered the excitement in the Dogecoin community after noting that the TD Sequential indicator had flashed a sell signal on the meme coin.
Another short-term warning sign is DOGE’s Relative Strength Index (RSI). The technical analysis tool is often used by traders to spot potential price reversal points and ranges from 0 to 100.
Readings above 70 indicate that the meme coin’s valuation has risen too much, too quickly, and could be due for correction. On the contrary, anything below 30 suggests that the token is oversold and on the verge of a resurgence. As of this writing, DOGE’s RSI stands at roughly 88.
The Bullish Scenario
Despite the aforementioned indicators hinting at a price decline in the near future, multiple market observers remain optimistic that the meme coin has plenty of fuel left to post further gains.
X user Ryker claimed that DOGE’s chart “looks great,” predicting that it “will lead meme trend back together.” For their part, JAVON MARKS argued that the asset has started responding even more positively to a major bullish divergence that has been holding with the MACD.
They envisioned a whopping 500% breakout to the $0.6533 target, which could then open the door to an ascent to a new all-time high of approximately $1.25.
MikybullCrypto followed up with an even more optimistic outlook. They suggested the current levels are “the best area” to hop on the bandwagon before “the massive bullish tide,” forecasting an astronomical explosion to $12.
It is important to note that such a pump seems quite improbable (at least for now), as it would require DOGE’s market cap to exceed $1.8 trillion. In comparison, the current capitalization of BTC stands at around $1.61 trillion, while the total value of the entire crypto sector is less than $2.8 trillion.
The post Dogecoin (DOGE) Soars 25% in a Month, But Key Indicator Flashes a Sell Signal appeared first on CryptoPotato.


Yellow Network chairman Alexis Sirkia says the CLARITY Act is the structural reset U.S. crypto has waited for.
Summary
- Sirkia argues the bill creates the first navigable framework around classification, jurisdiction, and compliance for crypto firms.
- Years of regulatory uncertainty pushed builders to Dubai and Singapore, and the CLARITY Act could reverse that flow if it passes.
- Success, Sirkia says, means founders launching U.S. products without fear of retroactive enforcement years down the line.
The CLARITY Act is moving faster than at any point in its legislative history. The Senate Banking Committee released a new 309-page draft on May 12, with a markup scheduled for May 14, as the White House pushes for Trump to sign the legislation before July 4. For Alexis Sirkia, chairman and co-founder of Yellow Network, the timing is overdue.
“A lot of crypto companies have spent years trying to figure out which regulator they answer to and whether the rules might suddenly change after they launch,” Sirkia said. “That uncertainty affects everything from fundraising to banking relationships to hiring.”
Why builders left and what changes if the bill passes
At Yellow, which builds decentralized clearing infrastructure for digital assets, Sirkia deals daily with the friction that regulatory ambiguity creates across liquidity, settlement, and compliance. His view is that most serious builders are not looking for a free pass from oversight. They are looking for predictability.
“Infrastructure companies cannot scale globally if the rules change every few months or if nobody knows how existing laws apply to decentralized systems,” Sirkia said.
He points to the CLARITY Act’s provisions around disclosure standards, AML requirements, and oversight structures as the foundations that allow companies to make long-term decisions around capital and hiring.
If the bill passes, Sirkia expects founders and engineering talent to remain in the U.S. rather than default to easier regulatory environments. “Right now, a lot of companies choose places like Dubai or Singapore because the regulatory path is simply easier to understand,” he said. “If uncertainty continues, the U.S. risks missing out on a major infrastructure shift happening across finance and digital assets.”
The CLARITY Act passed the House 294 to 134 in July 2025 and cleared the Senate Agriculture Committee in January 2026, but has repeatedly stalled in the Banking Committee over stablecoin yield provisions and unresolved ethics language around government officials’ crypto holdings.
The bar for success and the global race
Senator Bernie Moreno has set a hard end-of-May deadline, warning that missing the window could shelve the legislation for years. Prediction markets currently put the odds of the Act becoming law in 2026 at around 55%.
Sirkia’s definition of success is direct. He wants founders launching products in the U.S. without fear of retroactive enforcement, and banks treating crypto infrastructure as a legitimate counterparty rather than a compliance liability.
“I’d also like to see a healthier relationship between regulators and industry participants overall,” he said. “Crypto will move faster when there’s dialogue and clearer communication.”
On the global picture, Sirkia sees the CLARITY Act as a signal as much as a rulebook. “I see the CLARITY Act as an important signal the U.S. wants to play a serious role in the future of digital finance,” he said. “That matters for everything from stablecoins to tokenized assets to next-generation trading infrastructure.”
Yellow Network, which tapped the XRPL EVM Sidechain to power real-world asset trading, is among the firms watching the May 14 markup closely. If the CLARITY Act advances, Sirkia says expanding compliant decentralized clearing and trading infrastructure inside the U.S. market becomes the immediate priority.

TLDR
- Consensys has delayed its planned U.S. initial public offering until at least the fall.
- The company had aimed to file a confidential draft S-1 with the SEC in late February.
- Weak crypto market conditions led the firm to pause its IPO timeline.
- Consensys engaged JPMorgan and Goldman Sachs to lead the potential offering.
- Bitcoin ETF outflows and falling token prices contributed to market pressure.
Consensys has postponed its planned U.S. initial public offering until at least fall due to weak market conditions. Sources familiar with the matter confirmed the delay and cited recent volatility in crypto markets. The Ethereum software firm had prepared to begin formal filing steps earlier this year.
Consensys Halts IPO Filing Plans
Consensys had targeted a confidential draft S-1 filing with the Securities and Exchange Commission by late February. However, worsening market trends led the company to pause those plans. Two people with direct knowledge confirmed the revised timeline.
The company engaged bankers from JPMorgan and Goldman Sachs last year to manage the offering process. It aimed to move forward while regulatory clarity improved for digital asset companies. Yet market performance shifted sharply at the start of 2026.
Crypto markets declined in February as traders reduced exposure to risk assets. Bitcoin ETFs recorded heavy outflows, and prices across tokens fell. As a result, leveraged liquidations spread across digital assets.
Macroeconomic concerns and tariff discussions also weighed on sentiment. Expectations for interest rate cuts slowed during the same period. Those factors combined to pressure equity and crypto valuations.
A Consensys spokeswoman declined to comment on specific IPO timing. She stated, “As a matter of policy, we don’t comment on market speculation.” The company has not announced a new filing date.
Market Conditions Pressure Crypto Listings
Several crypto firms outlined public listing plans earlier this year after clearer U.S. regulatory guidance. However, weaker market performance forced many companies to reassess their schedules. Large firms such as Kraken and Ledger paused their IPO plans.
BitGo, operating under ticker BTGO, completed the only crypto-native IPO in 2026. The company raised about $213 million in January. It priced shares at $18, which exceeded the marketed range.
Shares rose more than 20% during the company’s debut on the New York Stock Exchange. However, the rally faded in subsequent weeks. The stock now trades about 36% below its IPO price.
The price decline reflected ongoing volatility in digital asset equities. Crypto-linked stocks have tracked broader movements in token prices. Therefore, companies have adjusted capital raising strategies.
Consensys previously secured $450 million in a Series D funding round in early 2022. That round valued the firm at $7 billion. The company has not disclosed updated valuation figures since then.
Joe Lubin leads Consensys and oversees products including the MetaMask wallet. The firm continues to operate its Ethereum development services. For now, it has shifted its IPO consideration to the fall timeframe.
TLDR
- Jupiter has partnered with Bitwise to launch an isolated USDe lending market on Solana.
- Bitwise will curate the dedicated USDe pool within Jupiter Lend for institutional participants.
- The USDe market will operate separately from Jupiter Lend’s main liquidity layer.
- The structure aims to manage risk and support institutional capital participation.
- Fluid protocol will provide collateral and lending infrastructure for the isolated pool.
Jupiter has partnered with Bitwise to launch an isolated USDe lending market on Solana. The firms announced the initiative on Wednesday and confirmed institutional access. The structure separates USDe liquidity and integrates Fluid for lending infrastructure support.
Bitwise and Jupiter Launch Isolated USDe Market on Solana
Jupiter confirmed that Bitwise will curate a dedicated USDe market on Jupiter Lend. The platform will isolate this market from its main liquidity layer to manage risk. The firms said the structure aims to support institutional capital with controlled exposure.
Bitwise will oversee market parameters while Jupiter provides the lending framework. The setup marks the first time an institutional asset manager curates a market on Jupiter Lend. The companies stated that this approach strengthens risk management and capital efficiency.
The isolated pool will function independently from other lending markets on the platform. As a result, liquidity risks from other assets will not affect the USDe market. The partners said this design aligns with institutional compliance standards.
Jonathan Man, Head of DeFi Strategies at Bitwise, addressed the launch. He said, “Jupiter and Fluid have built unique infrastructure for efficient lending markets.” He added that the design provides deep liquidity and risk-mitigating features.
USDe Gains Dedicated Lending Support Through Fluid Integration
The initiative integrates Fluid protocol to supply collateral and lending infrastructure. Fluid will support collateral management and borrowing operations within the isolated pool. The firms confirmed that this integration enhances operational efficiency.
The new market allows users to earn yield on USDe within Jupiter Lend. USDe functions as a synthetic asset that maintains a stable value target. Ethena Labs issues the token and oversees its underlying structure.
Guy Young, CEO of Ethena Labs, commented on the development. He said, “USDe is an institutional-grade savings product, built for scale.” He added that the combined infrastructure creates an efficient USDe market ready for DeFi adoption.
USDe launched in early 2024 and expanded rapidly across crypto markets. By mid-2025, it ranked as the third-largest stablecoin by market capitalization. The asset attracted institutional participation during its early growth phase.
However, USDe later declined in market rankings after volatility pressures. A crypto market crash on Oct. 10 exposed decoupling risks linked to the asset. Market data showed fluctuations in USDe’s price stability during that period.
Jupiter and Bitwise did not disclose specific yield rates for the market. They confirmed that the structure will operate under defined collateral parameters. The companies stated that the market is now live on Solana.
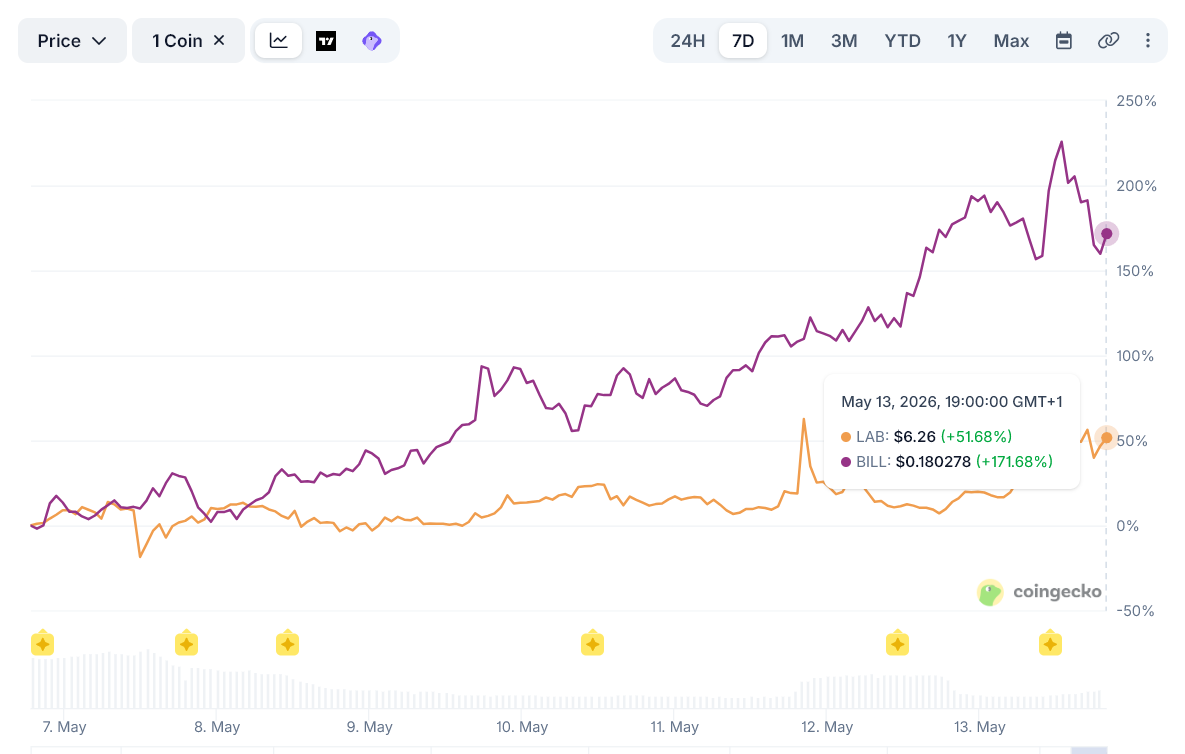
AI tokens are leading the May crypto rally, with LAB and Billions Network (BILL) both posting sharp gains. LAB has attracted traders through its AI-powered trading terminal. BILL has gained attention as a decentralized identity token built for humans and AI agents.
Both charts still point higher if momentum holds. However, the risk profile is different.

What Is LAB Token?
LAB is the native token of a multi-chain trading terminal. The platform lets users trade spot, limit, and perpetual markets across Solana, Ethereum, and BNB Chain from one AI-powered interface.
Its token has a maximum supply of 1 billion, with about 230 million in circulation. LAB holders can stake tokens, vote on governance, and earn a share of transaction fees as platform volume grows.
Why is LAB Token Up 300%?
The main catalyst came on May 3, when LAB launched its mobile app. The move expanded the product beyond browser-extension users and helped trigger a sharp rally.
LAB surged 364% in one day and reached $3.18 before falling 65%. The move liquidated about $12.7 million in leveraged positions within hours.
Since then, LAB has pushed higher again. It recently traded around $6.10 after retesting the 0.786 Fibonacci level near $6.04. The token hit an all-time high of $7.50 on May 11.
LAB Price Outlook
If buyers stay in control, the first upside target sits near $9.35. A stronger breakout could push LAB toward $11.70. That would mean roughly 53% to 92% upside from current levels.
Still, traders should treat LAB as a high-risk momentum trade. On-chain investigator ZachXBT has accused LAB founder Boba Sadikov of coordinating market-making activity across centralized exchanges. The LAB team has not publicly addressed the claims.

Future token unlocks are another risk. Around 282 million LAB tokens remain locked, which could pressure price if supply enters the market during weaker conditions.
What is the Billions Network (BILL) Token?
BILL is the native ERC-20 token of Billions Network. The project focuses on decentralized identity and verification for both humans and AI agents.
Billions uses decentralized identifiers, verifiable credentials, and zero-knowledge proofs. In simple terms, it lets users prove facts about themselves without exposing all their personal data.
Its biggest angle is DeepTrust, a framework designed to verify AI agents through “Know Your Agent” (KYA). That could become more important if AI agents start making more on-chain transactions.
BILL Price Outlook
BILL launched on May 4 across several major exchanges, including KuCoin, Bybit, Binance Alpha, MEXC, OKX, and Kraken. More listings followed shortly after.
Futures listings added more fuel. Bybit listed a BILL perpetual contract on May 6. Binance followed up with BILL/USDT futures on May 7, helping the token jump nearly 50% in a single session.

BILL recently traded near $0.2035 after touching an intraday high of around $0.2268. The first upside target sits near $0.28. A stronger move could take it toward $0.35.
Support sits near $0.15, with a deeper level near $0.10. Momentum remains bullish, but the token is still new, so sharp pullbacks are likely.
For now, LAB offers the more explosive chart. BILL offers a stronger identity and an AI-agent narrative. Traders should watch momentum, exchange flows, and unlock risks before chasing either move.
The post Two AI Tokens Lead May Rally, But Risks Are Rising appeared first on BeInCrypto.

(PHOTO) Sophie Cunningham Ignites Social Media with Seductive Bikini Photos from SI Swimsuit 2026 Beach Shoot
10,000% Gains? Why One Analyst Says the Strongest Altcoin Setup in Years Is Here

Sabres’ Lindy Ruff: Canadiens players ‘going down easy’ to draw penalties
Manchester United reach agreement with Casemiro over contract clause amid transfer speculation

US brings back mandatory military draft registration

Steven Gerrard disagrees with Gary Neville over ‘shock’ Chelsea and Arsenal claim | Football


-
 Crypto World6 days ago
HarrisX Poll Found 52% of Registered Voters Support the CLARITY Act
-

 Fashion5 days ago
Weekend Open Thread: Marianne Dress
-

 Crypto World7 days ago
Upbit adds B3 Korean won pair as Base token gains Korea access
-
 NewsBeat7 days ago
NCP car park operator enters administration putting 340 UK sites at risk of closure
-

 Fashion2 days ago
Coffee Break: Travel Steam Iron
-

 Tech4 days ago
Auto Enthusiast Carves Functional Two-Stroke Engine from Solid Metal
-

 Fashion3 days ago
What to Know Before Buying a Curling Wand or Curling Iron
-

 Politics2 days ago
What to expect when you’re expecting a budget
-
 Business4 days ago
Ignore market noise, India’s long-term story intact, say D-Street bulls Ramesh Damani and Sunil Singhania
-

 Politics5 days ago
Politics Home Article | Starmer Enters The Danger Zone
-

 Tech3 days ago
GM Agrees To Pay $12.75 Million To Settle California Lawsuit Over Misuse Of Customers’ Driving Data
-

 Politics6 days ago
Simon Cowell Says He Was ‘Horrible’ To Susan Boyle During BGT Audition
-

 Entertainment7 days ago
Sarah Paulson Called Out For Met Gala ‘Hypocrisy’
-

 Entertainment6 days ago
General Hospital: Ric & Ava Bombshell – Ric’s Massive Secret Exposed!
-

 Crypto World7 days ago
Robinhood says Wall Street is building onchain
-

 Sports7 days ago
UEFA Champions League final schedule, teams, venue, live time and streaming | Football News
-

 Entertainment6 days ago
Why David Letterman Called CBS ‘Lying Weasels’
-
 Sports7 days ago
Mike Tyson speaks out on status of Floyd Mayweather fight
-
Entertainment7 days ago
Hayden Panettiere reveals she's estranged from mom, addresses brother Jansen's sudden death: 'I was floored'
-
 Entertainment7 days ago
Paramount+’s ‘Landman’ Season 3 Gets Promising New Update From Returning Director
You must be logged in to post a comment Login