
Crypto World
BNB Chain Leads All Blockchains for AI Agents


BNB Chain has officially become the leading blockchain network for autonomous AI agents, with more than 150,000 on-chain deployments as of April 20, a 43,750% increase from the fewer than 400 agents that existed across all blockchains at the start of 2026, with one in every three AI agents currently operating on any blockchain now running on BNB Chain.
Summary
- BNB Chain surpassed 150,000 on-chain AI agent deployments as of April 20, 2026, up from fewer than 400 at the start of the year, representing a 43,750% increase in under four months.
- Third-party data from 8004scan confirms that one in three autonomous AI agents operating on any blockchain now runs on BNB Chain, giving it a dominant share of the emerging on-chain agent economy.
- Developers are using agents to execute DeFi strategies, manage NFT activity, and coordinate cross-chain tasks continuously without human input, running 24 hours a day across multiple protocols.
BNB Chain confirmed on its official blog on April 20 that it has become the number one blockchain network for autonomous AI agents, with over 150,000 on-chain deployments recorded. In January 2026, fewer than 400 AI agents existed across all of blockchain. The 43,750% growth in under four months represents one of the fastest adoption curves for any single category in the history of on-chain development.
BNB Chain AI Agents Surge to 150,000 Deployments in Four Months
The growth is directly tied to BNB Chain’s adoption of two agent identity standards. The ERC-8004 standard, launched by the Ethereum Foundation, defines how AI agents register on-chain identities, manage wallets, and interact with smart contracts autonomously. BNB Chain then extended this with its proprietary BAP-578 standard, which goes further by enabling agents that are ownable, tradable, and upgradeable, capable of autonomous execution across multiple protocols simultaneously. Third-party data from 8004scan, which tracks on-chain agent activity, confirms that BNB Chain’s agent infrastructure is generating measurable economic activity. At peak, daily transaction volume tied to ERC-8004 agents on BNB Smart Chain reached approximately 523,000 transactions in a single day, with agent-driven DEX trading volume hitting over $18 million on the same day. As crypto.news reported, BNB Chain’s 2026 technical roadmap targets 20,000 transactions per second with sub-second finality, a throughput target specifically designed to support the kind of continuous, high-frequency execution patterns that AI agents generate.
What AI Agents Are Actually Doing on BNB Chain
The 150,000 agents operating on BNB Chain are not passive wallet addresses. Developers are deploying them to run DeFi strategies continuously, deploy tokens natively on BNB Smart Chain, power NFT ecosystems, manage customer-facing applications, and coordinate across chains around the clock without requiring human oversight between transactions. The critical infrastructure requirement for agents, unlike standard DeFi users, is that they execute constantly across multiple protocols on tasks that would take a human hours to manage manually. That demands low-cost, high-throughput infrastructure with reliable composability. BNB Chain’s sub-cent transaction fees and native cross-chain coordination tools have made it structurally attractive for agent developers who need infrastructure that can keep pace with continuous autonomous execution. As crypto.news documented, Binance itself has been building AI agent infrastructure at the exchange level, rolling out seven AI Agent Skills in March 2026 to connect spot trading, wallet data, and execution tools into a unified interface that automated systems can operate without manual intervention.
What the AI Agent Surge Means for BNB and the Broader Ecosystem
The emergence of BNB Chain as the dominant AI agent network adds a new demand narrative to BNB’s utility case that extends beyond its established role as a gas and fee token for retail DeFi. Agents that manage wallets, execute trades, and coordinate cross-chain positions generate sustained, programmable transaction demand rather than the episodic volume driven by human trading activity. As crypto.news tracked, Binance subsequently added four more AI Agent Skills in March covering USD-margined futures, margin trading, Alpha market data, and asset management, wiring automated strategies further into its infrastructure stack and reinforcing the ecosystem’s positioning as an AI-native execution venue. BNB was trading at approximately $583 on April 23, roughly 57% below its October 2025 all-time high of $1,375, with the AI agent narrative now being watched closely by analysts as a potential structural catalyst for the network’s next growth phase.
BNB Chain said it will continue expanding agent infrastructure, with further BAP-578 standard development and new developer tooling designed to support the next wave of autonomous on-chain applications expected later in 2026.

The Commodity Futures Trading Commission (CFTC) has filed a lawsuit against New York to stop the state from applying its gambling laws to federally regulated prediction market platforms, escalating a growing clash over who has authority to oversee these products.
In a complaint lodged in the US District Court for the Southern District of New York, the CFTC argued that federal law gives it exclusive authority over these markets, asking the court for a declaratory judgment and a permanent injunction against New York’s enforcement actions.
“CFTC-registered exchanges have faced an onslaught of state lawsuits seeking to limit Americans’ access to event contracts and undermine the CFTC’s sole regulatory jurisdiction over prediction markets,” CFTC Chair Michael Selig said.
Earlier this week, New York filed suits against Coinbase and Gemini, claiming their offerings violated state gambling rules. The state had also previously targeted Kalshi, ordering it to halt parts of its sports-related contracts.
Related: Kalshi, Polymarket among 27 prediction platforms banned in Brazil
States say federal law doesn’t legalize sports betting
On Friday, a coalition of 37 states and Washington, D.C. filed an amicus brief supporting Massachusetts in its case against Kalshi, urging Massachusetts’ highest court to reject Kalshi’s argument that federal law allows it to offer sports betting nationwide without following state rules.
Kalshi argues its betting products are “swaps” regulated by a federal agency under a 2010 financial law. The states say that law was never meant to legalize or control sports betting and does not clearly override state authority, which has historically governed gambling.
37 states back Massachusetts in amicus brief. Source: New York Gov
The states also argue that removing state oversight would weaken protections. State laws currently handle licensing, age limits, fraud prevention, and gambling addiction, which are areas not covered by federal financial regulation.
Related: US appeals court upholds preventing New Jersey enforcement against Kalshi
States ramp up crackdown on prediction markets
State officials have taken a more aggressive stance against prediction markets in recent months, issuing cease-and-desist letters and pursuing legal action against firms offering prediction contracts.
States like Arizona, Connecticut and Illinois are seeking to enforce gambling laws against prediction platforms. Earlier this month, a Nevada judge extended a ban preventing Kalshi from offering event-based contracts in the state, siding with regulators who argue the products amount to unlicensed gambling.
Magazine: How to fix suspected insider trading on Polymarket and Kalshi

US spot Bitcoin ETFs continued to attract fresh capital, extending a nine-day inflow run through April 24 as investors piled into core crypto exposure through regulated vehicles. SoSoValue’s tracking shows about $2.12 billion of net inflows over the April 14–24 window, with the strongest single-day performance on April 17, when inflows reached $663.91 million. Other notable sessions included April 14’s $411.50 million and April 22’s $335.82 million.
The momentum wasn’t universal across all funds. Friday’s activity was comparatively modest, with net inflows of $14.45 million. Among the individual managers, BlackRock’s IBIT led the session with $22.88 million in inflows, while Fidelity’s FBTC recorded outflows of $1.69 million. Bitwise’s BITB and ARK 21Shares’ ARKB also posted outflows of $8.85 million and $9.02 million, respectively, with other products largely flat. The overall streak marks the first nine-day run for spot BTC ETFs since a similar burst in October, when inflows surged on consecutive days, including $1.21 billion on Oct. 6 and $875.6 million on Oct. 7.
Bitcoin’s market backdrop has helped sustain the flow. BTC was trading around $77,516.55, up roughly 10.7% over the past month, according to CoinMarketCap. The confluence of rising prices and regulated access appears to be reinforcing investor conviction that these products offer a stable exposure channel for crypto exposure within traditional portfolios.
Key takeaways
- Spot BTC ETFs posted roughly $2.12 billion in net inflows over April 14–24, marking a nine-day streak driven by broad-based institutional demand.
- Single-day highs included $663.91 million on April 17, with other strong days on April 14 ($411.50 million) and April 22 ($335.82 million).
- Not all funds participated equally; some concentrates like BlackRock’s IBIT led the day, while Fidelity’s FBTC and others faced outflows or flat flows.
- Overall, 2026 cumulative net inflows through spot BTC ETFs reached about $58.23 billion, signaling persistent demand despite a price backdrop below recent peaks.
- Ether ETFs mirrored BTC momentum with a nine-day inflow streak, though the run paused on April 23 with a net outflow of $75.94 million.
Bitcoin ETF investors stay the course amid volatility
The sustained inflows into spot BTC ETFs—despite Bitcoin trading well below its October highs—underscore a shift toward longer-term positioning among institutional investors. In a social post, ETF analyst Nate Geraci characterized the pattern as evidence of “diamond hands” behavior, where buyers maintain exposure through drawdowns rather than reacting to near-term volatility. SoSoValue data corroborate a broader theme: ETF participants are treating these products as core allocations rather than tactical bets, reinforcing a structural layer of demand that can help stabilize flows during pullbacks.
The takeaway for traders and builders is that regulatory-compliant access channels continue to resonate with the market’s risk tolerance. The steady flow suggests participants view spot BTC ETFs as a credible, long-horizon mechanism to gain exposure to Bitcoin without directly holding the asset, which can matter for liquidity, price discovery, and risk budgeting in diversified portfolios.
Ethereum exposure climbs in step, then eases
US spot Ether ETFs mirrored the BTC momentum, recording nine consecutive days of net inflows from April 14 through April 22. The strongest session occurred on April 17, when Ether ETFs attracted $127.49 million. Other notable days included April 22 with $96.44 million and April 20 with $67.77 million. The streak ended on April 23, when funds logged net outflows of $75.94 million, marking a reversal after a robust run.
The broader ETH narrative continues to draw attention to Ethereum’s ecosystem exposure alongside BTC. While the BTC rally anchors the narrative, Ether-based products offer market participants a way to diversify crypto risk and participate in the broader smart-contract platform theme with regulated vehicles. The data indicate a protective appetite for ETH exposure during the streak, followed by a pullback that may reflect shifting demand or tactical rebalancing across funds.
Where this leaves investors and markets next
Overall, the period pushed cumulative 2026 inflows into the BTC ETF space to a sizable sum—roughly $58.23 billion, according to SoSoValue—highlighting a durable appetite for regulated crypto access. The juxtaposition of rising inflows against a still-substantial price gap from the all-time highs may indicate that investors view these products as stabilizing anchors for long-term crypto exposure, rather than merely chasing immediate price moves.
As for Ether, the nine-day inflow streak followed by a pause raises questions about the durability of ETH-related demand in the near term. Market participants will be watching for fresh data in early May to see whether inflows resume and how price dynamics for ETH influence further fund flows, particularly as Ethereum-related fundamentals and network activity continue to evolve.
Looking ahead, the key watchpoints will include how policymakers and regulators respond to evolving ETF structures, how primary-market flows interact with secondary-market liquidity, and whether next-month data reinforce the current pattern of steady, institutionally oriented capital entering spot crypto ETFs. For readers, the signal remains clear: regulated products are increasingly central to how major investors gain and manage crypto exposure, even as volatility persists.
Cointelegraph remains committed to transparent reporting and will continue tracking ETF inflows, price action, and regulatory developments to help readers gauge the evolving dynamics of crypto-market access.
Crypto World
XRP Short Squeeze Builds as Whales Pull Millions From Binance Amid Negative Funding Rate
TLDR:
- XRP funding rate on Binance hit -0.00292847, confirming short sellers are paying premiums to hold positions.
- Whale-to-exchange transactions spiked to 3,049, far above the 7-day average of 751 recorded on Binance.
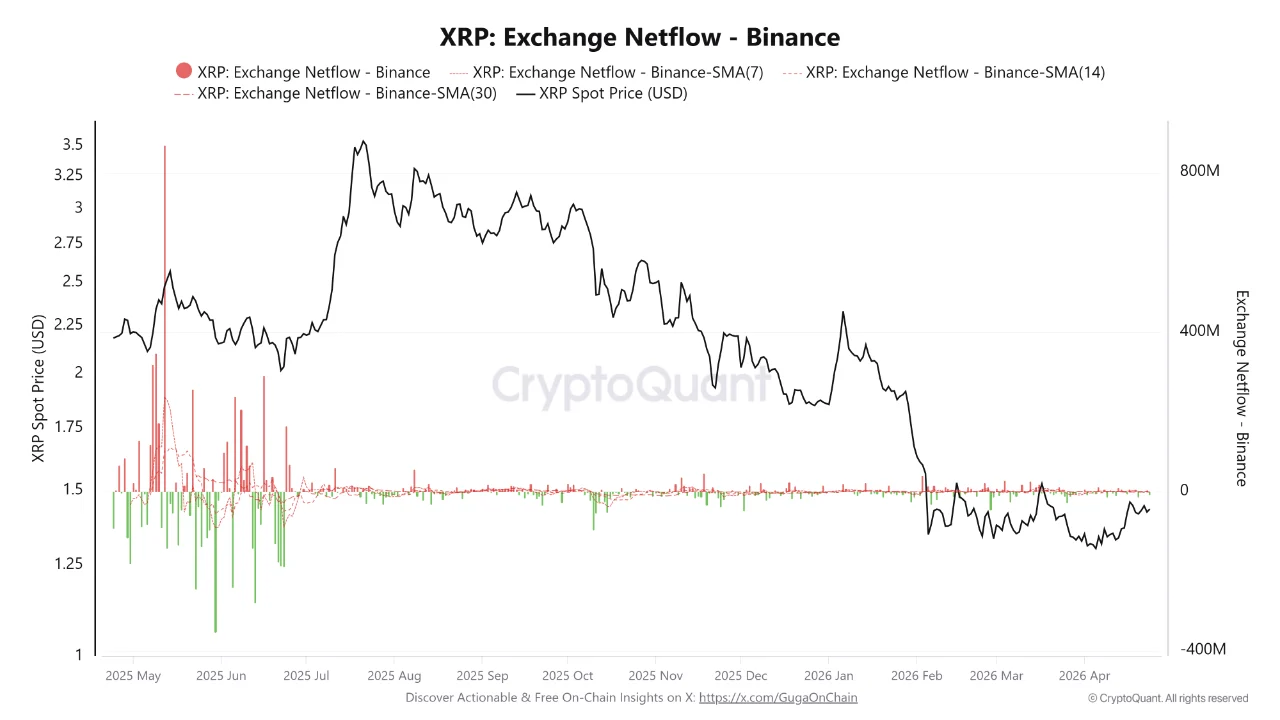
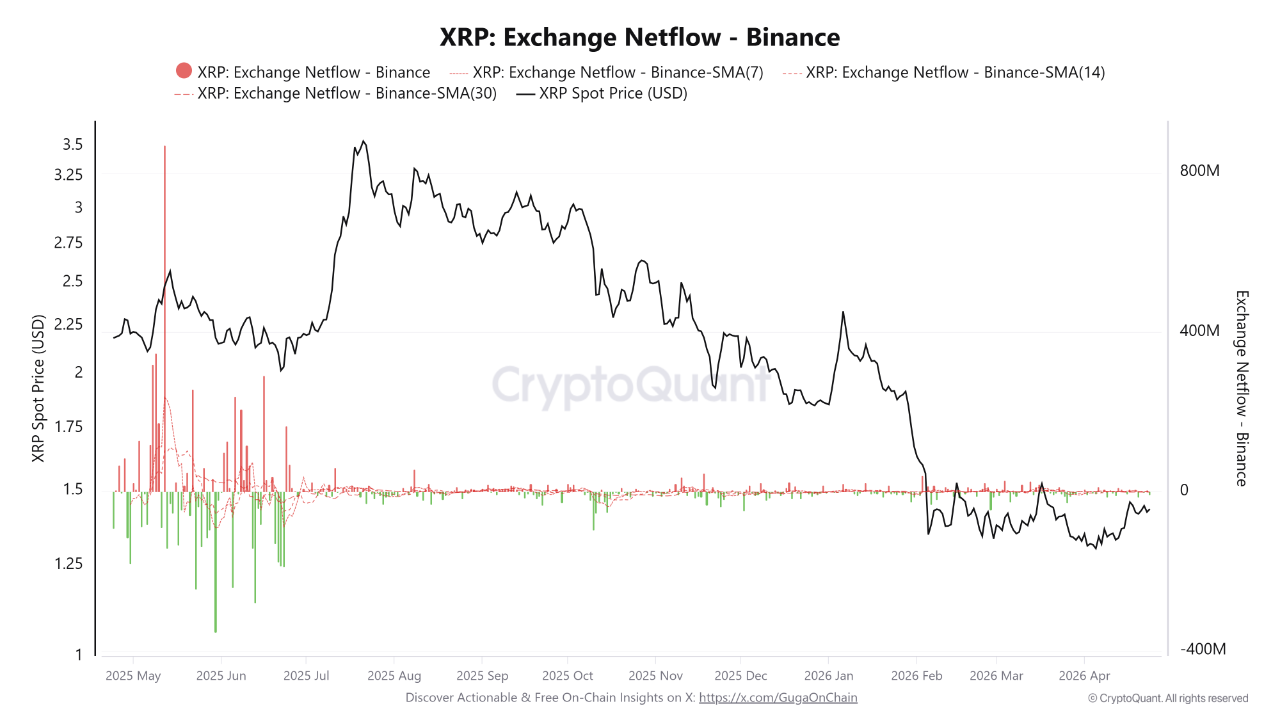
- XRP exchange netflow hit -7.79M in 24 hours, over six times the 30-day moving average of -1.15M XRP.
- The Speculation-to-Utility Ratio of 1.3827 shows real network demand backs XRP amid current bearish sentiment.
XRP derivatives data on Binance shows a sharp buildup of short positions as the asset trades near $1.4394. The funding rate has turned negative at -0.00292847, meaning sellers are paying premiums to hold their bets.
Meanwhile, the asset recorded a 3.34% weekly retraction. Exchange netflow data reveals that large players moved roughly 7.79 million XRP off Binance in 24 hours, far above the 30-day average outflow of 1.15 million XRP.
Derivatives Data Points to a Potential Short Squeeze
The bearish lean in XRP derivatives is clear from current Binance data. A negative funding rate means short traders are actively paying to keep their positions open. This dynamic often signals an overcrowded trade rather than a structural breakdown in price.
Adding to this picture, the Taker Buy-Sell Ratio sits at 0.9723, showing that sell-side pressure edges out buying activity.
However, an overcrowded short position can quickly reverse when price moves against sellers. That reversal mechanism is commonly known as a short squeeze.
Cryptoquant analyst GugaOnChain noted that “bets against XRP surge in Binance derivatives, but the magnitude of the institutional outflow signals accumulation.”
The comment came alongside on-chain data showing a spike in whale-to-exchange transactions. Those transactions, at 3,049 over the observed period, stood well above the 7-day average of 751.
When price breaks local resistance levels, short sellers face forced liquidations. Those liquidations push the price higher, triggering a cascade that accelerates the move upward. That mechanism, combined with current positioning, creates the setup the analyst described.
On-Chain Data Shows Consistent Network Utility Behind XRP
Beyond the derivatives market, on-chain settlement data offers a broader view of XRP’s activity. The network processed 298.15 million XRP in settlement volume during the period reviewed. That figure supports the idea that the ledger is seeing real transactional demand, not just speculative interest.
The Speculation-to-Utility Ratio currently stands at 1.3827. This reading suggests that while speculation is present, it does not vastly outpace actual network usage.
A ratio hovering near 1.38 shows the two sides remain relatively balanced. That balance helps sustain the network’s credibility during volatile price swings.
The 7.79 million XRP outflow from Binance stood dramatically above the 30-day moving average of 1.15 million XRP.
Outflows of this size typically reflect assets moving into cold storage or self-custody wallets. Large players generally do this when they intend to hold rather than sell in the near term.
Taken together, the on-chain data presents a different narrative from what the derivatives market suggests. While sentiment in futures markets leans bearish, the actual movement of XRP off exchanges points toward accumulation.
If spot demand picks up and price pushes past key resistance levels, the crowded short trade could unwind quickly.


The Commodity Futures Trading Commission sued New York to block the state from enforcing its gambling laws against federally registered prediction market exchanges.
The complaint filed in the Southern District of New York seeks a declaratory judgment confirming federal preemption, plus a permanent injunction barring state action against CFTC-registered designated contract markets.
Fourth State in CFTC’s Prediction Market Fight
New York joins Arizona, Connecticut, and Illinois on the agency’s docket. The CFTC sued the other three states earlier this month over parallel enforcement campaigns aimed at registered prediction market venues.
A federal judge in Arizona granted the agency a temporary restraining order halting that state’s criminal case against CFTC-regulated platforms. The CFTC has also filed an amicus brief in the Ninth Circuit Court of Appeals defending its preemption argument before appellate judges.
New York’s regulators previously hit registered platforms with cease-and-desist letters and civil suits. Chairman Michael Selig accused the state of disregarding longstanding federal precedent by treating CFTC-listed event contracts as illegal gambling products subject to state licensure rules.
Massachusetts Amicus Filed Same Day
The agency simultaneously filed an amicus brief in the Massachusetts Supreme Judicial Court in Commonwealth of Massachusetts v. KalshiEx LLC. Attorney General Andrea Campbell previously secured a preliminary injunction blocking Kalshi from offering sports event contracts to Massachusetts customers.
The brief argues the Commodity Exchange Act preempts state laws applied to CFTC-regulated markets. Selig said Congress assigned the agency sole authority over commodity derivatives, prediction markets included.
Kalshi recently prevailed at the Third Circuit Court of Appeals in a parallel New Jersey case, strengthening the federal preemption argument. Kalshi and Polymarket together face more than a dozen state and tribal challenges over sports and political event contracts.
Trading Climbs as Prediction Markets Go Mainstream
Trading activity on both platforms has climbed through early 2026, with sports event contracts emerging as the central flashpoint between state and federal authorities. Google Finance recently integrated Kalshi and Polymarket odds data, pulling prediction market pricing further into mainstream financial coverage.
Federal courts in New York and Massachusetts will now rule on whether the Exchange Act blocks state gambling claims. Their decisions, alongside the CFTC’s Ninth Circuit amicus and the Arizona restraining order, could shape national rules for a fast-growing industry that operates across every state.
The post Federal Agency Sues New York Over Prediction Market Ban appeared first on BeInCrypto.

Key Highlights
- Chainlink’s Data Standard is now accessible via Amazon Web Services Marketplace, providing enterprises with streamlined blockchain integration capabilities.
- The platform offers three core solutions: Data Feeds, Data Streams, and Proof of Reserve for diverse use cases.
- Simon Goldberg from AWS highlighted how the partnership enables developers to leverage standard AWS infrastructure for smart contract development.
- Market analyst Crypto Patel identified the AWS partnership as a significant driver, questioning whether LINK might surge from $9 to $100.
- LINK maintains position above critical moving averages around $9.20, facing immediate resistance at $9.70 followed by $10.07.
Chainlink has successfully deployed its Data Standard on Amazon Web Services (AWS) Marketplace. This strategic expansion provides enterprise developers and financial institutions with streamlined access to blockchain connectivity through AWS’s established infrastructure.
The marketplace now features three distinct Chainlink solutions: Data Feeds, Data Streams, and Proof of Reserve.
Data Feeds furnishes decentralized pricing and market intelligence aggregated from numerous independent sources. This service powers valuation processes, settlement operations, and comprehensive risk assessment frameworks.
Data Streams delivers ultra-fast, minimal-latency information designed for time-sensitive applications. The technology underpins on-chain financial instruments including perpetual futures contracts, options markets, and rapid-execution trading platforms.
Proof of Reserve enables transparent on-chain authentication of collateral supporting stablecoins and tokenized physical assets. This functionality empowers issuers to enhance credibility and streamline token creation workflows.
Simon Goldberg, serving as AWS’s web3 specialist solutions architect, articulated the partnership’s strategic value. “Chainlink’s oracle infrastructure extends these capabilities by providing secure, bidirectional connectivity between AWS resources and smart contracts deployed on blockchain networks,” he stated.
Goldberg emphasized that this collaboration empowers developers to utilize established AWS frameworks while constructing applications interfacing with tokenized assets and blockchain-based contracts.
Addressing the Oracle Challenge
Chainlink outlined a fundamental limitation in blockchain technology referred to as the “oracle problem.” Smart contract platforms lack inherent ability to retrieve off-chain information, creating barriers for tokenization initiatives. Chainlink’s decentralized oracle infrastructure addresses this critical gap.
The AWS integration links compute resources, storage systems, databases, and API services directly to blockchain smart contracts. This architecture enables organizations to develop hybrid solutions operating seamlessly across conventional cloud infrastructure and distributed ledger networks.
Chainlink also acknowledged intensifying competition within the oracle sector. Pyth recently established a partnership with prediction platform Kalshi. Concurrently, major financial data providers including FTSE Russell, Deutsche Börse, S&P Global, and Coinbase have committed to supplying information through Chainlink’s DataLink infrastructure.
LINK Price Maintains Critical Technical Levels
From a technical perspective, LINK is positioned above both the 20-day and 50-day exponential moving averages, converging around the $9.20 zone. The Relative Strength Index registers approximately 54, while Stochastic indicators hover near 59, suggesting moderate upward pressure.
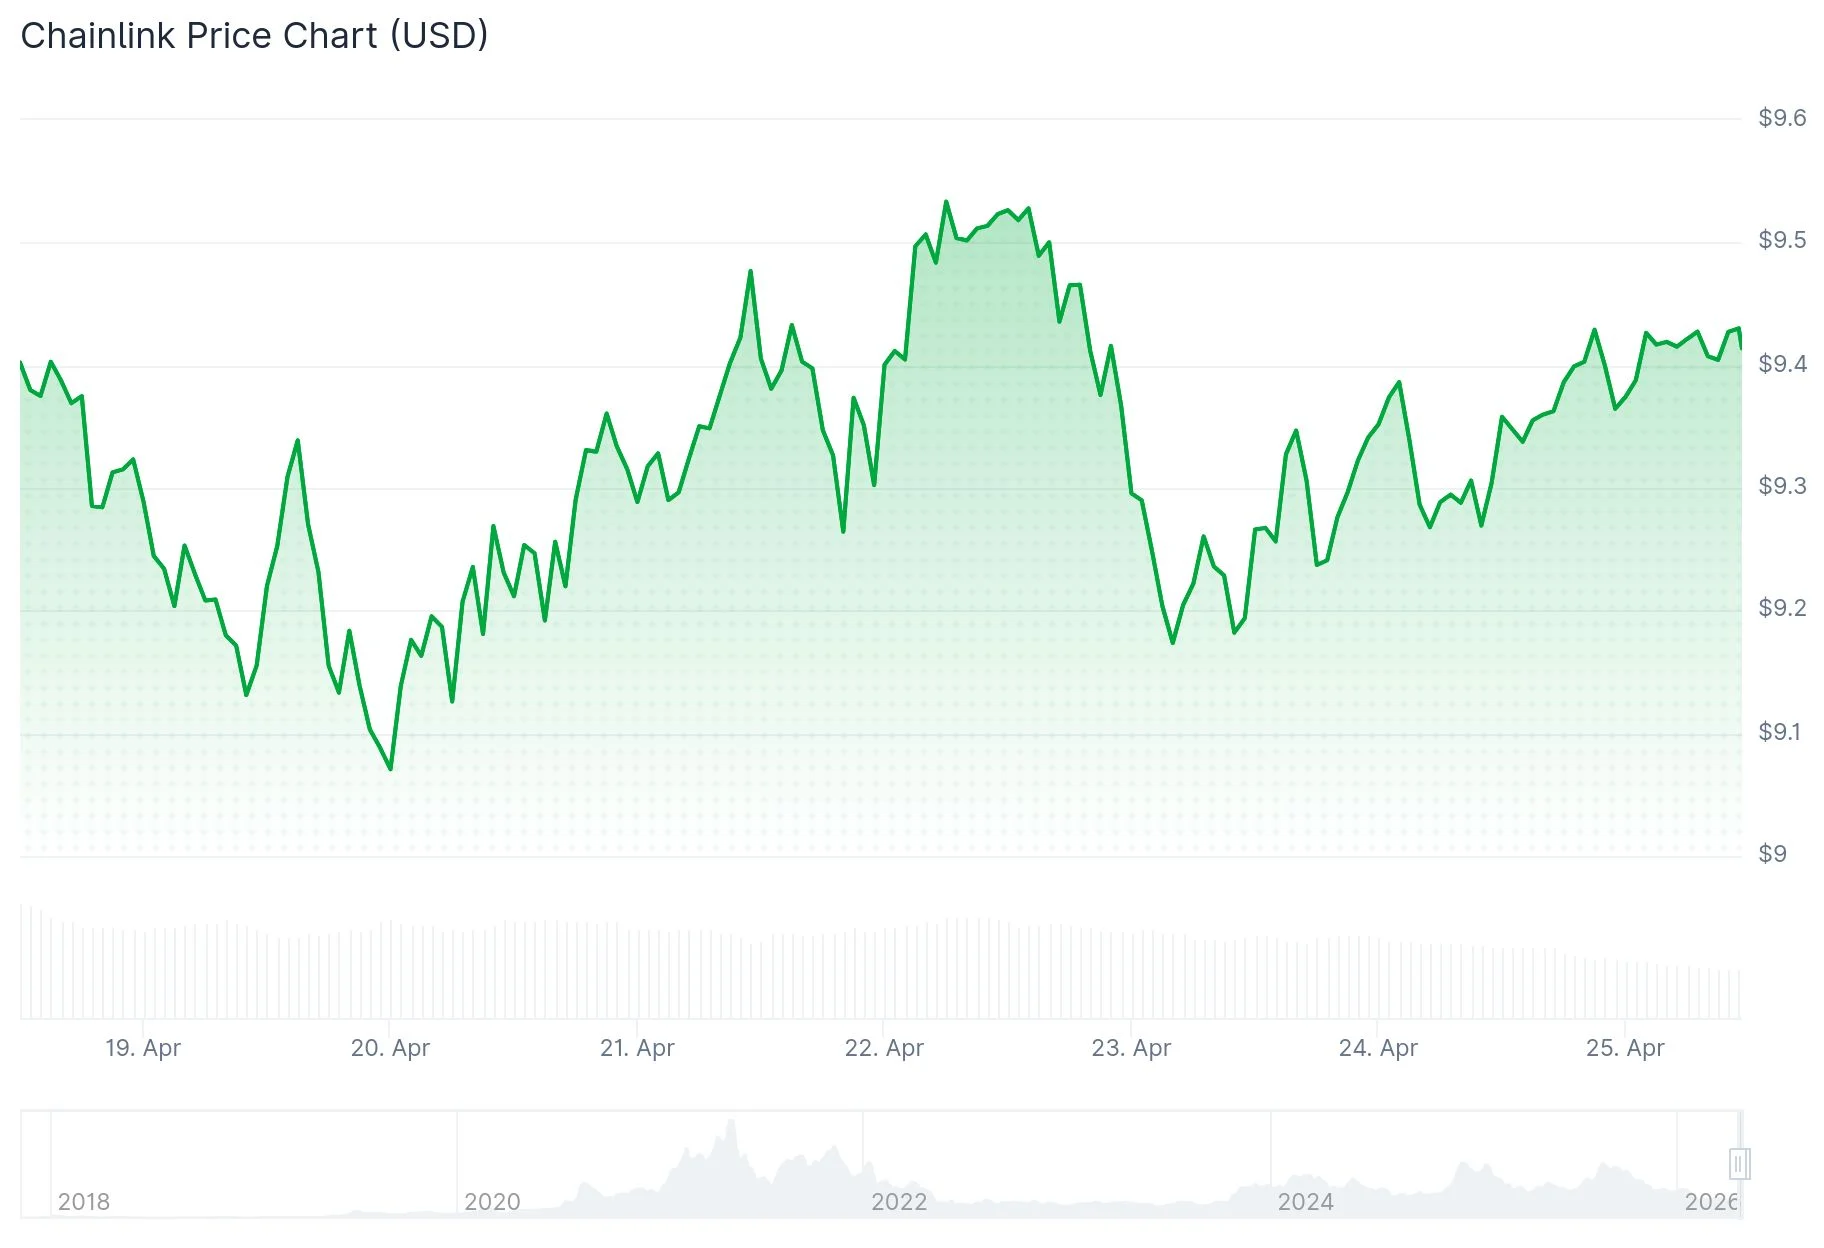
Immediate resistance emerges at $9.70, with secondary resistance at the 100-day EMA positioned at $10.07. A sustained close above $10.07 could trigger momentum toward $11.16.
Downside support remains established at the $9.12 trendline. Failure to maintain this level would likely test $8.55, with further support at $8.18.
Cryptocurrency analyst Crypto Patel questioned on social platform X whether LINK might rally from current $9 levels to $100, characterizing the AWS collaboration as “the catalyst nobody was watching.”
Currently, LINK trades just above the $9.20 support zone with immediate resistance established at $9.70.
Crypto World
eBay (EBAY) Stock Tumbles 5.3% Following Office Closure, Downgrades, and $18M Insider Sales

Key Takeaways
- eBay shares declined 5.3% to $97.94 during trading on April 24, 2026
- The e-commerce giant announced plans to shutter its San Francisco headquarters and reduce workforce
- Management is pivoting back to its primary resale business while deepening Depop integration
- Multiple Wall Street analysts shifted their ratings to Hold prior to the upcoming earnings release
- Company executives offloaded $18.4M worth of shares in the last three months without any purchases
eBay experienced a challenging trading session on Thursday. Shares tumbled 5.3% to close at $97.94, despite the company recently delivering strong quarterly performance and announcing a dividend increase.
What caused the sudden investor concern?
The primary catalyst was eBay’s announcement regarding the closure of its San Francisco headquarters along with planned workforce reductions. Management is realigning its strategy to concentrate on the company’s traditional resale marketplace while accelerating the integration of Depop, its secondhand fashion subsidiary.
Restructuring initiatives typically involve significant expenses — and markets generally react negatively to uncertainties surrounding employee layoffs and potential real estate impairments, regardless of whether the strategic rationale is sound.
The decline wasn’t occurring in isolation. Shares had experienced substantial appreciation before Thursday’s pullback, with year-to-date returns hovering around 19% entering the session. A portion of the selling pressure appears attributable to profit-taking following the stock’s impressive run.
Wall Street Turns Cautious Before Earnings
Investor sentiment took another hit from the analyst community. Multiple Wall Street firms downgraded EBAY to Hold ratings in advance of next week’s earnings announcement. This represents a subtle signal that analysts believe much of the upside has been realized.
At the current price of $97.94, shares are trading 36% above GuruFocus’s GF Value estimate of $71.84, indicating potential overvaluation. The present P/E ratio of 22.5x represents approximately 43% expansion compared to the five-year median of 15.8x. This valuation premium offers limited margin for disappointment.
The GF Score remains solid at 86 out of 100, supported by a robust profitability rank of 8/10 and an exceptional momentum rank of 10/10. However, the valuation rank stands at only 5/10, while financial strength registers 6/10.
Executive Stock Sales Raise Eyebrows
One development that’s particularly difficult to overlook: company insiders divested approximately $18.4 million in EBAY shares during the previous three months, with no insider purchases recorded.
Insider selling alone doesn’t necessarily signal trouble — executives have personal financial obligations and compensation packages to manage. However, when combined with analyst downgrades, a restructuring initiative, and shares trading substantially above calculated fair value, it creates a confluence of factors that heightens investor caution.
The 52-week trading range for EBAY extends from $65.00 to $107.34. At $97.94, shares remain positioned near the upper end of that range despite Thursday’s selloff.
eBay certainly has positive factors in play — a recently announced dividend boost, solid profitability indicators, and a restructuring strategy that could enhance operational efficiency over time. Yet the market appears to be questioning whether the stock’s recent valuation already reflects these positives.
Next week’s earnings announcement will serve as the next critical checkpoint. Investors will scrutinize any guidance regarding restructuring timelines, workforce figures, and progress on Depop integration efforts.
Shares concluded trading on April 24 at $97.94, representing a 5.28% decline for the session.

Key Highlights
- Shares climbed 11.12% on Friday, finishing at $148.85
- Q2 fiscal 2026 results scheduled for April 29 post-market; expected revenue between $10.2B and $11B
- Worldwide semiconductor market reached $88.8B in February, representing 61.8% annual growth
- Company authorized $20B stock repurchase program; quarterly payout increased to $0.92 per share
- Wall Street consensus stands at Hold with $158.25 mean target price
Shares of Qualcomm (QCOM) soared 11.12% during Friday’s trading session, finishing at $148.85. The sharp upward movement reflects investor anticipation surrounding the chipmaker’s upcoming Q2 fiscal 2026 financial results, scheduled for release after the closing bell on April 29.
The impressive single-day gain brings renewed attention to QCOM following a challenging year-to-date performance. Despite Friday’s surge, shares remain approximately 13% lower since the beginning of 2026, trading between a 52-week range of $121.99 and $205.95.
Management has provided Q2 revenue guidance ranging from $10.2B to $11B. This projection represents a sequential change of flat to down 7% when compared against the $10.98B reported during the comparable quarter last year. GAAP diluted earnings per share are forecast between $1.69 and $1.89, compared to $2.52 in the prior-year period.
Options market activity Friday showed significant bullish sentiment. Approximately 120,444 call contracts changed hands — representing a surge of roughly 165% above typical daily volume — indicating strong optimistic positioning as the earnings announcement nears.
Industry-Wide Chip Strength Provides Momentum
Friday’s rally benefited from positive momentum across the broader semiconductor industry. Data released by the Semiconductor Industry Association revealed global chip sales reached $88.8B during February, marking a substantial 61.8% increase from $54.9B in the year-ago period and a 7.6% sequential gain from January 2026.
SIA President John Neuffer attributed the robust performance to strong demand across Asia-Pacific markets, the Americas, and China. Industry projections suggest worldwide annual semiconductor sales could approach approximately $1 trillion during the current year.
Qualcomm’s strategic focus on “AI at the edge” technology has captured increased investor attention recently. Market participants view the company as well-positioned to capitalize on artificial intelligence-related demand beyond its core smartphone chip business.
However, challenges persist. Several Wall Street firms have identified concerns including softening smartphone demand, elevated memory component pricing, and limited near-term growth catalysts within the handset segment. Morgan Stanley maintains an underweight stance with a $132 price objective, while Sanford C. Bernstein rates shares at market perform with a $140 target.
Conversely, more optimistic analysts include Piper Sandler with an overweight rating and $200 target, alongside Rosenblatt which holds a buy recommendation with a recently adjusted $190 price objective.
Capital Return Initiatives
Last month, Qualcomm’s board of directors approved a substantial $20B share repurchase authorization — representing approximately 14.5% of currently outstanding shares. Additionally, the company elevated its quarterly dividend payment from $0.89 to $0.92 per share, payable on June 25 to shareholders of record as of June 4. The increased payout translates to an annualized dividend of $3.68, yielding approximately 2.5%.
During the first quarter, Qualcomm delivered earnings per share of $3.50, surpassing analyst expectations of $3.38. Revenue totaled $12.25B, slightly exceeding the $12.16B consensus forecast. The company’s return on equity metric registered at 44.09%.
Institutional investors control 74.35% of outstanding shares. Concurrent Investment Advisors expanded its position by 66.2% during Q4, acquiring an additional 35,166 shares to bring total holdings to 88,257.
Regarding insider transactions, two executive vice presidents disposed of a combined 6,533 shares in early February at prices ranging between $137 and $137.65. Over the trailing three-month period, insider selling totaled 9,118 shares valued at approximately $1.23M.
Analyst consensus currently stands at Hold, with a mean price target of $158.25. Q2 earnings per share guidance has been established between $2.45 and $2.65.


Something important happened in Belgium earlier this year. KBC, the country’s largest bank-insurance group, switched on regulated Bitcoin and Ether trading for retail investors through Bolero, its self-directed brokerage platform.
What matters is not only that a major European bank enabled access to digital assets. It is how that access was introduced: within an existing regulated platform, inside an established client journey, and as part of the broader financial environment customers already use.
That model says a great deal about where the market is heading.
The first era of bank-distributed digital assets was ring-fenced
For the better part of a decade, banks that touched digital assets did so at arm’s length. In many cases, that approach made sense. Digital assets raised difficult questions around custody, governance, compliance, suitability and operational resilience. Regulatory fragmentation across Europe only added to the hesitation.
As a result, digital assets were often treated as adjacent to core banking rather than part of it.
That equation is now changing. Across Europe, institutions are increasingly evaluating digital assets not as a separate category requiring a distinct commercial and operational stack, but as capabilities that may ultimately need to sit within the same control environment as other financial products and services. That shift remains uneven, and institutions are moving at different speeds. But the strategic direction is becoming clearer.
MiCA is the catalyst
The Markets in Crypto-Assets Regulation, or MiCA, has not removed every challenge, nor has it made adoption automatic. But it has helped narrow one of the biggest sources of hesitation for financial institutions: where do digital assets belong operationally?
Before MiCA, offering digital asset services meant navigating a patchwork of national regimes, each with different licensing requirements, custody rules and consumer protection standards. The compliance cost of building a standalone digital asset offering was difficult to justify for a bank already running a profitable brokerage business.
MiCA collapsed that complexity into a single, passportable framework. For the first time, a bank in Belgium, Spain, Germany or France could offer digital asset trading under the same regulatory logic it already applied to securities. The operational question shifted from “should we build a digital asset product?” to “should we add digital assets to the product we already have?” Sparking a fundamentally different conversation, which European banks are answering with remarkable speed.
The pattern is already visible
Look at who has moved in the past twelve months. BBVA went live in Spain. DZ Bank, Germany’s largest cooperative banking group, followed. Société Générale built its digital asset infrastructure through its Forge subsidiary. And now KBC in Belgium.
They are among Europe’s most stringent financial institutions, and they are all arriving at the same architectural conclusion: digital assets belong in the existing stack, not alongside it.
They plugged digital asset capabilities into their existing compliance, reporting and client-facing systems. From the customer’s perspective, buying Bitcoin feels identical to buying a stock. From the bank’s perspective, it runs through the same operational rails. That is the whole point.
Why this changes market structure
First, trust shifts. European banks collectively serve hundreds of millions of retail clients who already have brokerage accounts, verified identities and established banking relationships. When digital assets arrive inside that envelope, the addressable market expands overnight without a single new user signing up for a new platform.
The scale of that opportunity is significant. In the European Union, digital asset ownership is expected to reach around 25% by 2030, up from 9% in 2024 and 4% in 2020. That expansion is being driven in large part by MiCA and by the growing number of bank-led digital asset projects expected to mature over the coming cycle. Banks that move now are positioning themselves to capture that wave through channels they already control.
Second, the customer relationship stays with the bank. In the standalone model, the crypto exchange owns the client. In the embedded model, the bank does. That distinction matters enormously for product development, cross-selling and long-term economics. A bank that offers digital assets alongside equities can eventually offer tokenized bonds, structured products, and digital asset wealth management, all within the same relationship.
Third, the scope expands beyond trading. The same absorption pattern is appearing in payments and settlements. Bloomberg Intelligence estimates stablecoins could account for more than $50 trillion in annual payments by 2030. The question is who will issue and distribute them. As banks begin issuing tokenized deposits and integrating stablecoin capabilities into their payment rails, the competitive dynamics of digital payments shift from “banks versus blockchain” to “which banks move first.”
The real question is not technological but distributional
If this pattern holds, the competitive landscape that emerges will not look like the one crypto was built around. It will not be defined by exchange volumes or token listings. It will be defined by which institutions can offer digital assets as seamlessly as they offer any other financial product, across trading, payments and custody, and which can do so at production scale, not pilot scale.
Some of that capability will be built in-house. Much of it will be acquired. The M&A pattern is already forming: banks that recognize they cannot build fast enough are buying or partnering to acquire digital asset infrastructure, just as they have historically done with market data, settlement and risk systems.
The real shift is distributional. Once digital assets move through bank platforms, the addressable market changes permanently. MiCA made that architecturally possible. The banks are now making it real. The industry should be paying closer attention.

Key Takeaways
- Trade Desk shares climbed approximately 6% following CEO Jeff Green’s $150 million stock acquisition
- March saw short interest in TTD surge by 50%, elevating short squeeze potential
- Despite Friday’s rally, shares remain down 40% year-to-date through 2026
- Decline attributed to weakening online advertising revenue and AI-driven “zero-click search” trends
- S3 Partners identified TTD as experiencing its first short squeeze warning in more than 12 months
Trade Desk shares soared close to 6% during Friday’s trading session, fueled by two significant developments that captured investor attention.
Chief Executive Jeff Green executed a substantial $150 million insider stock purchase. This sizable commitment from company leadership sent a powerful signal to market participants.
Simultaneously, analytics provider S3 Partners identified Trade Desk as confronting its first meaningful short squeeze threat in more than a year. The stock’s short interest exploded by 50% during March.
The dynamics are clear. TTD has emerged as one of technology’s most heavily targeted short positions this year, tumbling 40% from January levels. Such a steep decline, coupled with mounting short interest, establishes ideal squeeze conditions.
Short squeezes materialize when a depressed stock begins climbing. Short sellers, who generate profits from declining prices, must repurchase shares to limit their losses. These forced purchases drive prices higher still.
S3’s research director Leon Gross noted in Thursday’s blog analysis that Trade Desk’s short squeeze indicator has reached critical “flashing red” territory.
The Forces Behind TTD’s 2026 Decline
The stock’s challenging performance centers on a primary issue: decelerating digital advertising revenue.
Artificial intelligence platforms like ChatGPT have intensified what industry experts term “zero-click search.” Consumers receive direct answers from AI systems without navigating to websites. Reduced traffic translates to diminished ad inventory. This presents significant challenges for advertising technology companies.
These concerns prompted traders to establish substantial bearish positions against TTD, accumulating the short interest that currently exposes the stock to squeeze dynamics.
Meanwhile, enthusiasm is emerging around Trade Desk’s AI-enhanced Kokai platform. The company’s earnings announcement is scheduled for May 7, prompting some traders to establish positions ahead of the release.
TTD’s Position Within Current Market Dynamics
Broader equity markets have experienced robust gains throughout April. The Nasdaq Composite has advanced more than 1.6% while the S&P 500 has reached new all-time peaks, supported by a relief rally following the U.S.-Iran ceasefire agreement.
This favorable risk appetite has made numerous oversold, heavily shorted equities appealing to traders seeking momentum opportunities.
Trade Desk isn’t the only name on S3’s radar. Charter Communications and Paramount Skydance also display heightened squeeze indicators.
The most dramatic squeeze of 2026 occurred with Avis Budget Group, which rocketed 427% between late March and Tuesday’s session close. It subsequently plunged 68% as investors anticipated a dilutive equity issuance.
TTD’s present market capitalization stands at $10.77 billion. With average daily trading volume approaching 20 million shares, the stock possesses sufficient liquidity for a squeeze to accelerate rapidly should it materialize.
Green’s $150 million acquisition remains the dominant narrative. Insider purchases of this magnitude are uncommon and typically generate swift sentiment shifts.
The stock’s technical sentiment indicator continues showing a sell rating, based on TipRanks analytics. This assessment reflects the extended downtrend rather than Friday’s upward movement.
Trade Desk will announce quarterly results on May 7.
TLDR:
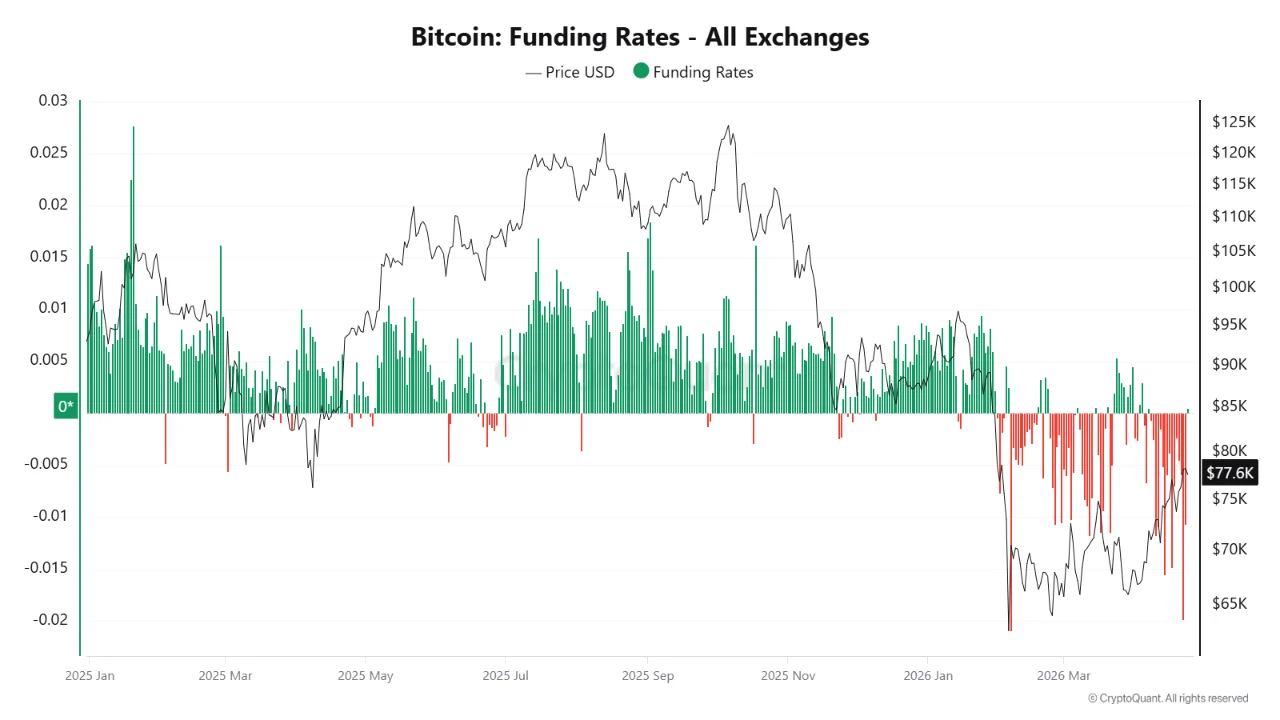
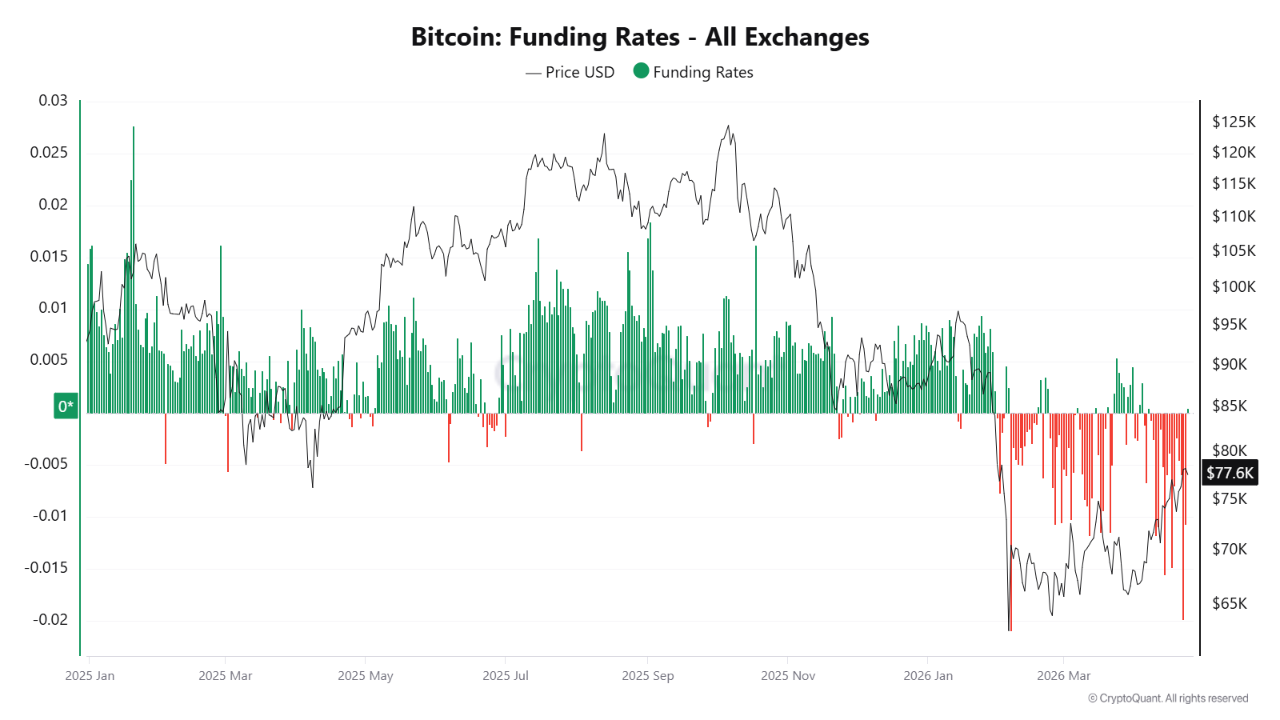
- Bitcoin funding rates have dropped into deeply negative territory, showing strong bearish conviction among traders.
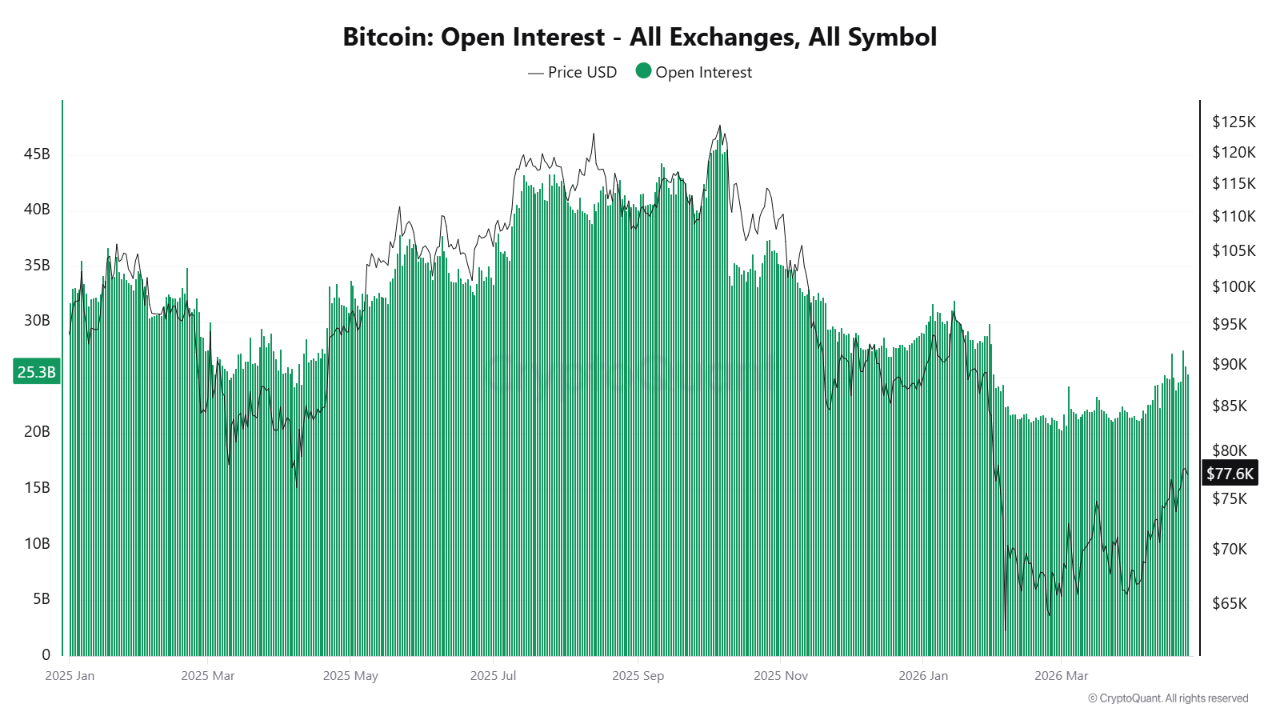
- Rising open interest confirms more capital is entering the market, with the majority positioned on the short side.
- Heavily crowded short trades create structural fragility, making the market vulnerable to a sudden sharp reversal.
- Historical data shows deeply negative funding paired with rising open interest often precedes a strong upward price move.
Bitcoin derivatives data is flashing a warning signal that seasoned traders rarely ignore. Funding rates have fallen sharply into negative territory while open interest continues to climb.
Together, these two indicators paint a picture of a market that is heavily positioned toward the downside. The combination raises the possibility of a violent reversal if price momentum shifts.
Negative Funding Rates Reveal Heavy Bearish Conviction in the Market
Bitcoin funding rates have dropped into deeply negative territory across major derivatives exchanges. This means short sellers are currently paying a premium to keep their positions open. The market is not simply leaning bearish — traders are committing real cost to maintain that stance.
CryptoQuant analyst G a a h drew attention to this development through on-chain data. According to the analyst, the depth of negative funding reflects strong confidence among bearish participants. That level of conviction is notable because it often appears near market turning points.
Negative funding alone does not signal a reversal. However, when it reaches extreme levels, history shows that the setup tends to become unstable. The cost of holding short positions builds over time, creating pressure to close those trades.
As short sellers face mounting costs, even a modest price increase can trigger a wave of forced buying. That buying pushes prices higher, which in turn forces more shorts to cover. This chain reaction is what traders refer to as a short squeeze.
Rising Open Interest Adds Pressure to an Already Crowded Short Trade
Open interest in Bitcoin futures is rising at the same time funding rates are falling. This means more capital is flowing into the market through new positions. Since funding is negative, the bulk of that capital is entering on the short side.
This creates a structurally fragile setup. A large number of traders are betting on further price declines, and they are all sitting in the same direction. When a trade becomes too crowded, it becomes vulnerable to sharp and sudden reversals.
The rise in open interest is not a bearish signal on its own. It simply reflects that more active bets are in play. The direction of those bets, confirmed by negative funding, is what defines the current market condition.
Historically, periods where both open interest rises and funding turns deeply negative have preceded sharp upward price movements.
That pattern does not guarantee a rally. Rather, it points to a market that has built up enough tension to produce a large move in either direction, with upside being the more likely path of least resistance for short-side pressure.

Michael Jackson Is the King of the Box Office in Record-Breaking Box Office Debut

How The Iran War Threatens Diplomacy & Democracy

Aston Villa falls to Fulham, missing chance to move up Premier League table
Manchester United reach agreement with Casemiro over contract clause amid transfer speculation

US brings back mandatory military draft registration

Steven Gerrard disagrees with Gary Neville over ‘shock’ Chelsea and Arsenal claim | Football


-

 Business6 days ago
Powerball Result April 18, 2026: No Jackpot Winner in Powerball Draw: $75 Million Rolls Over
-

 Politics6 days ago
Zack Polanski demands ‘council homes not luxury flats for foreign investors’
-

 Fashion21 hours ago
Weekend Open Thread – Corporette.com
-
Entertainment6 days ago
NBA Analyst Charles Barkley Chimes in on Ice Spice McDonald’s Fiasco
-

 Tech7 days ago
Auto Enthusiast Scores Running Tesla Model 3 for Two Grand and Turns It Into Bare-Bones Go-Kart
-

 Politics5 days ago
Gary Stevenson delivers timely reminder to register to vote as deadline TODAY
-

 Politics3 days ago
Making troops accountable for war crimes threatens US alliance, ex-SAS colonel warns
-

 Business3 days ago
Rolls-Royce Voted UK’s Most Iconic Trade Mark as IPO Register Hits 150
-

 Politics3 days ago
Disabled people challenge government SEND proposals over segregation concerns
-
 Crypto World5 days ago
Bank of Hawai’i (BOH) Q1 2026: Net Income Drops to $57.4M as Net Interest Margin Expands
-

 Politics3 days ago
Zack Polanski responds to home secretary’s taser threat
-
Politics3 days ago
Wings Over Scotland | How To Get Away With Crimes
-

 Politics3 days ago
Starmer handler McSweeney to be dragged from shadows by Foreign Affairs Committee
-
Crypto World7 days ago
Kelp DAO rsETH Bridge Hack Drains $292M as DeFi Losses Top $600M in Two Weeks
-

 Politics3 days ago
‘Iran is still a nuclear threat’
-
 Crypto World4 days ago
Five Value Stocks with Recovery Potential in 2026: PayPal (PYPL), Nike (NKE), and More
-

 Crypto World4 days ago
New York sues Coinbase, Gemini over prediction market offerings
-

 Business3 days ago
The Job Benefits Most Men Don’t Know to Negotiate
-

 Crypto World1 day ago
Michael Saylor says BTC winter is over. Market analyst disagrees, says bitcoin was in a pullback
-

 Politics6 days ago
Reform investigating candidate who ‘hates’ the NHS
You must be logged in to post a comment Login