

Crypto World
Brian Armstrong Admits Bitcoin Didn’t Deliver Satoshi’s Vision, Something Else Did

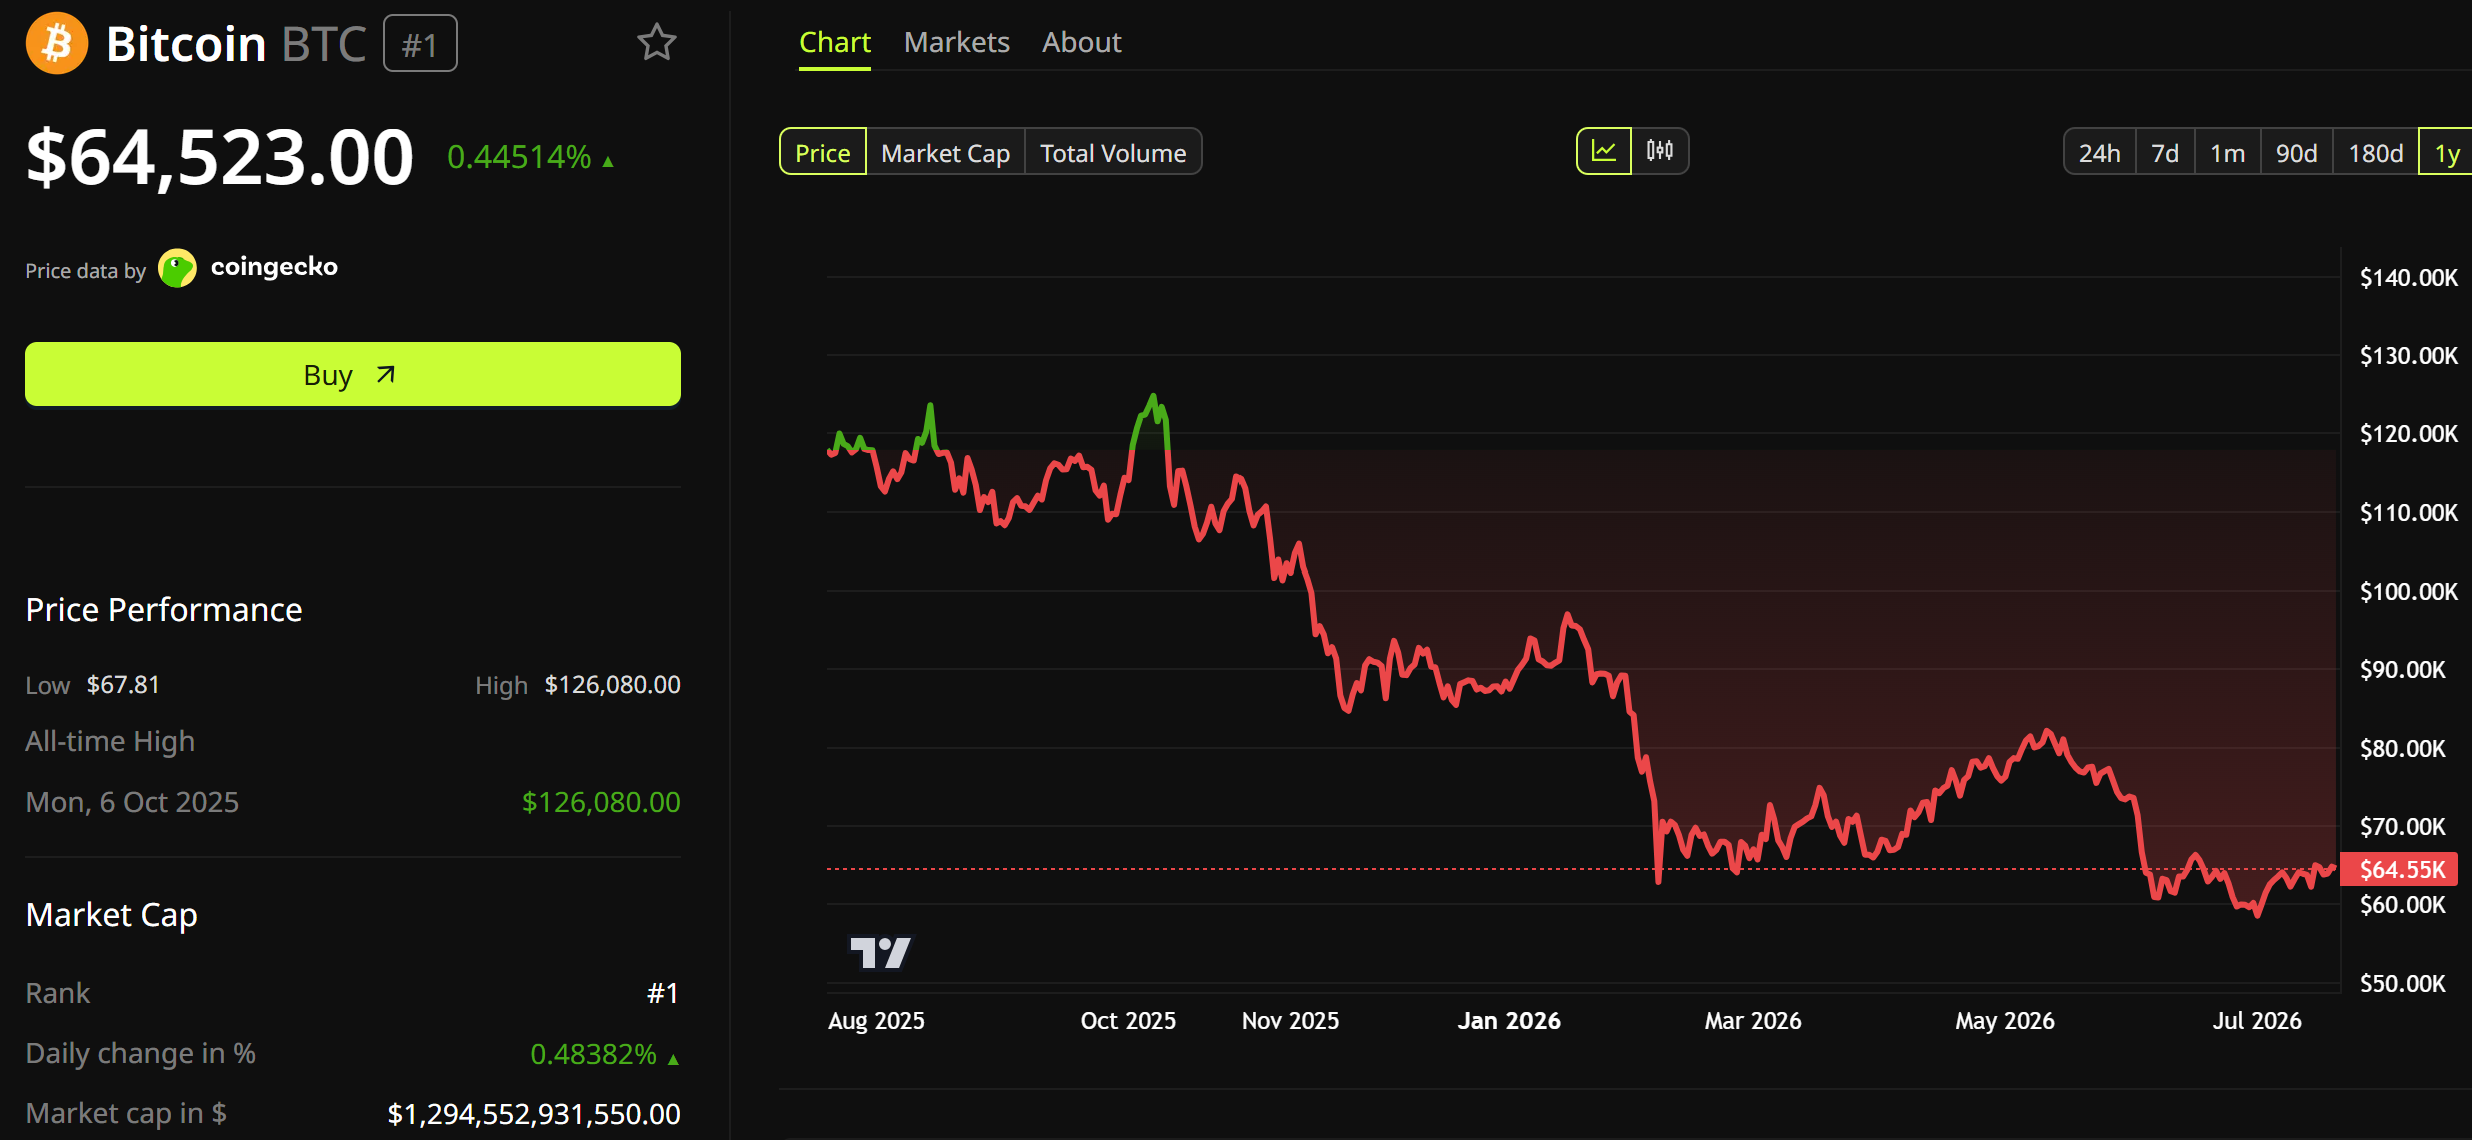
Coinbase CEO Brian Armstrong says Bitcoin did not live up to Satoshi Nakamoto’s vision of everyday digital money. It became digital gold instead. Stablecoins took over the payments job, he argues.
Bitcoin (BTC) sits near $64,523, down about 45% from its October 2025 peak of $126,080. Stablecoins are moving the other way, with supply near record highs.

Armstrong Rethinks Bitcoin’s Original Role
Armstrong made the call in an interview with Zerodha co-founder Nikhil Kamath on the People by WTF podcast. Kamath is a self-declared crypto skeptic. He asked the Coinbase boss a simple question. Does Bitcoin still do what it was built for?
“You’re right, I think it’s fair to say at this point that Bitcoin has succeeded as a store of value, and I don’t think it has become a medium of exchange,” Armstrong responded.
Follow us on X to get the latest news as it happens
Why Bitcoin Drifted From Satoshi’s Vision
Nakamoto’s 2008 whitepaper promised cash that moves online without banks. Bitcoin’s first block even carried a 2009 headline about UK bank bailouts. That was the mission.
Seventeen years on, Armstrong says the payments dream never landed. Fixes came and went.
“There’s people who have tried to make that happen with the Lightning Network, was an optimisation layer on top of Bitcoin, but it never really took off.”
The bigger problem sits in Bitcoin’s own design. Supply is capped, so holders hoard it like gold.
Armstrong said “people think it’s going to be worth more in the future, so they don’t really want to spend it right now.” Volatility makes it worse, he added.
Stablecoins Take Over the Payments Role
Stablecoins filled the gap. These dollar-backed tokens now do the boring job of money, even as banks defend their old rails.
“So we’ve actually seen massive growth of stablecoins running on blockchains. Fiat-backed stablecoins as the medium of exchange and Bitcoin has remained the store value as digital gold.”
The numbers agree. DefiLlama data shows stablecoin supply near $310 billion. Tether’s USDT holds $184 billion, and Circle’s USDC adds $73 billion.

Armstrong also credits the GENIUS Act, signed in July 2025, for making the tokens legal and trusted in the US. Much of that activity now runs on Base and Solana.
Still, Armstrong sees no failure here. In his view, Bitcoin simply found a different job.
“I think the Bitcoin chain is okay with that. They’re not intending it to be used for high volume payments. They’re digital gold.”
The post Brian Armstrong Admits Bitcoin Didn’t Deliver Satoshi’s Vision, Something Else Did appeared first on BeInCrypto.



The boom in glucagon-like peptide-1s for weight loss has led some people to seek out other peptides in the hope that they too will have health benefits.
However, because these alternative compounds aren’t approved for medical use, you can’t acquire them with a prescription and a trip to Walgreens; people instead are turning to gray and black market sources to purchase them.
These sources, often online, tend to not be serviced by traditional payment processors, and so, according to a report from Bloomberg, these sites and the consumers who use them have turned to cryptocurrency to solve their payment needs.
Read more: Russian darknet marketplace launches memecoin on Solana
These research compounds, which are often marketed with health benefits like weight loss or longevity, are generally considered research chemicals and aren’t meant to be used for medicinal use.
According to data from Chainalysis, the annual run rate for crypto spent on gray market peptides has recently exceeded $100 million.
This same Chainalysis report also emphasized that, according to forums where users discuss these compounds, there have been problems with the purity and safety of compounds that users have received.
Crypto, BTC in particular, has been marketed since the beginning as a censorship-resistant payment tool. Useful, in comparison to other payment methods, when the payment in question is one that the state, payment processors, or banks don’t want to occur.
This is why crypto was useful for various dark markets like Silk Road and why it’s is now useful for those interested in obtaining peptides not approved for human beings.
Got a tip? Send us an email securely via Protos Leaks. For more informed news and investigations, follow us on X, Bluesky, and Google News, or subscribe to our YouTube channel.
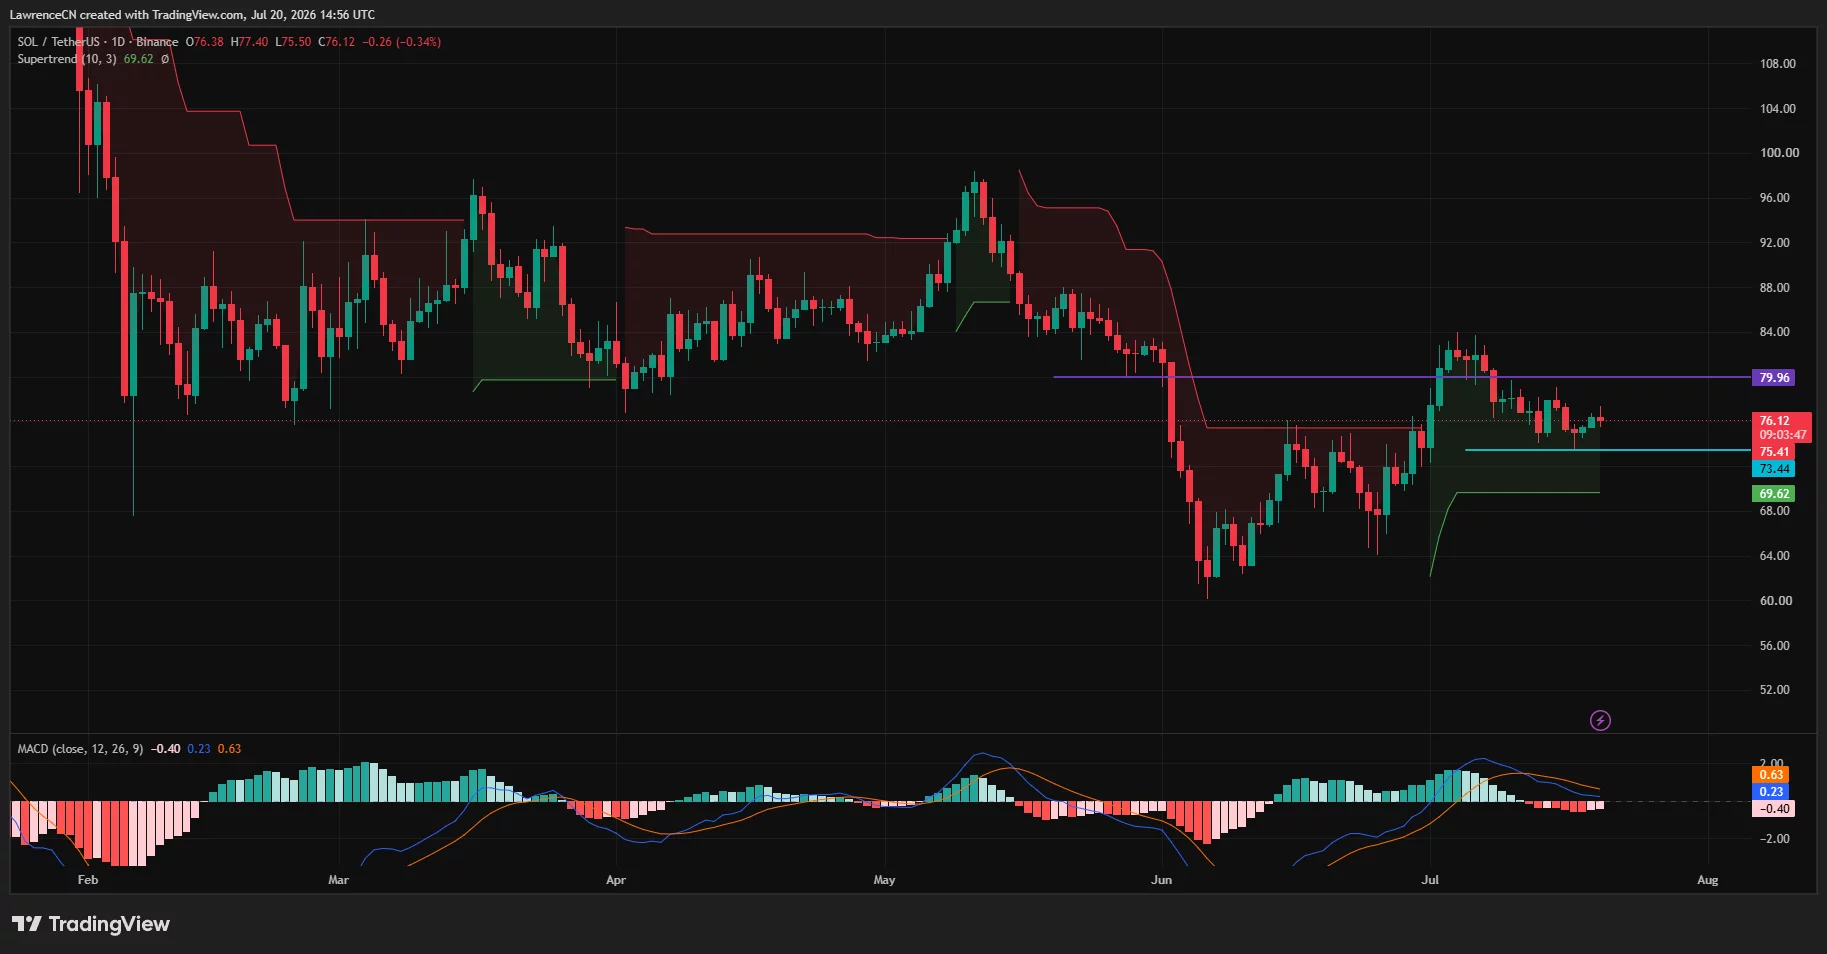
Solana price has stalled near $76 after repeated failures at $80, as two ecosystem exploits, weak momentum, and geopolitical stress have kept traders cautious.
Summary
- Solana price remains below $80 as security incidents weigh on trader sentiment.
- Bearish daily momentum contrasts with positive 4-hour capital flows near $76.
- Losing $73 could expose SOL to $70 and the mid-$60s region.
According to data from crypto.news, Solana (SOL) price traded at $76.12 at the time of writing, down 0.34% on the daily candle after moving between $75.50 and $77.40. The token has gained only about 0.3% over the past seven days, compared with a 3% rise across the global crypto market.
Security concerns have weighed on sentiment throughout July. An attacker drained roughly $20 million from BonkDAO after spending about $4.4 million to acquire enough BONK to pass a malicious governance proposal. Only seven wallets voted, and the proposal received 99.9% approval.
Another attack hit Allbridge Core on July 20. crypto.news reported that the exploiter borrowed $1.12 million in USDC through Kamino, manipulated the protocol’s USDC-USDT pool and extracted more than $1.1 million before routing the funds through privacy tools. Some estimates placed the total liquidity loss near $1.65 million, while Allbridge paused the protocol and began investigating the incident.
Phantom also reported degraded performance for token transfers and swaps on July 12. Account balances and other wallet functions remained available, but the disruption added friction for users during a week in which SOL was already struggling to draw enough demand for a break above $80.
Network activity has provided little relief. Trading on Pump.fun and other speculative venues has fallen from previous peaks, reducing the fee activity that once accompanied Solana’s memecoin boom. Stablecoin balances on the network may offer deployable capital, but holders must exchange those assets for SOL before that liquidity can support the token directly.
Solana price must reclaim $80 to confirm a bullish reversal
The daily chart places the main resistance at $79.96, where SOL’s early-July recovery failed, and sellers pushed the price back toward $75. A daily close above $80 would clear the psychological barrier and reopen the route toward the July swing high around $83, followed by the $90–$98 region.
According to analyst Daan Crypto Trades, SOL now sits at a decisive high-time-frame area where its next reaction could set the direction for the coming weeks.
“Either the bulls push through and set a higher low here to take a stab at the range high in the $90s. Or this rejects here and dribbles back down to that mid $60s area.”
Daily momentum has weakened since the early-July rally. The moving average convergence divergence line has dropped to 0.23, below its 0.63 signal line, while the histogram has slipped to minus 0.40. Buyers still control the medium-term structure above the daily Supertrend at $69.62, but the bearish MACD crossover leaves SOL exposed to another test of support.
On the 4-hour chart, SOL remains inside a descending parallel channel that began after the July 3 peak near $83. Price has reached the upper boundary around $76–$77, making a confirmed close above the trendline necessary before traders can treat the latest advance as a breakout.
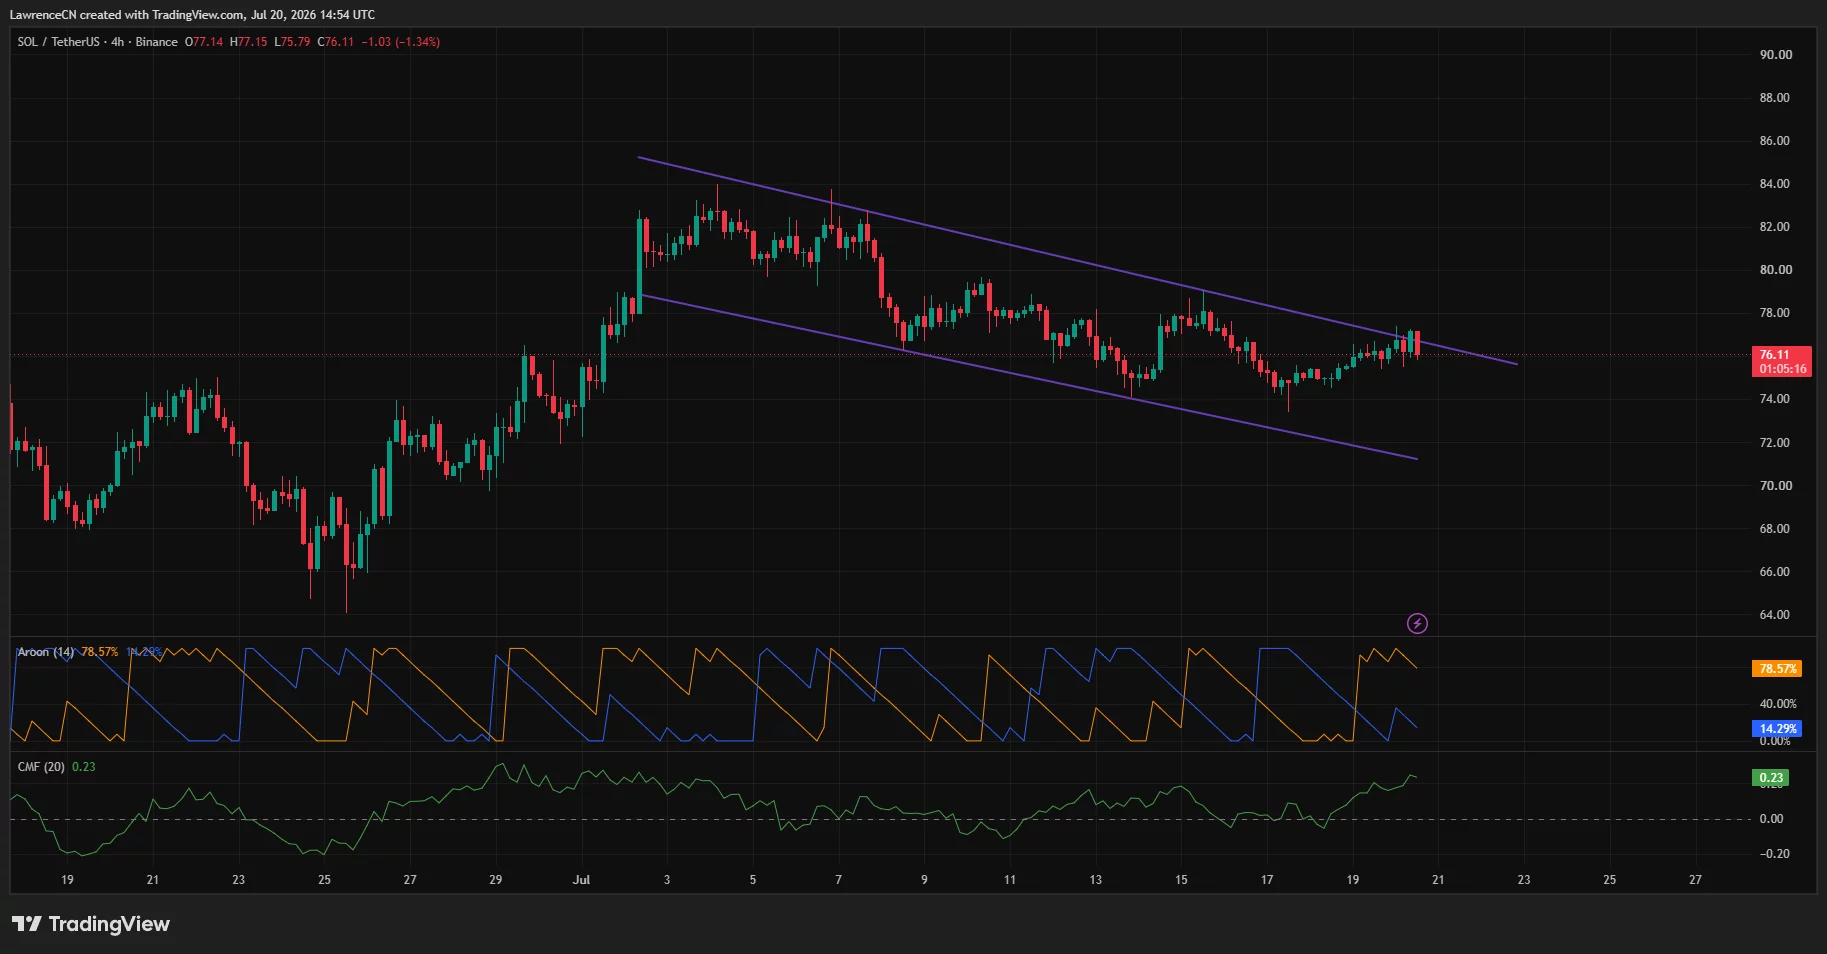
Conflicting momentum readings keep that setup unresolved. Aroon Down stands at 78.57%, compared with Aroon Up at 14.29%, giving sellers the stronger recent trend reading. Chaikin Money Flow, however, sits at 0.23, which shows that net capital flow over the measured period remains positive despite the lower highs.
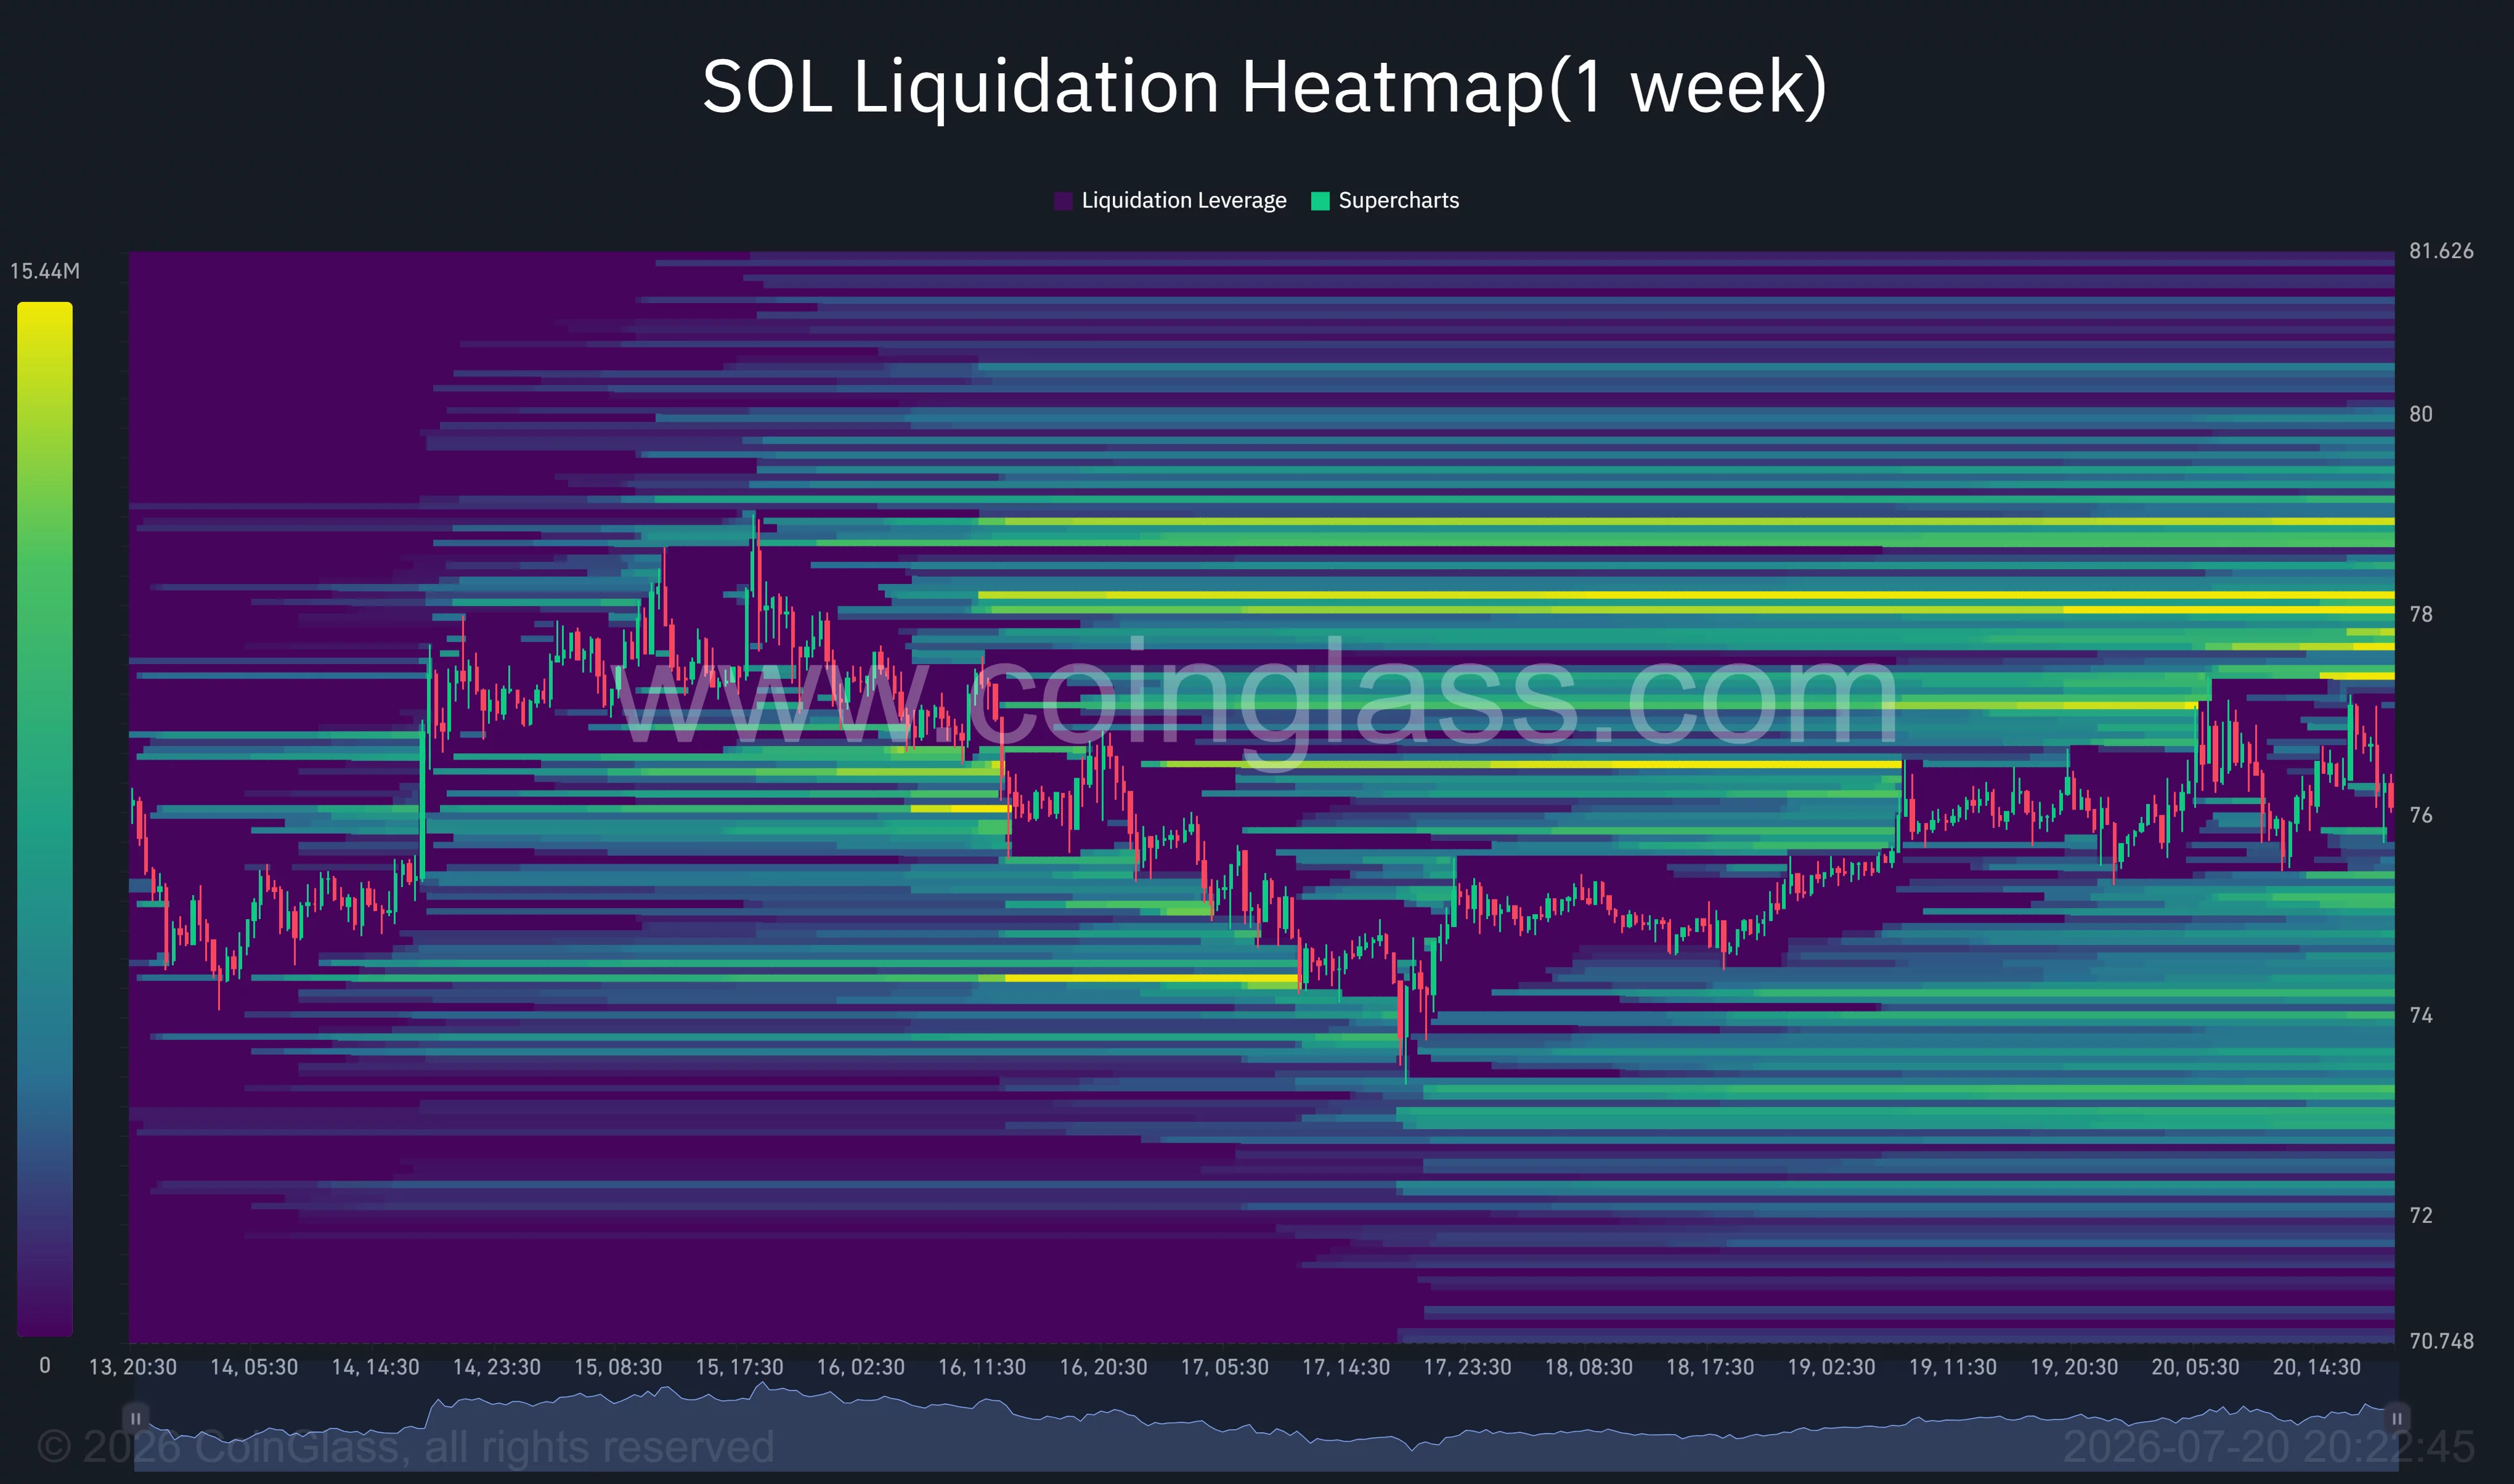
The one-week liquidation heatmap shows concentrated leverage above the market at $77.50–$78.20, with another dense band near $78.80. A move through those levels could force short liquidations and help SOL retest $80. Smaller liquidity pockets sit near $76.40, while downside clusters around $74.20–$75 could draw price lower if buyers lose control of $75.41.
Break below $73 would invalidate the recovery attempt
Immediate support rests at $75.41, followed by the stronger daily level at $73.44. A close below the latter would weaken the higher-low structure and expose the lower edge of the 4-hour channel near $71. The Supertrend at $69.62 would then become the last major defense before Daan’s mid-$60s bearish target returns to view.
Macroeconomic conditions also threaten the setup. Renewed U.S.-Iran hostilities have pushed oil above $90 per barrel and lifted the average U.S. gasoline price back to $4, according to AP. Higher energy costs could keep inflation elevated and limit the Federal Reserve’s room to reduce interest rates.
The 10-year Treasury yield rose to about 4.56% on July 20, while the dollar index held near 100.8. Persistently high yields and a firm dollar could keep institutional portfolios defensive and restrict capital flows into volatile altcoins.
For bulls, the clean confirmation remains a daily close above $80 followed by a successful retest. Until then, SOL remains trapped between positive spot inflows on the 4-hour chart and a weakening daily momentum structure, with $73–$80 defining the next decisive range.
Disclosure: This article does not represent investment advice. The content and materials featured on this page are for educational purposes only.
The Bitcoin miner raised its year-end AI cloud revenue target to more than $4 billion after signing $2.8 billion in new contracts with AI developers.
Cardano price remained under pressure on Monday despite the activation of the network’s van Rossem hard fork, leaving ADA traders focused on whether the token can break through its next major resistance zone.
Summary
- Cardano remains near $0.16 as weak momentum limits gains following the van Rossem hard fork.
- ADA must reclaim $0.17 and $0.19 before the broader downtrend shows clearer signs of reversing.
- Positive funding offers support, but a sub-one long-short ratio shows traders remain cautious about recovery.
ADA was trading near $0.162 at the time of writing, down around 2% over 24 hours. The token has remained broadly flat over the past month after a long decline from levels near $0.90 to $1.00. Its market capitalization stands near $6.06 billion, while daily trading volume is around $240 million.
The latest price action comes just after Cardano moved to Protocol Version 11 through the van Rossem hard fork. The network upgrade improved parts of the Plutus smart contract framework and prepared Cardano for future scaling work, but it has not yet produced a sustained ADA price rally.
Cardano price struggles to hold above $0.16
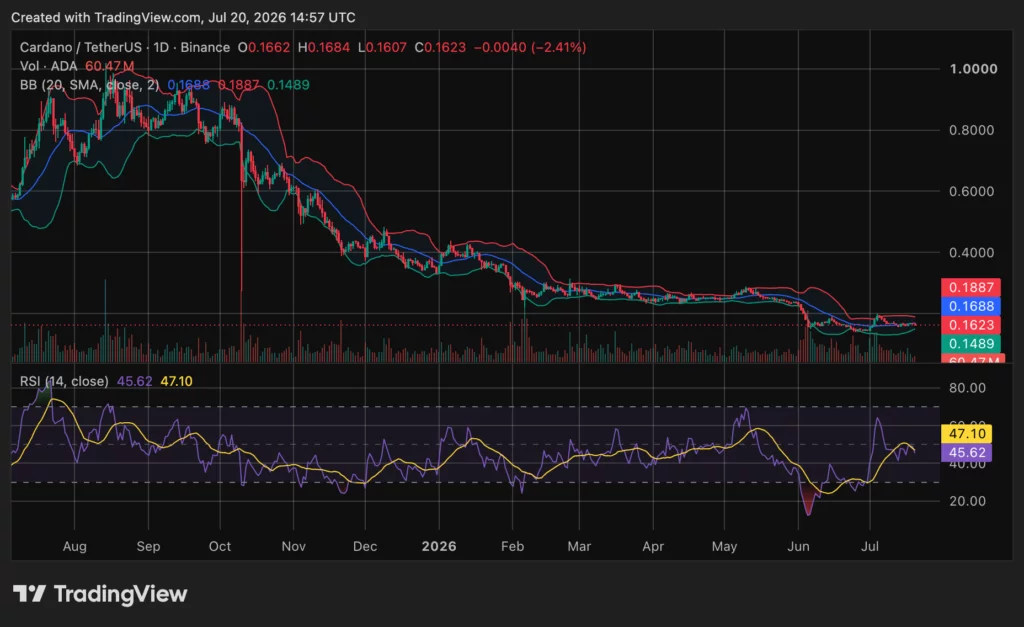
The ADA/USDT daily chart remains in a broader bearish structure. Cardano has fallen sharply from its 2025 highs and recently settled into a narrow range around $0.16. The latest consolidation has slowed the decline, but buyers have yet to establish a clear sequence of higher highs and higher lows.
ADA is also trading below the middle Bollinger Band near $0.1688. The upper band sits around $0.1887, while the lower band is close to $0.1489. This places the price in the lower half of its current volatility range. A sustained move above $0.17 would improve the short-term setup, while a renewed decline could put the $0.15 area back in focus.
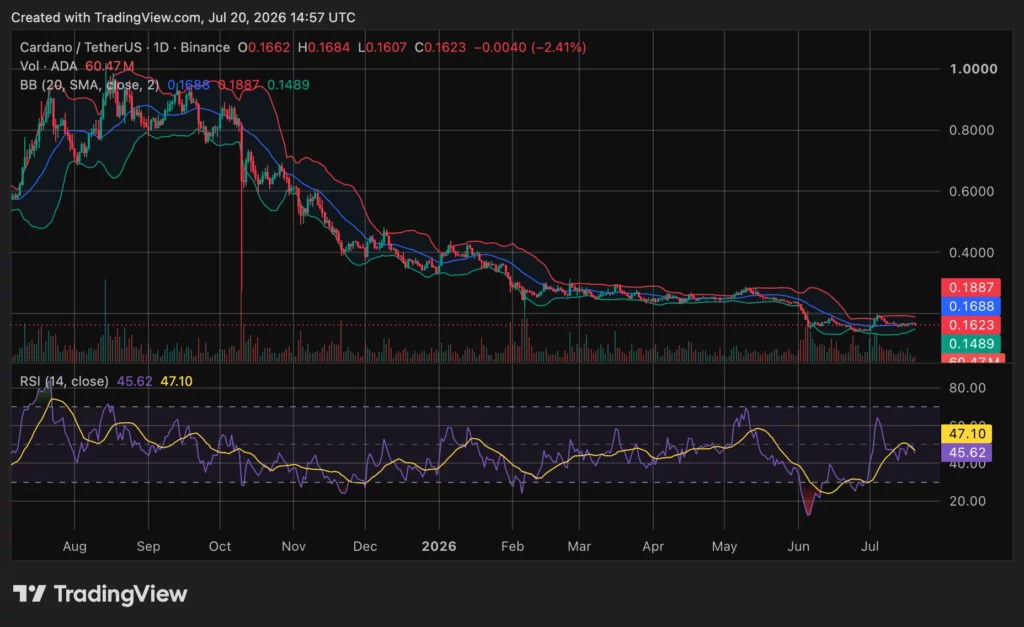
The Relative Strength Index stands at 45.62, slightly below its moving average of 47.10. The reading shows that momentum has recovered from more extreme selling conditions but remains below the neutral 50 mark. Buyers therefore have not yet gained firm control of the daily trend.
This weak structure follows months of pressure on ADA. Cardano fell below $0.20 in June as its broader market decline continued. Earlier technical analysis also identified weak momentum indicators as ADA struggled to establish durable support.
Van Rossem hard fork fails to trigger an immediate ADA rally
Cardano activated the van Rossem hard fork on July 18, taking the mainnet to Protocol Version 11. The upgrade became the network’s first hard fork approved and ratified entirely through its onchain governance system.
The upgrade adds Plutus improvements and changes to the cost model used for smart contract execution. It also prepares the technical foundation for the planned Dijkstra era and Ouroboros Leios, which aims to increase Cardano’s transaction capacity. As crypto.news reported, the upgrade went live after moving through Cardano’s governance process and earlier testnet stages.
However, ADA has so far shown little sustained response to the network event. The token remains near the same price area it occupied before activation. That price behavior suggests traders are still weighing broader market conditions and technical resistance alongside the protocol upgrade.
The hard fork can improve the network’s underlying technology without automatically driving immediate demand for ADA. For the price setup, traders are now watching whether activity following the upgrade can support stronger buying pressure over a longer period.
Mixed derivatives data keeps traders cautious
Derivatives indicators also show a divided market. ADA funding rates recently turned positive, with the rate at about 0.0061%. Positive funding generally means traders holding long positions pay those holding shorts, showing that positioning has shifted somewhat toward the bullish side.
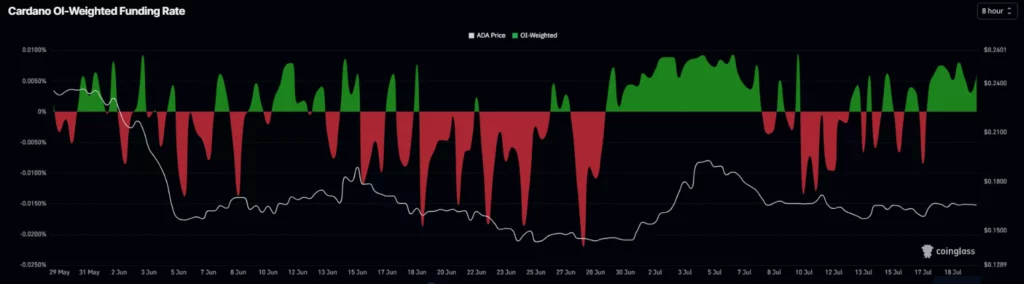
However, the ADA long-to-short ratio remained near 0.90. A reading below one means short positions continue to outnumber longs under that measure. The two indicators therefore point in different directions, with improving funding but continued caution among derivatives traders.
The mixed positioning follows heavy short interest ahead of the hard fork. ADA traded near $0.1628 before the upgrade as traders increased bearish positions even while large holders accumulated tokens. Liquidity was concentrated around $0.16 and $0.17, making those levels important for the next move.
The $0.16 area has continued to act as an immediate support zone after the fork. Losing that level could expose ADA to the lower Bollinger Band near $0.149. Holding it would give buyers another opportunity to test the resistance immediately above the current range.
ADA needs to reclaim $0.17 to target $0.19
The first technical level for Cardano bulls is the $0.168 to $0.17 area, which aligns closely with the middle Bollinger Band and a previous liquidity zone. A daily move above that range would return ADA to the upper half of its recent trading channel.
Beyond that, the $0.188 to $0.19 area represents the next major resistance zone. The upper Bollinger Band sits near this level, making a break above $0.19 a stronger signal that the short-term structure is changing. RSI would also need to climb above 50 to show firmer momentum from buyers.
Until those conditions develop, ADA remains in a consolidation phase inside a much larger downtrend. The van Rossem upgrade provides a new network catalyst, while development toward Leios gives Cardano another technical milestone to watch. However, price confirmation still depends on buyers pushing through nearby resistance.
Ethereum has extended its recovery over the past few weeks, but the rally is now approaching a technically sensitive area. While the recent strength has improved short-term sentiment, the higher-timeframe structure has yet to confirm a sustained trend reversal, leaving room for increased volatility around current levels.
Ethereum Price Analysis: The Daily Chart
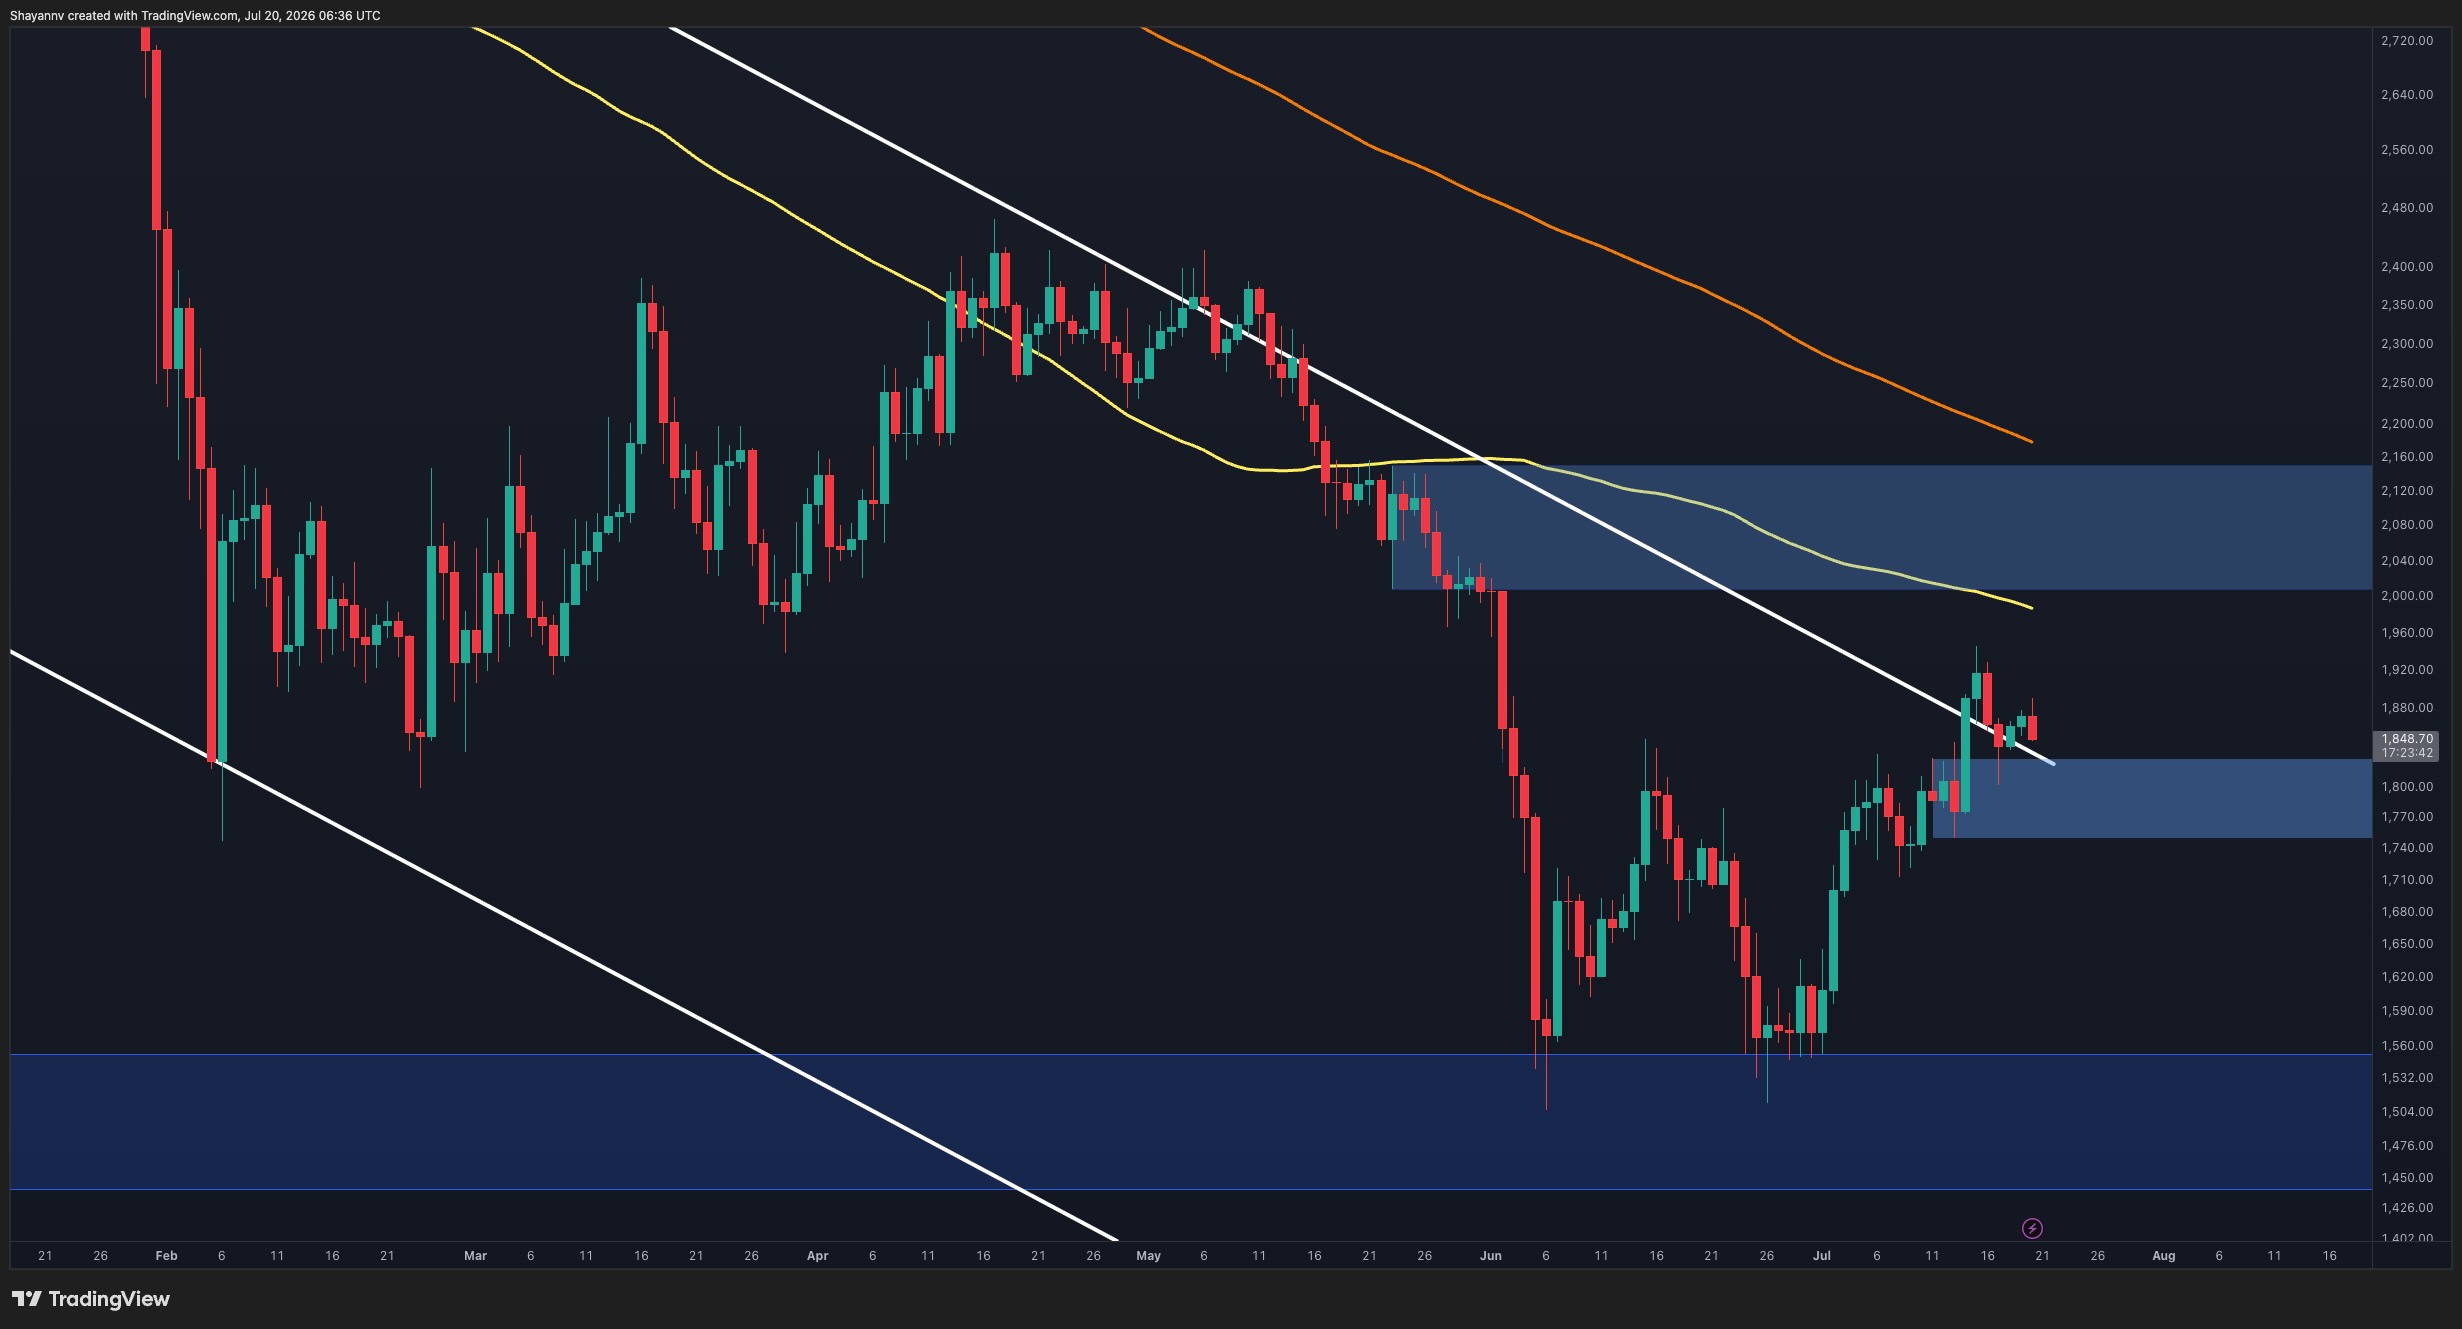
On the daily timeframe, ETH has broken above the upper boundary of the descending channel that guided the broader downtrend for several months. While this initially appears constructive, the breakout has not yet been confirmed and could still develop into a false breakout if price fails to hold above the former channel resistance over the coming sessions.
The $2K-$2.15K supply zone remains the primary obstacle for bulls. This area is reinforced by the declining 100-day moving average, making it a significant resistance cluster despite the recent improvement in price action.
On the downside, the $1.75K-$1.8K region now acts as the first line of defense. Holding this zone would keep the breakout attempt intact, whereas losing it could drag ETH back toward the broader demand area around $1.5K-$1.55K and confirm that the move above the channel was merely a liquidity sweep rather than a genuine trend reversal.
ETH/USDT 4-Hour Chart
The 4-hour chart shows Ethereum consolidating within an ascending flag after the sharp impulsive rally from the July lows. Rather than signaling immediate weakness, the current pullback appears to be developing as a corrective phase inside the broader recovery.
The white ascending trendline represents the flag’s intra-dynamic support and has repeatedly attracted buyers during recent retracements. As long as ETH continues to respect this trendline, the structure favors another attempt to challenge the recent swing high around $1.9K.
However, a decisive break below the ascending support would invalidate the flag structure and expose the blue demand zone around $1.76K-$1.8K, where buyers would likely attempt to regain control.

Sentiment Analysis
The Exchange Inflow (Top 10) metric tracks the amount of ETH transferred to exchanges by the largest deposit transactions, which are often associated with whales and institutional participants.
Recent data shows that exchange inflows from large holders have remained relatively subdued following several notable spikes earlier in the year. The latest readings are well below those previous peaks despite Ethereum’s recovery toward $1.8K, suggesting there has not been a meaningful increase in selling pressure from major market participants.
This relatively muted inflow profile complements the current technical structure. While it does not guarantee further upside, the absence of aggressive exchange deposits from large holders indicates that significant profit-taking has yet to emerge, allowing Ethereum to continue testing higher resistance levels as long as the short-term support structure remains intact.

The post Ethereum Price Analysis: ETH Tests Crucial Resistance Following Channel Breakout appeared first on CryptoPotato.

Bitcoin investors waiting for a traditional four-year cycle bottom in September or October could be caught on the wrong side of the market, according to analyst Doctor Profit.
While the four-year cycle worked “almost perfectly” at the top, now the analyst believes the opposite is happening.
October Catalysts
In his latest post on X, Doctor Profit said he does not see Bitcoin falling below $50,000, although he identified the area around $54,000 as a major liquidity zone that remains important. “There is an extreme amount of liquidity around $54,000, and that cannot be ignored,” he said, while estimating that a move from current levels to that price would represent roughly 15% downside.
Given that risk-reward profile, he argued that it makes sense to start accumulating now, but “step by step, not all in.” The analyst also noted that he does not expect the next major rally to begin immediately.
Doctor Profit further explained that the market could front-run the widely anticipated cycle bottom while pointing to several crucial developments that could strengthen sentiment before then. For instance, the planned rollout of tokenized stocks through infrastructure involving major financial institutions, including BlackRock, the New York Stock Exchange, the S&P, Nasdaq, and the DTCC, which he said is expected to move forward in October after tokenization platforms were effectively tested through earlier market activity.
Doctor Profit cited rumors that the CLARITY Act could pass in August as another potential catalyst, and added that regulatory clarity would make it easier for institutions to enter the crypto market and accelerate tokenization. However, prediction market traders have since become less optimistic about the bill’s prospects after the implied odds of its passage declined in recent days.
ETFs Stay Positive
After suffering eight straight weeks of heavy outflows, US spot Bitcoin ETFs have continued their recovery with another week of net inflows. According to data compiled by SoSoValue, the funds have attracted more than $200 million so far in July, continuing the positive trend that began in the middle of the month.
Last week alone saw roughly $76 million in net inflows.
The post Analyst Says Waiting for Bitcoin’s Four-Year Cycle Bottom Could Be a Costly Mistake appeared first on CryptoPotato.
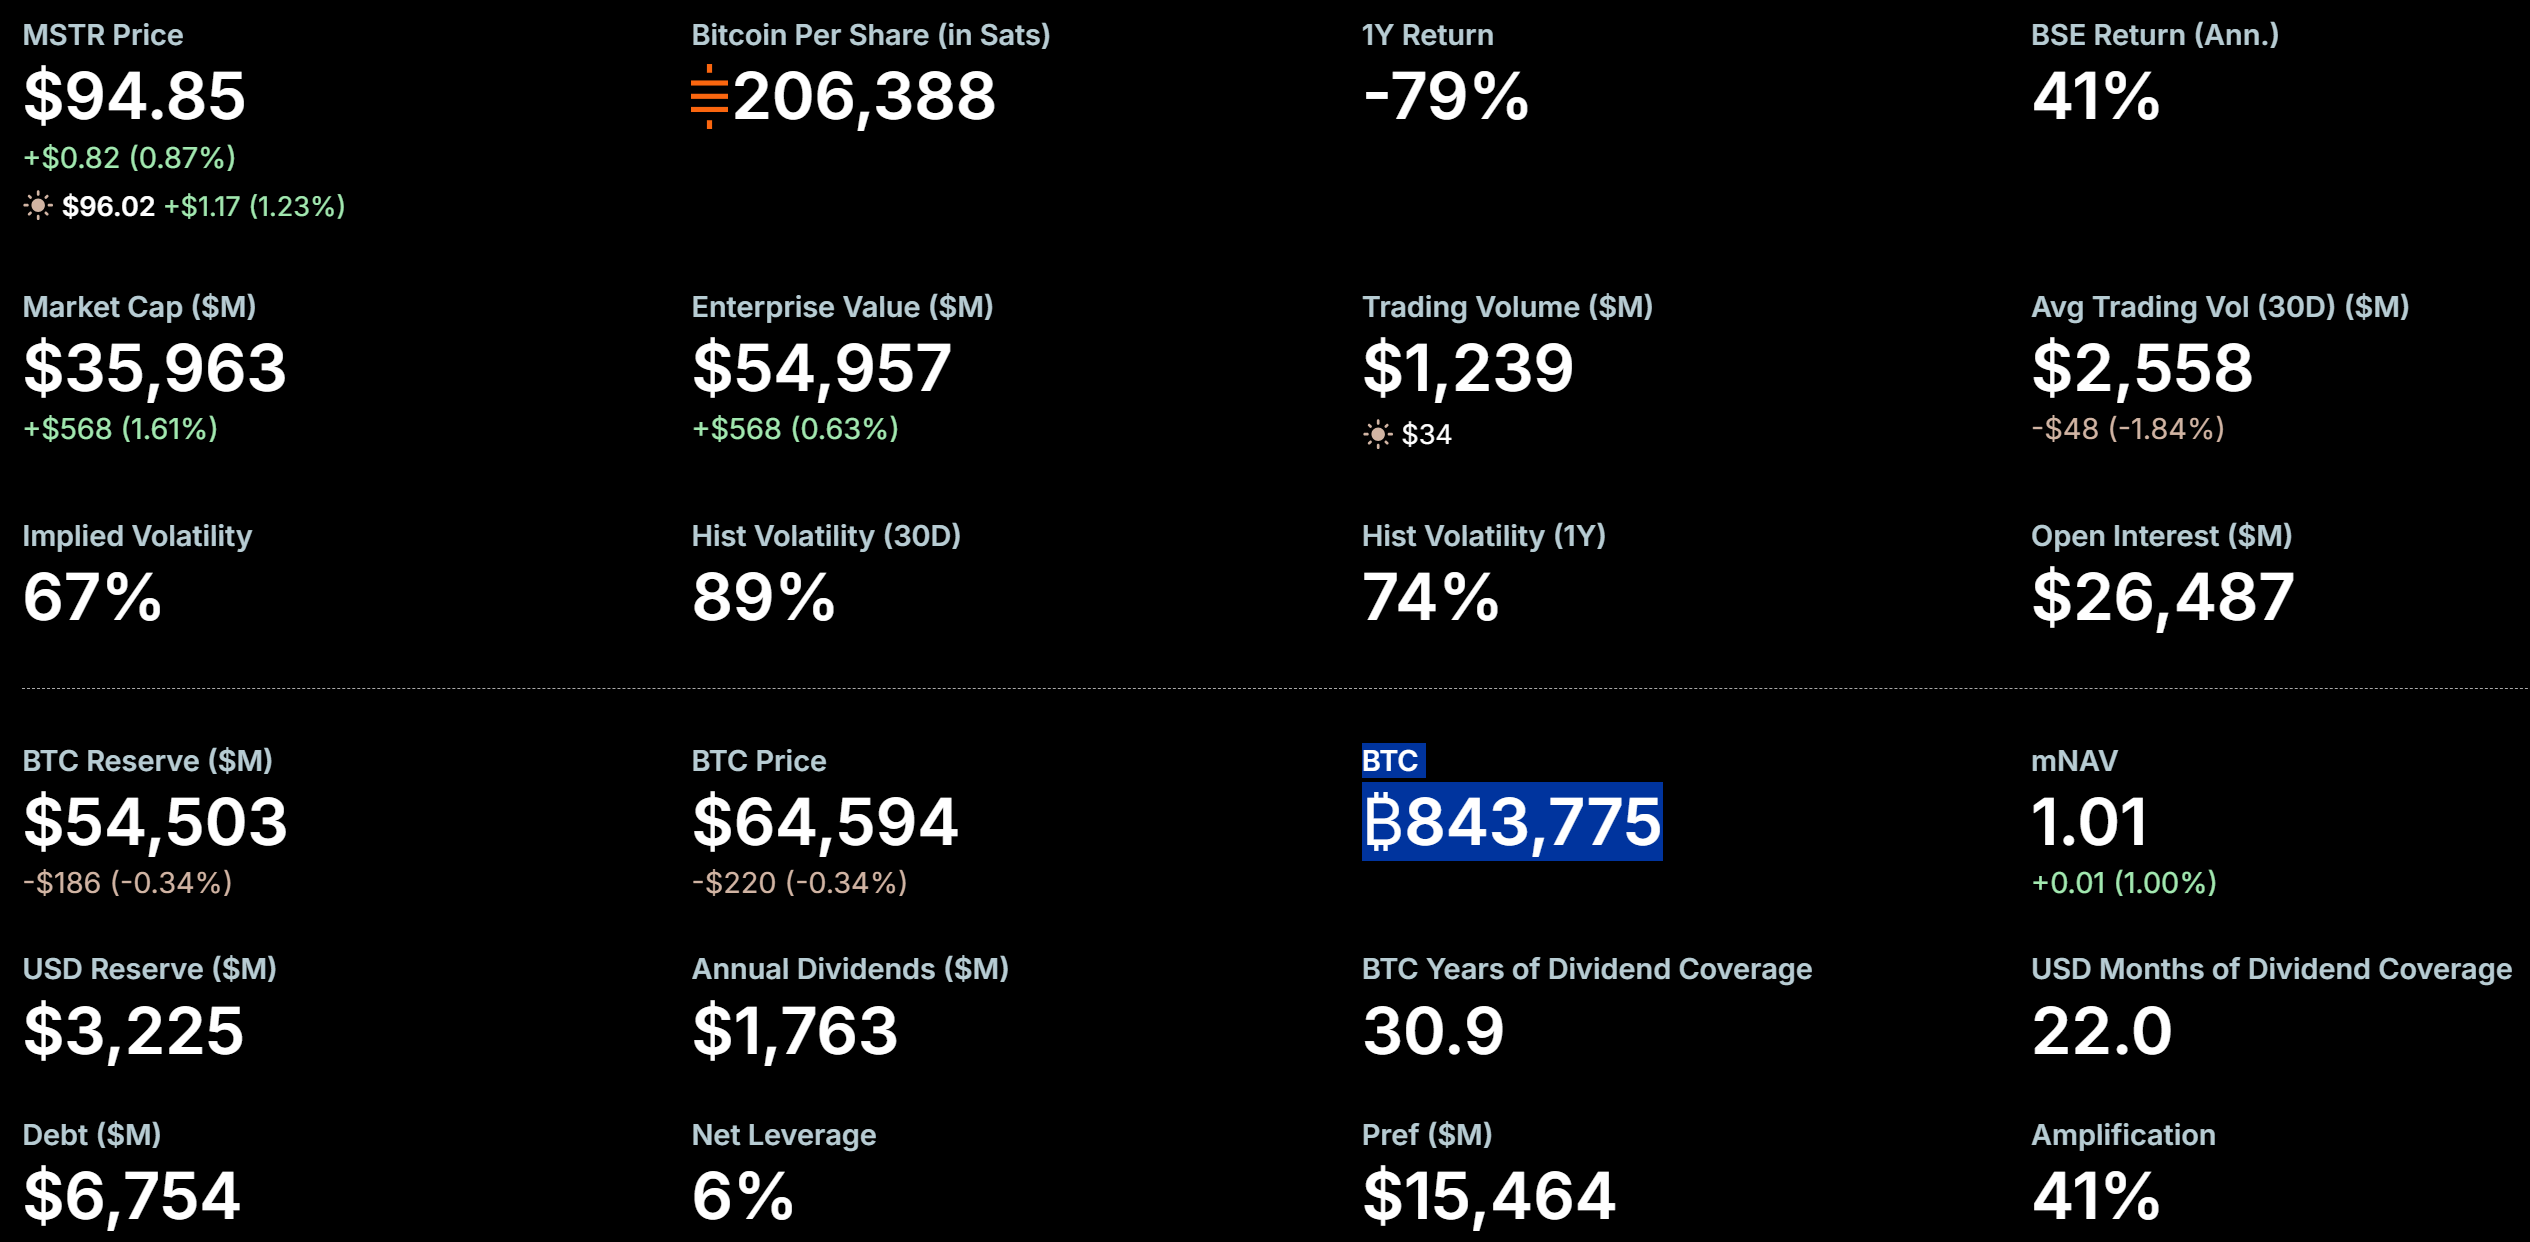
MicroStrategy (now Strategy) sold $263.5 million in MSTR shares last week and bought no Bitcoin (BTC). The deal for MSTR investors is simple. Own a smaller slice today, in exchange for a company built to survive tomorrow.
The firm disclosed the sales in a Monday filing. Its Bitcoin stack stayed frozen at 843,775 BTC for a second straight week. The cash pile grew to $3.2 billion instead.

What the MSTR Share Sales Actually Buy
Strategy sold 2.73 million new shares directly into the market through its at-the-market (ATM) program. The filing sits with the US Securities and Exchange Commission (SEC). Meanwhile, a $1 billion buyback plan for the stock sat untouched.
One week earlier, the company raised $466.7 million the same way. All that cash feeds the Digital Credit Capital Framework. This June policy locks money away for one job. It pays dividends on preferred shares and interest on debt.
Those bills run about $1.76 billion a year, per the company’s announcement. The $3.2 billion reserve covers roughly 22 months. The board only requires 12.
“Strategy remains committed to Bitcoin as its primary treasury reserve asset. At the same time, Digital Credit requires liquidity, discipline, and active capital management,” Michael Saylor, Strategy’s founder and executive chairman, said when introducing the framework.
The Trade-Off Facing MSTR Investors
Here is why the cash matters. MicroStrategy paid an average of $75,476 per Bitcoin, or $63.7 billion in all, per its July disclosure. Bitcoin now trades near $64,700, down nearly 48% from its October 2025 peak. That gap created an $8.32 billion paper loss last quarter.

June showed the danger. Strategy sold 3,588 BTC near $60,000 each just to pay dividends. It sold below its own cost. The reserve exists so that never happens again.
The insurance has a price. The two July raises minted roughly 7.6 million new shares. That means near 2% dilution in two weeks, against April’s proxy count of 327 million. Another $23.5 billion in ATM capacity remains.
Early trading suggests investors accept the deal. MSTR changed hands at $96.22 in Monday’s pre-market, up 1.45% from its previous close of $94.85. The stock still sits far below its 52-week high of $437.

Not everyone reads the pivot the same way. Bitwise CIO Matt Hougan believes the firm’s run as dominant buyer is over. Grayscale, however, argues controlled Bitcoin sales could steady BTC rather than sink it. Saylor still calls corporate Bitcoin adoption inevitable.
The question for MSTR investors is simple. Does a smaller slice of a sturdier company beat a bigger slice of a fragile one? The answer arrives the next time MicroStrategy chooses between more Bitcoin and more cushion.
The post MicroStrategy Is Asking MSTR Investors to Make One Big Trade-Off appeared first on BeInCrypto.


Bitmine (BMNR), the largest Ethereum treasury firm, bought just 7,430 ether (ETH) last week, dialing back its buying spree as it redirected capital to a stock buyback.
The latest purchase, worth about $14 million at ether’s current price of $1,879, lifted BitMine’s holdings to 5,78 million ETH, or roughly 4.8% of Ethereum’s circulating supply, according to a Monday company update.
BMNR was 2.4% higher in pre-market trading.
The purchase marks one of firm’s smallest weekly additions since launching its Ethereum treasury strategy in June 2025. By comparison, the firm bought more than 111,000 ETH during one week in May and had regularly acquired tens of thousands of tokens throughout the first half of the year. The firm is nearing its goal to corner 5% of ETH supply.
Chairman Thomas “Tom” Lee attributed the slowdown to the company’s decision to repurchase approximately 5.5 million shares at an average price of $15.62 under its previously authorized $4 billion buyback program.
“The reduced pace of buys reflects that Bitmine repurchased 5.5 million common shares,” Lee said. He added that the company has purchased ETH every week since adopting its treasury strategy just over a year ago.
Veteran trader Peter Brandt says he has pinpointed the exact day in 2026 when he expects Bitcoin to hit the bottom of this market cycle.
“I’ll go out on a limb and say we bottom on October 4th. So we’ll see,” Brandt tells Cointelegraph during an interview for Trade Secrets.
Of course, picking the exact day of a market bottom is a tough ask, but the 51-year trading veteran has held firm on his October prediction for Bitcoin’s cycle low for quite some time.
He says Bitcoin could fall below $50,000 and potentially into the high-$40,000 range before establishing what he expects will be the cycle low.
“Whether it’s at these kinds of current levels, or we crash through and really blow people out and move into the 50s, possibly the high 40s… You know, you have to remember that every major bear market in Bitcoin’s history since its inception has been an 80% plus correction. If you take Bitcoin’s high in the 120s, that would indicate that,” Brandt says.
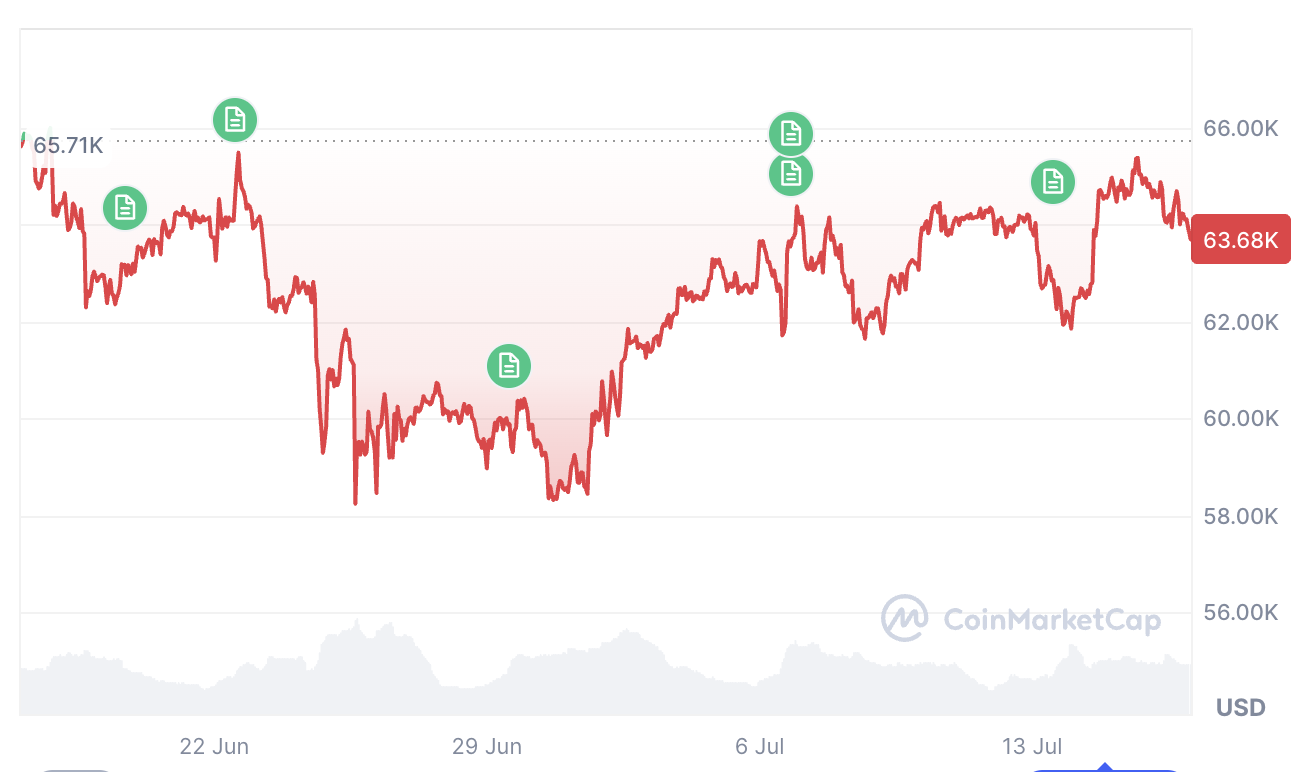
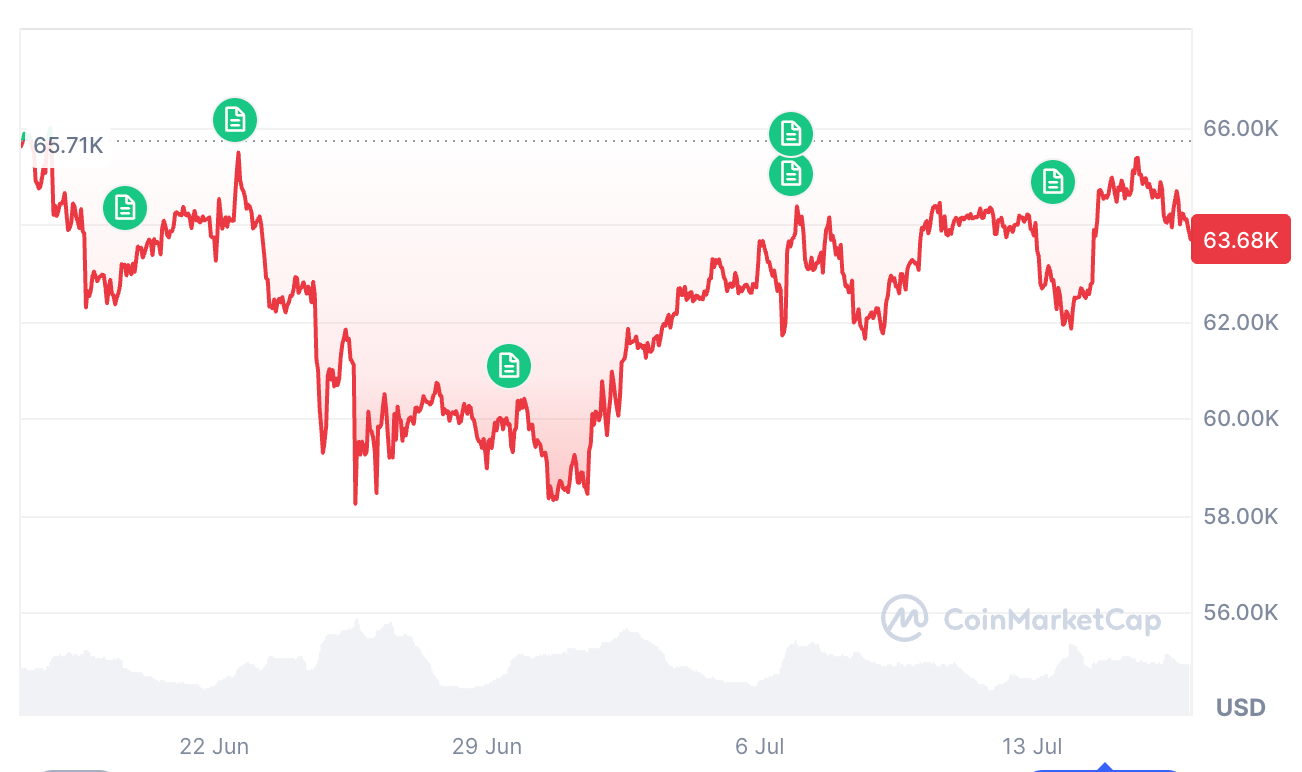
Bitcoin is trading at $63,661 at the time of publication. Source: CoinMarketCap
Many traders believe Bitcoin’s current level around $60,000 could be the cycle bottom, but Brandt isn’t convinced. He says there is still too much optimism that prices will bounce back.
“Right now it’s neutral [sentiment]. Markets don’t bottom on neutral sentiment. Markets bottom on panic and volume.”
“The same people that are saying Bitcoin’s bottom at some point in time will be giving up on Bitcoin, throwing in the towel, and saying we’re done with Bitcoin, we’re going on to other assets, the Bitcoin phenomenon is done,” Brandt says.
Brandt says Bitcoin is a better bet than AI stocks
While some in crypto have blamed the AI boom for pulling money away from Bitcoin and the broader market, Brandt isn’t convinced the AI trade can keep climbing forever.
“I do not believe that somebody who goes all in on AI stocks right now will be very happy with that investment two, three years from now,” Brandt says, explaining that if he had $10,000 right now he would split it 50% between Bitcoin and precious metals.
“I think precious metals are closer to a bottom price-wise; I think Bitcoin may be closer to a bottom time-wise,” he says.
Brandt says Bitcoin won’t reach its cycle peak until 2029, forecasting a price between $250,000 and $300,000. If he’s right, Bitcoin would have just a year to climb from that range to the far more ambitious $1 million target projected by Coinbase CEO Brian Armstrong and Ark Invest CEO Cathie Wood for 2030.
Cointelegraph publishes long-form journalism, analysis and narrative reporting produced by Cointelegraph’s in-house editorial team with subject-matter expertise. All articles are edited and reviewed by Cointelegraph editors in line with our editorial standards. Content published in here does not constitute financial, legal or investment advice. Readers should conduct their own research and consult qualified professionals where appropriate. Cointelegraph maintains full editorial independence.


It adds new capabilities to Plutus, the platform developers use to write Cardano’s smart contracts, unifying the built-in functions available across the platform’s three versions so older applications gain newer features.
The upgrade also tightens several of the ledger’s validation rules, including one guaranteeing that no two stake pools can reuse the same cryptographic identity key.
“As well as Plutus improvements and Plutus Cost Model enhancements, this upgrade lays the foundation for the next upgrade, the Dijkstra era hard fork, which will introduce Ouroboros Leios to Cardano,” Input Output wrote in a development report on Friday.
Ouroboros Leios is a scaling proposal for the proof-of-stake consensus model that Cardano runs. It is expected later in 2026 and aimed at sharply increasing transactions per second without weakening the protocol’s security guarantees.
Van Rossem is the procedural groundwork for Ouroboros, both in the ledger changes it ships and in the precedent it sets: that Cardano can now upgrade itself by vote.
The hard fork is named for Max van Rossem, a Cardano governance contributor who helped shape the network’s constitution and died in October 2025.
What the hard fork means for a Cardano user
There are no visible changes for someone casually holding or spending ADA. Transactions work the same way, wallets do not need updating and the fee to send ADA is unchanged. The upgrade does not alter how the network looks or feels to use.

How LEDs Are Making Light Pollution Worse

Kevin Keegan: Newcastle and Liverpool legend dies aged 75 as tributes pour in
Why is Enphase Energy stock sliding today?


-
 NewsBeat4 days ago
London Mayor Sadiq Khan handed a peerage by Keir Starmer alongside 15 other Labour figures… just days before the PM leaves No10
-

 Fashion3 days ago
Weekend Open Thread – Corporette.com
-

 Politics2 days ago
The House | The City of London can help the new chancellor deliver growth in every postcode
-

 Politics5 days ago
Young campaigners urge incoming PM to act on outdoor junk food ads
-

 Crypto World5 days ago
CFTC blocks Kalshi from unwinding Michigan trades after court order
-
 Crypto World3 days ago
Two July Windows Left: The CLARITY Act’s Senate Fight and What Failure Means
-

 Business5 days ago
Nvidia Stock Slips After Big Tuesday Rally as Huang Confirms Vera Rubin Chip Is Now in Production Today
-
 Crypto World2 days ago
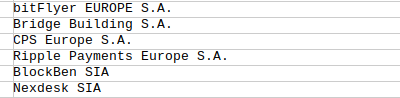
Ripple Payments Joins MiCA With 14 Firms, Does It Mean Anything For XRP?
-

 Politics1 day ago
Democrats look to World Cup watch parties to register thousands of voters
-
 Entertainment5 days ago
Disney’s Most Ambitious Failed Star Wars Attraction Is Coming to SDCC
-

 Crypto World3 days ago
Ripple wins EU-wide access as ESMA adds it to MiCA register
-

 Business4 days ago
Palantir Shares Rise After Expanded Nvidia Partnership and Fresh Analyst Upgrades Ahead of Earnings Day
-

 Crypto World4 days ago
Injective Submits SEC Transfer-Agent Registration to Onchain Ownership Records
-
 Tech6 days ago
Get Your ESP32 Sunny Side Up With This Solar Dev Board
-

 NewsBeat3 days ago
Registration is now open for March for Men with Kev 2026
-

 News Videos6 days ago
XRP BOMBSHELL… XRP OMBOARDED FOR TRANSACTIONS!!!
-

 Tech6 days ago
Dark Secrets Emerge When Jailbreaking LLMs
-

 NewsBeat5 hours ago
Unregistered fitter used Gas Safe logo on business flyers
-
 Sports5 days ago
New Cornerback Enters Vikings Trade Rumor Mill
-

 News Videos3 days ago
Money | Class 12 Economics | CBSE Board Exam 2026-27
You must be logged in to post a comment Login