

Crypto World
BTC price stalls at $78,000 as traders brace for liquidation-driven breakout: Crypto Markets Today
The crypto market is on the brink of a major breakout with bitcoin trading at $78,000, the level it failed to breach on Friday and a price it has not topped since January.
A break above this level would trigger upside momentum to $80,000 as $180 million worth of futures positions are due to be liquidated between $77,000 and $78,000, according to CoinGlass’ liquidation heatmap.
However, there is also a $71 million long position that will be liquidated if the price fails to gain and descends back below $77,300, creating a defensive trading environment on both sides.
The market is higher after U.S. President Donald Trump extended the ceasefire in Iran, saying that country’s government was “seriously fractured.”
Nasdaq 100 futures and S&P 500 futures rose by 0.77% and 0.6%, respectively, since midnight UTC following the announcement, suggesting improving broader market sentiment.
Derivatives positioning
- BTC’s breakout to $78,000 caught the bears off guard, leading to $286 million in marketwide short liquidations on derivative exchanges. Longs, or bullish plays, suffered liquidations of just $132 million.
- Still, overall crypto futures open interest (OI) has increased by over 4% to $126 billion in 24 hours. Notably, OI grew across the major tokens, including bitcoin and ether (ETH), outpacing spot price gains, indicating renewed capital inflows and rising demand for leverage.
- Funding rates have flipped positive for most tokens, including BTC, indicating a renewed bias for bullish bets. The 24-hour cumulative volume delta also paints the same picture.
- M token stands out with annualized funding rates above 200%, signaling an overheated market crowded with bullish bets. Meanwhile, the HYPE and XML markets show a bias toward bearish short plays.
- Broadly speaking, crypto futures activity suggests scope for further market gains. Also supporting the bull case are bitcoin and ether’s 30-day implied volatility indices, which remain under pressure, pointing to market calm.
- On Deribit, bitcoin and ether risk reversals continue to print negative values across all time frames. That’s a sign of the richness of protective put options relative to calls.
- Block flows featured investor bias for call ratio spreads, a strategy used by traders to profit from a moderately bullish, sideways or slightly rising market. Traders also chased bitcoin and ether straddles, a volatility strategy.
Token talk
- The altcoin market was also in a buoyant mood on Wednesday, with all major CoinDesk indexes posting gains of at least 1.5% since midnight UTC.
- The CoinDesk MemeCoin Index (CDMEME) was the top performer, rising 3.4%, with one person turning $575 into more than $1 million on recently released token ASTEROID.
- Popular memecoins TRUMP and DOGE added 6% and 3.8%, respectively, reflecting broader optimism across the sector.
- There was also a boost in privacy coins DASH and XMR, both of which gained 6%-7% over the past 24 hours before tailing off slightly since midnight.
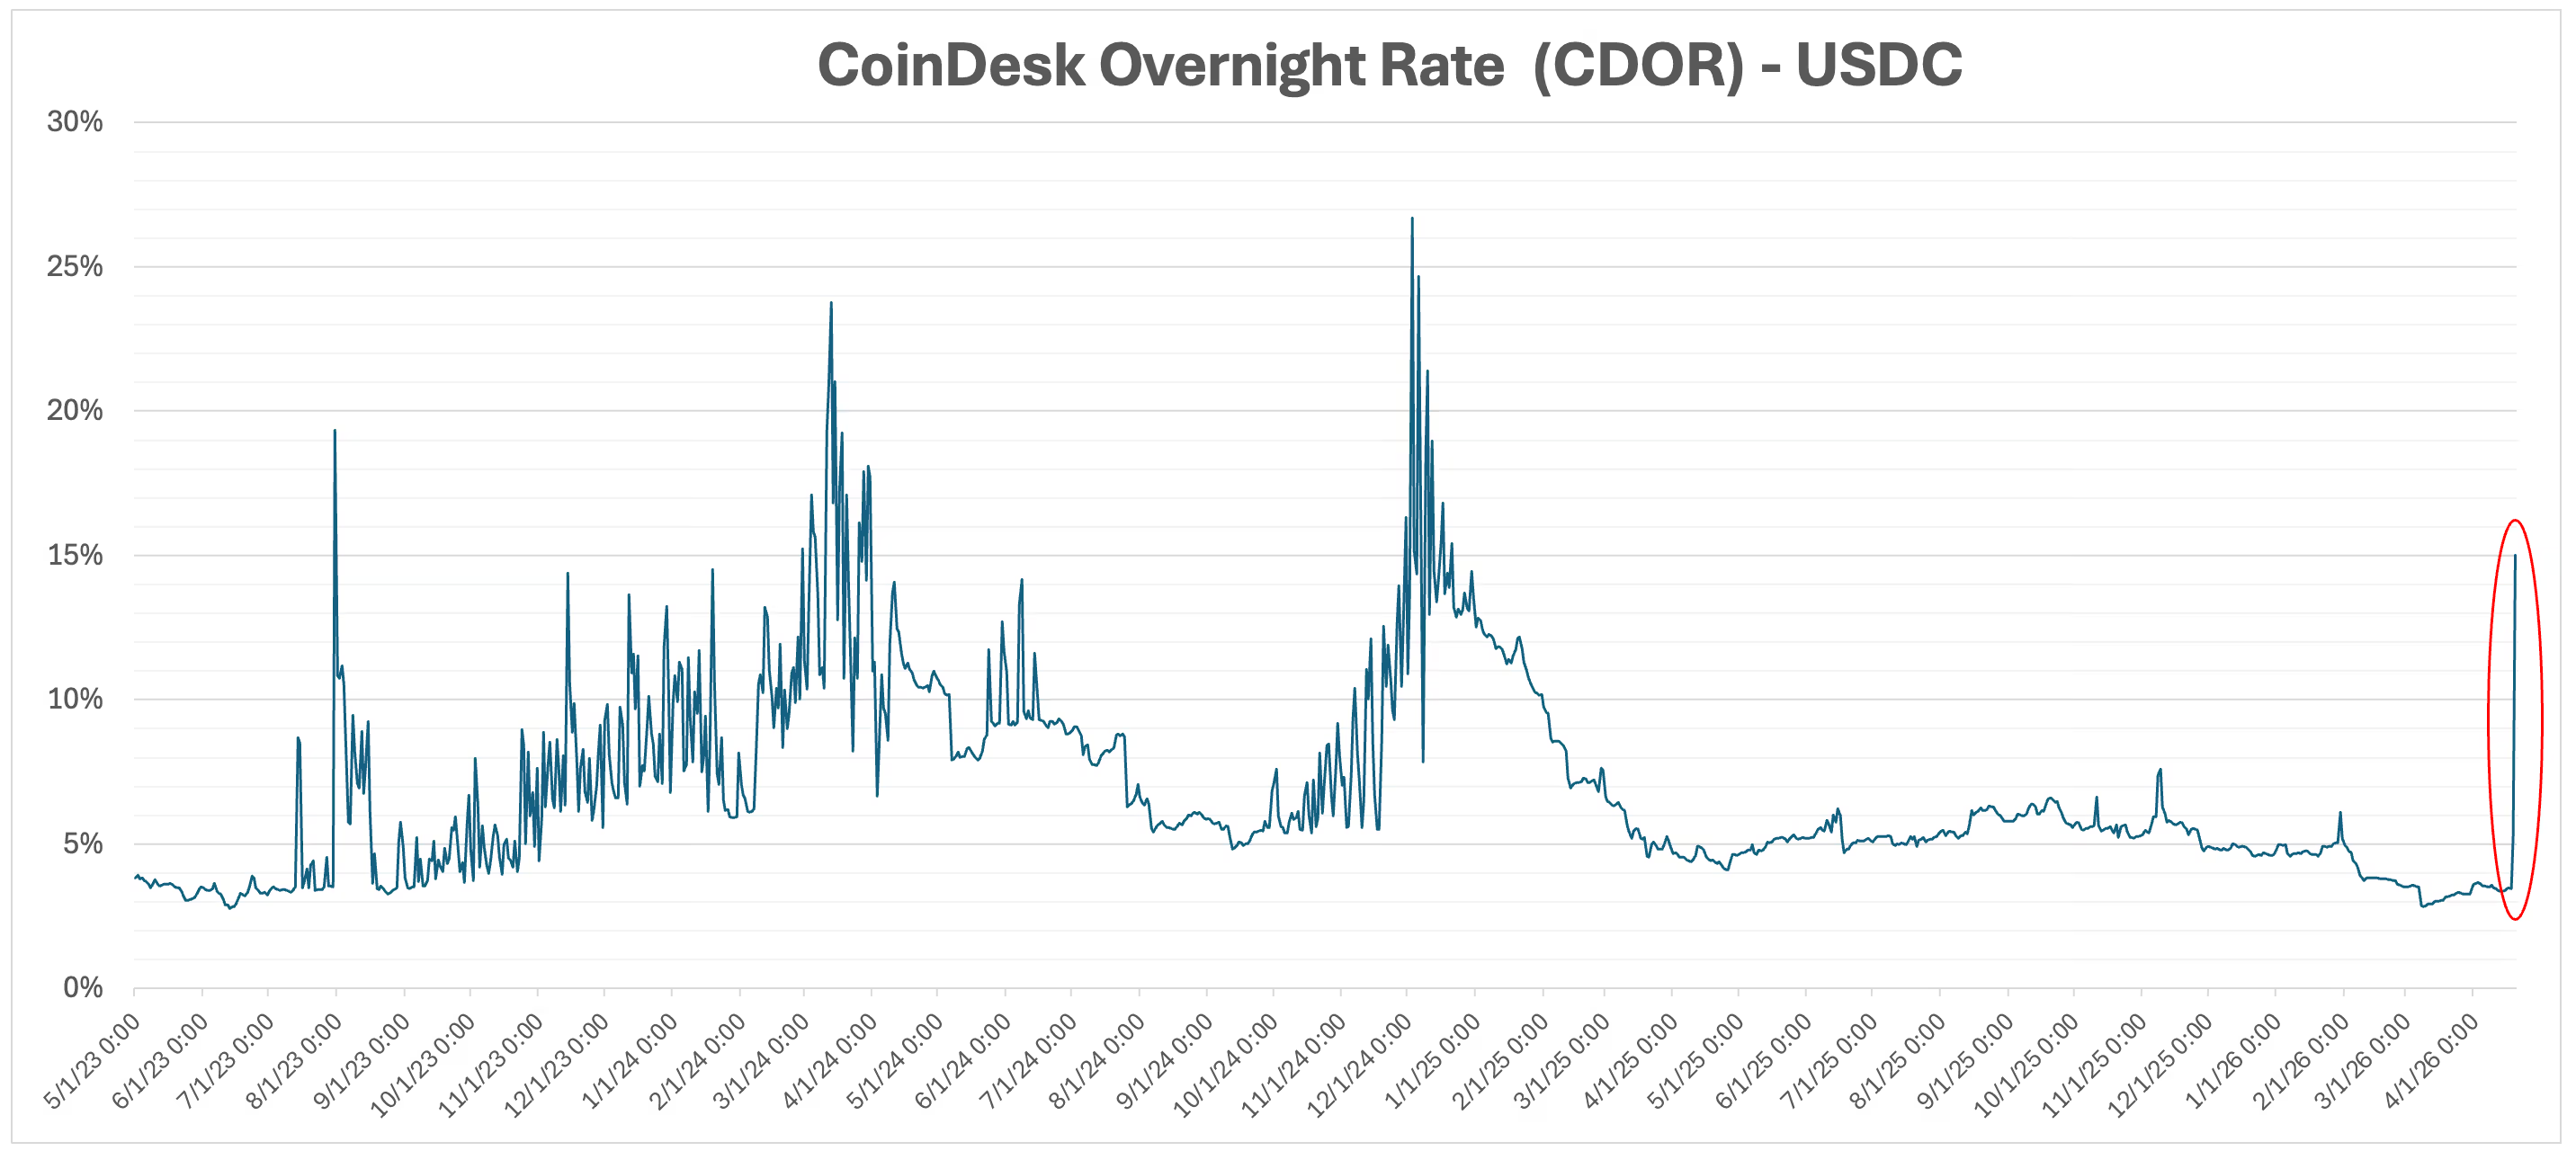
- CoinDesk’s overnight rate (CDOR) for USDC rose to the highest level since 2024, hitting 15%. CDOR measures stablecoin lending & borrowing activity on the Aave platform, which spiked following the weekend’s $290 million exploit on KelpDAO. A high interest rate reflects high demand.


TLDR:
- The CLARITY Act passed the House with 78 Democratic votes but remains stalled in the U.S. Senate after ten months.
- Binance clears nearly 40% of global spot crypto volume while Coinbase, the top U.S. exchange, handles only 6%.
- Senators Gallego and Torres are pushing crypto legislation to serve working-class Black and Latino constituents.
- Tokenization on public blockchains could extend American financial products to billions of people who lack U.S. brokerage access.
The CLARITY Act remains stuck in the U.S. Senate despite strong bipartisan support in the House. Mike Novogratz, founder of Galaxy Digital, is urging Democrats to act on crypto regulation.
He argues that inaction is pushing American crypto activity offshore. With 55 million Americans owning crypto, the stakes for U.S. financial leadership are high.
The longer the Senate delays, the more ground the U.S. cedes to rival financial hubs like Singapore, Dubai, and London.
Senate Inaction Drives Crypto Activity Offshore
The CLARITY Act passed the House last July with backing from 78 Democrats. However, the bill has not advanced in the Senate, leaving American crypto companies without clear legal footing. Novogratz points to this regulatory vacuum as a key driver of offshore activity.
Binance, which holds no formal headquarters but operates under an Abu Dhabi license, now clears nearly 40% of global spot crypto volume.
Meanwhile, Coinbase, the largest U.S.-based exchange, handles roughly 6%. The gap between these numbers tells the story clearly.
The U.S. poured $2.4 trillion into crypto markets in a single year — nearly four times the next country. Yet without domestic rules, that capital flows through foreign platforms.
Senator Kirsten Gillibrand crossed party lines in 2022 to introduce a bipartisan crypto framework. Writing on X, Novogratz noted that “the Senate’s job now is to finish it.”
Novogratz frames the delay not as a policy disagreement but as a posture problem. A vocal segment of the Democratic caucus views crypto legislation as a corporate giveaway. That view, he says, is producing the opposite of its intended effect — an unregulated offshore market.
Democratic Lawmakers and Tokenization Could Redefine U.S. Financial Power
Senator Ruben Gallego, Arizona’s first Latino senator, took up crypto policy directly because his constituents were asking about it. Many of them are working-class, Hispanic, or Black Americans with a growing interest in digital assets.
In a statement referenced by Novogratz, Gallego made his position clear: “If your constituents are showing interest in this, then you should show interest in it too.”
Representative Ritchie Torres, who grew up in public housing in the Bronx, represents one of the poorest congressional districts in America.
He has publicly argued that blockchain technology can “liberate the lowest income communities from the high fees of the traditional financial system.” Both lawmakers are actively legislating while much of the caucus remains on the sidelines.
Beyond domestic regulation, Novogratz sees a larger opportunity in tokenization. Public blockchains could allow American equities, Treasury bonds, and investment funds to reach billions of people globally who will never open a U.S. brokerage account. The CLARITY Act could make that possible.
Passing the bill, Novogratz argues, is not just a financial decision — it is a projection of American economic power. Countries like Singapore and the UAE are already moving.
Novogratz put it plainly: “Pass the CLARITY Act. Show up. This is how Democrats win. This is how America wins.” The U.S. has the capital markets, the demand, and the legal infrastructure to lead. What it needs now is legislative follow-through.

Trump Mobile’s T1 gold phone has gone 11 months without a single shipment. The company has collected roughly $59 million in $100 deposits from nearly 590,000 buyers.
The Trump Organization-backed wireless brand has rescheduled the launch at least four times since June 2025. Its latest preorder terms now say the device may never exist.
Trump Mobile Keeps Stalling
Don Jr. and Eric Trump introduced the T1 in June 2025. The company promised an August delivery for the $499 handset, billed as American-made.
That date passed quietly. Trump Mobile then rescheduled to November, then December. In late December, customer service blamed the federal government shutdown and said buyers should wait until “mid to late January.”
A Q1 2026 window came and went. The release date has since vanished from trumpmobile.com. The site now pushes refurbished Samsung phones and iPhones on its $47.45 “47 Plan,” a nod to Trump’s standing as the 45th and 47th president.
Current Site Status
- The homepage promotes the T1 with vague language
- Dedicated product pages (/products/t1-phone) return 404 Not Found.
- The waitlist page shows specs (6.78-inch AMOLED, cameras, Android) and illustrations only, with heavy disclaimers.
- The Preorder Deposit Terms (updated April 6, 2026) explicitly state that estimated ship dates, launch timelines, and production schedules are “non-binding estimates only” with “No Guarantee of Release, Delivery or Timing.”
“Nearly 600,000 people handed over their money and the fine print no longer promises they get it back or ever get the phone…And now the company quietly removed the guarantees on both delivery AND refunds,” remarked Mario Nawfal.
The handset has cleared Federal Communications Commission authorization, a U.S. launch prerequisite. No production timeline has been followed.
Fine Print Now Says the Phone May Never Arrive
On April 6, T1 Mobile LLC updated its deposit terms. The new language says a $100 deposit “does not guarantee that a Device will be produced or made available for purchase.”
Buyers are now paying for a “conditional opportunity” that the company may exercise at its sole discretion. Estimated ship dates, the document adds, count as “non-binding estimates.”
“I’m paying $100 for the chance to maybe give you more money in the future, if you decide to make the product that I’m paying for in the first place?” Carter Ryan, tech content creator known as CarterPCs, said on TikTok.
Refund requests still flow through customer service. The new document offers little legal obligation to honor them.
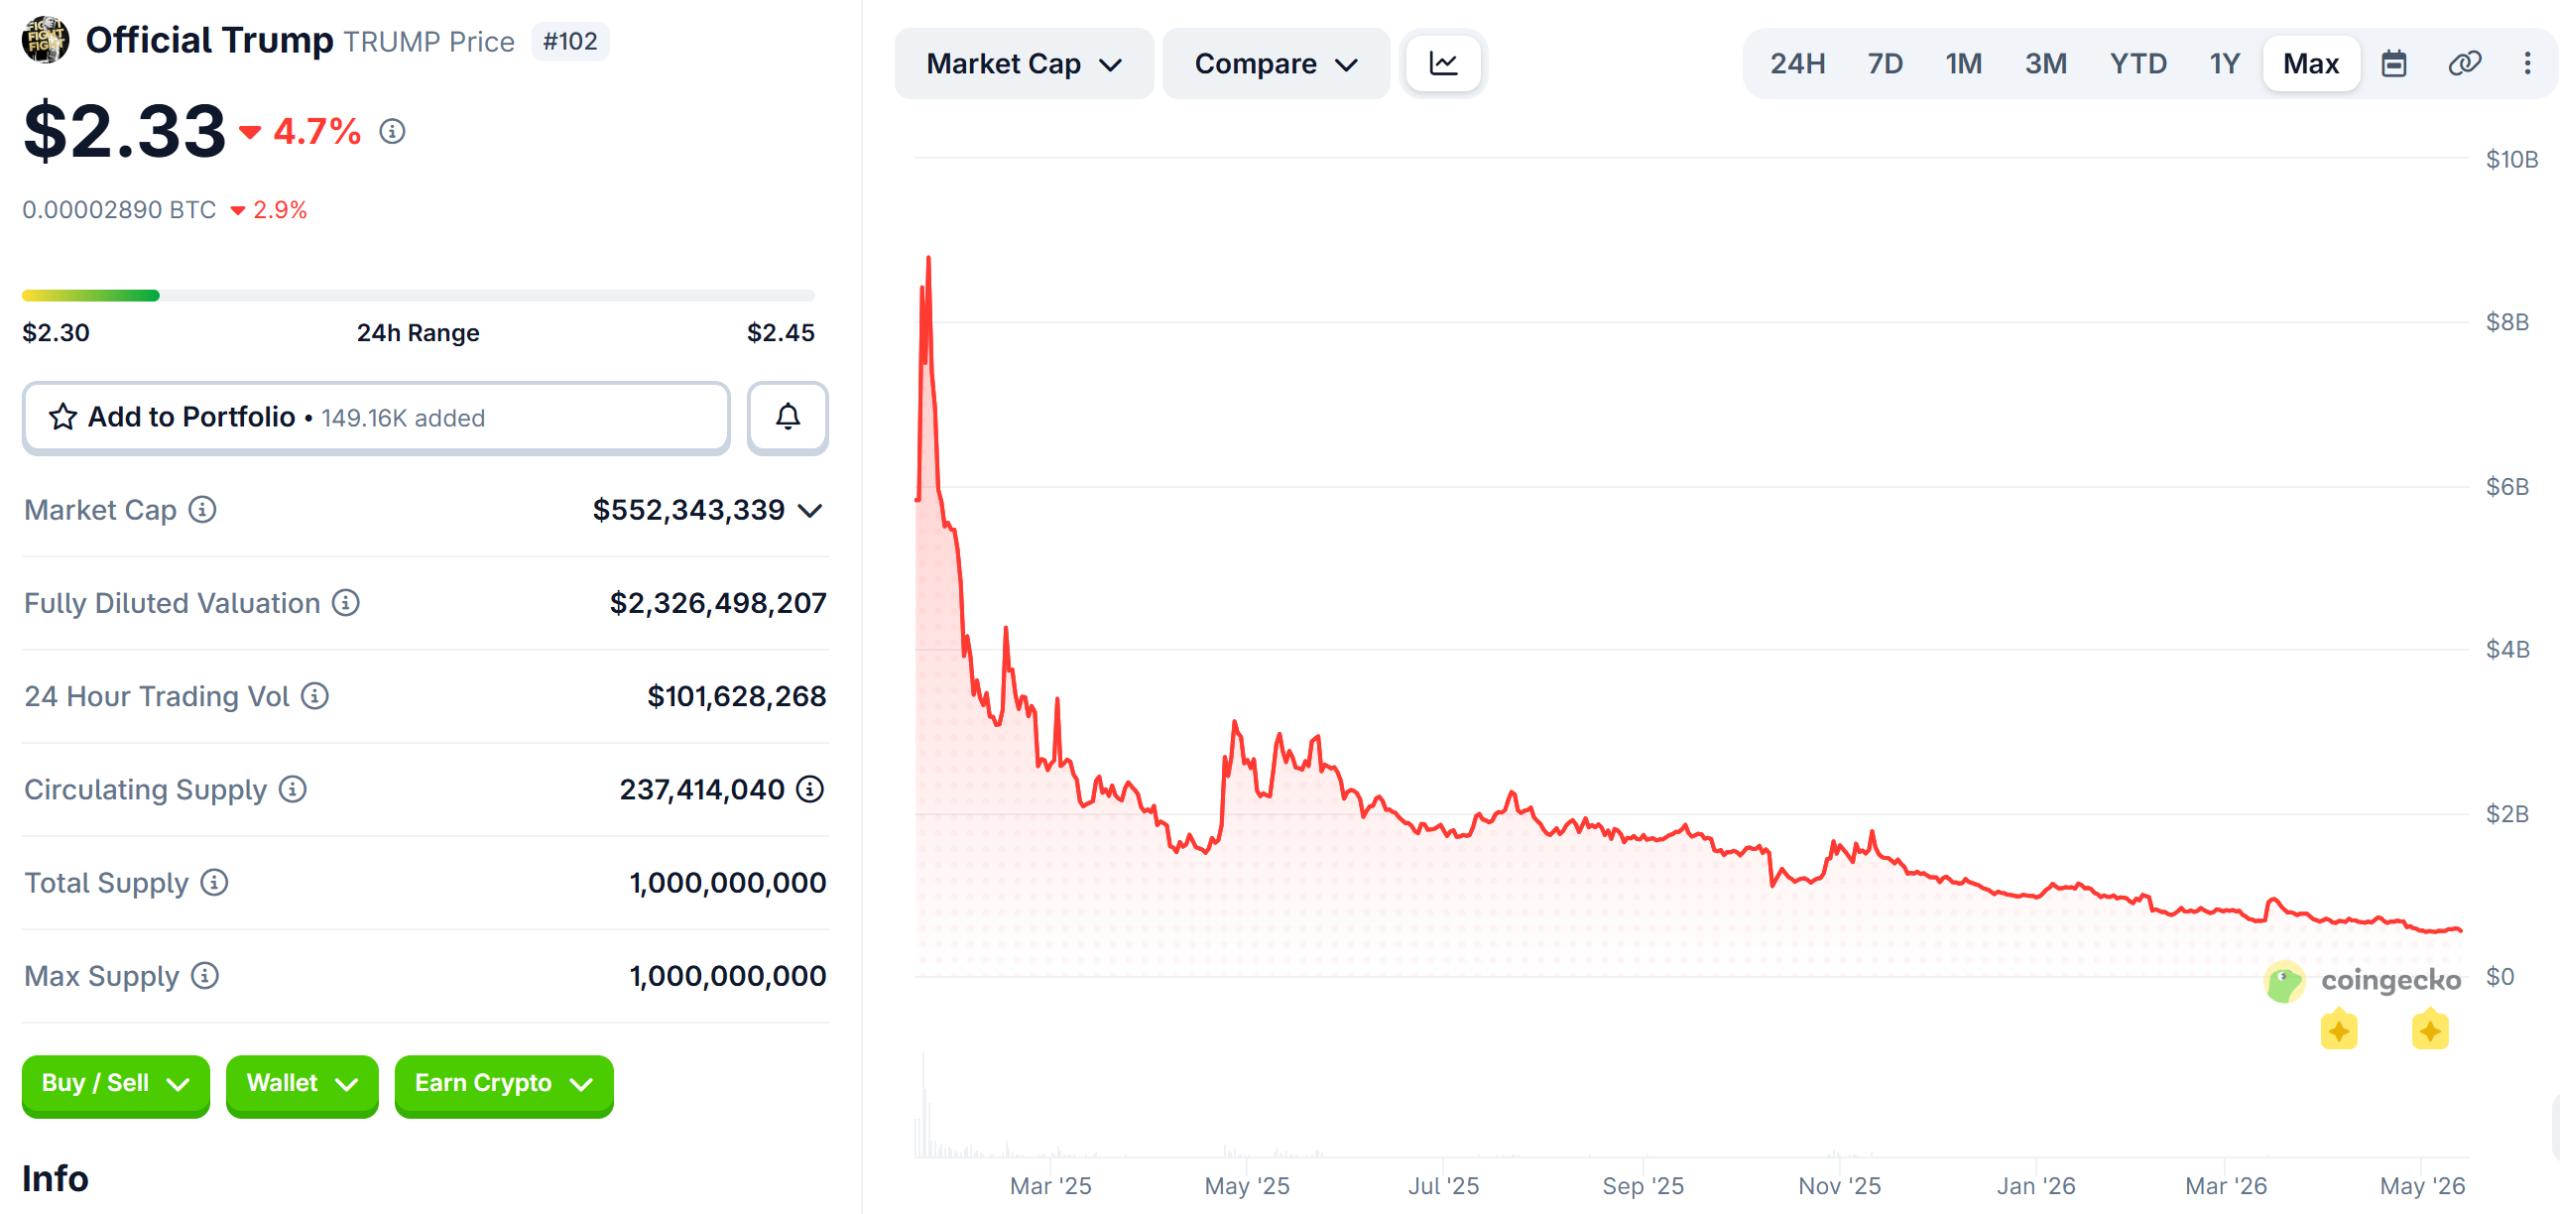
The pattern fits a year of Trump-branded ventures losing momentum. Official Trump (TRUMP), launched in January 2025, trades roughly 96% below its peak, and meme coin recovery odds look slim.

The FTC has also intensified scrutiny of misleading consumer marketing.
With $59 million collected and no production schedule on record, depositors are betting on goodwill from a company whose paperwork no longer promises anything.
The next move likely belongs to the CFPB or FTC, not the phone.
The post Trump Gold Phones Miss 4th Shipping Date, $59 Million Vanished? appeared first on BeInCrypto.


CryptoQuant signal has flipped Bitcoin into early bull territory for the first time since March 2023, analysts say.
Summary
- CryptoQuant’s Bull-Bear Market Cycle Indicator entered bullish territory on May 12, using its Profit and Loss Index to confirm the regime shift.
- The last confirmed green signal in March 2023 preceded a sustained bull run taking Bitcoin from $20,000 to above $73,000 by April 2024.
- Analysts flag March 2022 as the key exception, when the indicator briefly turned green before Bitcoin extended a deeper downtrend into 2023.
CryptoQuant’s Bull-Bear Market Cycle Indicator entered bullish territory on May 12 for the first time since March 2023, signaling what analysts describe as a potential transition away from bear-market behavior. The indicator is built on CryptoQuant’s Profit and Loss Index, which aggregates the MVRV ratio, NUPL, and a comparison of Long-Term Holder and Short-Term Holder SOPR ratios.
CryptoQuant head of research Julio Moreno wrote on X that the shift “often suggests that the worst phase of the correction has already passed and that market structure is beginning to recover.” Bitcoin was trading above $80,000 when the indicator flipped, having rebounded roughly 35% from February’s $60,000 lows.
Why analysts are not calling a confirmed bull market yet
The last confirmed green reading came in March 2023 and held continuously until August 2024, covering a period during which Bitcoin climbed from roughly $20,000 to an all-time high above $73,000. The March 2022 signal is the critical exception: the indicator briefly turned green that month before Bitcoin extended its downtrend well into 2023.
Mati Greenspan, founder of Quantum Economics, described the indicator as a regime-shift tool rather than a predictive crystal ball. “Historically, it has been most useful for identifying when bitcoin stops behaving like a bear-market asset,” he said. Sustained demand, liquidity, and price acceptance at higher levels are still required before the signal can be treated as validated.
Moreno flagged several secondary metrics showing exhaustion in the current setup. Bitcoin must decisively break the $82,000 resistance level, which has rejected multiple rally attempts, before the signal can be considered confirmed by price action.
What supporting data shows and what Hayes sees
Supporting the regime-shift thesis, April ETF inflows into spot Bitcoin products reached $2.44 billion, the strongest single-month institutional accumulation since October 2025. Glassnode’s RHODL ratio currently sits at 4.5, the third-highest reading in Bitcoin’s history, with the only comparable prior readings occurring at the 2015 and 2022 cycle bottoms.
Arthur Hayes, CIO of Maelstrom, argued separately that Bitcoin already found its cycle bottom at $60,000 earlier in 2026 and identified $90,000 as the threshold at which any rally would turn explosive toward the prior all-time high of $126,000. Bitget Wallet analyst Lacie Zhang said Bitcoin is “positioned for a potential breakout toward $85,000 to $90,000,” citing strong institutional support and continued ETF inflows.
Gold price is testing support near $4,650 after failing to break above the $4,772 target on the 4-hour chart. The price remains stuck in a tight range, with traders waiting for a breakout.
The asset is trading between key Fibonacci levels, while momentum signals stay neutral on both the daily and 4-hour charts. A move above $4,800 could strengthen the bullish trend again.
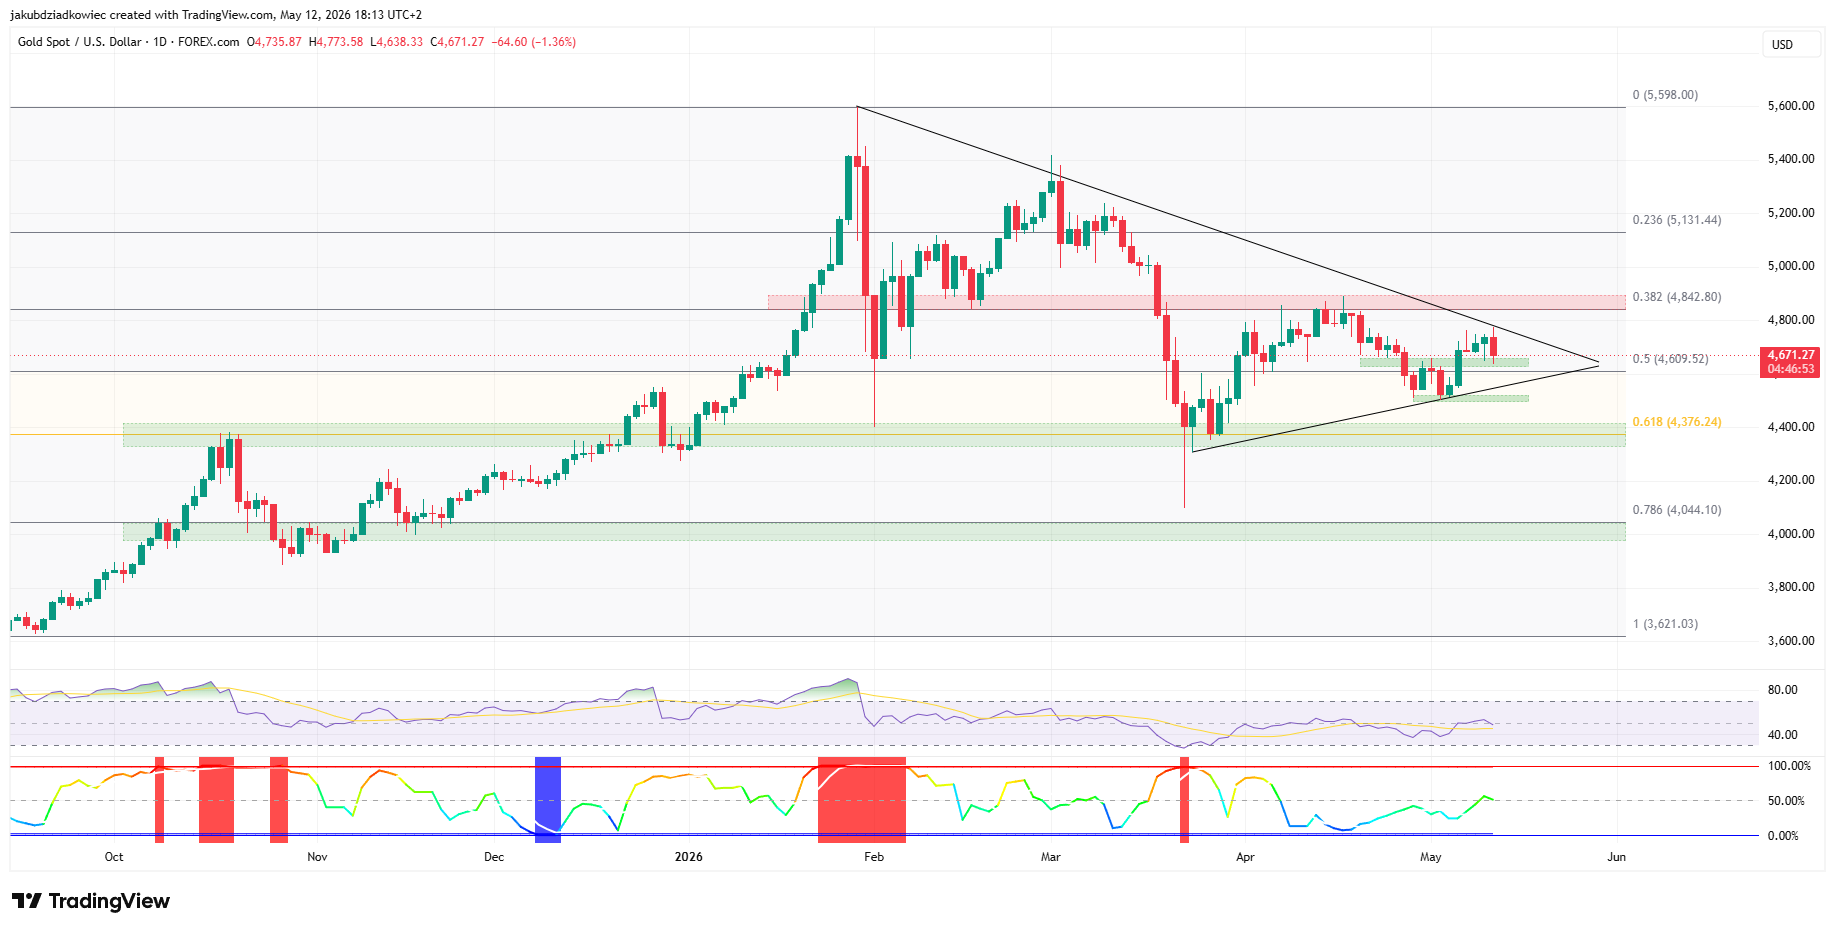
Gold Daily Chart Coils Inside Symmetrical Triangle
Gold (XAU/USD) is consolidating inside a symmetrical triangle on the daily timeframe. The 0.382 Fibonacci retracement at $4,842 caps the upside. The 0.618 retracement near $4,376 anchors the floor.
Price recently rejected the upper triangle band. It now sits closer to the support side, around $4,609. The Relative Strength Index (RSI) remains neutral.

Volatility looks balanced, with the Bollinger Band Width Percentile (BBWP) reading near 50%. The apex is approaching, signaling an imminent breakout in either direction.
A decisive close above the 0.382 Fibonacci would expose the 0.236 retracement at $5,131. A breakdown below the lower triangle boundary would shift attention back to $4,376.
The tight coil follows the January peak at $5,598 and the subsequent correction to the 0.618 Fibonacci. Until the triangle resolves, the daily setup remains directionally neutral.
Gold 4-Hour Chart Tests $4,650 After Bullish Target Reached
The 4-hour chart turned neutral after gold reached the prior bullish target at $4,772. The pair has since rolled into a correction and is testing the $4,650 demand zone for the second time.
A successful hold could clear the path toward $4,842, the long-term 0.382 Fibonacci. A failure at $4,650 would expose the next cushion near $4,500.
If that level breaks, the previously broken descending parallel channel could be retested. That zone aligns with the 0.618 Fibonacci near $4,376, echoing the setup seen during the prior channel breakout.

The RSI sits around 50, slipping but still neutral. Meanwhile, the Moving Average Convergence Divergence (MACD) prints taller red histogram bars. Bearish momentum appears to be building.
Traders watching short-term flows will likely treat $4,650 as the immediate pivot. A clean rejection from that area could attract dip buyers, while a strong close below it would arm sellers with a fresh continuation signal.
Gold Price Prediction: Cautious Setup
The wider 4-hour market structure adds context to the current setup. X user Sebi argues that gold has entered a corrective phase after its parabolic run to $5,600.
A succession of Lower Highs (LHs) has carved out a wide distribution range. Price recently stabilized around $4,666 after a deep liquidity sweep into the $4,000 demand zone.
The analyst maintains that the macro trend stays bullish. However, the immediate order flow looks heavy. Without a decisive reclaim of the $4,800 to $5,000 cluster, the local bias remains tilted lower.
“Gold is currently navigating a corrective phase following the parabolic run to $5,600… We need to see a decisive reclaim of the $4,800–$5,000 cluster to invalidate the local bearish bias and resume the expansion. Until then, expect further consolidation as momentum resets.”
The view aligns with the broader silver and gold setup, where reversal signals remain unconfirmed until upper resistance gives way. Traders may want to watch the $4,650 and $4,800 zones as the decisive trigger lines for the next directional move.

The post Gold Price Flashes Warning at $4,700: A Major Crash Coming? appeared first on BeInCrypto.
Crypto World
BeInCrypto Institutional Research: 15 Digital Asset Managers Leading Institutional Investment

Best Digital Asset Manager is a category within the BeInCrypto Institutional 100, an annual research-driven program recognising institutional digital asset excellence across 26 categories and six pillars.
This category sits under Pillar 2: Capital Markets & Infrastructure. The 15 firms below are listed alphabetically and are not ranked. A shortlist will be named in May 2026, with the winner announced at Proof of Talk in Paris on June 2–3, 2026.
Key Facts
- Long list: 15 firms across ETF issuers, tokenized fund operators, multi-jurisdiction ETP managers, crypto-native hedge funds, and public-market crypto exposure vehicles
- Initial pool: More than 30 firms screened; 15 advanced to the long list
- Scoring: 30% quantitative data · 50% Expert Council · 20% disclosed company data
- Criteria assessed: AUM, product breadth, regulatory status, distribution reach, tokenization and staking integration, fee competitiveness, institutional adoption, track record, reputation
- Data sources: SEC EDGAR, ETF flow trackers, issuer disclosures, VARA, FCA, FINMA, BaFin, MAS, MiCA-CASP registers, audited reports, PitchBook, Tracxn, and Crunchbase
| Firm | Asset Manager Sub-Segment | HQ | Reach | Top Product / Listing | Representative Work |
|---|---|---|---|---|---|
| 21Shares | Crypto ETP issuer | Zurich / New York | $11B+ AUM 55 listed products |
ARK 21Shares Bitcoin ETF (ARKB) Multi-jurisdiction ETP suite |
Acquired by FalconX in Nov 2025 ARKB live on NYSE Arca since Jan 2024 |
| BitMine Immersion Technologies | Public ETH treasury vehicle | Norwalk, CT, USA | 5.21M ETH $13.4B total holdings |
NYSE: BMNR MAVAN validator network |
Uplisted to NYSE in Apr 2026 Chaired by Tom Lee of Fundstrat |
| Bitwise Asset Management | US ETF + European ETP manager | San Francisco, USA | $4.5B+ combined AUM post-ETC Group US and European product footprint |
Bitwise Bitcoin ETF (BITB) BTCE physical Bitcoin ETP |
Acquired ETC Group in Aug 2024 European ETPs rebranded in Jan 2025 |
| BlackRock | ETF + tokenized fund manager | New York, USA | $12.5T+ AUM IBIT ~$80B+ AUM |
IBIT, ETHA, ETHB BUIDL tokenized money market fund |
IBIT became the fastest ETF to cross $80B 600+ institutional holders disclosed |
| CoinShares | European crypto ETP manager | St Helier, Jersey | $6B AUM 39 products |
Nasdaq: CSHR XBT Provider ETPs |
Listed on Nasdaq via $1.2B SPAC in Apr 2026 Operates a broad European ETP platform |
| Fidelity Investments | Vertically integrated asset manager | Boston, USA | $15T+ AUA platform FBTC $15B–$18B AUM |
Fidelity Wise Origin Bitcoin Fund (FBTC) FETH Ethereum fund |
Fidelity Digital Assets received OCC conditional charter Combines asset management with custody infrastructure |
| Franklin Templeton | ETF + tokenized fund manager | San Mateo, USA | $1.7T+ AUM BENJI deployed across 8+ chains |
EZBC, EZET FOBXX / BENJI tokenized money market fund |
Multi-chain tokenized money market fund pioneer Built digital asset products across ETFs and tokenized funds |
| Grayscale Investments | Legacy crypto asset manager | Stamford, CT, USA | $20B+ combined AUM GBTC and BTC mini products |
GBTC, BTC, ETHE, ETH, DEFG Single-asset crypto trusts |
Pioneered legacy trust-to-spot ETF conversions SOL and XRP filings remain pending |
| Hashdex | Multi-jurisdiction crypto index manager | Rio de Janeiro, Brazil | Brazil, US, EU, and Switzerland footprint Index-based product structure |
Hashdex Nasdaq Crypto Index US ETF DEFI product suite |
Brazilian-origin manager expanding globally Known for crypto index methodology |
| Invesco | Major asset manager with Galaxy JV | Atlanta, GA, USA | $1.8T+ AUM Galaxy-backed crypto product support |
Invesco Galaxy Bitcoin ETF (BTCO) Joint venture with Galaxy Digital |
Galaxy provides crypto trading and custody integration Extends Invesco’s ETF platform into digital assets |
| Nine Blocks Capital Management | Crypto-native hedge fund | Dubai, UAE | $180M+ AUM in USD fund AIMA member |
First VARA-licensed crypto hedge fund Market-neutral multi-strategy |
17%+ annualised returns since June 2021 Sharpe ratio above 2.1 |
| ProShares | Futures ETF + structured products issuer | Bethesda, MD, USA | Established ETF issuer Structured product depth |
BITO, BITI, EETH Futures-based crypto ETFs |
Launched first US Bitcoin futures ETF in 2021 BITO retains material AUM despite spot ETF competition |
| Purpose Investments | Spot crypto ETF pioneer | Toronto, Canada | Multi-crypto product range Toronto Stock Exchange listings |
Purpose Bitcoin ETF (BTCC) ETHH Ethereum product |
Launched the world’s first spot Bitcoin ETF in 2021 Entered spot crypto ETFs three years before US launch |
| VanEck | ETF, ETP, and digital asset equity manager | New York, USA | $110B+ total AUM US and European product footprint |
VanEck Bitcoin Trust (HODL) ETHV and DAM ETF |
Runs digital asset ETFs and mining equity exposure Maintains strong research and index framework |
| WisdomTree | Multi-jurisdiction ETP + tokenized funds | New York, USA | $100B+ AUM US and European distribution |
WisdomTree Bitcoin Fund (BTCW) WisdomTree Prime and WTSYX |
Operates crypto ETP suite across jurisdictions Built tokenized fund access through WisdomTree Prime |
About This List
The BeInCrypto Institutional 100 — Best Digital Asset Manager (2026 Long List) identifies firms running regulated institutional digital asset investment products, including spot ETFs, ETPs, tokenized money market funds, index funds, structured products, and public-market crypto exposure vehicles.
The category includes traditional asset managers expanding into crypto, dedicated crypto ETP issuers, multi-jurisdiction index providers, and selected edge-case inclusions such as public-market crypto treasury vehicles and regulated crypto hedge funds where the asset management surface is institutionally relevant.
Methodology
This category is evaluated under Track B of the BeInCrypto Institutional 100 methodology: 30% quantitative metrics, 50% Expert Council scoring, and 20% disclosed company data.
Assessment spans eight criteria: assets under management, product breadth, regulatory status, distribution reach, innovation through tokenization or staking integration, fee competitiveness, institutional adoption, and track record and reputation.
Data was verified using SEC EDGAR filings, ETF flow trackers including Farside and SoSoValue, issuer disclosures, regulatory registers including VARA, FCA, FINMA, BaFin, MAS and MiCA-CASP, audited reports, and private-market sources including PitchBook, Tracxn, and Crunchbase.
The post BeInCrypto Institutional Research: 15 Digital Asset Managers Leading Institutional Investment appeared first on BeInCrypto.
TLDR:
- Bitcoin surpassed $80,000 for the first time since January, briefly reaching $83K before pulling back slightly.
- Open interest surged from $48B to $58B while spot volumes hit two-year lows, signaling leverage-driven movement.
- Bitcoin ETF inflows added $623M, with Morgan Stanley’s new BTC ETF pulling $194M in its debut month alone.
- Tuesday’s CPI print and the Fed chair transition from Powell to Warsh are the next key macro triggers to watch.
Bitcoin’s return above $80,000 has drawn attention from market analysts, with trading firm Wintermute raising concerns about what is driving the move.
While the price milestone marks the first time BTC has traded at this level since January, Wintermute warns that the rally may not be as solid as it appears on the surface.
Short Squeeze Mechanics Behind Bitcoin’s Price Move
Bitcoin climbed to approximately $83,000 last week, breaking above its 200-day moving average for the first time in seven months.
The move coincided with a broader equity rally, with the Nasdaq gaining 4.5% and the S&P 500 rising 2.3% to fresh all-time highs. U.S. nonfarm payrolls also beat expectations, coming in at 115,000 against a consensus of 65,000.
Wintermute, however, pointed to the mechanics behind BTC’s price action as a reason for caution. Open interest in Bitcoin futures jumped from $48 billion to $58 billion over the past month. At the same time, spot trading volumes fell to two-year lows.
The firm noted on X: “BTC ground above $70k, nobody believed it, shorts piled in, got liquidated, and had to be covered by buying.” That dynamic, rather than fresh demand, appears to be what pushed prices higher.
Funding rates remain predominantly short, which means additional squeeze pressure could still push prices up. That said, Wintermute was clear that forced covering is not the same as genuine market conviction.
Institutional Flows Offer a More Constructive Long-Term View
Despite the short-term concerns, longer-term indicators tell a different story. Bitcoin ETF flows added $623 million during the period, and Morgan Stanley’s new BTC ETF pulled in $194 million in its first month without a single day of outflows. Exchange reserves remain at seven-year lows, pointing to steady accumulation by long-term holders.
Wintermute noted that whale accumulation and ETF inflows continue to absorb supply at current levels. However, the firm also observed that the institutional bid tends to reduce in size as prices move higher, which limits upside pressure over time.
The near-term focus now turns to macroeconomic events. Tuesday’s CPI release will offer the first clear look at how energy prices have fed into inflation.
Additionally, Federal Reserve Chair Powell’s term ends Thursday, with Kevin Warsh’s confirmation expected to follow.
Wintermute stated that if Bitcoin holds above $80,000 through a macro shock, that would serve as genuine confirmation of a trend change.
A selloff in line with equities, however, would suggest the short squeeze was the primary driver all along. RSI is currently entering overbought territory, and spot demand needs to step in for the rally to hold.
Bitcoin is trading at $80.8k, consolidating just above the $80k psychologcial threshold that defined the ceiling of this cycle’s correction for months. While the ascending channel’s higher boundary is still holding, the 100-day MA has been left well behind, and the price’s reaction to the current area where the 200-day MA is also converging will likely shape the crypto market trend in the upcoming weeks.
Bitcoin Price Analysis: The Daily Chart
On the daily timeframe, the market is once again testing the ascending channel’s upper trendline, which is also accompanied by the 200-day moving average around the $82k area. Below, the 100-day moving average is now flattening near $72k, which can be a significant signal for a mid-term bullish market structure shift. The asset is currently consolidating just below the channel’s upper boundary and the 200-day MA, while the RSI is holding in the 60–65 range after retracing from nearly overbought levels twice.
The $76k support zone created by a bullish order block at the base of the recent price push is the first level to defend on any pullback, while the ascending channel’s upper boundary and the 200-day MA just above it near the $80k–$82k area provide additional dynamic resistance above the current market price.
A daily close above this zone would be the single most significant structural development of this entire cycle, opening the path toward the $88k–$90k resistance band. On the other hand, losing the $76k low on a closing basis will be the first sign of a failing breakout.

BTC/USDT 4-Hour Chart
On the 4-hour chart, the steeper pink trendline inside the large channel has proven itself as the shorter-term dynamic support. The price has bounced cleanly off it near $76k before climbing above $80k. The RSI has cooled from its recent peak and is hovering around 50, which can point to a healthy reset that removes the short-term overbought risk without signaling any meaningful deterioration in trend, unless it falls deep below 50.
The short-term range is well-defined, as the ascending trendline and the $76k brown zone at the recent low define the support structure. A drop below these levels would expose the $70k-$72k demand zone. Meanwhile, the $82k supply zone and the upper channel boundary form the ceiling. A 4-hour close above $82k with RSI recovering toward 65 would signal the consolidation is resolving bullishly and hint at a rally toward the high $80k region.

Sentiment Analysis
The funding rate chart has just printed a couple of slightly convincing positive readings and ended the weeks-long stretch of deeply negative bars that accompanied the entire recovery from below $70k to current levels. This transition matters not just as a data point but as a market psychology signal.
The cohort of traders who were net short through the entirety of the recent rally has either been liquidated or capitulated, and fresh long positioning is now beginning to accumulate at prices above $80k.
The +0.003 reading remains modest in absolute terms, as during the 2025 bull run, funding regularly printed above 0.010. At current levels, there is significant room for long positioning to build before reaching the kind of overheated conditions that historically precede sharp corrections.
The practical implication is that the character of the rally is evolving, and what began as a short-squeeze-driven, disbelief-fueled recovery is transitioning into a phase where genuine long conviction is re-entering the market.

The post Bitcoin Price Analysis: BTC Maintains Key Support Levels, Will the Rebound Continue? appeared first on CryptoPotato.
TLDR:
- Ethereum’s Clear Signing standard now displays transactions in plain language instead of unreadable hex data.
- Blind signing has contributed to billions in ecosystem losses, prompting this open standard’s coordinated launch.
- ERC-7730 and ERC-8176 are the two core frameworks introduced to support human-readable transaction signing.
- Contributors include Ledger, Trezor, MetaMask, Fireblocks, and WalletConnect, coordinated by the Ethereum Foundation.
Ethereum has officially launched the Clear Signing open standard, marking a major step forward in transaction security.
The initiative converts unreadable hexadecimal data into plain, human-readable text during transaction approvals. The Ethereum Foundation coordinated the effort alongside key industry contributors.
Together, they aim to address one of the most persistent security vulnerabilities in the Ethereum ecosystem. Blind signing has cost the industry billions of dollars over the years.
What the Clear Signing Standard Brings to Ethereum
The Ethereum Foundation announced the launch via its official X account on May 12, 2026. The post stated that clear signing is now live as an open standard to end blind signing.
It described the development as a major upgrade to both user experience and transaction security on Ethereum.
Until now, signing a transaction often meant approving a string of unreadable hex data. This practice, known as blind signing, has contributed to billions in losses across the ecosystem. Users had no way to verify what they were actually approving before confirming transactions.
The new standard changes that by displaying transaction details in plain language. Instead of raw technical data, users now see clear descriptions of what each transaction does. This gives people better control and awareness before they confirm any on-chain action.
The Ethereum Foundation noted the effort builds on existing clear signing work already present in the ecosystem. In particular, it acknowledged the approach pioneered by Ledger as a foundation for this broader, unified standard.
Key Components and Contributors Behind the Initiative
Several prominent names in the crypto industry contributed to the Clear Signing initiative. Wallet and hardware contributors include Ledger, Trezor, MetaMask, WalletConnect, and ZKnox. On the security side, Cyfrin participated, while Fireblocks and Zama represented infrastructure. Sourcify and Argot contributed tooling support.
The standard introduces ERC-7730, which provides an open framework for human-readable transaction descriptions.
Alongside it comes a neutral, mirrorable descriptor registry for broader accessibility. An attestation framework under ERC-8176 allows auditors to verify the integrity of transaction descriptors.
Open developer tooling has also been released for wallets, protocols, and auditors to use. These tools make it easier for developers to integrate the standard across different platforms. The goal is to drive adoption and expand coverage across the Ethereum ecosystem consistently.
The Ethereum Foundation confirmed the work is ongoing and not a one-time release. Contributors will continue expanding coverage, refining tooling, and pushing for wider adoption.
As more wallets and protocols integrate the standard, blind signing risks are expected to decrease steadily across the network.


Kraken parent Payward will plug Franklin Templeton’s BENJI tokenized money market fund into its platform as collateral and cash management, letting clients earn yield on idle dollars on‑chain.
Summary
- Kraken’s parent company Payward has struck a strategic partnership with Franklin Templeton to bring tokenized stocks, yield products and the BENJI money market fund onto blockchain rails for institutional and select retail clients.
- Franklin Templeton’s BENJI tokenized money market fund will be integrated into Kraken’s platform as collateral and cash management infrastructure, while Payward’s xStocks framework — which has processed over $30 billion in transaction volume since launch — will co-develop new on-chain actively managed products.
- The deal lands as Franklin Templeton deepens its crypto footprint through the acquisition of crypto investment firm 250 Digital and the expansion of its Franklin Crypto division, signaling that one of the world’s largest asset managers is treating blockchain distribution as a core business line rather than a side project.
Kraken’s parent company Payward and Franklin Templeton have announced a strategic partnership to tokenize traditional financial products and distribute them through Kraken’s exchange infrastructure, according to reporting by Decrypt.
BENJI meets xStocks in a $30B tokenization partnership
The immediate deliverable is an integration of Franklin Templeton’s BENJI tokenized money market fund into the Kraken platform, where it will function as collateral and a cash management tool for institutional clients — effectively letting professional traders park idle capital in a yield-bearing, on-chain dollar instrument without leaving the Kraken ecosystem.
BENJI, which Franklin Templeton launched in 2021 on the Stellar blockchain before expanding to Polygon, Arbitrum and other networks, is one of the longest-running tokenized money market funds in the industry and a direct competitor to BlackRock’s BUIDL, which recently crossed $2.3 billion in assets under management. By embedding BENJI into Kraken’s collateral framework, Franklin Templeton gains a distribution channel that reaches both institutional desks and the exchange’s large retail base in jurisdictions where the product is available, while Kraken gains a regulated, yield-generating dollar instrument it can offer as an alternative to idle USDT or USDC balances sitting in trading accounts.
Beyond BENJI, the two firms plan to use Payward’s xStocks framework as the foundation for new on-chain actively managed products, making Franklin Templeton’s investment strategies available to institutions and retail investors in specific jurisdictions. xStocks, a previous crypto.news story noted, has processed over $30 billion in transaction volume since launching last year, building a tokenized equity infrastructure that now spans more than 50 U.S. stocks and ETFs and positions Kraken as one of the leading venues for on-chain traditional asset exposure outside of dedicated RWA platforms like Ondo Finance.
Franklin Crypto, 250 Digital and the race to own on-chain distribution
The Payward partnership is one piece of a broader push by Franklin Templeton to build a vertically integrated crypto and tokenization business. The firm has advanced its dedicated crypto division, Franklin Crypto, through the acquisition of crypto investment firm 250 Digital, adding research, portfolio management and distribution capabilities that complement its existing tokenized fund products. Franklin Templeton’s XRPZ spot ETF also led Monday’s XRP ETF inflow data with $13.6 million in a single day, making it the top product in a five-fund cohort that collectively pulled in $25.8 million — the largest daily XRP ETF inflow since January 5, 2026 — as covered in a recent crypto.news story.
Taken together, Franklin Templeton now has a spot XRP ETF, a tokenized money market fund on multiple chains, a crypto investment arm via 250 Digital, and a distribution partnership with one of the world’s largest crypto exchanges. That stack puts it in a structurally different position from most traditional asset managers, which are still debating whether to file a single tokenized product rather than building an end-to-end on-chain distribution network. As a crypto.news story on BlackRock’s second tokenized fund SEC filing with Securitize showed, the race among the largest traditional asset managers to own on-chain distribution is now openly competitive, with BlackRock, Franklin Templeton and Fidelity all moving simultaneously on tokenized product lines that would have been considered experimental as recently as 2023. For Kraken, landing Franklin Templeton as a product partner rather than just a custody client is the clearest signal yet that xStocks is evolving from a tokenized equity venue into a full institutional financial product platform with Wall Street names behind it.


Best Institutional Trading Infrastructure is a category within the BeInCrypto Institutional 100, an annual research-driven program recognising institutional digital asset excellence across 26 categories and six pillars.
This category sits under Pillar 2: Capital Markets & Infrastructure. The 15 firms below are listed alphabetically and are not ranked. A shortlist will be named in May 2026, with the winner announced at Proof of Talk in Paris on June 2–3, 2026.
Key Facts
- Long list: 15 firms across OMS/EMS platforms, prime brokerage, OTC desks, market makers, regulated venues, off-exchange settlement, and exchange-affiliated institutional product surfaces
- Initial pool: More than 30 firms screened; 15 advanced to the long list
- Order: Listed alphabetically, not ranked
- Scoring: 30% quantitative data · 50% Expert Council · 20% disclosed company data
- Criteria assessed: Client base and volume, venue connectivity, execution quality, product breadth, regulatory licensure, settlement framework, institutional reputation, innovation signal
- Data sources: FCA, NYDFS, FINMA, BaFin, MAS, SFC, MiCA-CASP registers, audited filings, issuer disclosures, partnership announcements, KBRA/Kroll, PitchBook, Tracxn, and Crunchbase
| Firm | Trading Infra Sub-Segment | HQ | Reach | Top Licensure / Platform | Representative Work |
|---|---|---|---|---|---|
| B2C2 | Institutional OTC and algorithmic execution | London, UK | SBI Holdings majority-owned Offices in London, New York, Tokyo, Singapore |
FCA, NYDFS BitLicense, Luxembourg VA EU MiFID framework |
24/7 OTC across spot, derivatives, and structured products Launched Solana stablecoin settlement infrastructure |
| Binance Institutional | Exchange-affiliated institutional surface | Dubai, UAE | Largest crypto exchange by global volume SAFU reserves above $1B |
VARA Dubai licence Multi-jurisdiction VASP footprint |
OTC desk, broker program, custody integrations, and liquidity programs Institutional surface assessed; retail exchange core excluded |
| Bitget | Exchange-affiliated institutional surface | Seychelles | 120M+ users at parent level Global exchange and broker ecosystem |
Multi-jurisdiction VASP footprint Bitget PRO institutional surface |
Universal Exchange framework across spot, derivatives, and tokenized TradFi Institutional surface assessed; retail exchange core excluded |
| Boerse Stuttgart Digital | European regulated exchange infrastructure | Stuttgart, Germany | Parent group is a major European retail exchange operator Institutional custody and trading infrastructure |
BaFin and MiCAR-CASP authorised BSDEX and institutional custody stack |
Combines regulated German trading venue and custody infrastructure Serves institutional access through Boerse Stuttgart Digital Custody |
| Cumberland (DRW) | TradFi prop firm crypto desk | Chicago, USA | Combines a regulated German trading venue and custody infrastructure Serves institutional access through Boerse Stuttgart Digital Custody |
TradFi-regulated proprietary trading firm Institutional crypto OTC desk |
Provides institutional crypto OTC and market-making services Extends DRW’s trading infrastructure into digital assets |
| FalconX | Full-stack institutional prime broker | San Mateo, CA, USA | $2T+ cumulative trading volume 2,000+ institutional clients |
Multi-jurisdiction regulatory footprint EMS, OMS, credit, and clearing platform |
Acquired 21Shares, closed Nov 2025 Builds trading, credit, clearing, and asset-management access under one roof |
| KuCoin Institutional | Exchange-affiliated institutional surface | Providenciales, Turks and Caicos | 40M+ users at parent level 1,000+ broker and fintech partners |
AUSTRAC registration MiCAR-CASP via KuCoin EU |
OES integrations with BitGo, Cactus, and Ceffu MirrorX Institutional surface assessed; retail exchange core excluded |
| LMAX Digital | Institutional-only matched venue | London, UK | Sub-millisecond latency LD4 and NY4 co-location |
FCA-regulated venue FIX 4.4 connectivity |
Institutional-only central limit order book Part of LMAX Group’s multi-asset venue infrastructure |
| Nonco | FX-style bilateral institutional crypto | Mexico City, Mexico | $5B+ monthly trading volume Founded in 2023 |
Multi-jurisdiction operating footprint Bilateral streaming liquidity model |
FX On-Chain protocol launched on Avalanche Settled derivatives transaction using FOBXX/BENJI |
| OSL Digital | Asia institutional platform | Hong Kong | OSL Group listed on HKEX Core operating income up 150% in 2025 |
Hong Kong SFC licence Institutional trading and custody platform |
Completed Banxa take-private in Jan 2026 Combines block OTC liquidity with segregated custody |
| Ripple Prime | Multi-asset prime broker | New York, USA | 300+ institutional clients $3T annual clearing pre-acquisition |
SEC broker-dealer and CFTC FCM FINRA, SIPC, CME, and FICC member |
Acquired by Ripple for $1.25B, closed Oct 2025 Received KBRA BBB investment-grade rating in Apr 2026 |
| Talos | Institutional EMS, OMS, and SOR | New York, USA | 60 connected venues Asset managers representing $21T AUM |
Institutional technology platform Execution, routing, and portfolio infrastructure |
DRW was founded in 1992 Multi-asset institutional trading coverage |
| Taurus Group | Swiss institutional infrastructure | Geneva, Switzerland | Multi-bank European client base Backed by major financial institutions |
FINMA-licensed SOC 2 Type II and ISO 27001 |
T-PROTECT custody, T-DX exchange, and T-VENTURE issuance Series B led by Credit Suisse, now UBS |
| Virtu Financial (Crypto) | TradFi market maker extending to crypto | New York, USA | NASDAQ: VIRT Major global electronic market maker |
SEC, FINRA, and multi-jurisdiction TradFi licences Crypto desk extension |
Applies TradFi execution technology to digital assets Operates across equities, FX, fixed income, and crypto |
| Wintermute | Market maker and institutional OTC platform | London, UK | FCA-affiliated group structure Wintermute Asia is regulated separately |
FCA-affiliated group structure Wintermute Asia regulated separately |
NODE institutional trading platform Added tokenized gold OTC trading and crude oil CFDs |
About This List
The BeInCrypto Institutional 100 — Best Institutional Trading Infrastructure (2026 Long List) identifies firms that provide the trading infrastructure institutional clients use to access digital asset markets. This includes order management, execution management, smart order routing, transaction cost analysis, risk management, settlement, prime brokerage, OTC liquidity, and off-exchange settlement.
Coverage spans pure-play infrastructure firms, multi-asset prime brokers, institutional market makers, regulated European and APAC venues, and exchange-affiliated institutional product surfaces. Core retail exchange spot and derivatives platforms are not scored in this category. For Binance Institutional, KuCoin Institutional, and Bitget, the review is limited to institutional surfaces such as OTC desks, broker programs, OES, custody integrations, and RWA collateral frameworks.
Methodology
This category is evaluated under Track B of the BeInCrypto Institutional 100 methodology: 30% quantitative metrics, 50% Expert Council scoring, and 20% disclosed company data.
Assessment spans eight criteria: client base and volume, venue connectivity, execution quality, product breadth, regulatory licensure, risk and settlement framework, institutional reputation, and innovation signal.
The disclosed data weighting reflects the limited public visibility into institutional client counts, OMS/EMS volume, prime brokerage flows, and venue connectivity depth. Nominee-submitted data gives the Expert Council additional verifiable inputs for otherwise opaque infrastructure metrics.
Data was verified using regulatory registers, audited filings, issuer disclosures, partnership announcements, third-party rating agencies, including KBRA and Kroll, and private-market sources, including PitchBook, Tracxn, and Crunchbase.
The post BeInCrypto Institutional Research: 15 Firms Building Crypto Trading Infrastructure appeared first on BeInCrypto.

Some of UK’s most popular sandwiches contain ‘alarmingly high’ levels of salt
Kishore & Rakesh Biyani fined for Future Retail disclosure lapses
Novogratz to Democrats: Pass the CLARITY Act or Hand Crypto’s Future to Foreign Rivals
Manchester United reach agreement with Casemiro over contract clause amid transfer speculation

US brings back mandatory military draft registration

Steven Gerrard disagrees with Gary Neville over ‘shock’ Chelsea and Arsenal claim | Football


-
 Crypto World5 days ago
HarrisX Poll Found 52% of Registered Voters Support the CLARITY Act
-

 Fashion4 days ago
Weekend Open Thread: Marianne Dress
-

 Crypto World6 days ago
Upbit adds B3 Korean won pair as Base token gains Korea access
-
 NewsBeat6 days ago
NCP car park operator enters administration putting 340 UK sites at risk of closure
-

 Fashion1 day ago
Coffee Break: Travel Steam Iron
-

 Fashion2 days ago
What to Know Before Buying a Curling Wand or Curling Iron
-

 Tech3 days ago
Auto Enthusiast Carves Functional Two-Stroke Engine from Solid Metal
-

 Politics1 day ago
What to expect when you’re expecting a budget
-

 Politics4 days ago
Politics Home Article | Starmer Enters The Danger Zone
-
 Business4 days ago
Ignore market noise, India’s long-term story intact, say D-Street bulls Ramesh Damani and Sunil Singhania
-

 Tech2 days ago
GM Agrees To Pay $12.75 Million To Settle California Lawsuit Over Misuse Of Customers’ Driving Data
-

 Crypto World6 days ago
BlackRock CEO Larry Fink Discusses a New Asset Class
-
 Sports7 days ago
NBA playoff winners and losers: Austin Reaves is not loving Lakers vs. Thunder matchup, but Chet Holmgren is
-

 Entertainment6 days ago
Sarah Paulson Called Out For Met Gala ‘Hypocrisy’
-

 Entertainment5 days ago
General Hospital: Ric & Ava Bombshell – Ric’s Massive Secret Exposed!
-

 Politics5 days ago
Simon Cowell Says He Was ‘Horrible’ To Susan Boyle During BGT Audition
-

 Crypto World6 days ago
Robinhood says Wall Street is building onchain
-

 Entertainment6 days ago
Bold and Beautiful Early Spoilers May 11-15: Steffy Revolted & Liam Overjoyed!
-

 Sports6 days ago
UEFA Champions League final schedule, teams, venue, live time and streaming | Football News
-

 Tech7 days ago
Apple and Samsung are dominating smartphone sales so thoroughly that only one other company makes the top 10
You must be logged in to post a comment Login