
Crypto World
Canaccord slashes price target as stock tumbles to multi-year low


With crypto winter clearly having set in, bulls are now left looking for signs that the bearishness has become so embedded that a bottom might form.
One case in point might be a note from Canaccord’s Joseph Vafi on Wednesday, slashing his price target on Strategy (MSTR) by a whopping 61% to $185 from $474.
Vafi, who lifted his outlook on Strategy as recently as November (to that $474 level), still maintains a buy rating on the stock, and his new $185 target suggests about 40% upside from last night’s close of $133.
Strategy is now down 15% year-to-date, 62% year-over-year, and 72% from its record high in November 2024.
Bitcoin, said Vafi, is in the midst of an “identity crisis,” still fitting the profile of a long-term store of value but increasingly trading like a risk asset. That tension came into focus during October’s crypto flash crash, when forced liquidations accelerated selling.
Though frequently cast as “digital gold,” bitcoin has failed to keep pace with the recent surge in precious metals, he continued. As gold has climbed on geopolitical tensions and macro uncertainty, bitcoin has lagged, underscoring its ongoing dependence on liquidity and risk appetite rather than safe-haven demand.
Strategy is built to weather volatility, the report said. The company holds more than $44 billion in bitcoin against roughly $8 billion in convertible debt, including a $1 billion tranche puttable in 2027 that remains in the money. Preferred dividends are manageable through modest share issuance, even with MSTR’s market cap no longer commanding much of a premium to the value of its BTC holdings.
Quarterly results are coming this week, but they have become largely immaterial given Strategy’s near-complete dependence on BTC, Vafi continued. A sizable unrealized loss tied to bitcoin’s fourth-quarter selloff is expected.
Vafi’s new $185 target assumes a 20% rebound in bitcoin prices and a recovery in the company’s mNAV to about 1.25x.
Read more: ETF that feasts on carnage in bitcoin-holder Strategy hits record high


Former Kalshi employees are raising capital for 5c(c) Capital, a venture firm focused on prediction market infrastructure.
Two early Kalshi employees are raising up to $35 million for what may be the first venture fund dedicated to prediction market startups, according to a pitch document seen by Fortune.
The fund, called 5c(c) Capital, is led by Adhi Rajaprabhakaran, the second trader hired at Kalshi’s affiliated market maker, and Noah Zingler-Sternig, Kalshi’s former head of operations, Fortune reported. The fund’s name references Section 5c(c) of the Commodity Exchange Act, the clause that grants the CFTC oversight of event contracts offered by Designated Contract Markets.
Notably, Kalshi CEO Tarek Mansour and Polymarket CEO Shayne Coplan, whose companies are locked in a multibillion-dollar valuation war and have a well-documented public rivalry, have both invested in the fund.
Other backers include Marc Andreessen through Moneta Luna, Ribbit Capital founder Micky Malka, and former Multicoin Capital managing partner Kyle Samani. Bloomberg reported that the fund has more than 20 investors.
The fund plans to back roughly 20 companies over the next two years, targeting market makers, prediction market index providers, and other infrastructure-layer businesses, per Fortune.
The launch comes as prediction market valuations have surged. Kalshi raised $1 billion at a $22 billion valuation in a round led by Coatue Management, roughly doubling its $11 billion November mark, as The Defiant reported. Polymarket is eyeing a similar valuation of around $20 billion, according to the Wall Street Journal.
This article was written with the assistance of AI workflows. All our stories are curated, edited and fact-checked by a human.
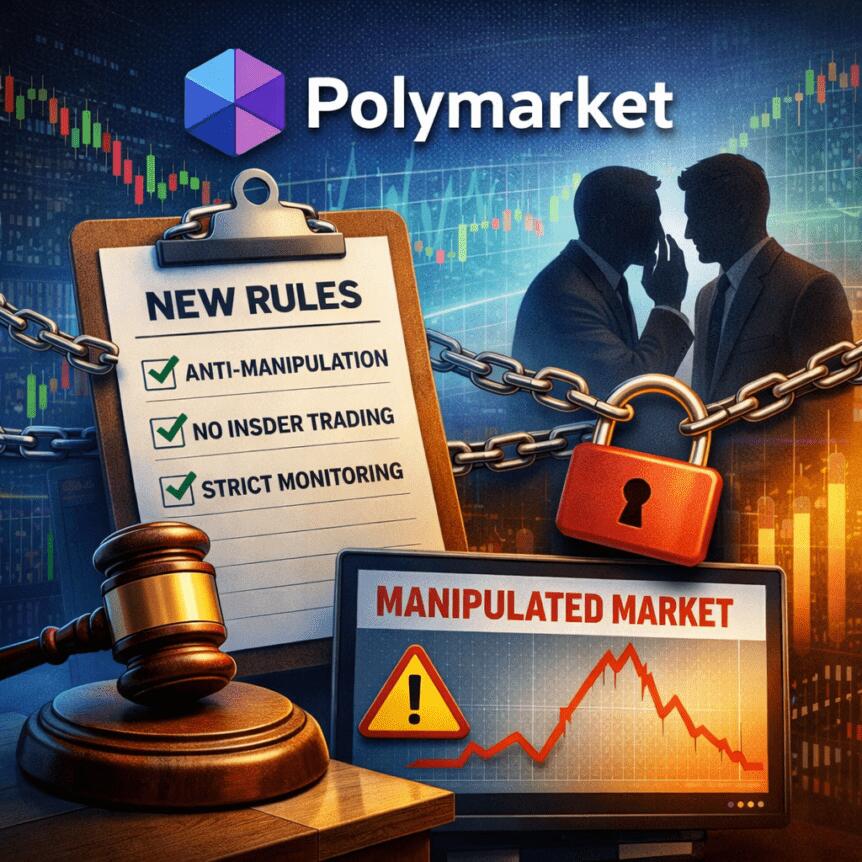
Polymarket has rolled out a refreshed set of market integrity rules for its prediction platforms, tightening standards to align with regulatory expectations and bolster its status as a regulated trading venue. The update covers both its global decentralized finance platform and its US exchange, which operates under oversight by the Commodity Futures Trading Commission (CFTC). The move comes as regulators and lawmakers intensify scrutiny over risks linked to insider trading, market manipulation, and the use of event-based contracts.
Polymarket described the overhaul as a comprehensive upgrade to market design, settlement criteria, and data sourcing, while expanding its monitoring and surveillance to detect suspicious activity. The company also signaled a pragmatic stance by curbing certain market types that it views as easier to manipulate or ethically fraught. The changes underscore an industry-wide push to improve integrity as prediction markets gain broader attention from regulators and the public.
In a separate note, Polymarket highlighted a recent internal action in which it banned and reported users who pressured an Israeli journalist to amend a news article about an Iranian missile strike, a case that drew significant attention to how trading platforms may be used to influence reporting or profit from real-world events. More on that episode is discussed below as part of the broader context for the policy shift.
Key takeaways
- Polymarket updates its market integrity rules for both its DeFi platform and US exchange, with CFTC oversight reaffirmed as a central feature.
- New measures include stricter market design, clearer outcome-resolution criteria, better-defined data sources, and enhanced surveillance to flag suspicious activity.
- The platform will limit certain markets that are deemed highly manipulable or ethically sensitive, signaling a targeted risk-management approach.
- The move arrives amid ongoing regulatory scrutiny and a series of partnerships aimed at legitimizing prediction markets, including a high-profile MLB deal and an explicit integrity framework with the CFTC.
Polymarket’s rule overhaul and regulatory alignment
Polymarket’s leadership framed the rule updates as a necessary step toward stronger compliance and greater transparency for participants. By detailing resolution criteria—how and when outcomes are settled—and tying those outcomes to verifiable data sources, the platform aims to reduce disputes and ambiguity that have historically plagued event-based markets. The enhanced monitoring and surveillance functions are designed to detect patterns indicative of manipulation or insider trading, a concern repeatedly raised by policymakers as prediction markets expand.
Crucially, the update frames Polymarket’s operations in the context of its CFTC oversight for its US-facing exchange. While the global DeFi platform operates with broader jurisdictional considerations, the company emphasizes that its compliance program is built to meet regulatory expectations across its product spectrum. The policy shift is portrayed not merely as a cosmetic update but as a foundational change intended to support sustainable growth in a space that regulators are still learning to evaluate.
In the same vein, Polymarket has signaled limits on markets that could invite manipulation or raise ethical red flags. While the specifics of restricted categories were not disclosed in comprehensive detail, the stance aligns with broader regulatory caution around high-stakes bets tied to real-world events and public interest.
Regulatory push, partnerships, and the market backdrop
The timing of Polymarket’s policy refresh sits within a broader pattern of regulatory scrutiny and industry responses. Prediction markets have surged in popularity, attracting large communities of traders betting on real-world developments. That momentum has attracted investment, with reports suggesting Polymarket raised hundreds of millions and eyed a multi-billion-dollar valuation in a recent fundraising phase. Still, the regulatory environment remains unsettled in many jurisdictions, with several US states taking action against prediction platforms accused of functioning as unlicensed gambling services.
Publicly, Polymarket has pointed to partnerships as a pathway to legitimacy. Notably, Major League Baseball (MLB) announced a deal with Polymarket, paired with a separate CFTC-focused agreement aimed at “integrity protections.” The collaboration signals regulators’ interest in embedding guardrails and oversight into prediction-market ecosystems while enabling mainstream adoption through established institutions. In parallel, coverage of the broader market has included attention to how these platforms handle ethics and fairness, especially as they scale and attract mainstream users.
As a backdrop, Polymarket also faced controversy tied to its markets. A widely reported incident involved a small cluster of accounts that reportedly generated substantial profits by timing bets related to U.S. strikes on Iran. Bloomberg’s coverage noted that the six accounts were newly created in February and had limited prior betting activity, sparking concerns about possible insider information advantages and the fairness of rapid-fire conclusions. While not a formal verdict on manipulation, the episode has intensified calls for stronger guardrails and clearer compliance standards across prediction markets. For readers tracking this thread, the Bloomberg report provides a contemporary data point illustrating the tensions between high profitability and the need for robust market integrity tools.
These developments occur alongside a broader debate about the accountability of platform operators in DeFi and hybrid models. Critics argue that even well-intentioned systems can be exploited to shape outcomes or reward certain information asymmetries, while proponents contend that regulated, transparent marketplaces can outperform opaque or unregulated alternatives. The latest Polymarket update is a tangible effort to tilt the balance toward the former, with concrete reforms designed to reduce manipulation vectors and improve user confidence.
What readers should watch next
Polymarket’s integrity refresh offers a clearer blueprint for what investors and users should expect from regulated prediction markets: stronger governance around how bets are structured, settled, and monitored; explicit data provenance; and a deliberate stance on market types that pose outsized manipulation risk. The company’s ongoing partnerships with sports leagues and regulators will be critical to watch, as they may set a precedent for how other platforms negotiate the line between innovation and compliance.
Equally important is the evolving regulatory landscape in the United States and abroad. As enforcement actions and legislative proposals continue to shape the permissible scope of prediction markets, continued transparency from operators and a demonstrated commitment to preventing abuse will determine whether these platforms can sustain momentum and broader participation.
In the near term, observers will be looking for concrete outcomes from Polymarket’s enhanced compliance framework: measurable reductions in manipulation indicators, clearer settlement standards, and more robust disclosures around data sources. The next wave of updates could also reveal how the company balances market openness with risk controls—a balance that will influence investor confidence, user participation, and the overall trajectory of event-based prediction markets.
As the market evolves, readers should keep an eye on regulatory announcements, enforcement actions by state authorities, and any clarifications from the CFTC or other regulators regarding the treatment of prediction markets. The convergence of corporate partnerships, formal integrity protocols, and regulatory oversight marks a pivotal moment for the sector—one that could shape how these platforms exist within the broader crypto and financial ecosystem.

TLDR
- OpenAI is in advanced talks to purchase electricity from Helion Energy under a long-term supply framework.
- The proposed agreement would grant OpenAI 12.5% of Helion’s projected power output.
- The allocation could reach 5 gigawatts by 2030 and expand to 50 gigawatts by 2035.
- Helion raised $425 million in January 2025, bringing its valuation to $5.425 billion post-money.
- Sam Altman stepped down as Helion’s board chair and recused himself from the OpenAI discussions.
OpenAI is negotiating a large electricity purchase from Helion Energy to secure a long-term power supply. The proposed framework would allocate 12.5% of Helion’s projected output to OpenAI. The talks reflect a direct move toward energy procurement as computing demand accelerates.
OpenAI and Helion outline multi-gigawatt power framework
OpenAI is in advanced discussions to purchase electricity from Helion Energy, according to Axios. The proposed structure would grant OpenAI 12.5% of Helion’s future output. That share would equal 5 gigawatts by 2030 under current projections.
Axios reported that the allocation could increase to 50 gigawatts by 2035. A 5 gigawatt commitment would rank among the largest for a single customer. Meanwhile, 50 gigawatts would align with infrastructure planning at a national scale.
Sources told Axios that both parties continue to negotiate key terms. The agreement remains conditional, and several issues remain unresolved. These issues include the location of future power production sites.
Sam Altman previously invested heavily in Helion Energy. However, Axios reported that Altman stepped down as Helion’s board chair. He also recused himself from OpenAI’s deal discussions to address conflict concerns.
Helion believes it is nearing scientific breakeven in fusion development. Breakeven marks the point where fusion generates more energy than it consumes. Yet no private fusion company has achieved that milestone to date.
Funding history and prior fusion agreements shape talks
Helion Energy raised $425 million in a Series F round in January 2025. The funding valued the company at $5.425 billion post-money. Total funding has now surpassed $1 billion.
SoftBank Vision Fund 2, Mithril Capital, and Good Ventures Foundation backed the round. Sam Altman previously led Helion’s $500 million Series E round in 2021. These investments positioned Helion among the most capitalized private fusion firms.
In 2023, Helion signed the world’s first fusion power purchase agreement with Microsoft. The agreement targets delivery of at least 50 megawatts by 2028. In July 2025, Helion secured land and began building its first fusion plant.
Google has pursued a separate path through Commonwealth Fusion Systems. In June 2025, Google agreed to purchase 200 megawatts from CFS’s ARC plant in Virginia. Both companies described the transaction as a major fusion milestone.


The Solana Foundation is making a new pitch to large institutions: privacy as a customizable feature, not a trade-off.
In a report released on Monday by the foundation, “Privacy on Solana: A Full-Spectrum Approach for the Modern Enterprise,” the organization argued that the next phase of crypto adoption will depend less on transparency alone and more on giving companies control over what they reveal — and to whom.
The framing marks a shift from crypto’s early ethos. Public blockchains have traditionally emphasized openness, where transactions are visible and traceable, even if users are represented only by wallet addresses. The report acknowledged that this “pseudonymity” model, while foundational, falls short for many real-world use cases. Financial institutions, for example, may need to prove transactions occurred without exposing counterparties, while companies processing payroll must avoid broadcasting employee salaries.
Underlying the pitch is a technical claim: that Solana’s speed makes advanced privacy techniques practical. The team argued that the network’s high throughput and low latency allow these methods to run at near-web speeds, opening the door to use cases such as encrypted order books or private credit risk calculations.
But rather than offering a single solution for privacy, the foundation presented privacy as a spectrum composed of four distinct modes: pseudonymity, confidentiality, anonymity and fully private systems.
At the base level, pseudonymity keeps identities obscured behind wallet addresses while leaving transaction data visible. Moving along the spectrum, confidentiality allows participants to be known while encrypting sensitive information like balances and transfer amounts.
Anonymity flips that dynamic, hiding the identities of participants while allowing transaction data to remain visible. At the far end are fully private systems, where both identities and transaction data are shielded through techniques like zero-knowledge proofs and multiparty computation.
The message is that no single privacy model fits all. “For enterprises, privacy is a spectrum, not a switch,” the report said.
What Solana is trying to do is bring all of these privacy options into one system. Instead of choosing just one approach, companies can mix and match tools — like hiding transaction amounts, proving something is valid without revealing details, or controlling who can access certain data — depending on what they need.
In practice, that could mean executing trades without revealing order size, sharing risk data across banks without exposing individual balance sheets, or allowing users to prove compliance without disclosing personal information.
The report leans heavily on the idea that privacy and regulation can coexist. The team pointed to mechanisms like “auditor keys,” which enable designated parties to decrypt transactions when required. Other systems would allow wallets to demonstrate compliance status without revealing identity. These features are framed as a response to growing regulatory scrutiny, particularly around anti-money laundering rules and financial surveillance.
“Privacy is a market requirement,” the report said. “Customers expect it and applications require it. On Solana, you choose your privacy level, from encrypted balances to zero-knowledge anonymity to multiparty confidential computing. Each level maps to a compliance path, and each is composable with the broader ecosystem.”
Read more: Solana Foundation’s Liu: Focus on finance, not gaming ‘misadventures’


Strategy (formerly MicroStrategy) founder Michael Saylor purchased 1,031 bitcoin (BTC) last week at an average price of $74,326.
Saylor’s buy was in the 80th percentile of the available range and BTC traded between $67,354 and $76,013 during that period.
It wasn’t a fluke.
Year-to-date across his 12-weekly SEC Form 8-K disclosures totaling 89,599 BTC purchases for $7.25 billion this year, Strategy has consistently bought in the top half of each week’s trading range.
This is according to our analysis of the company’s own SEC filings and corresponding BTC market data.
Strategy’s 2026 purchases of BTC landed above the midpoint of each purchase period’s trading range 80% of the time.
Saylor buys BTC near the top
The pattern holds even when weighting for size. Indeed, Strategy’s two largest purchases of the year, 22,337 BTC in the week ending March 15 and 22,305 BTC in the week ending January 19, both cleared above the midpoint of each week’s range.
The January purchase, disclosed on January 20, cost $95,284 per coin while BTC traded between $90,016 and $97,939 that week.
That placed Strategy at the 66th percentile of the range on its $2.1 billion purchase.
In early February, the firm bought 1,142 BTC at $78,815 during a week when BTC ranged from $59,930 to $79,301. Embarrassingly, that’s the 97th percentile or nearly the worst prices Strategy could have paid.
BTC spent most of that week at much lower prices, but Saylor paid near the ceiling.
Only three of the 12 weekly purchases landed below the midpoint of the range. Worse, those three combined for just 16,705 BTC, or 18.6% of total volume purchased year to date.
‘I’m going to be buying the top forever’
Saylor has acknowledged his approach openly. “I’m going to be buying the top forever,” he posted on X.
Of course, that statement is supposed to reference the slow and long-term price appreciation of BTC, not the literal reality that Saylor is buying near the top of BTC trading ranges.
The numbers confirm it. Strategy’s volume-weighted average purchase price for 2026 is $80,929. BTC currently trades near $70,000, leaving the company’s entire 2026 buying program roughly $1 billion underwater.
The company now holds 762,099 BTC acquired for a blended average of $75,694. At today’s prices, that treasury has an unrealized loss of over $4 billion.
The company’s MSTR common stock, which opened 2026 at $154.59, opened for trading this morning at $138.92, a 10% year-to-date decline.
Each Monday, Saylor discloses the prior week’s purchases via an 8-K filing. The day prior, on Sundays, he usually hints at the purchase by posting some sort of vague yet eminently obvious reference to “orange dots” on his SaylorTracker.
Protos previously noted a similar pattern in April 2025 when Strategy paid well into the top third of the weekly range while BTC spent most of the week near its lows.
Read more: We calculated the present value of STRC — it’s bad for MSTR
To be fair, buying above the midpoint doesn’t automatically mean poor execution. No one knows the best price in advance.
Over the counter desks also handle large blocks at negotiated prices, and Strategy’s large size limits its ability to cherry-pick intraday lows. Strategy also seems to often buy early in the week, and for whatever reason, BTC has traded higher during early weekdays in 2026 than later weekdays.
Still, the consistency of the pattern across 12 consecutive weeks and nearly 90,000 BTC is difficult to dismiss.
Strategy spent $5.8 billion, or 80% of its 2026 outlay, at prices in the upper half of each week’s range.
Saylor, for his part, keeps posting orange dots on Sundays and expensive, top-of-range BTC buys on Monday.
Got a tip? Send us an email securely via Protos Leaks. For more informed news, follow us on X, Bluesky, and Google News, or subscribe to our YouTube channel.


A new venture capital firm focused on prediction markets is launching with backing from Polymarket founder and CEO Shayne Coplan and Kalshi co-founder and CEO Tarek Mansour, Bloomberg reported.
The firm, called 5c(c) Capital (named after a section of the Commodity Exchange Act that governs prediction markets) may be the first venture fund built specifically to invest in companies shaped by that regulatory and market structure.
“We want to capitalize on the second-, third-, and fourth-order effects of what we built ourselves,” the founders wrote in a document viewed by Bloomberg.
The launch comes as prediction markets shift from a niche corner of finance into a more visible part of how people track events. Since the U.S. presidential election, trading volumes have climbed and new users have entered the space. Platforms such as Polymarket and Kalshi now host contracts tied to politics, economic data and cultural events, turning public opinion into tradable signals. Polymarket’s trades run on the blockchain. Many crypto-native companies, including Coinbase (COIN) and Kraken, as well as Robinhood (HOOD), have also entered the space in recent months.
That growth has created new business openings beyond the platforms themselves. Startups are beginning to build data tools, liquidity services and compliance systems that support these markets.
5c(c) Capital plans to raise up to $35 million and invest in about 20 portfolio companies over the next two years, according to the document. The strategy centers on early-stage bets tied to infrastructure and services around prediction markets rather than the exchanges alone.
Early backing includes more than twenty investors, among them a portfolio manager at Millennium Management, several crypto-focused venture firms and founders of other prediction market platforms such as PredictIt.
Polymarket declined to comment. Kalshi did not respond in time for publication.
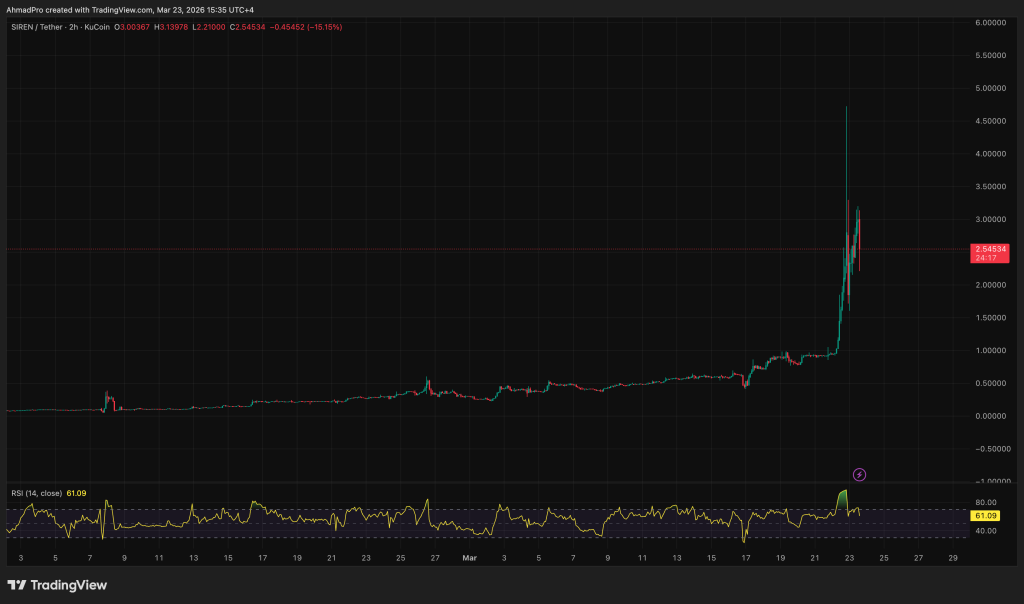
Siren crypto (SIREN) just ripped 156% to a new all-time high of $3 driven by the exploding AI Agents narrative. But the rally is showing immediate signs of exhaustion.
A massive bearish divergence on the Money Flow Index (MFI) suggests the top is in, and a $22 million liquidation event has left leverage traders exposed to a sharp reversal.
The token outperformed Bitcoin by over 80% in the last 24 hours. Yet, the on-chain data presents a clear warning: volume is thinning on the way up. The breakdown is confirmed until price proves otherwise.
- Rally: SIREN hit an ATH of $3.00 after a 156% daily surge.
- Signal: MFI spiked to 82.96, a level that has triggered three prior corrections.
- Support: Bulls must hold the $2.07 level to prevent a drop to $1.50.
SIREN Price Analysis: Can SIREN Hold $2.07 Support After the ATH Breakout?
The chart structure is screaming caution despite the parabolic move. The Money Flow Index (MFI) is currently pegged at 82.96. Historically, this is the kill zone for SIREN rallies. Vertical lines on the daily chart mark February 7, February 27, and March 15—every time the MFI breached the 80 threshold, price collapsed shortly after.
The $3.00 high triggered a sharp rejection, validating the bearish thesis. The Chaikin Money Flow (CMF) printed a lower high of 0.14 while price made a higher high. This implies a (Price Correction) is imminent, as capital is leaving even as price pushes up.

Structure is fragile here. Traders are watching the $2.07 level closely. Lose that, and the 38.2% retracement level comes into play quickly.
A breakdown below $2.00 opens the path to $1.50. This aligns with risks seen elsewhere, such as recent whale shorting activity on Bitcoin, which often precedes altcoin weakness. The only path higher requires a daily close above $2.60 to invalidate the divergence. Until then, the bears are in control.
Discover: The best new crypto in the world
The post SIREN Crypto Risks ‘Structural Correction’ After 150% Surge to All-Time High appeared first on Cryptonews.

- Active XRP addresses dropped over 40% in four days.
- XRP price remains stuck between a tight trading range.
- Retail holders have grown, but overall network activity is slowing.
XRP has entered a tight and uncertain phase after a brief rally following an announcement by US President Donald Trump that the United States will pause strikes on energy and power installations in Iran after the expiry of the 48-hour ultimatum on opening the Strait of Hormuz.
BREAKING PRESIDENT TRUMP: 🇺🇸🇮🇷 We had very good and productive conversations regarding a complete and total resolution of hostilities in the Middle East.
Military strikes postponed for 5 days. pic.twitter.com/wiZh9F1H5p
— Donald J Trump Posts TruthSocial (@TruthTrumpPost) March 23, 2026
The momentum that initially lifted prices following Trump’s announcement now appears to be fading as the market struggles to find direction.
At the time of writing, XRP is trading around $1.43.
The price has moved within a narrow range between $1.36 and $1.46, reflecting hesitation among traders after a week where XRP slipped by about 5%, extending its broader downward trend over the past year.
While the recent rally gave traders hope, the follow-through has been weak.
XRP Ledger activity drops sharply
One of the most notable developments is the sharp decline in XRP Ledger (XRPL) network activity.
Notably, XRP’s active addresses have fallen by more than 40% within just a few days, according to the data obtained from CryptoQuant.

This drop signals a slowdown in user engagement, which often reflects reduced demand in the short term.
Fewer active participants usually translate to less transaction volume and weaker momentum.
This decline contrasts with the earlier optimism that surrounded XRP’s growing number of wallet holders.
While more people may be holding XRP, fewer are actively using it.
This gap between ownership and activity suggests that investors are choosing to wait rather than act.
Such behaviour is common during uncertain market conditions.
Retail growth continues despite the slowdown
Even as activity drops, the number of smaller XRP holders continues to grow steadily.
This trend points to increasing retail interest in the asset.
A rising base of small holders often signals long-term confidence, even if short-term sentiment is mixed.
It also suggests that XRP is becoming more widely distributed rather than concentrated in a few large hands.
However, growing ownership alone does not guarantee price growth.
Without strong network activity to support it, price movements can remain limited.
This is the situation XRP appears to be facing now.
XRP price outlook
XRP’s current price movements reflect a market caught between opposing forces.
On one hand, there is optimism driven by broader adoption and past rally attempts.
On the other hand, there is clear evidence of weakening participation and fading momentum.
The asset remains well below its previous peak, showing that recovery is still incomplete.
Short-term price action suggests consolidation rather than a decisive move in either direction, with the immediate support level at near $1.33 holding for now.

At the same time, resistance around $1.54 to $1.60 continues to limit upward movement, creating a narrow trading range that traders are watching closely.
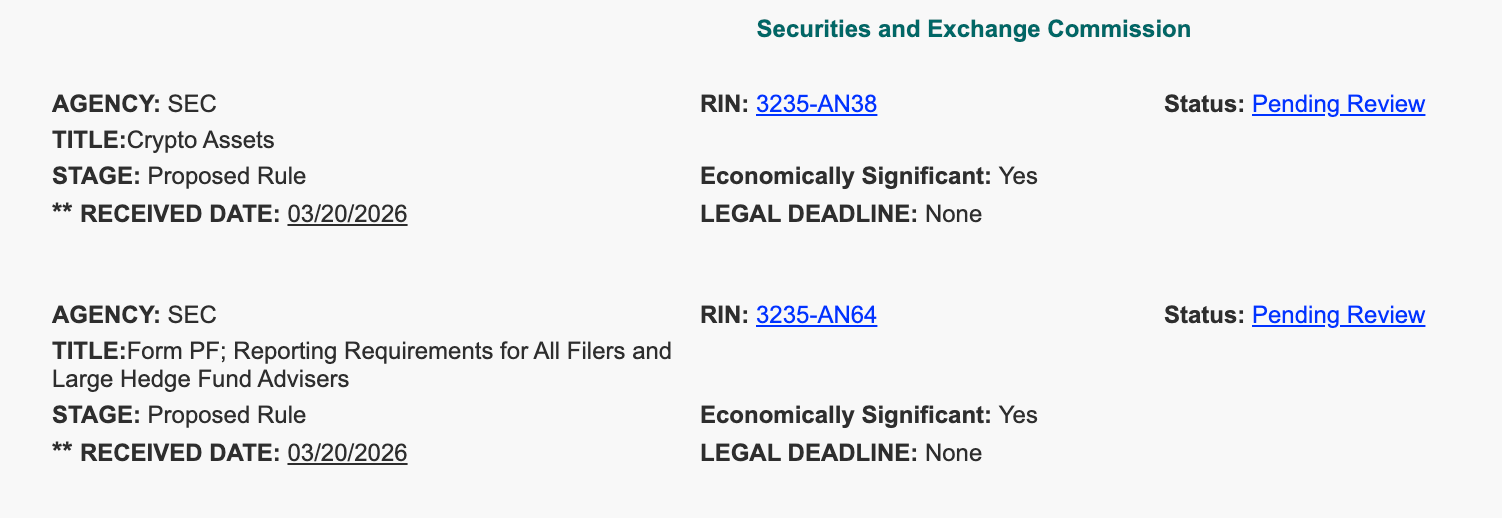
The financial regulator’s plan to reinterpret how federal securities laws apply to crypto assets is ”pending review” by the White House’s Office of Management and Budget.
The US Securities and Exchange Commission (SEC) has forwarded its proposal to have most crypto assets not treated as securities under federal law to the White House’s Office of Management and Budget.
According to information available through the US General Services Administration, on Friday the SEC sent two proposed rules to the White House for review, including its interpretative notice from last week regarding which digital assets the agency could consider a security under federal law.
As of Monday, government records showed the proposal as “pending review” by the White House, potentially changing how the SEC handles regulation and enforcement of digital assets.

In a notice issued by the SEC last week, Chair Paul Atkins said that the agency would not consider four types of digital assets as securities under its purview: digital commodities, digital tools, digital collectibles — including non-fungible tokens — and stablecoins. The interpretation said that it would provide the agency with a “coherent token taxonomy” for the four types of assets and address how a “non-security crypto asset” may or may not be considered an investment contract.
The SEC rule, if finalized, would provide a bridge to crypto regulation until Congress were to pass a market structure bill to clarify comprehensive regulations of digital assets. The interpretation of federal securities laws followed the signing of a memorandum of understanding with the Commodity Futures Trading Commission (CFTC) — the other federal financial regulator expected to regulate digital assets under the proposed market structure bill — earlier this month.
Related: CFTC staff clarify expectations on using crypto as collateral
White House reportedly reached “agreement in principle” on crypto bill
Politico reported on Friday that representatives from the White House and Congressional lawmakers reached a deal on stablecoin yield that could advance the market structure bill in the Senate Banking Committee. The panel indefinitely postponed its markup of the bill, called the CLARITY Act, in January following Coinbase CEO Brian Armstrong saying the exchange could not support the legislation as written.
As of Monday, the banking committee had not publicly announced a new date for the bill’s markup. Senate Majority Leader John Thune reportedly said in March that the chamber intended to prioritize a vote on the SAVE America Act — legislation that would require voters to provide proof of US citizenship in person to register — before bills with bipartisan support, such as CLARITY.
Magazine: Are DeFi devs liable for the illegal activity of others on their platforms?


Polygon‑incubated Katana has acquired veteran DEX IDEX to launch Katana Perps, folding a decade of exchange tech into its DeFi stack as it races Hyperliquid and dYdX for onchain derivatives volume.
Summary
- Polygon‑incubated DeFi chain Katana has acquired veteran DEX IDEX to power Katana Perps, a new perpetual futures platform that natively integrates spot and derivatives trading.
- CEO Matthew Fisher says the goal is to “own more of the trading stack and the revenue that comes with it” as onchain derivatives volumes and always‑on markets surge.
- Market makers including GSR, Selini Capital, and Auros are seeding liquidity, positioning Katana as a full‑stack DeFi chain spanning spot, lending, launches, and perps.
Katana, a DeFi‑focused Ethereum scaling chain incubated by Polygon Labs and trading firm GSR, has acquired decentralized exchange IDEX, using its infrastructure to launch Katana Perps, a perpetual futures venue built directly into the Katana app. The deal, announced on March 23, 2026, brings nearly a decade of exchange technology from the 2017‑founded DEX into Katana’s stack, with IDEX now “relaunching as Katana Perps” and serving as the native derivatives engine for the chain. “The goal is to own more of the trading stack and the revenue that comes with it,” Katana CEO Matthew Fisher said, calling the acquisition the “first major step” of his tenure as he formalizes the strategy he has led since joining the project.
Fisher argued that as crypto trading migrates to always‑on venues, infrastructure that blends CEX‑like performance with onchain settlement will define winners. “We’re building for 24/7 markets where price discovery happens onchain, not during bank hours,” he said, pointing to U.S. regulators’ recent signals about a path for crypto perpetual futures as an inflection point for the sector. Under the new setup, IDEX’s order book and AMM architecture becomes the backbone for Katana Perps, which routes spot liquidity, perps, and order flow through a single interface rather than siloing derivatives as a separate product.
Katana’s broader DeFi stack now spans four pillars: Sushi for spot trading, Morpho for lending, Kensei for token launches, and Katana Perps for leveraged derivatives, all coordinated by the KAT and vKAT token model. Over time, vKAT holders will be able to direct incentives toward perps markets and earn a share of fees, folding derivatives revenue into the same flywheel that powers spot and lending on the chain. At launch, Katana Perps is supported by major market makers GSR, Selini Capital, and Auros, which Fisher said were drawn by IDEX’s “nearly a decade” of live infrastructure and the chain’s performance‑oriented design.
Founded in 2017, IDEX was “the first decentralized exchange to combine a high‑performance matching engine with onchain settlement” and, through 2019, “consistently ranked first by trading volume and transaction count among all DEX protocols,” Katana noted. Bringing that stack in‑house lets Katana offer a more CEX‑like experience — deep API support, higher throughput, and tighter spreads — while keeping custody and settlement onchain.
The acquisition lands as perpetuals DEXes are seeing rising volumes and attracting more professional flow, with venues like Hyperliquid, dYdX, and GMX competing to lock in whales and market makers. Recent crypto.news coverage has highlighted how new onchain products — from Hyperliquid’s HIP‑4 proposal for outcome markets to high‑stakes perps traders posting multi‑million‑dollar PnL — are pulling structurally sticky liquidity into derivatives rails. In that context, Katana’s decision to acquire rather than simply integrate a third‑party DEX is a clear statement: the chain wants to control its own economic engines instead of renting them.
As Fisher put it, “Owning perps is not just owning a product, it’s owning the heartbeat of your chain,” a line that neatly captures where the DeFi race is headed.
Family of Amy Doherty ‘crushed with disbelief, sadness and pain’ after murder probe launched
Dollar Tree secures $500 million term loan, ends revolving credit facility

Kalshi and Polymarket CEOs Back $35M Prediction Market Venture Fund


-
 Crypto World3 days ago
NIO (NIO) Stock Plunges 6.5% as Shelf Registration Sparks Dilution Worries
-

 Fashion3 days ago
Weekend Open Thread: Adidas – Corporette.com
-

 Politics3 days ago
Jenni Murray, Long-Serving Woman’s Hour Presenter, Dies Aged 75
-
 Tech6 days ago
Are Split Spacebars the Next Big Gaming Keyboard Trend?
-

 Business7 days ago
How the UK and China Trade Agreement Could Shape UK Businesses in 2026
-

 Crypto World2 days ago
Best Crypto to Buy Now: Strategy Just Spent $1.57 Billion on Bitcoin During Fear While Early Investors Quietly Enter Pepeto for 150x Potential
-

 News Videos5 days ago
RBA board divided on rate cut, unusually buoyant share market | Finance Report | ABC NEWS
-

 Crypto World2 days ago
Bitcoin Price News: Bhutan Sells $72 Million in BTC Under Fiscal Pressure, but the Smart Money Entering Pepeto Sees What the Market Does Not
-

 Politics5 days ago
The House | The new register to protect children from their abusers shows Parliament at its best
-

 Tech4 days ago
inKONBINI Lets You Spend Summer Days Behind the Register
-
 Politics6 days ago
Real-time pollution monitoring calls after boy nearly dies
-

 Crypto World5 days ago
Canada’s FINTRAC revokes registrations of 23 crypto MSBs in AML crackdown
-

 Sports9 hours ago
Remo Stars and Kano Pillars Strengthen Survival Hopes in NPFL
-

 News Videos5 days ago
PARLIAMENT OF MALAWI – PAC MEETING WITH REGISTRAR OF FINANCIAL ON AMARYLLIS HOTEL – INQUIRY LIVE
-
 NewsBeat5 days ago
Residents in North Lanarkshire reminded to register to vote in Scottish Parliament Election
-

 Politics4 days ago
Gender equality discussions at UN face pushbacks and US resistance
-

 Business1 day ago
No Winner in March 21 Drawing as Prize Rolls to $133 Million for Next
-

 Business5 days ago
Who Was Alex Pretti? 5 Key Facts About the ICU Nurse Killed by Federal Agents in Minneapolis
-

 Tech24 hours ago
Give Your Phone a Huge (and Free) Upgrade by Switching to Another Keyboard
-

 Sports8 hours ago
Gary Kirsten Accuses Pakistan Cricket Board Of ‘Interference’, Mohsin Naqvi Responds
You must be logged in to post a comment Login