
Crypto World
Bitcoin bleeds for second straight day, nearly grazes $72,000

Bitcoin signage in Times Square in New York, US, on Tuesday, Dec. 9, 2025.
Michael Nagle | Bloomberg | Getty Images
Bitcoin nearly touched the $72,000 mark on Wednesday, marking the second straight day of its massive retreat this week.
The world’s oldest cryptocurrency sank as low as $72,096.20, plunging more than 5% on the day. It was last trading at $72,958.38, down about 4% on the day. Bitcoin is currently more than 40% off its record high of about $126,000 hit last October.

Bitcoin in the past day, per Coin Metrics
Bitcoin first broke below the $73,000 mark on Tuesday, hitting its lowest price in roughly 16 months and approaching its pre-election value. Analysts say $70,000 is a key level to watch as the digital asset’s downturn deepens, according to a Citi note to clients dated Tuesday.
The token’s value is bleeding as a result of several of geopolitical and economic challenges, among other headwinds.
Chief among them is investors’ recent rotation out of risk-on assets due to rising tensions between the U.S. and Europe over U.S. President Donald Trump‘s Greenland gambit and a recently ended partial government shutdown that delayed the release of some critical economic data. Also at play are expectations of a U.S. monetary policy shift following Trump’s nomination of Kevin Warsh for Fed chair late last month as well as a slowdown in efforts to create more crypto-friendly regulatory and legislative guardrails in the U.S.
Large institutional outflows driven by expectations of a deeper bitcoin correction has also thinned liquidity for the token, hurting its price, according to a recent analyst note from Deutsche Bank.
Spot bitcoin exchange-traded funds have seen significant outflows since a series of liquidations of highly leveraged digital asset positions last October, the analysts noted. The funds have recorded outflows of more than $3 billion in January, roughly $2 billion last December, and about $7 billion last November.
Bitcoin’s pullback hit several crypto stocks. Strategy, a bitcoin treasury firm, was also down 5% on the day, while digital asset mining names like Riot Platforms and MARA Holdings shed almost 11%.

Ether (ETH) is carving out a familiar, technically charged pattern on the weekly chart, a setup that some traders say echoes a 2025 fractal in which ETH surged about 250%. The current move sees Ether testing an ascending trend line that has provided support since 2022, while a bullish MACD crossover has helped confirm a price bottom and unleash renewed momentum.
Analysts are watching whether this pattern can unfold again. On X, analyst Max Crypto framed the current action as a repeatable structure—“Similar structure. Similar dump. Similar consolidation.” He asked aloud whether ETH could repeat the Q2/Q3 2025 rally, suggesting a potential move that would push ETH beyond prior highs if history rhymes with the present setup. Another observer, Cryptorand, stressed that a decisive push above the $2,400 level would be a prerequisite for a sustained reversal, framing the next step as a test of the key resistance before any pronounced breakout.
Key takeaways
- Ether’s weekly chart shows a pattern reminiscent of a 2025 fractal, with a bullish MACD cross and a retest of an ascending trend line that has supported price since 2022.
- If the 2025-like pattern plays out again, ETH could rally more than 250% toward around $6,300, contingent on clearing a crucial hurdle near $2,400.
- On-chain demand signals have turned positive, with Capriole Investments’ Ethereum Apparent Demand metric rising to 24,111 ETH on April 14 after a rise beginning April 8.
- Institutional appetite is echoing in market structure, as the Coinbase ETH/USD premium index climbed to 0.055—the highest since October 2025—suggesting stronger US-based demand.
Pattern dynamics and the path to a potential breakout
From a technical perspective, Ether’s price action is anchoring around a long-standing support line that has framed the market since 2022. The weekly chart’s close above the MACD’s bullish crossover adds a layer of confidence that the immediate liquidations may be behind us and a new leg higher could be underway. The reference to a 2025 fractal is more than a curiosity; it points to a multi-quarter cycle in which ETH established a major rally after a similar sequence of lows, consolidations, and reaccumulation phases.
Max Crypto highlighted the possibility of history rhyming with the present, inviting readers to consider whether ETH could replicate the Q2/Q3 2025 run. The gist: if the trend repeats, Ether could test the upper reaches of its prior rally, potentially surpassing the $6,000 level and approaching $6,300 before meaningful resistance consolidates price action again. Cryptorand, meanwhile, underscored that clearing the $2,400 barrier would be a signal that a bullish reversal is underway, turning consolidation into momentum and lifting the odds of a sustained upside move.
Demand signals: institutions re-engaging with ETH
Beyond pure price action, on-chain demand indicators have started to brighten. Capriole Investments’ Ethereum Apparent Demand metric has moved back into positive territory, rising from early April and peaking at 24,111 ETH on April 14. The metric aggregates observed buying interest across on-chain activity and can serve as a proxy for underlying demand dynamics that precede price moves.
A separate indicator of institutional interest comes from the Coinbase premium for ETH/USD, which, according to CryptoQuant, rose to 0.055—the highest level observed since October 2025. CryptoQuant analyst Arab Chain described the move as indicative of a notable influx of institutional liquidity, particularly within the U.S. market. In practical terms, the premium reflects a price relationship between ETH on Coinbase versus other exchanges, with a larger premium often signaling stronger demand from larger, possibly institution-aligned buyers.
ETF and ETP inflows reinforce the demand story
Market observers have also pointed to inflows into Ethereum-related exchange-traded products (ETPs) as corroborating evidence of rising demand. Spot Ethereum ETFs recorded net inflows across three consecutive days, totaling about $160 million, underscoring robust appetite from investors looking to gain regulated exposure to ETH via traditional financial vehicles. The broader ecosystem of Ether-tracking ETPs—global Ether ETPs—also drew notable inflows, reported at roughly $196.5 million for the preceding week, highlighting sustained participation from institutional and professional investors beyond spot-market dynamics.
Taken together, these demand signals—on-chain purchases, the uptick in the Coinbase premium, and ETF/ETP inflows—paint a coherent picture of renewed institutional engagement with Ether. They align with the price pattern and macro catalysts discussed by market observers, suggesting that ETH’s next move could be driven as much by capital allocation choices as by pure technical setups.
What could shape the next moves for Ether
Several factors will likely determine whether ETH sustains a bullish reversal or resumes a consolidation phase. The most immediate technical hurdle remains the $2,400 region. A clean consolidation over that threshold would bolster the bullish case, potentially paving the way for a multi-hundred-percent move if the fractal dynamics from 2025 repeat. Conversely, failure to clear and hold above $2,400 could sideline the rally, inviting renewed volatility and a possible retest of lower supports.
Macro factors also loom large. The market has been sensitive to geopolitical and policy-driven catalysts, including sentiment around international diplomacy—illustrated in part by hopes for a US-Iran deal—that can sway institutional risk appetite. Traders will be watching for any shifts in liquidity conditions, US-based demand signals, and the continued flow of ETF and ETP inflows, which together can both reflect and amplify the current pattern.
From a timing perspective, the coming weeks could be pivotal. If the fractal pattern mirrors 2025, investors might see a sustained push higher, but the trajectory will hinge on how quickly and convincingly ETH crosses the critical $2,400 barrier and whether the market can sustain that breakout amid broader risk-on conditions. As always, the path forward remains contingent on a confluence of technical confirmation and real-world demand signals.
Readers should monitor several near-term datapoints: the price action around $2,400, the persistence of on-chain buying interest via Apparent Demand metrics, and the momentum implied by the MACD, as well as continued ETF/ETP inflows. Each of these elements can tilt the balance toward a lasting rally or a renewed period of range-bound trading.
Looking ahead, the combination of a constructive weekly pattern and fresh demand signals could tilt Ether toward renewed leadership in the broader crypto market. Yet the path to a durable breakout will require sustained momentum above key levels, ongoing institutional interest, and a continued appetite for ETH exposure across both spot and product-based channels.


The bitcoin price surged more than 5 percent Tuesday morning to touch $74,901 before settling around $74,400, its highest level since March 17, after Trump signaled Iran may be interested in resuming peace talks and CENTCOM clarified the naval blockade would not impede non-Iranian shipping through the Strait.
Summary
- Bloomberg reported bitcoin climbed to $74,901 at 8:30 AM Singapore time before paring to around $74,400, while Ether rose 5 percent to $2,370 and XRP gained alongside the broader crypto market rally.
- The rally was triggered by Trump’s comments suggesting Iran had expressed interest in returning to negotiations, combined with CENTCOM’s clarification that the blockade targets only Iranian-port traffic rather than all Strait of Hormuz shipping.
- The move liquidated short positions across the crypto derivatives market, echoing the pattern from April 7 when the original ceasefire announcement cleared $427 million in leveraged short bets and sent bitcoin from $68,500 to $72,700 in hours.
The same diplomatic signal dynamic that drove the April 7 ceasefire rally is at work again: every credible hint of de-escalation produces a fast and sharp crypto repricing because the market has been systematically short through the conflict. A full peace deal or ceasefire extension before April 22 would likely produce a larger move. Market analyst Sam Daodu outlined a $75,000 to $80,000 range as the target if new talks produce even a temporary agreement, and a path toward $100,000 by year-end if a full deal materializes and oil returns toward pre-war levels near $65 to $70 per barrel.
Monday opened with bitcoin at $70,741 as the naval blockade went live and oil touched $104. Tuesday opened at $74,400 as the same geopolitical situation produced a different signal. The difference was a single item: Trump’s suggestion that Iran wants to talk. That is the level of hair-trigger sensitivity the bitcoin market has developed to Iran war headlines. The directional trade is simple: war progress down, peace progress up, with each swing amplified by the short-heavy positioning that has built up over 46 consecutive days of extreme fear.
Why Ethereum’s 5% Gain Matters
Ether rising 5 percent to $2,370 alongside bitcoin is a signal that this rally has broader risk-on characteristics rather than being a bitcoin-specific move. When only bitcoin rallies during geopolitical relief, it reflects safe-haven rotation within crypto. When Ether, XRP, and altcoins rally together, it reflects genuine risk appetite returning across the asset class. The CLARITY Act markup window opening this week adds a crypto-specific regulatory tailwind on top of the geopolitical relief signal.
What the Market Is Watching to Hold $74,400
The critical question is whether the rally holds or fades if Iran makes no formal statement about resuming talks. The $75,000 to $76,100 level is the next meaningful resistance, corresponding to the February swing high before the war broke out. A daily close above that level would signal a full technical reversal of the war-driven selloff. Without a confirmed diplomatic development, the market is vulnerable to a return to the $70,000 to $71,000 range on any negative Iran headline.
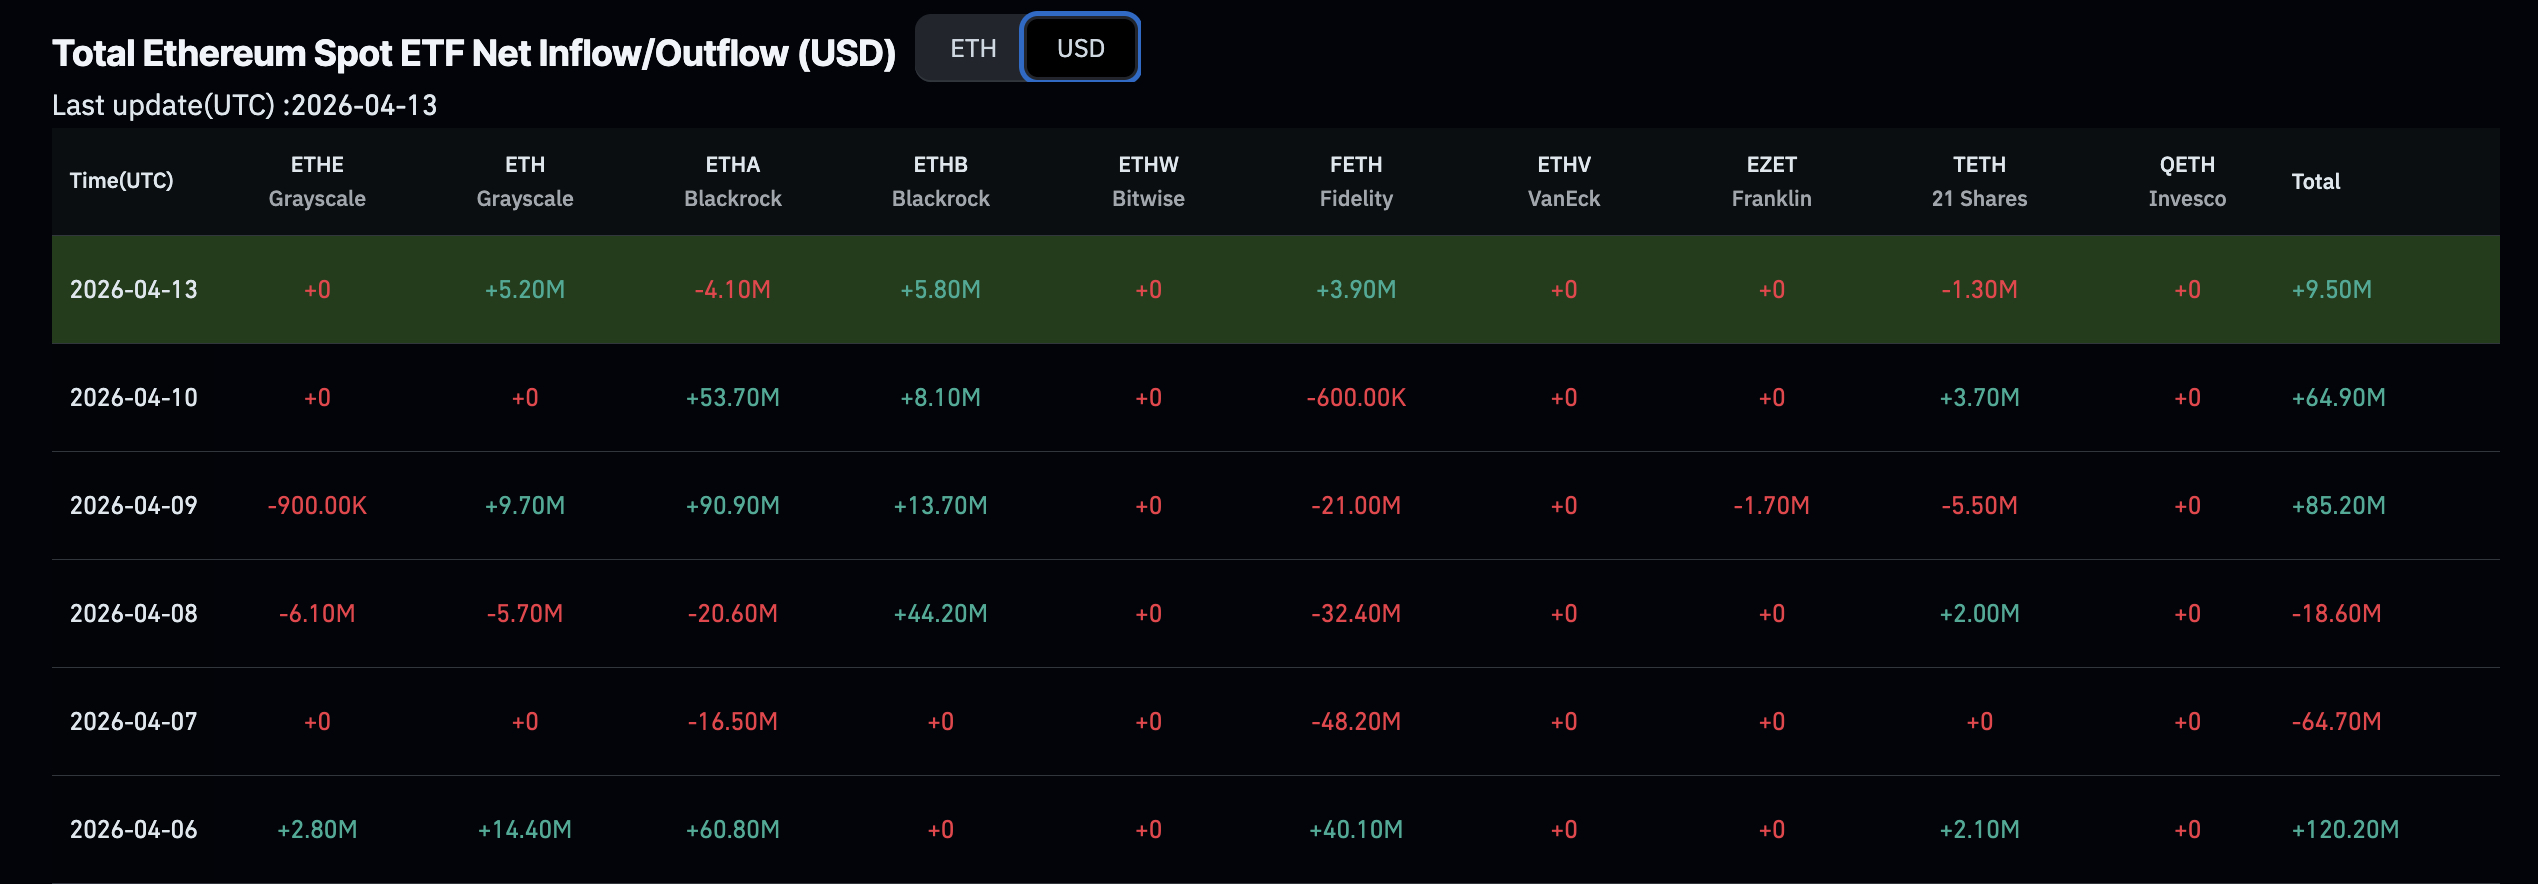
Ethereum price has jumped by 9% in the past 24 hours, approaching the $2,400 resistance barrier with a prediction for it to even break . Capital is visibly shifting: bitcoin ETFs bled $325.8 million in net outflows on April 13 alone, while ether ETF weekly inflows hit $187 million, the strongest showing of 2026.

On-chain, daily Ethereum transactions spiked 41% week-over-week to approximately 3.6 million, up from 2.5 million just days earlier. Macro relief from easing geopolitical tensions appears to be amplifying the move, with decentralized assets attracting fresh allocations. Broader market context points to a coordinated risk-on shift, but ETH is clearly leading it.
Discover: The best crypto to diversify your portfolio with
Ethereum Price Hit $3,000 This Week Despite Bear Prediction?
ETH is compressing against a stubborn ceiling. Price is testing the $2,400 resistance, a zone that has capped multiple recovery attempts in recent weeks. Analysts have flagged $2,750 as a realistic target, a 22% rally from current levels, only if ETH clears $2,400 with conviction, citing an 11.5x risk-reward setup using $2,030 as the stop.
The technical structure is encouraging. On-chain signals have flipped bullish, with whales turning profitable, $135 million in ETH exchange outflows via staking, and a pattern of higher lows forming in a classic pre-breakout compression. Cumulative ETH ETF inflows have now reached a record $11.68 billion, providing an institutional backdrop to the move.
ETH needs to break above $2,400 to open the path to $2,600–$2,800, with $2,750 as the primary analyst target. Failure to hold $2,100 support and it may collapse the higher-lows structure, and target $2,000 support.
The divergence between transaction volume and fee revenue is worth watching closely. More transactions at lower value could signal bot activity rather than organic demand. ETH’s broader technical setup points toward a decisive move in either direction soon.
Discover: The best pre-launch token sales
Maxi Doge Might Be the Memecoin We Need
ETH at under $2,400 is exciting, but traders who missed the entry near $1,800 are now chasing a resistance test with a compressed risk-reward. For those who want asymmetric exposure while Ethereum sets up its next leg, early-stage presales offer a different calculus entirely.
Maxi Doge ($MAXI) is a meme token and trading community built on Ethereum, currently in presale at $0.0002813 with $4.7 million raised to date. The project channels what it calls “1000x leverage trading mentality” through a 240-lb canine mascot.
Features include holder-only trading competitions with leaderboard rewards, a Maxi Fund treasury for liquidity and partnerships, and dynamic staking APY for early participants. The tagline “Never skip leg day, never skip a pump” s meme marketing doing exactly what meme marketing is supposed to do.
Research Maxi Doge before the presale window closes.
The post Ethereum Price Prediction: ETH 9% Jump Since Morning Outperforming Most Assets appeared first on Cryptonews.
Crypto World
Best Crypto Presale of April 2026 Revealed as Pepeto Crosses $9 Million: Should You Buy a Presale or Hold TAO and LTC?
Bittensor (TAO) bounced 7.5% on April 13 after crashing 20% when Covenant AI exited the network and dumped 37,000 TAO worth $10.2 million, calling the project “decentralization theater” according to NewsBTC. Grayscale still holds a 43% TAO allocation in its AI Fund.
That headline splits the best crypto presale from entries that collapse under pressure. Smart money is flowing into Pepeto after it became the breakout presale of 2026 with over $9 million raised, built by the Pepe cofounder with a Binance listing weeks away.
Best Crypto Presale as Bittensor Governance Crisis Shakes AI Token Confidence
Covenant AI’s founder accused Bittensor’s co-founder of centralized control and killed three subnets before dumping $10.2 million in TAO on the open market on April 12 per NewsBTC. The token fell from $340 to $263 before bouncing.
The best crypto presale needs to hold up under that kind of pressure, and the SolidProof audited project pulling $9 million during extreme fear has already proven it can.
How Bittensor, Litecoin, and the Best Crypto Presale Compare
Pepeto: The Best Crypto Presale With $9 Million in Smart Capital
Every cycle creates one presale that pulls away from the pack, and Pepeto is that entry with over $9 million locked in and early buyers grabbing positions at $0.0000001863 before the confirmed listing changes the price for good. Capital arriving during extreme fear tells you the wallets inside already did the math on listing day.
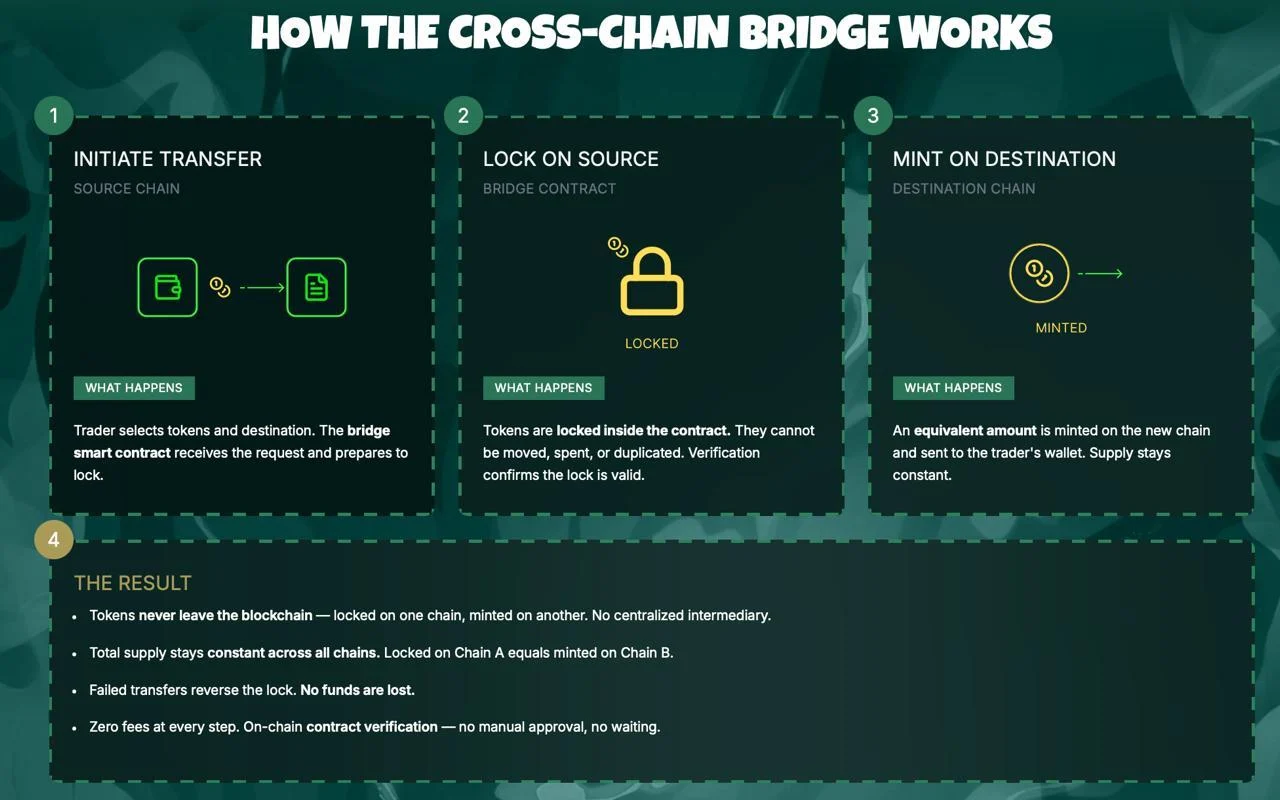
At its core, Pepeto is designed to hand regular buyers the same tools that big trading desks use. The cross-chain bridge tracks token flows between networks and moves them for free so your portfolio arrives whole, and the risk scanner reads every contract for hidden threats before a single dollar enters so your money stays away from projects built to take it.
Pepeto turns the chaos of scattered exchanges into one clean view, cutting the friction that bleeds holders dry across separate platforms. The Pepe cofounder built this with a developer who managed Binance token launches, and SolidProof audited every contract line.
The speed of money flowing in is impossible to ignore with the best crypto presale passing $9 million. Every closed round pushes the price higher, rewarding the earliest wallets with the widest distance to listing day, and the 184% APY staking reward grows each position daily as the confirmed Binance listing gets closer. Analysts target 100x once trading opens.
The buyers who caught previous cycle winners early all say they hesitated and nearly walked away, and not one of them thinks they put enough in. That same pattern is repeating now with $9 million in audited capital backing it, and waiting means paying a higher price when the next round fills.
Bittensor (TAO) Price at $258 as Covenant AI Exit Triggers 20% Crash and Governance Questions
Bittensor (TAO) trades at $258 per Yahoo Finance after crashing 20% when Covenant AI exited and dumped 37,000 TAO on April 12. Grayscale’s ETF filing and 43% allocation keep the institutional case alive.
Support sits at $263 with resistance at $340. But TAO at $258 needs huge capital just to recover its $760 high, while the best crypto presale at $0.0000001863 operates in a return category no Large Cap can touch.
Litecoin (LTC) Price at $53,65 as Commodity Status Fails to Stop 87% Decline From Peak
Litecoin (LTC) holds $53,65 per CoinMarketCap, down 87% from its $410 all time high despite earning official commodity classification. Trading volume dropped 33% over the past month.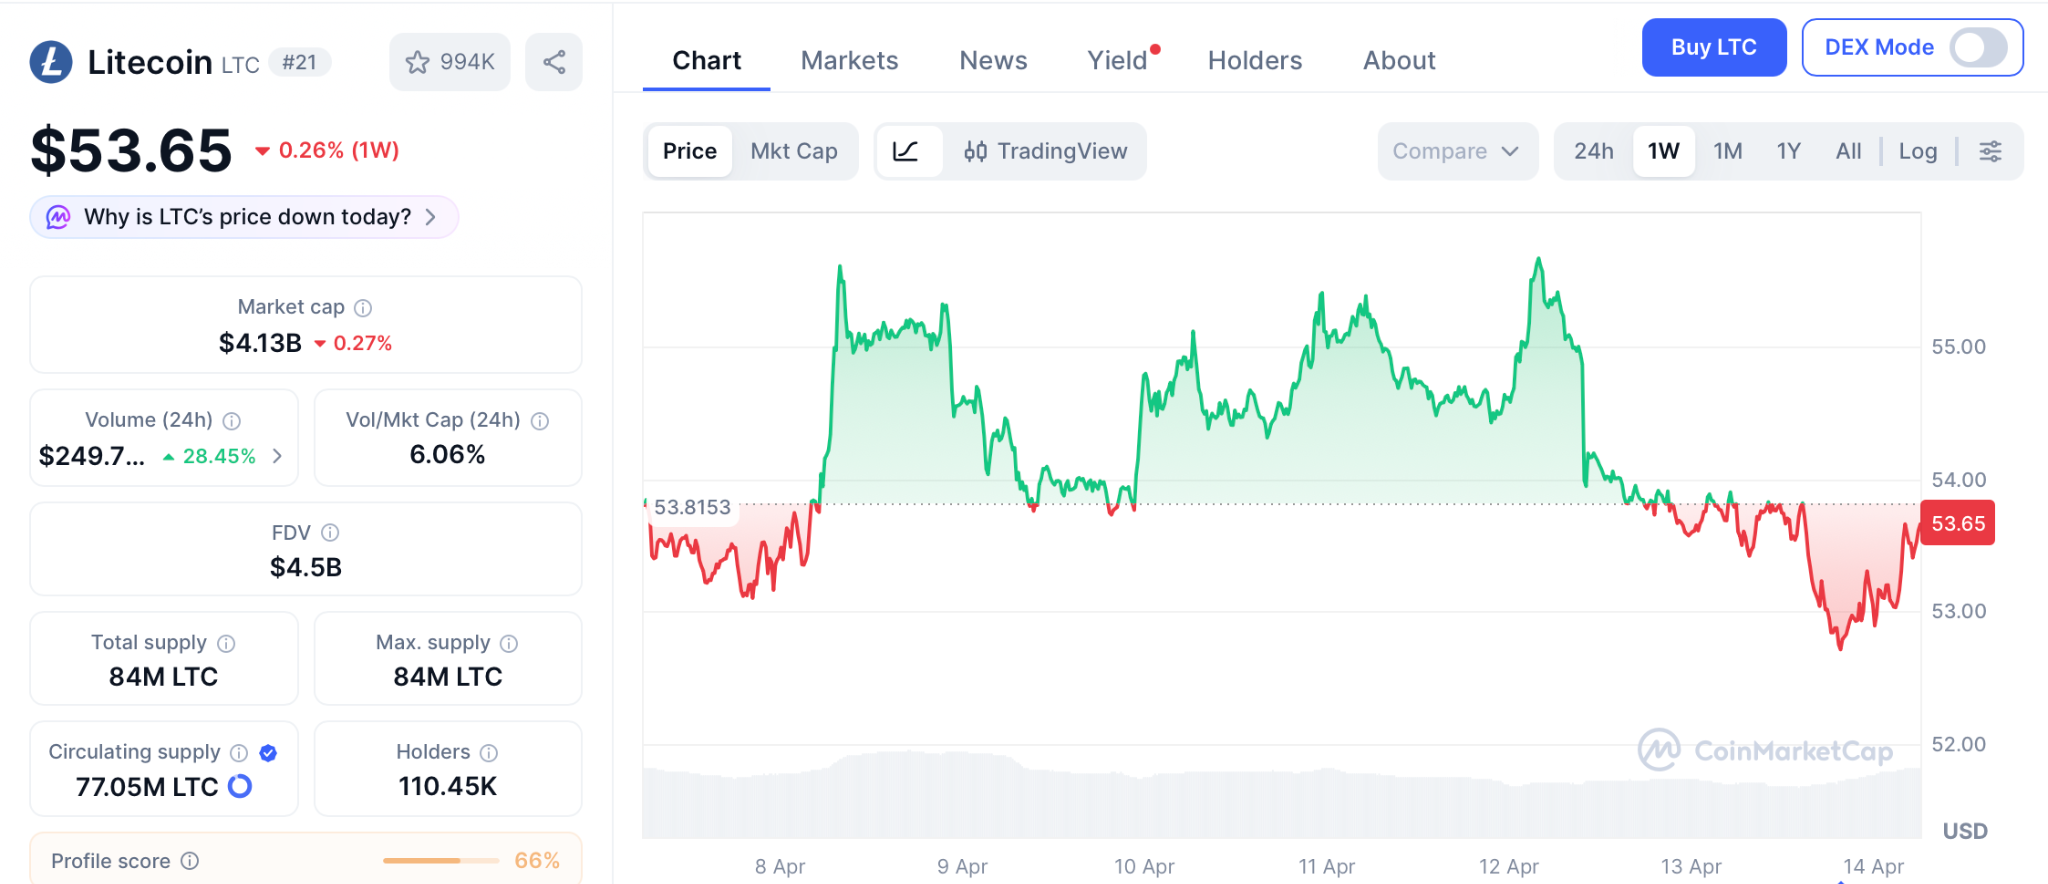
Support sits at $52 with resistance at $60. A move to $85 delivers 55% over an unknown timeline. The best crypto presale does not depend on sentiment to create the return because the listing is the catalyst.
Conclusion
With Bittensor facing governance cracks and Litecoin grinding sideways after its commodity ruling, wallets are looking for the best crypto presale that holds up under pressure and pays off at listing. TAO and LTC already sit in portfolios, but the upside those tokens offer is nothing compared to what a presale captures when one listing event resets the price for every holder at once.
The buyers who caught previous cycle winners early all wish they had put more money in when the setup was clear, and that exact setup is staring at you right now with $9 million in SolidProof audited capital and a confirmed Binance listing on the way. The presale price disappears forever once listing opens, and the window between this entry and listing day is where the cycle’s breakout gains get locked in.
Click To Visit Pepeto Website To Enter The Presale

FAQs
What is the best crypto presale of April 2026?
Pepeto crossed $9 million with SolidProof verified contracts, the Pepe cofounder, and a confirmed Binance listing making it the leading presale entry of the cycle.
Is Bittensor a good buy after the 20% crash while TAO trades at $258?
Bittensor (TAO) trades at $258 with Grayscale’s ETF filing keeping institutional interest alive after the Covenant AI exit. Pepeto at presale pricing offers listing returns that TAO at $3 billion cannot match.
Disclaimer: This is a Press Release provided by a third party who is responsible for the content. Please conduct your own research before taking any action based on the content.

Kevin Warsh, the former Federal Reserve governor tapped by President Donald Trump to lead the central bank, has filed asset disclosures that reveal a broad portfolio with notable crypto and artificial intelligence exposure. The Office of Government Ethics (OGE) filing shows Warsh owning or having stakes in crypto- and AI-oriented investments alongside a portfolio that pushes the total value well into nine figures. The document lists investments in funds and ventures such as Compound, Dapper Labs, and Kinetic, as well as AI-focused names including Delphi, Conversion, Factory, and Glue, among others. The disclosures accompany the nomination process ahead of a Senate confirmation hearing.
Reuters reported that the crypto and AI components of Warsh’s portfolio were not assigned explicit value ranges in the filing. Ethics rules do not require reporting for assets under $1,000, which leaves some detail about the crypto and AI investments opaque in terms of dollar amounts. The filing does, however, flag substantial holdings elsewhere, including more than $50 million in the Juggernaut Fund and more than $10 million in income from consulting fees tied to the Duquesne Family Office, the investment firm of Stanley Druckenmiller.
Trump announced Warsh as his Fed nominee in January, and the nomination moved to the Senate in March after earlier signals of dissent from within the administration. If confirmed, Warsh would succeed Fed Chair Jerome Powell, whose second four-year term ends on May 15. As of now, it remains unclear when the Senate Banking Committee will hold a hearing, though reports suggested votes could come as soon as next week.
Beyond Warsh himself, the timing underscores broader questions about leadership at the two agencies central to crypto oversight. The Securities and Exchange Commission (SEC) and the Commodity Futures Trading Commission (CFTC) are operating with vacancies that have intensified tensions around digital-asset regulation. The SEC currently has three commissioners, all Republicans, while the CFTC has just one commissioner with four seats unfilled. Lawmakers have been debating a crypto market structure bill that has stalled in the Senate since mid-2025, casting a shadow over how quickly a unified regulatory framework might emerge.
Key takeaways
- The asset disclosure places crypto- and AI-focused holdings in Warsh’s portfolio, though valuation specifics for those investments were not disclosed in the ethics filing according to Reuters.
- Ethics rules do not require reporting for assets under $1,000, a threshold that leaves some crypto and AI exposure without explicit dollar values in the public filing.
- Among the largest disclosed holdings are more than $50 million in the Juggernaut Fund and more than $10 million in consulting income from the Duquesne Family Office, the investment vehicle of Stanley Druckenmiller.
- The nomination process for Warsh coalesces with a broader regulatory backdrop, where the SEC and CFTC face leadershipVacancies amid stalled crypto legislation that could shape how digital assets are supervised.
- As central bankers with potential influence over monetary policy, Warsh’s confirmed stance could affect market conditions that interact with crypto markets, even as detailed crypto policy remains under the purview of agencies and Congress.
What Warsh’s disclosures imply for crypto policy and the Fed landscape
Warsh’s disclosure of crypto- and AI-related holdings arrives at a moment of heightened focus on how federal policy could affect digital assets. The Fed’s primary mandate—price stability and maximum employment—intersects with crypto markets insofar as monetary policy influences risk sentiment, liquidity, and capital flows that can impact the prices and adoption of digital assets. While the direct line from a central banker’s personal investments to policy decisions is complex and deliberately constrained by ethics rules, the optics of a policymaker with exposure to crypto and AI can shape investor and market interpretations of how seriously the Fed may treat these sectors in a broad financial-stability framework.
Separately, the regulatory environment for crypto remains unsettled. The Senate has been wrestling with a crypto market structure bill that has languished since July 2025, with anticipation that new leadership at financial agencies could alter its trajectory. The SEC, which remains short-handed with three commissioners, and the CFTC, operating with a single commissioner amid four vacancies, would be pivotal in implementing any new structure or guidelines for digital assets. In this climate, the choice of a Fed chair could influence the pace and emphasis of cross-agency coordination on crypto oversight, even if the immediate policy tools of the central bank are not crypto-specific.
Industry observers point out that the central bank’s influence on financial conditions—through rate signals, liquidity operations, and financial-stability considerations—will reverberate through crypto markets. Yet the exact impact depends on a matrix of regulatory actions, congressional decisions, and industry adaptation. The fact that Warsh’s filing includes crypto holdings underscores a broader market reality: the overlap between mainstream financial leadership and digital-asset ecosystems is increasingly a matter of public record and reader interest, rather than a covert footnote.
Context around Warsh’s nomination has been drawn by multiple outlets. Coverage notes that Warsh was named in January and that the Senate could act soon, following debates about the Fed’s direction and potential leadership changes in the wake of Powell’s term. The political timing matters for how quickly the administration and Congress move on not only the Fed chair but also other critical financial regulators that will shape how crypto markets operate within the U.S. financial system. For readers tracking crypto policy developments, this is a reminder that the governance layer surrounding digital assets remains a political and regulatory frontier as much as a technical one.
What to watch next for investors and builders
Key upcoming milestones include the Senate Banking Committee’s schedule for Warsh’s confirmation hearing and the broader regulatory timetable for crypto legislation. If Warsh is confirmed, market participants will be listening for signals about the Fed’s willingness to address financial stability concerns in a fast-evolving digital-asset landscape, and for any shifts in how cross-border payment rails, stablecoins, and market infrastructure might be treated under a comprehensive regulatory framework. The absence of a clear, immediate path to a crypto market structure bill keeps expectations tempered, while the congressional and regulatory cadence remains the primary driver of near-term uncertainty for the sector.
Regulators and market participants will also be watching how the Fed chair interacts with the agency leadership vacuums at the SEC and CFTC. The interplay between central bank policy signals and securities-compliance or futures-regulation regimes could shape how crypto markets respond to macro shifts, even before concrete policy changes are enacted. In practical terms, traders and builders should monitor confirmation developments, any early policy remarks from Warsh that touch on financial stability or broad market integrity, and the evolving stance of the Biden and Trump-administration-adjacent regulatory teams on digital assets.
As with any confirmation that sits at the crossroads of monetary policy and financial regulation, the path forward is likely to feature a mix of cautious optimism and cautious doubt. The market will hedge around timing, signals, and the potential for a more concrete regulatory framework that could unlock or constrain crypto adoption depending on the exact contours of the policy approach. The next weeks will reveal not only whether Warsh will chair the Fed but how his broader portfolio history, including crypto and AI exposure, will be interpreted in the context of U.S. financial governance.
For readers seeking deeper context, ongoing coverage from Reuters and Politico highlights the timing and procedural steps of the nomination process, while Cointelegraph’s broader reporting has tracked the evolving crypto-regulatory landscape as it interacts with policy and political currents.
Source notes: Reuters reported on Warsh’s disclosures and context around the nomination process; Politico provided live updates on hearing timing; Cointelegraph has covered related developments in the crypto-regulatory space. See Reuters: Warsh-files-financial-disclosure-step-towards-confirmation; Politico live updates on the nomination hearing timeline.


Goldman Sachs filed an application for a Bitcoin Premium Income exchange-traded fund (ETF) on Monday, marking one of the bank’s first direct pushes into the cryptocurrency investment space.
The proposed fund would give investors exposure to bitcoin while generating income through a premium-based strategy. The structure relies on selling options tied to bitcoin-linked ETPs, allowing the fund to collect premiums in exchange for capping some upside in strong rallies.
That trade-off — steady income versus full price participation — reflects a broader shift on Wall Street. Asset managers are increasingly trying to package bitcoin into products that resemble dividend-paying stocks or income funds, rather than relying only on price gains.
The filing comes weeks after BlackRock accelerated plans for a similar product. The asset manager is preparing to launch its iShares Bitcoin Premium Income ETF, expected to trade under the ticker BITA, following the success of its spot Bitcoin ETF, IBIT.
An updated regulatory filing earlier this month showed BlackRock refining the structure of its income-focused fund, with analysts expecting a launch within weeks.
Goldman’s move signals that competition is expanding beyond spot bitcoin exposure into more complex strategies designed to generate steady returns. These products could broaden access to bitcoin by appealing to investors who want income alongside exposure to the asset.
The filing also reflects a gradual shift in Goldman’s stance on digital assets. CEO David Solomon has said he personally owns “very little, but some” bitcoin and continues to study how the asset behaves. “I’m an observer of bitcoin,” he said recently, describing a broader effort to understand how emerging technologies are reshaping finance.
Solomon has framed crypto as part of a larger transformation driven by digital infrastructure. “Tokenization … that I think is super important,” he said, pointing to the role blockchain-based systems could play in future markets.
Still, Goldman has lagged peers such as JPMorgan and Morgan Stanley in rolling out crypto products, largely due to regulatory constraints. Solomon has suggested that tighter rules in recent years limited the bank’s ability to engage more deeply, though that stance may be shifting as policymakers provide clearer guidance.
“It’s got to be done thoughtfully, and we’ve got to get it right,” he said earlier this year.
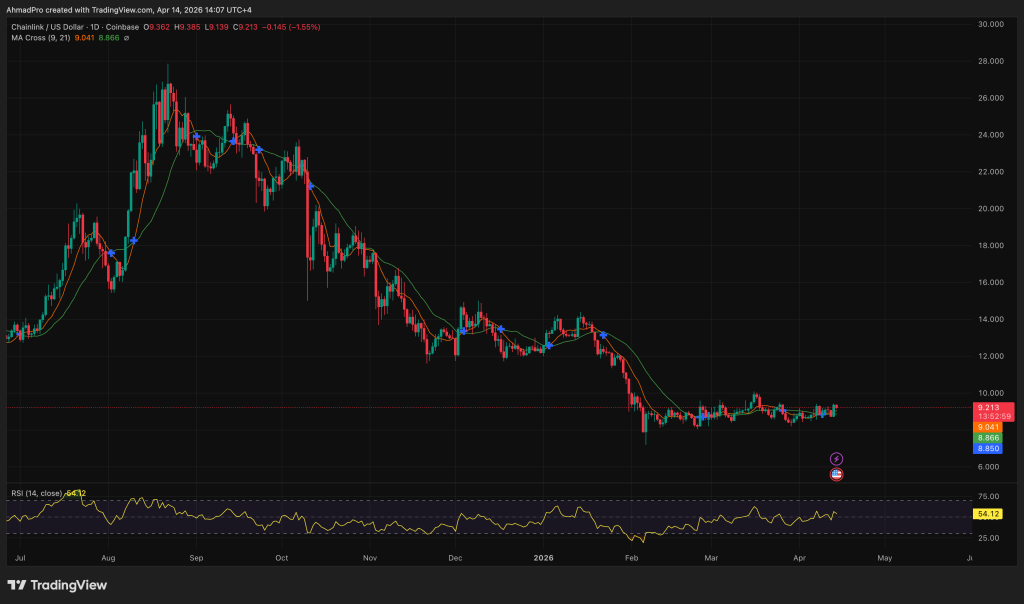
Chainlink whale activity has surged to a three-month high, with addresses holding 100,000 LINK crypto or more increasing transfers by nearly 25% above the weekly average in the past 24 hours, while LINK price itself trades in a tight consolidation band around $9.20.
Approximately 1.2 million LINK tokens have migrated off exchanges in the past 48 hours, suggesting a deliberate shift toward cold custody or staking rather than imminent selling.
The accumulation looks like conviction, but it could also be front-running a sell-the-news setup – and that tension is worth sitting with.
Chainlink Whale Transactions: What the On-Chain Data Actually Shows
Santiment data shows that addresses holding 1,000 or more LINK reached 25,420, an eight-month high, up from a Q1 2026 average of roughly 24,100.
That’s not noise; that’s a steady, deliberate climb by high-net-worth participants across a period when prices gave them little reason for optimism.
The wallet-count expansion mirrors a pattern Santiment flagged in early December 2025, the last time this threshold was breached, which preceded a multi-week price recovery.
The dollar-value specifics add weight. Over the two months leading up to LINK’s prior peak above $29, whales holding 100,000 or more tokens accumulated 5.69 million LINK, almost perfectly offsetting retail outflows of 5.67 million tokens.
In early April 2026, that dynamic compressed into a single window: whales added 1.01 million LINK worth approximately $9 million, absorbing fear-driven retail distribution in real time.
“Whales added roughly 1.01 million LINK worth about $9 million, a clear signal they see value where others see only red,” reads one market analysis circulating on the accumulation setup.
The exchange withdrawal data reinforces the read. When 1.2 million tokens leave exchange hot wallets in 48 hours, the directional signal is self-custody or staking, neither of which implies near-term selling pressure.
This pattern of large-holder withdrawals ahead of market-moving catalysts has appeared repeatedly across major assets this cycle. The on-chain data here is consistent: high-conviction holders are positioning, not distributing.
Chainlink Price Prediction: Can LINK Break $9.55 Resistance After the Whale Surge?
LINK is currently trading near $9.20, wedged below a resistance level analysts have flagged at $9.55, the threshold required to shift the bearish structure on the daily chart.
The 4-hour RSI is building a bullish divergence against price, a configuration that preceded 20% rallies in prior accumulation windows, according to on-chain crypto market analysis tracking LINK’s technical setup.
The 50-day SMA sits above the current price and has been acting as a ceiling since the Q1 pullback; the 200-day SMA remains further overhead, roughly in the $11–12 range depending on the lookback.
A clean break above $9.55 opens the path toward the $9.97–$10.00 resistance cluster, where prior consolidation and psychological round-number selling tend to converge.
Bitcoin’s April seasonal strength, historical average gain of +12.4% – provides a macro tailwind, but LINK’s correlation means a Bitcoin reversal would complicate the thesis quickly.
Close below $8.30 support puts the entire accumulation narrative at risk; that’s the level where whale cost-basis estimates from the April buy window start showing losses.
The technical picture and on-chain data are aligned in a way that doesn’t happen often. Whether that alignment resolves upward or simply marks a prolonged base before another leg down depends almost entirely on whether Bitcoin cooperates and open interest stabilizes.
On-chain whale signals in Ethereum have shown similar setups recently, with results that took longer than the chart implied to materialize – which is either very reassuring context or a reminder that timing these setups is harder than identifying them.
Discover: The best pre-launch token sales
LiquidChain Targets Early Mover Upside as Chainlink Tests Key Levels
LINK at $8.72 with a multi-billion-dollar market cap means even a bullish outcome – say, a move back toward $29 – represents roughly a 3x from current levels.
That’s meaningful, but it’s not the asymmetric upside profile that earlier-stage exposure to the same ecosystem thesis could offer. For traders who believe in the LiquidChain infrastructure narrative but want a different risk/reward entry point, LiquidChain is running a presale at $0.01449 per token.
LiquidChain describes itself as a Layer 3 Unified Liquidity Layer designed to fuse Bitcoin, Ethereum, and Solana liquidity into a single execution environment, a Deploy-Once architecture, Single-Step Execution, and Verifiable Settlement.
The presale has raised meaningful early capital, the project has completed a CertIK audit, and staking during the presale window carries a headline APY of 1,600% – a figure that will compress as participation scales, which is standard for early-stage staking incentive structures.
Institutional accumulation patterns in major assets this cycle suggest the appetite for earlier-stage infrastructure plays is growing alongside the large-cap trades.
Early-stage L3 infrastructure projects carry meaningful risk; token utility depends entirely on developer execution and liquidity adoption post-launch.
The 1,600% APY is an incentive structure, not a yield guarantee – and presale tokens require the project to deliver on the ecosystem thesis before that staking rate means anything in dollar terms. DYOR applies in full.
Join the LiquidChain presale here
The post Chainlink Whale Accumulation Hits 3-Month High Amid Liquidchain Listing Buzz appeared first on Cryptonews.
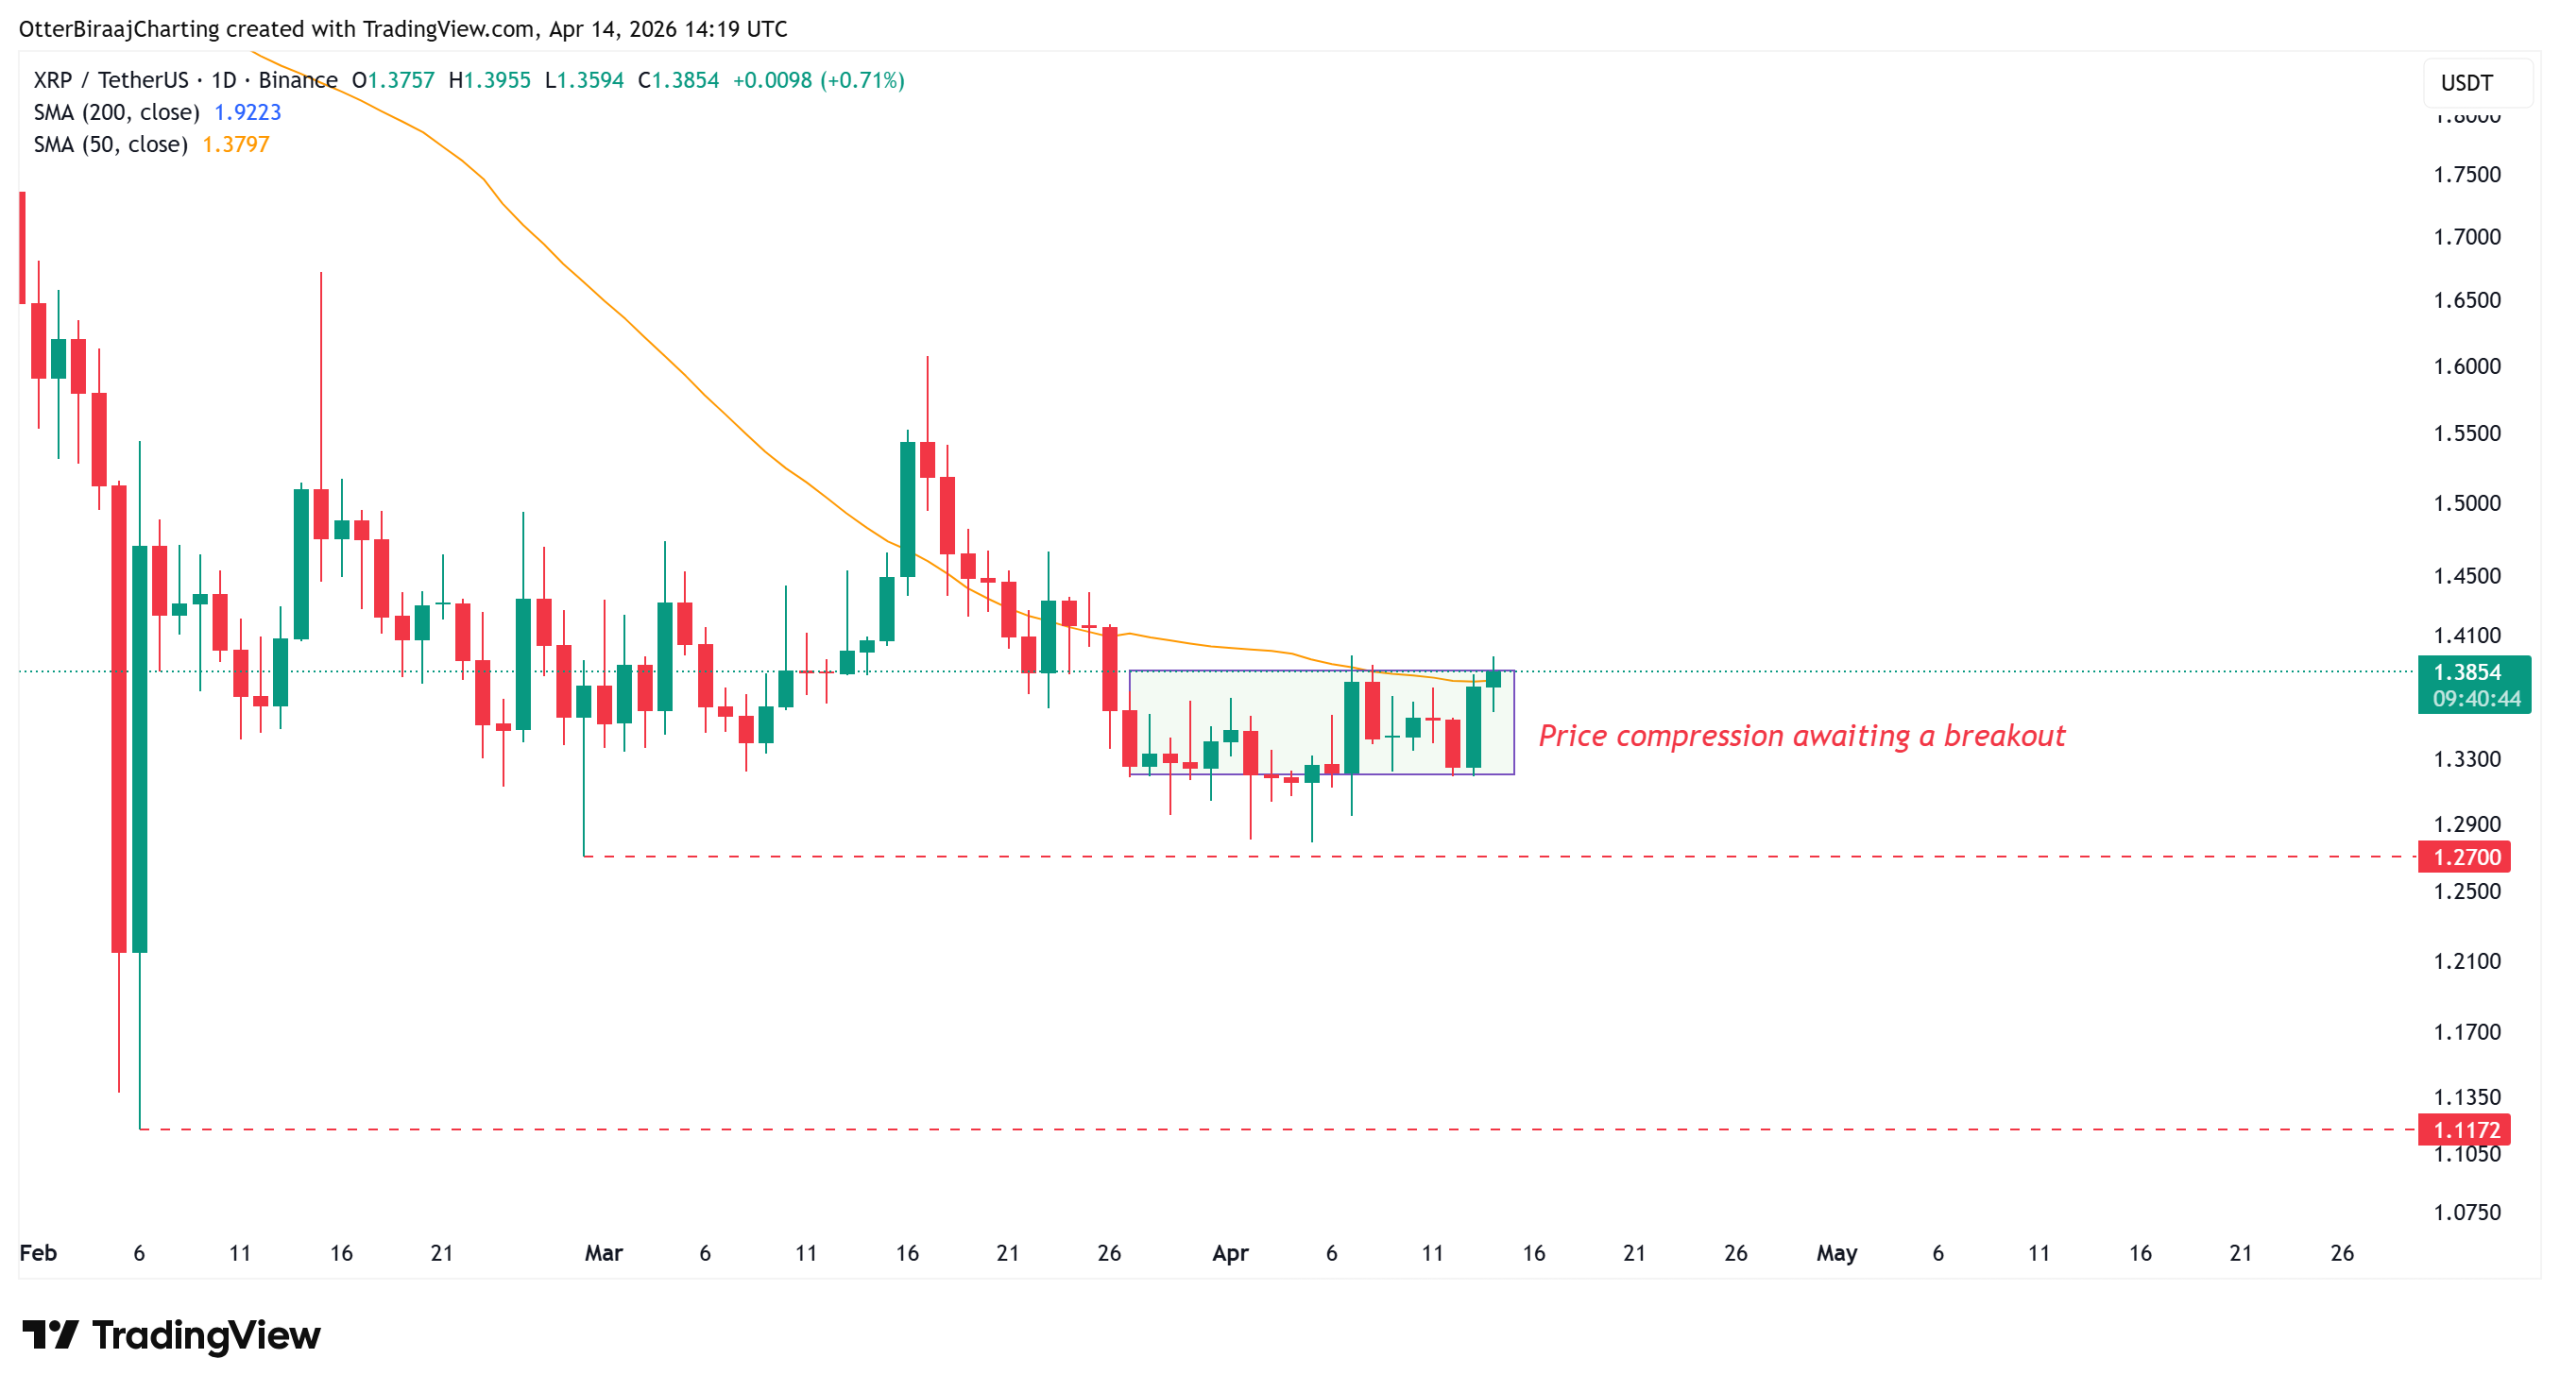
XRP (XRP) has consolidated within a tight price range below $1.40 over the past 20 days, but new data suggests it may be poised for a bullish breakout after a shift in Binance activity signals reduced sell-side pressure.
Binance’s withdrawal and deposit activity is flashing a setup that mirrors June 2025, when the altcoin embarked on a rally to $3.65.

XRP Binance deposits drop to 2025 lows
Crypto analyst Amr Taha noted a shift in XRP activity on Binance, with transaction flows moving away from deposit-heavy behavior. The seven-day average shows XRP withdrawals rising to 53% while deposits dropped to 46%, returning to the levels last seen in June 2025.

That prior setup aligned with a 65% XRP rally to all-time highs of $3.65 in July 2025, placing the current shift on traders’ radar.
The falling deposit activity signals fewer coins moving onto exchanges, while rising withdrawals indicate assets leaving exchanges. This reduces immediate sell-side pressure if sustained over multiple trading sessions.
Currently, XRP flow on Binance is no longer dominated by incoming supply. This indicates a change in trader positioning, with fewer participants preparing to sell into the market.
Meanwhile, liquidity has contracted sharply. CryptoQuant data shows XRP’s 30-day liquidity index on Binance dropping to 0.053, the lowest level since 2021. The 30-day trading volume stands at nearly 3.77 billion XRP, marking one of the weakest periods of activity in recent years.

The price action aligns with this slowdown. XRP trades near $1.38 with limited movement over the past three weeks, consistent with a quieter order book and reduced trader participation. These lower-liquidity phases may coalesce momentum and precede a stronger directional move once activity returns.
Related: Bitcoin’s struggle to build long-lasting uptrend continues: Here’s why
XRP traders position in futures markets
While XRP price consolidates, onchain data shows an aggregated spot cumulative volume delta (CVD) of -$153 million and a futures CVD near -$295 million, pointing to a reduction in aggressive selling.

The buy-side activity has not expanded, keeping the price movement muted. The funding rates have turned slightly positive at 0.06%, signaling a mild long bias.
Open interest has climbed to nearly $769 million, suggesting fresh positions are entering the market.

From a technical perspective, a daily close above $1.40 opens the door to $1.60–$1.67. That $1.40 level also aligns with the 50-day moving average, which may flip into support on a bullish breakout.
The liquidation data shows roughly $250–$300 million in cumulative long/short positions at risk within a 10% move in either direction. Compared to larger assets like BTC (BTC) and Ether (ETH), the liquidity is relatively small, suggesting lower trader participation near $1.40.
Related: XRP Ledger taps Boundless for bank-grade privacy on public blockchains
This article is produced in accordance with Cointelegraph’s Editorial Policy and is intended for informational purposes only. It does not constitute investment advice or recommendations. All investments and trades carry risk; readers are encouraged to conduct independent research before making any decisions. Cointelegraph makes no guarantees regarding the accuracy or completeness of the information presented, including forward-looking statements, and will not be liable for any loss or damage arising from reliance on this content.
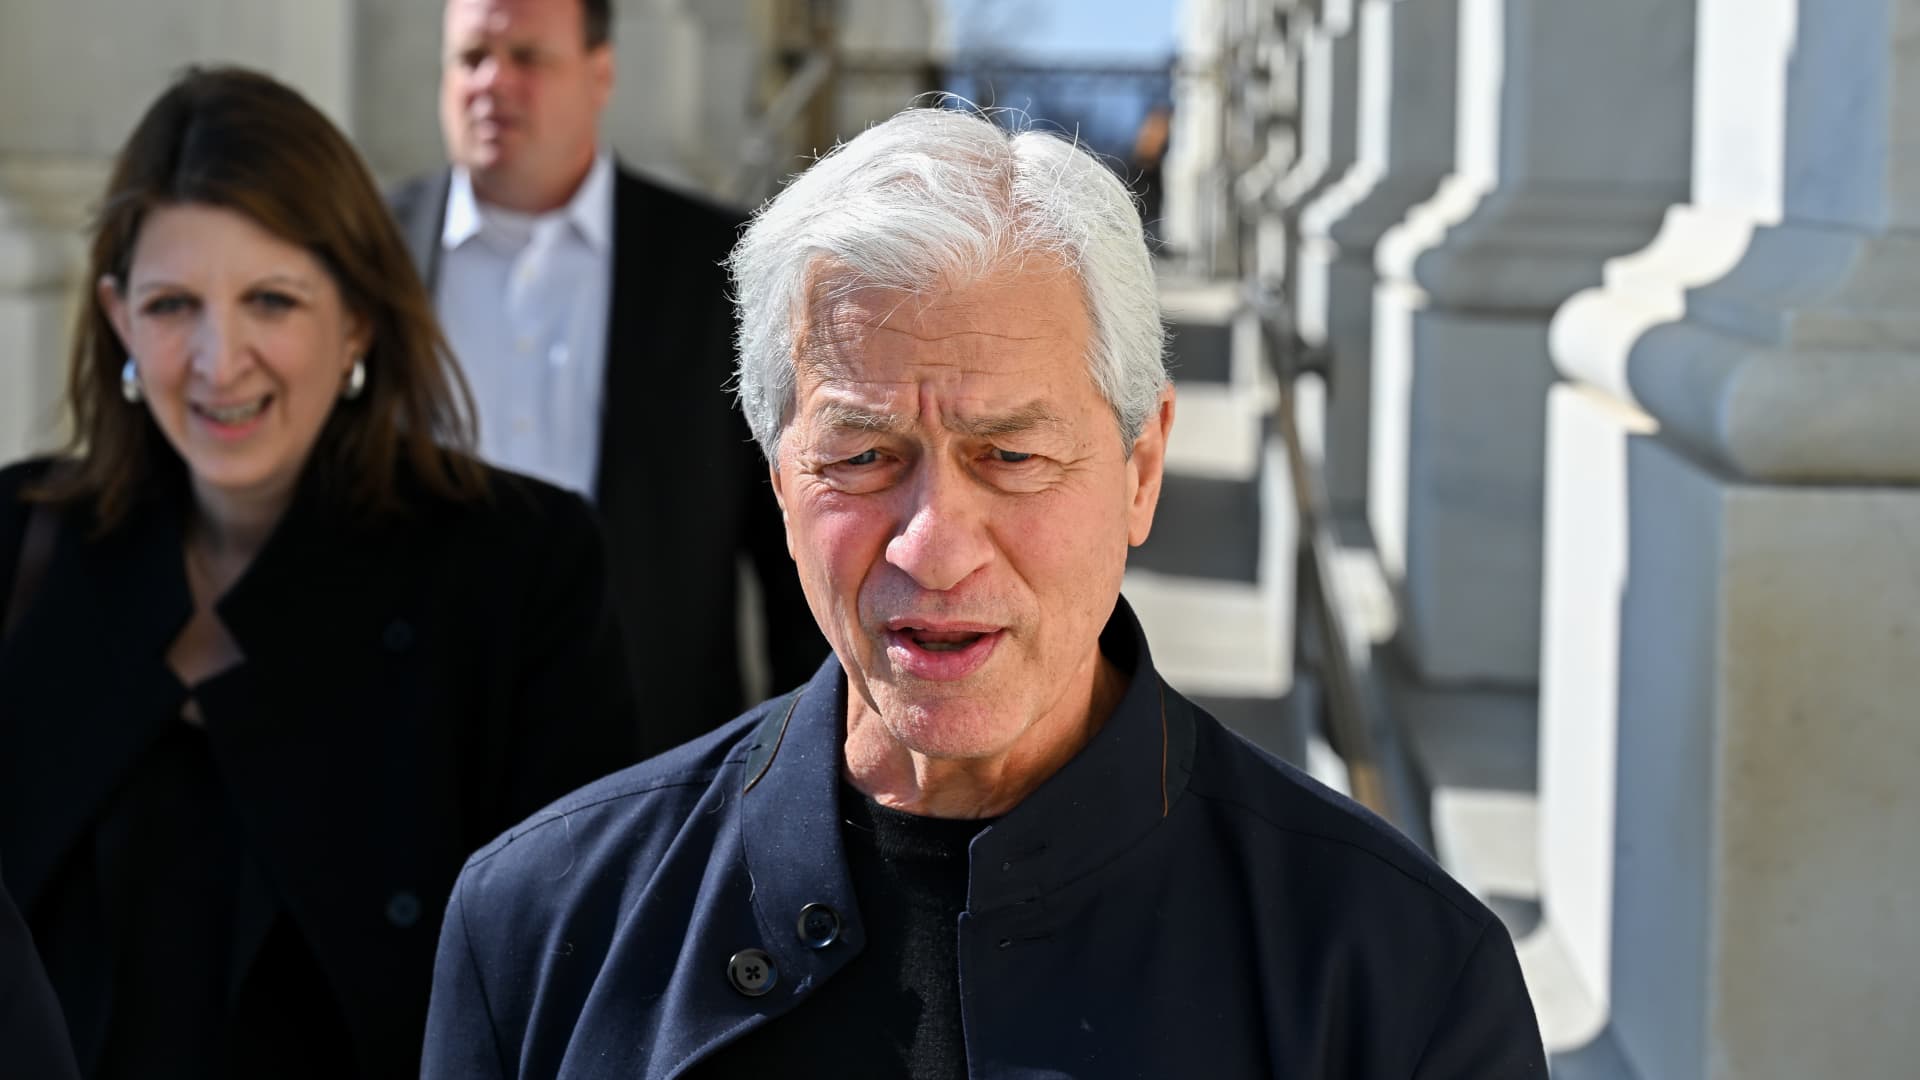
Jamie Dimon, chief executive officer of JPMorgan Chase & Co., right, departs the US Capitol in Washington, DC, US, on Wednesday, Feb. 25, 2026.
Graeme Sloan | Bloomberg | Getty Images
JPMorgan Chase CEO Jamie Dimon said Tuesday that while artificial intelligence tools could eventually help companies defend themselves from cyberattacks, they are first making them more vulnerable.
Dimon said that JPMorgan was testing Anthropic’s latest model — the Mythos preview announced by the AI firm last week — as part of its broader effort to reap the benefits of AI while protecting against bad actors wielding the same technology.
“AI’s made it worse, it’s made it harder,” Dimon told analysts on the bank’s earnings call Tuesday morning. “It does create additional vulnerabilities, and maybe down the road, better ways to strengthen yourself too.”
When asked by a reporter about Mythos, Dimon seemed to refer to Anthropic’s warning that the model had already found thousands of vulnerabilities in corporate software.
“I think you read exactly what is it,” Dimon said. “It shows a lot more vulnerabilities need to be fixed.”
The remarks reveal how artificial intelligence, a technology welcomed by corporations as a productivity boon, has also morphed into a serious threat by giving bad actors new ways to hack into technology systems. Last week, Treasury Secretary Scott Bessent summoned bank CEOs to a meeting to discuss the risks posed by Mythos.
JPMorgan, the world’s largest bank by market cap, has for years invested heavily to stay ahead of threats, with dedicated teams and constant coordination with government agencies, Dimon said.
“We spend a lot of money. We’ve got top experts. We’re in constant contact with the government,” he said. “It’s a full-time job, and we’re doing it all the time.”
‘Attack mode’
Still, the CEO warned that risks extend beyond any single institution, given the interconnected nature of the financial system.
“That doesn’t mean everything that banks rely on is that well protected,” Dimon said. “Banks… are attached to exchanges and all these other things that create other layers of risk.”
JPMorgan Chief Financial Officer Jeremy Barnum said the industry has long been aware that AI cuts both ways in cybersecurity.
“These tools can make it easier to find vulnerabilities, but then also potentially be deployed by bad actors in attack mode,” Barnum said on the earnings call. Recent advances from Anthropic and others have simply intensified an existing trend, he said.
Dimon also said that while advanced AI tools are important, old-school cybersecurity practices remain essential.
“A lot of it is hygiene… how do you protect your data? How do you protect your networks, your routers, your hardware, changing your passcode?” he said. “Doing all those things right dramatically reduces the risk.”
Goldman Sachs CEO David Solomon said Monday during an earnings call that his bank was testing Mythos, though he declined to comment further.


Blockchain investigator ZachXBT has linked a fake Ledger Live app to over 50 victims, who have lost a total of $9.5 million worth of crypto between them.
He traced stolen funds to KuCoin deposit addresses and called out the crypto exchange via Telegram and X.
Over 150 addresses tied to a known money laundering service were reportedly used to deposit stolen funds to the exchange.
App Store honeypot
Garrett Dutton of the band G. Love & Special Sauce initially drew attention to the fake wallet app, previously available on Apple’s App Store, when he took to X on Saturday to lament losing his retirement fund “in an instant.”
Dutton’s thread explains that he lost 5.9 bitcoin (BTC),worth approximately $440,000, after being “tricked” into entering his seed phrase into the app.
Read more: Thai police want Interpol to track alleged KuCoin money launderer
Around 12 hours after Dutton’s post, ZachXBT flagged nine transaction IDs which the sleuth claims show Dutton’s BTC being “laundered” via crypto exchange KuCoin.
Two days later, ZachXBT published a follow-up community alert to his Investigations Telegram group. It linked the fake app to “$9.5M stolen from 50+ suspected victims between April 7–13 across Bitcoin, EVM, Tron, Solana, & Ripple.”
The top three victims reportedly lost a combined total of $7.25 million in various cryptocurrencies.
KuCoin under fire
ZachXBT’s Telegram post also tied over 150 KuCoin deposit addresses to money laundering service AudiA6.
He also called out KuCoin on X, where he highlighted both these fake Ledger Live app-linked thefts and the recent Bitcoin Depot loss, accusing the exchange of allowing money launderers to “operate freely.”
Read more: Bitcoin Depot didn’t spot 50 BTC hack for three days, report
The exchange eventually replied to ZachXBT’s list of theft addresses in the Dutton case, 48 hours after it was posted. Other on-chain investigators have flagged addresses allegedly linked to scams who have deposited significant sums to KuCoin over recent weeks.
Just over two years ago, KuCoin and two of its founders were charged with flouting U.S. anti-money laundering laws.
Protos reached out to KuCoin, but it did not respond immediately, we will update this piece if we hear back.
Got a tip? Send us an email securely via Protos Leaks. For more informed news, follow us on X, Bluesky, and Google News, or subscribe to our YouTube channel.

Ethereum revisits 2025 fractal that previously fueled a 250% rally
The Sun is losing money fast

Man United ‘delay Michael Carrick offer’ after manager update alters thinking


-

 Politics4 days ago
US brings back mandatory military draft registration
-
 Sports4 days ago
Man United discover Nico Schlotterbeck transfer fee as defender reaches Dortmund agreement
-

 Fashion4 days ago
Weekend Open Thread: Veronica Beard
-

 Tech7 days ago
How Long Can You Drive With Expired Registration? What Florida Law Says
-

 Politics5 days ago
Malcolm In The Middle OG Turned Down ‘Buckets Of Money’ To Appear In Reboot
-

 Politics2 days ago
World Cup exit makes Italy enter crisis mode
-

 Crypto World5 days ago
Canary Capital Files SEC Registration for PEPE ETF
-

 Business4 days ago
Tesla Model Y Tops China Auto Sales in March 2026 With 39,827 Registrations, Beating Cheaper EVs and Gas Cars
-

 Crypto World23 hours ago
The SEC Conditionalises DeFi Platforms to Be Avoided for Broker Registration
-

 Crypto World20 hours ago
SEC Signals Exemption for Crypto Interfaces From Broker Registration
-

 Crypto World6 days ago
Bitcoin recovers as US and Iran Agree a Ceasefire Deal
-
 NewsBeat2 days ago
Pep Guardiola and Gary Neville agree over Arsenal title problem that benefits Man City
-

 Business4 days ago
OpenAI Halts Stargate UK Data Centre Project Over Energy Costs and Copyright Row
-

 Business3 days ago
Ireland Fuel Protests Enter Day 5 as Blockades Spark Shortages and Government Prepares Support Package
-

 Politics5 days ago
LBC Presenter Mocks Trump Over Iran War Failures
-

 Crypto World4 days ago
Federal judge blocks Arizona from bringing criminal charges against Kalshi
-

 Tech5 days ago
A version of Windows 10 released a decade ago is now eligible for additional security patches
-
 NewsBeat2 days ago
JD Vance announces ‘no agreement’ with Iran over nuclear weapons fear
-

 Business4 days ago
IMF retains floor for precautionary balances at SDR 20 billion
-

 Crypto World12 hours ago
SEC Proposes Certain Crypto Interfaces Don’t Need to Register as Brokers
You must be logged in to post a comment Login