
Crypto World
Cardano (ADA) Price Analysis: Bearish Momentum Dominates Despite Positive Macro Signals
TLDR
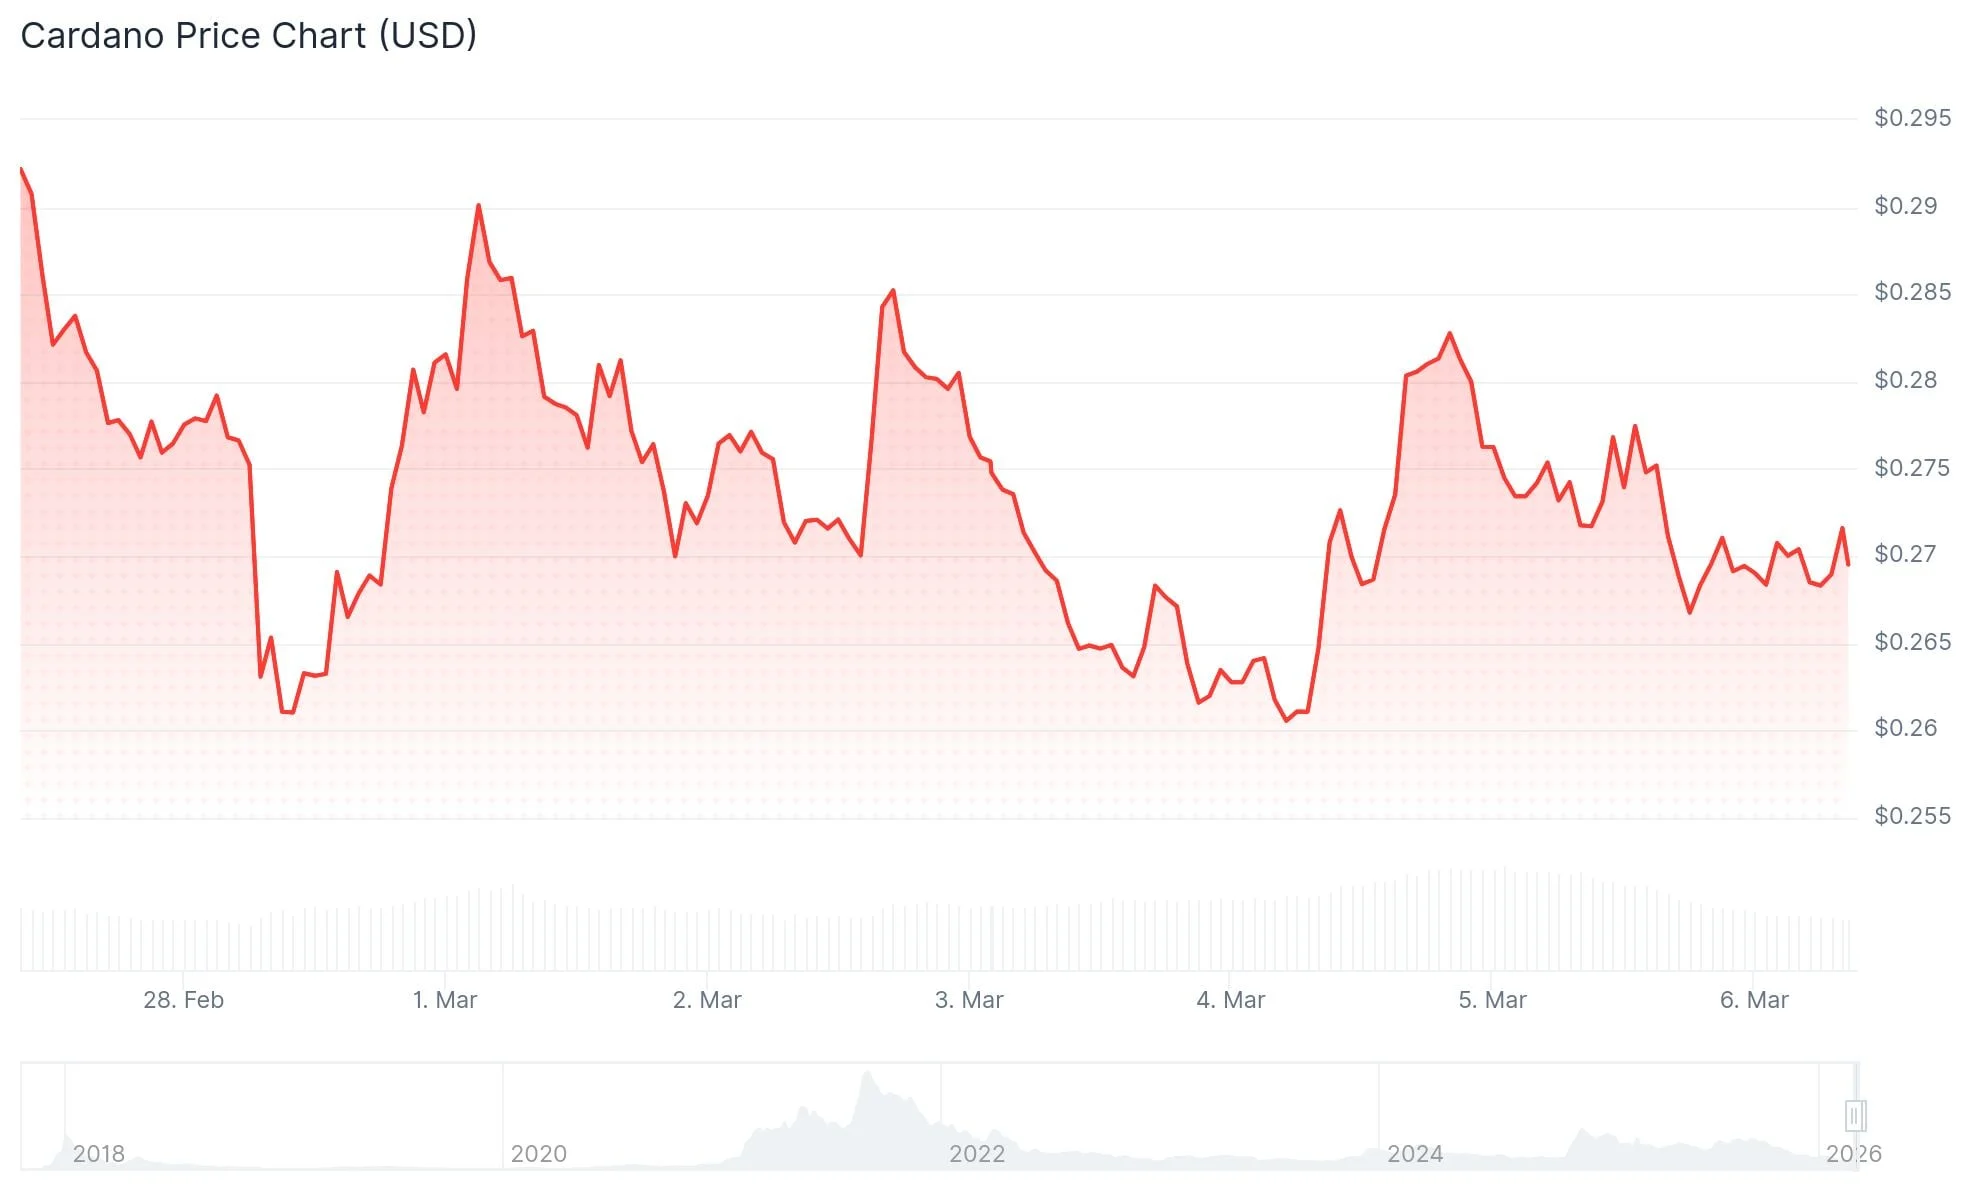
- Cardano is hovering near $0.27, facing critical resistance at a descending trendline around $0.28 that has consistently rejected upward moves
- Futures open interest has declined to $462 million, and the long-to-short ratio of 0.79 reflects dominant bearish sentiment
- Price action remains significantly below the 50-day and 100-day EMAs, both positioned above the $0.30 mark
- The Relative Strength Index stands at 46, below the neutral threshold, indicating limited momentum strength
- Manufacturing PMI has climbed to 52.4%, marking the third straight monthly gain in a 40-month period—a pattern historically linked to ADA rallies
Cardano (ADA) continues to trade around the $0.27 level this Thursday, March 6, as the cryptocurrency tests a critical descending trendline positioned near $0.28. This technical barrier has proven formidable in recent sessions, rejecting price advances and maintaining its role as the primary short-term obstacle.
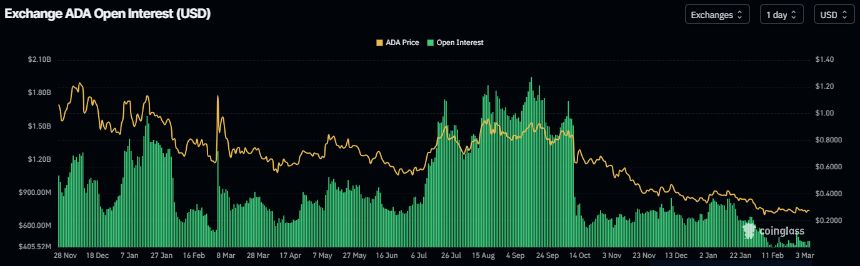
Futures market data reinforces the bearish narrative. Open interest in Cardano futures contracts has contracted to $462 million, marking a steady decline since the middle of January.
When open interest decreases while price action remains stagnant or declines, it typically indicates waning trader participation and reduced market conviction.
CoinGlass data shows the long-to-short ratio currently at 0.79—approaching its lowest reading in more than 30 days. This metric reveals that short positions outnumber long positions, confirming that market participants are predominantly betting on further price declines.
From a technical perspective, ADA remains substantially below both its 50-day and 100-day Exponential Moving Averages, which are clustered above the $0.30 threshold. This distance underscores the prevailing downtrend that has gripped the asset.
The daily Relative Strength Index registers at 46. Though it has rebounded from oversold conditions, the indicator remains beneath the 50 centerline, signaling that bullish momentum has yet to establish itself convincingly.
The MACD indicator shows marginally positive readings, but the histogram displays minimal movement. This configuration suggests consolidation rather than the emergence of a definitive trend reversal.
Key Price Levels to Watch
Looking at resistance zones, the immediate hurdle lies at the descending trendline near $0.28. A more formidable barrier exists at $0.32, where the downward-sloping EMAs also intersect.
A sustained daily close above $0.32 would be necessary to invalidate the current bearish framework and signal potential trend change.
On the downside, support is established at $0.26, with a secondary floor at $0.24. Should ADA breach the $0.24 level, it would likely trigger additional selling pressure.
Under current conditions, ADA appears poised to remain range-bound between $0.26 and $0.29 absent a significant market catalyst.
Macro Indicator Points to Possible Shift
Bitcoin recently broke through the $73,000 barrier, reaching a one-month peak, yet ADA failed to capitalize on this momentum. The altcoin registered only modest gains and couldn’t sustain a close above the prior session’s high.
Crypto analyst Dan Gambardello has highlighted the manufacturing Purchasing Managers Index (PMI) as a potentially significant indicator for Cardano’s medium to long-term trajectory.
The PMI, which measures manufacturing sector vitality, currently registers at 52.4%. This marks the third consecutive monthly advance over a 40-month timeframe.
Gambardello emphasizes that historical PMI expansion periods have frequently coincided with bullish cycles for ADA price performance.
The present configuration also bears resemblance to the 2019 correction phase, during which ADA experienced red monthly candles in six out of seven months before staging a substantial recovery.
Quantitative tightening concluded in December 2025. According to Gambardello, this development coupled with an ascending PMI creates a macro environment similar to the conditions that preceded Cardano’s previous significant price rally.
Cardano is now experiencing its sixth consecutive monthly decline following a negative February close.


Hyperliquid (HYPE) price is trading at $38.27, down 2.31% on the day, as a completed double top pattern and a dense liquidation cluster at $35.03 raise the odds of an accelerated leg lower.
The token has failed to hold gains above $42.67, and the price is now consolidating. Two independent signals now define the near-term trend line.
HYPE Long Traders Should Be Worried
The HYPE liquidation heatmap shows a dense band of leveraged long positions clustered around $35.03. Cumulative long liquidation leverage at that level totals $27.36 million.
A move below $35.03 would trigger the forced closure of those positions in rapid succession. This would create mechanical selling pressure that could accelerate any decline well beyond the initial breakdown.
Want more token insights like this? Sign up for Editor Harsh Notariya’s Daily Crypto Newsletter here.
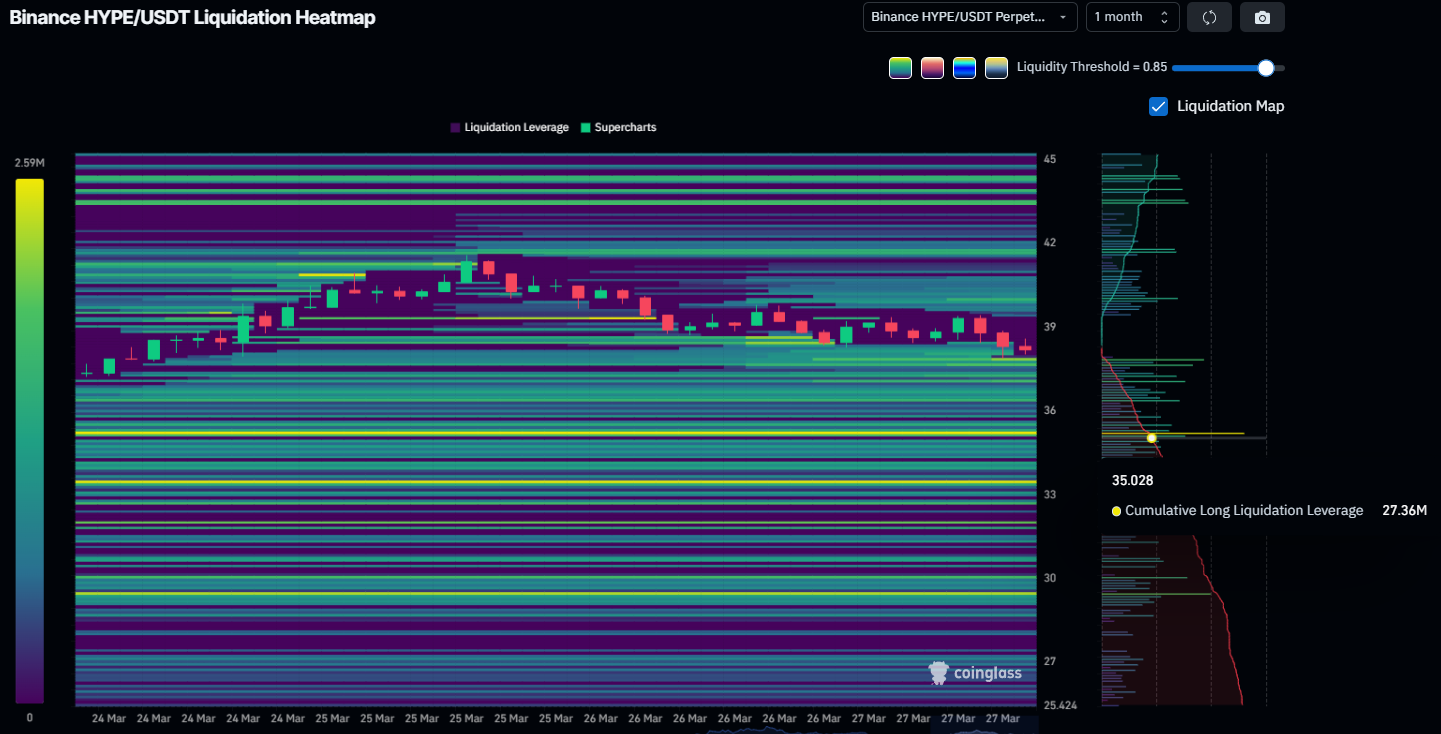
The heatmap shows relatively thin liquidation stacking between $38 and $35, suggesting the price could slice through that range with limited friction. The absence of significant long-side leverage above $39 further limits the likelihood of a demand-driven reversal before the $35.03 test arrives.
Selling Pressure Set Dominates HYPE
The Klinger Oscillator (KVO) is currently reading 8.09K on the daily chart, sitting just above the zero line with a clear downward trajectory. The signal line (green) has already turned lower, and the KVO (blue) is converging toward a bearish crossover.
The Klinger Oscillator measures the difference between two volume-weighted EMAs of price to gauge whether money is flowing into or out of an asset. When it rises above zero, buying pressure dominates; when it falls below zero, selling pressure takes control.
The indicator peaked near 25K in early March, coinciding with HYPE’s rally to $43.76. Since then, momentum has declined in three successive lower highs, a pattern of deteriorating buying pressure that mirrors the price action.
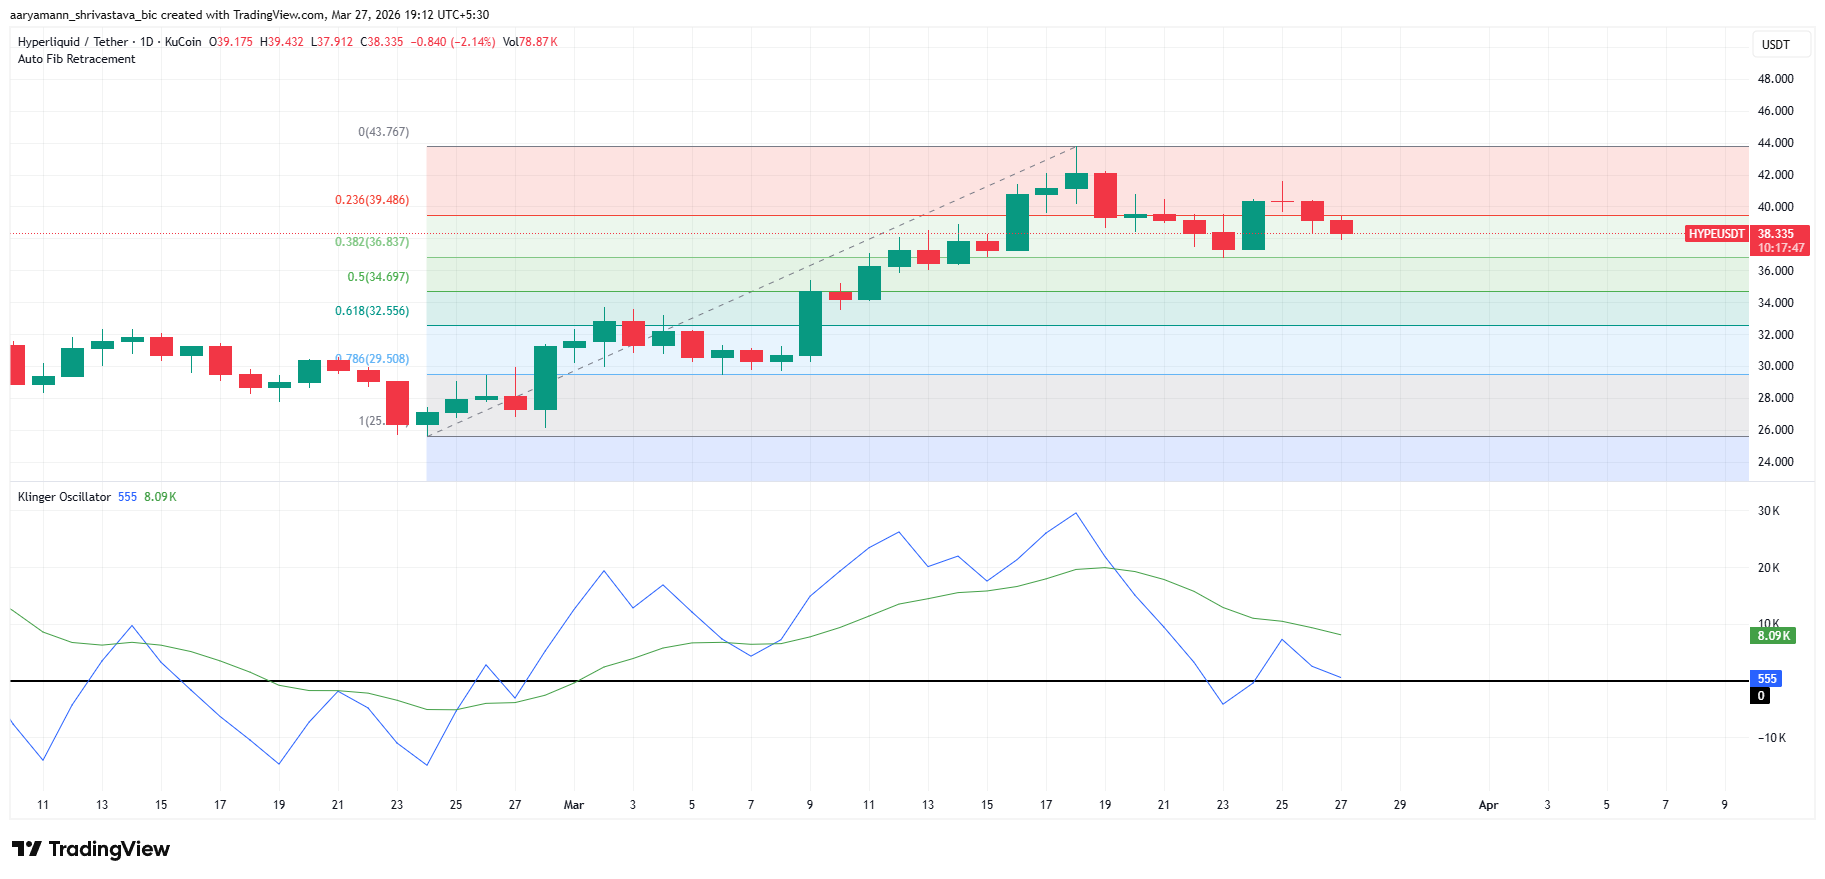
A confirmed cross below zero on the KVO would shift volume-weighted momentum from bullish to bearish. Historically, on the HYPE daily chart, both prior KVO zero-line breaks preceded drawdowns.
The 0.382 Fibonacci retracement level sits at $36.83, offering the first meaningful demand zone before price reaches the $35.03 liquidation cluster. Should the KVO break below zero while the price is below $36.83, the path to $32.33 — the 0.618 Fibonacci level — becomes the primary scenario.
HYPE Price Levels To Watch
The daily chart shows HYPE has completed a double top breakdown, now underway. Price is currently sitting at $38.27, hovering around the support at the same level.
The pattern’s full downside projection is calculated from the breakdown point at the $35.03 neckline. This points HYPE to $21.64 on a confirmed breakdown, matching the 37.49% decline annotated on the chart.
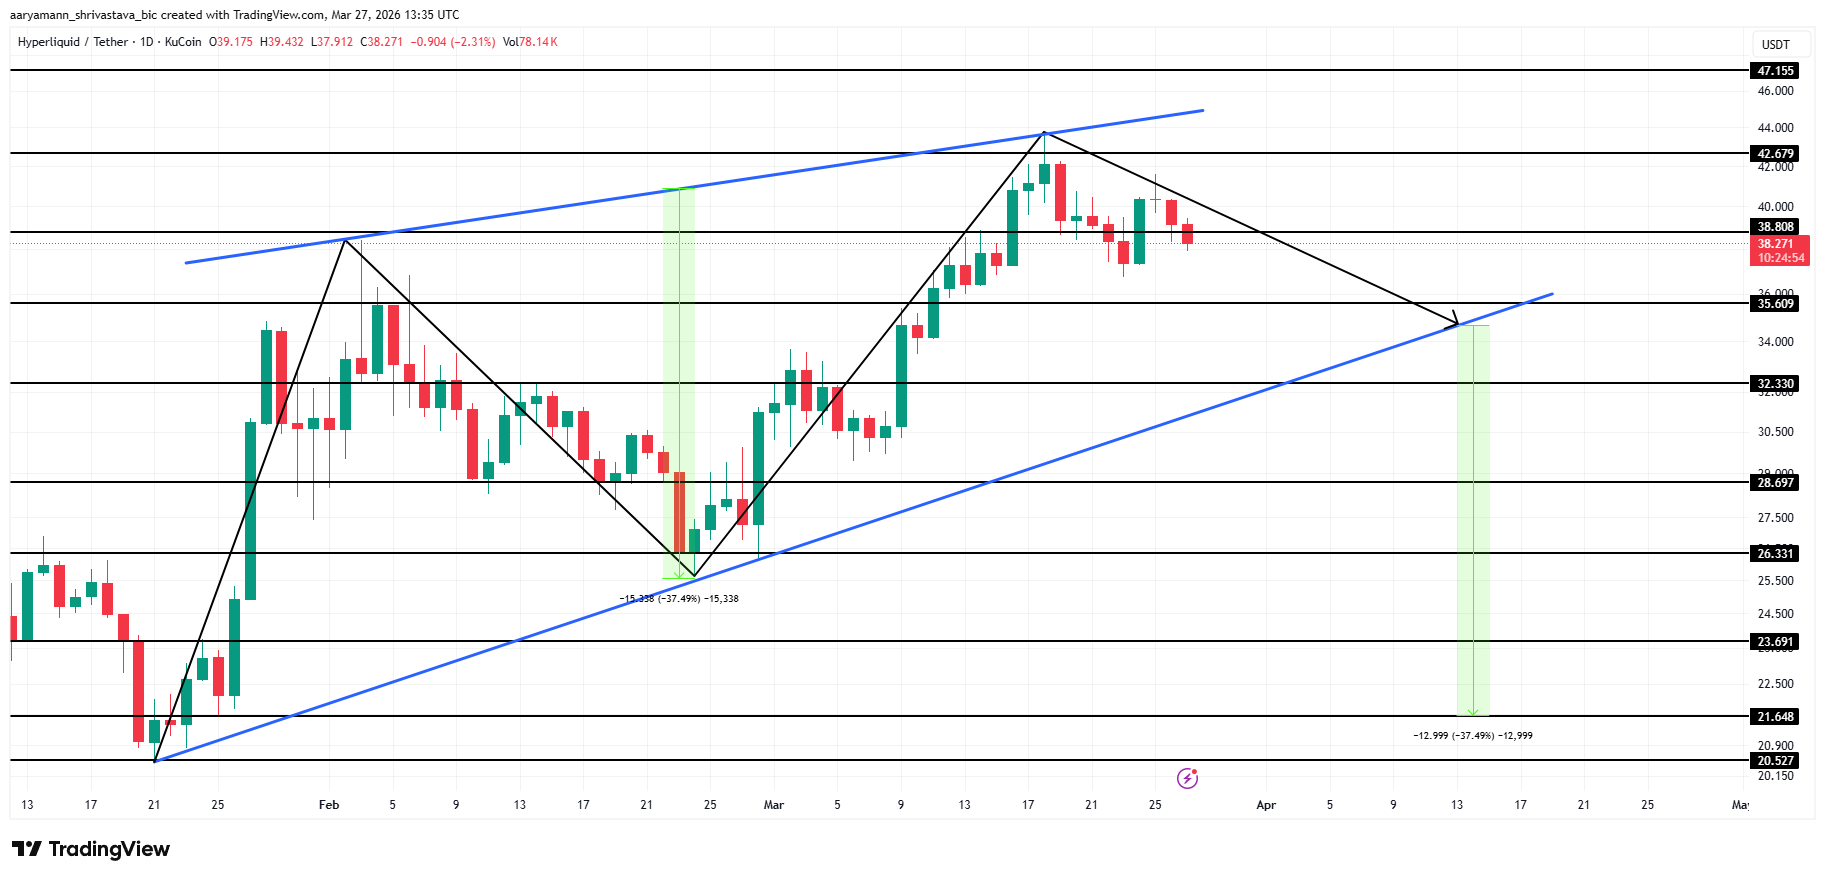
Holding $35.03 is therefore non-negotiable for bulls. Only a daily close below it would confirm the double top and open the door to $32.33 first, then $28.69.
For the bearish thesis to be invalidated, HYPE would need to reclaim $38.80 and then push through $42.67 with conviction. A break above $42.67 would negate the double top structure entirely, shifting the bias back toward the $47.15 resistance.
The post 2 Reasons Why $35 Is a Critical Juncture for Hyperliquid (HYPE) Price appeared first on BeInCrypto.


Bitget CEO Gracy Chen says a $1t single‑day US stock wipeout is accelerating a global macro risk reset, while lower leverage helps Bitcoin act more like a neutral portfolio allocation than a pure risk punt.
Summary
- Over $1 trillion was wiped from US stocks in a single day as risk assets sold off.
- Bitget CEO Gracy Chen says the slide has accelerated a global “reassessment of macro risks.”
- Bitcoin’s smaller drawdown and lower leverage hint at growing status as a neutral allocation.
In the wake of a sharp US equity selloff that erased more than $1 trillion in market value in a single session, Bitget CEO Gracy Chen says the rout is forcing investors to reprice macro risk at a much faster clip while Bitcoin (BTC) is starting to behave more like a neutral, portfolio-level allocation than a pure risk-on punt. According to ChainCatcher, the CEO’s remarks are the latest on top of a broader drawdown that has already knocked trillions off US benchmarks since President Donald Trump’s second-term tariff agenda reignited inflation fears and hit tech-heavy names. As of Friday morning, Bitcoin was trading around $66,500, down roughly 4% on the day but still outpacing major stock indices on a relative basis.
Gracy Chen: $1t US stock selloff shows Bitcoin becoming neutral allocation
Chen argued that the current move is less about idiosyncratic crypto stress and more about global portfolios digesting a new regime of higher energy prices, stickier inflation, and geopolitical conflict spilling over into capital allocation decisions. “This round of adjustment reflects that global markets are reassessing macro risks at a faster pace,” she said, adding that as oil spikes again, “the impact of geopolitical changes is no longer limited to the energy market but is beginning to more directly affect global capital allocation.” The comment comes as strategists at Bloomberg and elsewhere flag how renewed tariff salvos and conflict risk have turned the post-2024 equity boom into what one Bloomberg analysis called a “$1 trillion wreckage,” even as Bitcoin’s institutional scaffolding has largely held.
Despite warning that Bitcoin will “still maintain high volatility in the short term,” Chen highlighted that the asset’s behavior this week has been “relatively robust” compared with previous episodes when risk appetite collapsed. She pointed to a sharp reduction in derivatives leverage as a key reason: “The overall leverage in the crypto market has significantly decreased, thereby limiting the scale of forced liquidations that typically amplify downward pressure during market stress.” That fits with recent flows data showing Bitcoin spot ETFs have seen bouts of outflows but not the kind of capitulation that marked prior crashes, while Bitget’s own protection and risk systems have been tightened as volatility climbed.
For Chen, the resilience is sending a signal about how Bitcoin is being used. “In an increasingly fragmented macro environment, Bitcoin is starting to be viewed by some portfolios as a more neutral allocation choice,” she said. That echoes her earlier comments that recent drawdowns are “tightly linked to the macro cycle,” with investors rotating between crypto, equities, and gold as they navigate Trump’s tariff-led policy shock and rising odds of a US recession. According to a recent crypto.news story, US markets have wiped out $9.6 trillion in value since Trump’s second inauguration, even as Bitcoin has repeatedly bounced after single-day drops of 1%–5%, underlining its evolving role in a world where macro risk is now the dominant driver of asset prices.
In earlier coverage, crypto.news detailed how a previous wave of selling erased $1.1 trillion from digital assets in just 41 days as leverage cascades intensified the downside, a backdrop that makes today’s more orderly drawdown stand out. Another recent story examined how the same tariff and inflation shock that hit tech stocks has rippled through crypto, while a separate report tracked how Bitcoin’s price has stayed comparatively resilient even as US equity indices flirt with bear-market territory. For live market data on Bitcoin, readers can follow its price page on crypto.news, alongside dedicated pages for other major assets involved in these rotations, including Ethereum, XRP, Solana, and Dogecoin.
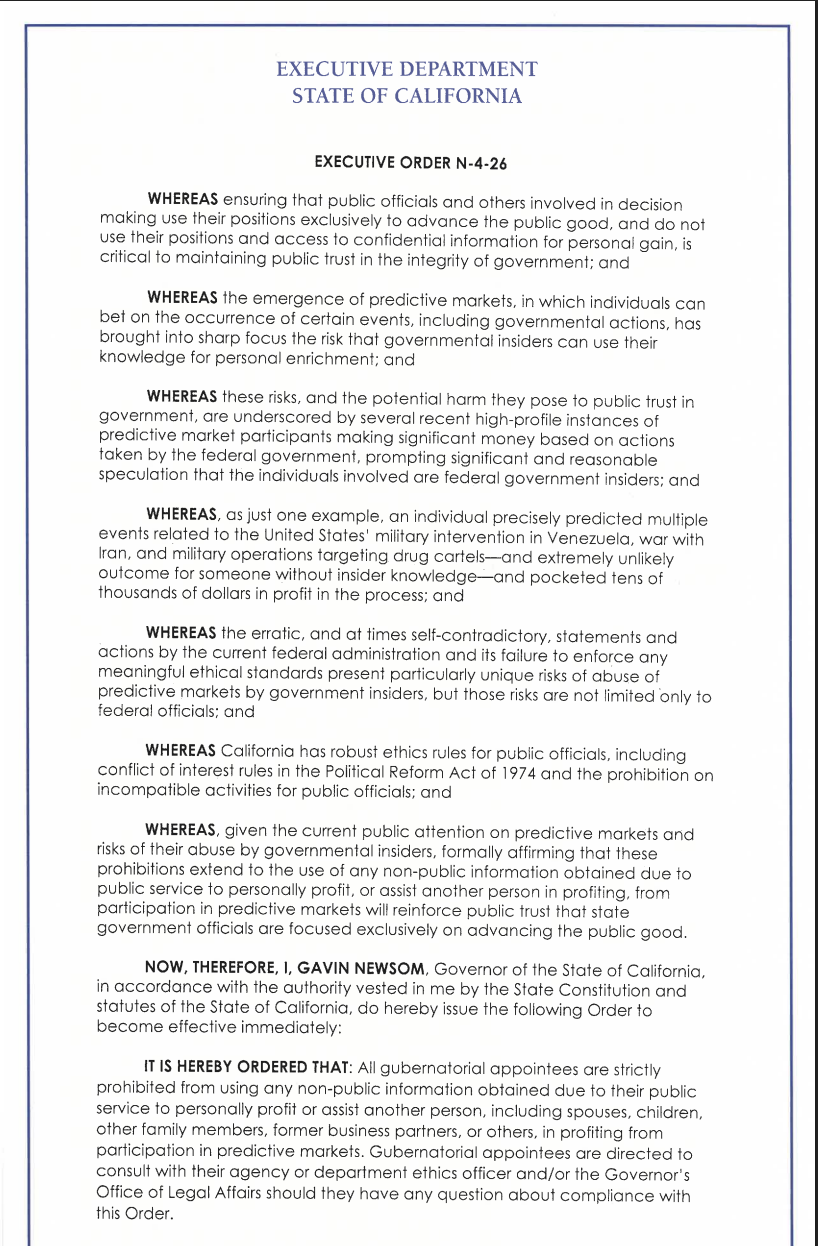
California Governor Gavin Newsom signed an executive order on Friday, expanding rules to curb public servants and those close to them from benefiting from insider trading on prediction markets tied to political or economic events they can influence or are privy to.
The order prohibits “gubernatorial appointees,” public officials appointed to office by the governor of the state, from using “confidential or non-public information” gleaned from performing their duties to profit from related prediction markets.
Newsom’s executive order also extends the prohibition to include spouses, family members or former business partners of the appointed officials from using non-public information to profit. “Public service should not be a get-rich-quick scheme,” Newsom said. He added:
“At a time when Trump’s Washington is riddled with ethical failures and insider profiteering, California is drawing a bright line: If you serve the public as a political appointee, you serve the public — period. We’re not going to tolerate this kind of corruption in California.”

An announcement from Newsom’s office listed several instances of political insiders using non-public information to profit from prediction markets, including six suspected political insiders who profited from US strikes on Iran.
Newsom’s office also cited another case of suspected insider trading, which occurred in January, after one Polymarket trader netted $410,000 betting that the US would arrest former Venezuelan leader Nicolás Maduro hours before his capture.
Prediction markets have come under scrutiny from US lawmakers, who argue that political insiders are using the platforms to unfairly benefit from their positions and are potentially threatening national security by wagering on sensitive events like war and elections.
Related: Detroit set to enter Michigan‘s battle against Coinbase prediction markets
US lawmakers accelerate prediction market crackdown after insider allegations surface
Texas Congressman Greg Casar and Connecticut Senator Chris Murphy introduced the “Banning Event Trading on Sensitive Operations and Federal Functions (BETS OFF) Act” in March 2026 in response to the prediction market insider trading allegations.
The bill seeks to prohibit government insiders from using prediction platforms to profit from markets tied to war or death.

US Representative Adrian Smith and Representative Nikki Budzinski also introduced similar legislation in March, titled the “Preventing Real-time Exploitation and Deceptive Insider Congressional Trading (PREDICT) Act.”
The legislative proposal prohibits the US President, lawmakers and other high-ranking government officials from betting on prediction markets.
Magazine: Train AI agents to make better predictions… for token rewards
Bittensor’s TAO is consolidating near $328 after a triple‑digit AI‑sector rally, with rich valuations, hot RSIs and a new golden‑cross fractal all flagging room for a 40% corrective dump toward $200 if profit‑taking accelerates.
Summary
- Bittensor’s TAO is trading near $327.81 after a 4.47% daily rebound, but remains down over 17% on the week following a sharp correction from recent highs.
- TAO’s volumes and RSIs show the token coming off an overheated, triple‑digit monthly rally, with 24‑hour turnover equal to nearly one‑fifth of its circulating supply and multi‑timeframe momentum still elevated.
- Rising whale participation and a broader AI‑token surge have driven Bittensor’s upside, but fresh fractal and golden‑cross analysis now flag the risk of a 40% drawdown if profit‑taking accelerates.
Bittensor’s (TAO) native token TAO, a leading AI and big‑data asset, is changing hands around $327.81 today, up 4.47% over the last 24 hours but still lower by 17.67% on the week as the market digests a violent, sector‑wide swing in artificial intelligence narratives. With a market capitalization of about $3.53 billion and 24‑hour trading volume of $622.80 million, TAO currently ranks among the largest AI‑linked crypto assets, reflecting both strong speculative interest and deep two‑sided liquidity.
TAO slips 17% after parabolic AI rally, fractals flag 40% downside risk
The token underpins Bittensor, a decentralized AI network that rewards machine‑learning models for contributing useful inference, effectively positioning TAO as both a governance and incentive asset at the center of an on‑chain AI compute marketplace.
Over the past month, TAO’s price has climbed more than 100%, with 7‑day, 14‑day and 30‑day gains of 21.68%, 58.38% and 105.14% respectively, before this week’s pullback. On the flow side, roughly 1.79 million TAO — equal to 18.68% of circulating supply — has traded in the last 24 hours, underscoring unusually intense activity relative to its size. Momentum remains elevated rather than exhausted: intraday RSI sits near 62, while the 7‑day RSI is around 58, signaling continued bullish bias without a full reset into oversold territory. This follows earlier spikes in whale participation and open interest that helped propel TAO’s breakout above $200 in early March, when large holders aggressively accumulated during the initial phase of the rally.
Bittensor’s TAO pauses near $328 as golden‑cross fractal warns of deeper pullback
However, the same parabolic structure that lifted Bittensor is now flashing caution. CoinMarketCap’s latest AI‑token update notes that TAO surged roughly 160% into a golden cross on March 26, and historical fractal analysis of prior crosses indicates average corrections of about 40% within five to six weeks, implying potential downside toward the $200 region if the pattern repeats. That warning comes against the backdrop of a broader AI‑crypto basket that recently advanced more than 10% in a single day, as the sector’s combined capitalization expanded sharply on March 25. In other words, while Bittensor remains a bellwether for on‑chain AI and continues to trade with strong liquidity and active whale interest, its current technical setup suggests the market is transitioning from euphoria to a more fragile phase where profit‑taking, not fresh capital, may dominate the next move.
Crypto World
BlockDAG News 2026: Stripe Acquires Bridge for $1B While Pepeto Targets Life Changing Returns as BTC and LINK Slide

The average American car payment is $740 a month stretching six years on vehicles losing value every day. Stripe just acquired stablecoin startup Bridge for over $1 billion, proving owning crypto infrastructure is where the money flows.
The blockdag news shows slow price targets, but a $5,000 Pepeto entry is targeting the kind of returns that pay off the car, the loan, and the interest from one position. More than $8 million raised with an exchange already serving traders, and analysts project 100x as the Binance listing approaches.
Stripe acquired stablecoin startup Bridge for over $1 billion, then purchased wallet provider Privy and billing platform Metronome to assemble a full stack payment ecosystem according to FinTech Weekly.
As one analyst noted, owning the rails means you stop paying rent on someone else’s blockchain.
According to CoinDesk, the stablecoin infrastructure race is accelerating as the CLARITY Act framework takes shape, and the BDAG outlook falls far short of the capital pouring into verified exchange entries right now.
The Best Entries and Where the BlockDAG News Conversation Falls Short
Pepeto: The Verified Exchange Where $5K Today Targets the Returns That Clear Car Payments Permanently
Every new token that launches creates a new risk for investors, and as the market expands the volume of dangerous contracts keeps increasing. Pepeto is the verified exchange where a $5,000 entry today targets the returns that clear $740 monthly car payments permanently, and the BDAG forecast shows a project still struggling with supply unlocks while this exchange is already running and attracting whale capital.
The exchange’s contract scanner becomes more valuable as the ecosystem grows, checking every project automatically before the reader’s money goes near it and explaining what it found in plain language.
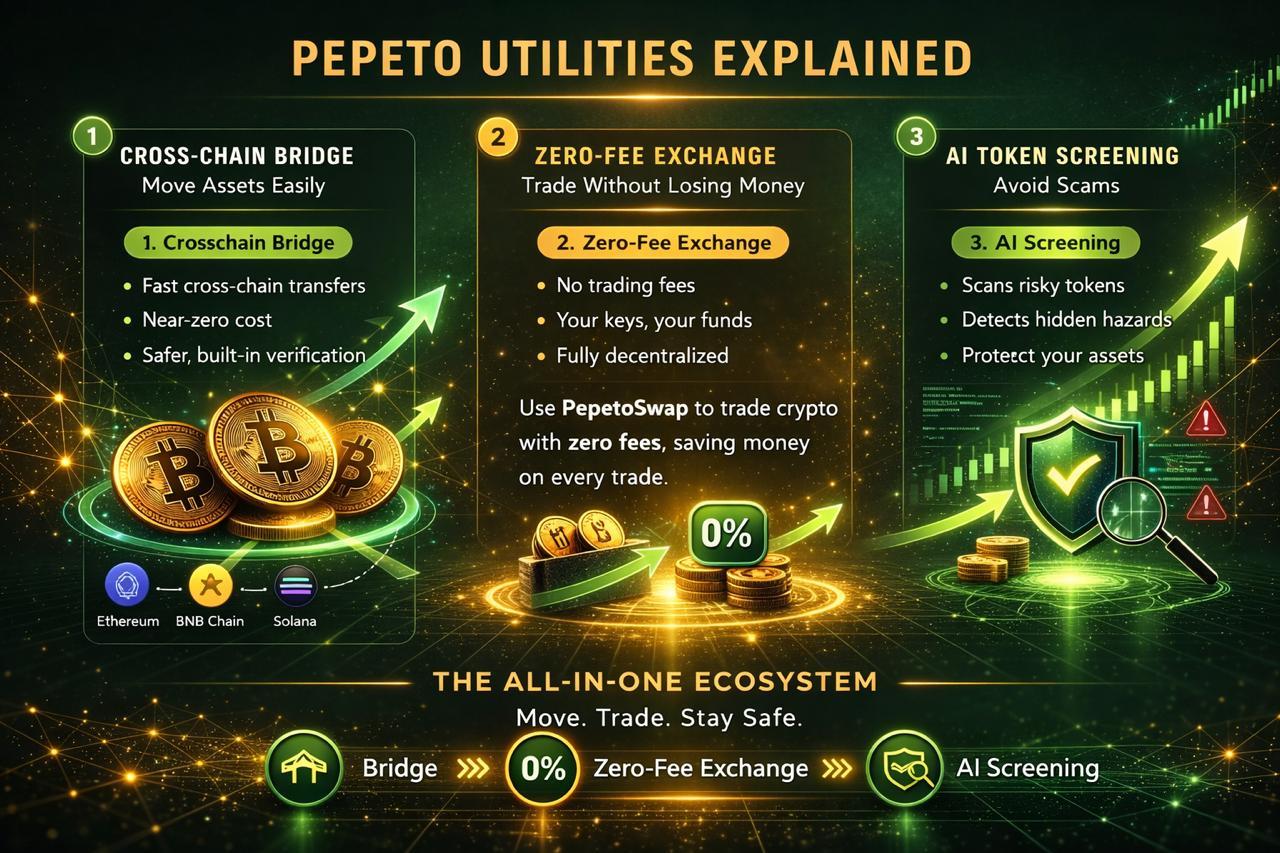
PepetoSwap handles every trade without taking any commission so portfolios stay intact, the blockchain connector moves tokens across networks at zero transfer cost, and a SolidProof audit confirmed every contract. The mind behind the original Pepe coin, which climbed to $11 billion on meme power with zero products backing it, engineered this exchange alongside a Binance infrastructure veteran.
In the months ahead, the BDAG headlines will fade and the crypto news will eventually cover the success stories made by Pepeto, the exchange seeing demand, and the returns earned, but by then the entry is gone. Analysts project 100x from the current entry at $0.000000186, and 192% APY staking expands every wallet’s position as the Binance listing nears. Rounds close faster every week, the presale is still accepting entries, and a 2026 portfolio with Pepeto is most likely the strongest decision any investor carrying $740 monthly car payments can make right now.
Bitcoin (BTC)
BTC trades at $65,794 per CoinMarketCap, down 5.6% on the week after the $14 billion options expiry triggered mass selling.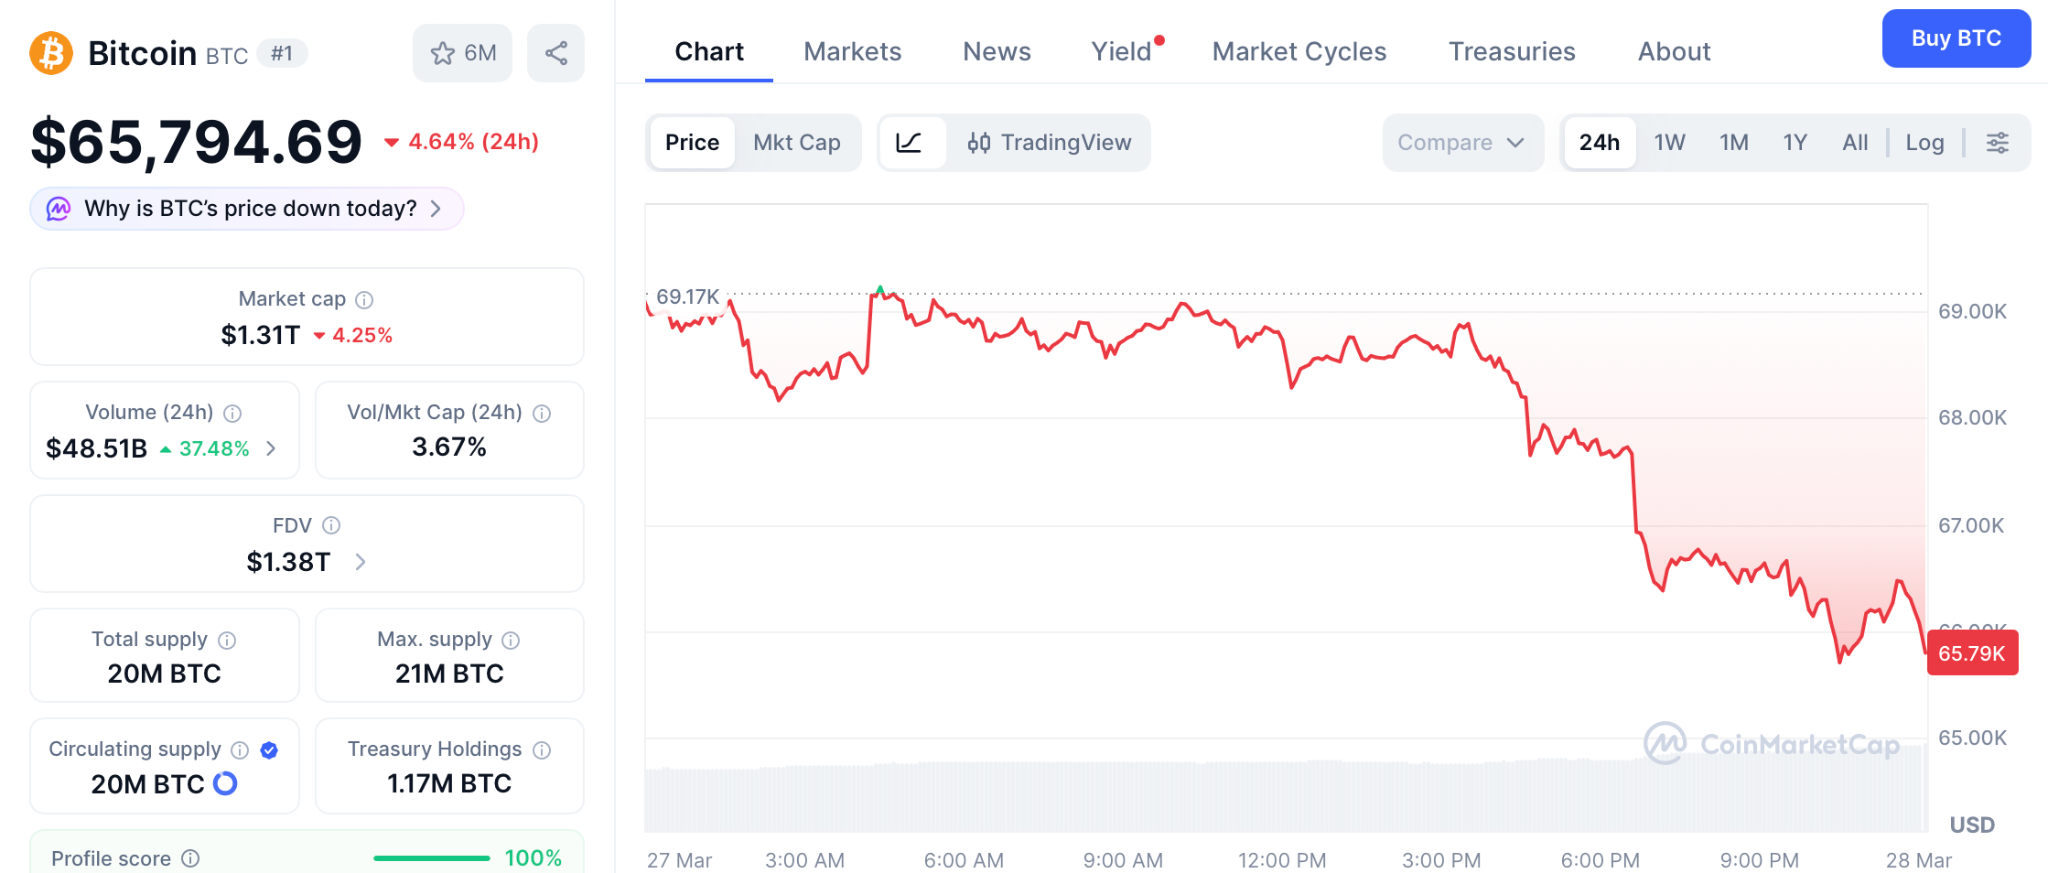 MARA sold 15,133 BTC just to manage debt, and a recovery to $75,000 delivers 11% over months, a slow rebuilding play, while the presale entry targets 100x from one listing event the miners selling BTC are watching others position for.
Chainlink (LINK)
LINK sits at $8.66 per CoinMarketCap, grinding 83% below its $52.70 all time high after six consecutive red monthly candles.
A break above $9.74 targets $11 for a 27% move, and while the BDAG conversation keeps the project visible, presale entries are where the life changing returns live and Pepeto offers exactly that math.
The BlockDAG News Will Fade but the Wallets Inside Pepeto Are Building the Returns the Market Will Cover
Stripe just spent over $1 billion to own stablecoin rails, and American families spend $740 a month on car payments stretching six years.
The BDAG news cycle keeps attention on a project with slow price targets, but in the months ahead the crypto news will cover the success stories made by Pepeto, the exchange seeing demand, and the returns that changed portfolios, and by then the entry is gone.
The Pepeto official website is still accepting entries, and a 2026 portfolio with Pepeto before the Binance listing is the decision that separates the families still making car payments from the ones who cleared every balance from one position.
Click To Visit Pepeto Website To Enter The Presale

FAQs
What does the blockdag news mean for investors searching for better entries?
The blockdag news shows slow price targets while Pepeto’s verified exchange targets 100x from one Binance listing event, and the presale entry clears car payments from one position.
What is the latest blockdag news investors should watch?
The blockdag news cycle keeps the project visible, but the Pepeto official website is where the 100x entry with a verified exchange and Binance listing is still open.
Does the blockdag news matter for 2026 portfolios?
The blockdag news provides context for existing holders, but Pepeto’s presale with the Pepe builder and Binance listing targets the returns that change the reader’s financial life.
Disclaimer: This is a Press Release provided by a third party who is responsible for the content. Please conduct your own research before taking any action based on the content.

Coinbase and Better Home & Finance have operationalized the first conforming crypto-backed mortgage in U.S. history, allowing borrowers to pledge Bitcoin or USDC as collateral for a Fannie Mae-backed home loan without liquidating their positions.
The product plugs directly into the $12 trillion U.S. residential mortgage market, not as a niche private offering, but as a GSE-conforming instrument backed by the same federal infrastructure that underwrites more than half of American home purchases.
The surface headline is historic. The mechanism underneath it is where the real trade-off lives. BTC is discounted to 40% of market value for collateral purposes; USDC is discounted to 80%. A borrower pledging $100,000 in Bitcoin receives $40,000 in usable down payment credit, a haircut that makes the math work for the GSEs but demands significant overcollateralization from the borrower.
The question this article answers: what does it actually take to use crypto to buy a house under this framework, and what does the product’s existence signal about where institutional mortgage infrastructure is heading?
- Policy Trigger: FHFA Director Bill Pulte directed Fannie Mae and Freddie Mac on June 25, 2025, to develop crypto-as-asset underwriting guidelines, providing the regulatory foundation for this product.
- Haircut Mechanism: BTC is valued at 40% of market price; USDC at 80%. A $100,000 BTC position yields $40,000 in qualifying collateral.
- First Mover: Coinbase and Better Home & Finance are executing the first conforming loan under this structure; lender Newrez has since launched its own parallel crypto-backed program.
- Scope Limitation: Only assets held on U.S.-regulated exchanges with AML compliance and a 60-day holding history qualify — cold wallets, DeFi positions, and staked assets are excluded.
Discover: The best crypto presales gaining institutional momentum right now
How the Loan Structure Actually Works
The product is structured as two instruments layered together: a primary conforming Fannie Mae-backed mortgage and a second mortgage covering the down payment, secured by pledged crypto collateral. Coinbase holds the pledged assets in custody; borrowers do not transfer ownership, but the collateral is encumbered for the loan’s duration.
Get your house and keep your crypto. — Coinbase
Crypto-backed mortgages are here – increasing access to homeownership for millions of Americans.
Buy a home without converting your portfolio by using BTC or USDC as collateral for your down payment.
Offered by Better, powered by Coinbase. pic.twitter.com/9hfL3fVty5
 (@coinbase) March 26, 2026
The haircut is the defining constraint. To generate $80,000 in qualifying down payment credit using Bitcoin at the 40% valuation rate, a borrower must pledge $200,000 in BTC.
USDC’s 80% rate is more capital-efficient; $100,000 in USDC yields $80,000 in usable collateral, but still demands a meaningful overcollateralization buffer.
Fannie Mae’s volatility haircut framework is designed precisely to absorb the asset class’s price swings without triggering forced liquidations on the borrower side.
There are no margin calls. Collateral is not at risk from short-term price drops. The crypto position becomes actionable for the lender only after 60 or more days of delinquency, aligning with standard foreclosure timelines and deliberately decoupling the mortgage’s credit risk from crypto’s daily volatility.
Eligible assets must be held on a U.S.-regulated exchange with full AML compliance and a minimum 60-day documented holding history. Cold wallets are excluded. DeFi positions do not qualify. Staked assets are out. The framework is narrow by design; it trades flexibility for GSE compatibility, which is the only pathway to conforming status.
The policy architecture behind this traces directly to FHFA Director Pulte’s June 25, 2025, directive ordering Fannie Mae and Freddie Mac to develop formal underwriting guidelines for digital assets. Phase 1 framework proposals covering volatility treatment and documentation standards are currently under FHFA review, with a 6-to-12-month timeline before the rollout of Phase 2 criteria.
Discover: The best crypto presales gaining institutional momentum right now
The post Coinbase Powers First Crypto-Backed Conforming Mortgages appeared first on Cryptonews.
Avalanche’s AVAX is grinding sideways around $9, testing key support as a bullish “digital commodity” ruling, Animoca partnership and cheaper subnets collide with thin liquidity and stubborn overhead supply.
Summary
- Avalanche’s AVAX is trading close to $9.07 today, roughly flat on the day but struggling to hold above the $9.00–$9.50 support zone after a multi‑month drawdown.
- The token, a layer‑1 smart contract platform, carries a market cap in the low‑single‑digit billions and remains under pressure despite recent regulatory clarity and high‑profile partnerships aimed at driving institutional and real‑world asset adoption.
- Technical indicators show mixed momentum, with AVAX hovering near oversold territory on higher time frames while intraday moves remain range‑bound, framing the current price action as a possible basing attempt rather than a confirmed reversal.
Avalanche’s (AVAX) native token AVAX, the core asset of the Avalanche layer‑1 smart contract network, is trading around $9.07 today, marking a sideways session that leaves the token pinned just above critical support in the $9.00–$9.50 band.
After starting 2026 near $12.31 and sliding to an average closing level near $10.14, AVAX has posted a double‑digit percentage decline year‑to‑date, underperforming several rival smart contract platforms as broader altcoin liquidity thins out. The asset underlies a high‑throughput, subnet‑based ecosystem designed to host DeFi, gaming and real‑world asset (RWA) applications, positioning AVAX squarely in the L1 and RWA‑adjacent category in the current market structure.
AVAX tests $9–$9.50 floor as institutional RWA story outruns spot demand
In terms of immediate trading dynamics, recent analysis pegs AVAX consolidating between roughly $8.66 and $10.20, with short‑term forecasts calling for only a modest 2.95% upside toward $9.53 over the coming days if support holds. Technical dashboards show RSI cycling in the neutral‑to‑slightly‑oversold range depending on timeframe, and prior attempts to sustain a breakout above the $10 psychological level have faded quickly, underscoring the presence of persistent overhead supply. That pattern is consistent with a market where retail participation has retreated sharply following a 94% decline from all‑time highs, leaving price heavily dependent on selective institutional flows rather than broad speculative enthusiasm.
Fundamentally, Avalanche has logged several milestones that should, in theory, support AVAX over the medium term. On March 17, 2026, U.S. regulators formally classified AVAX as a “digital commodity,” aligning it with Bitcoin and Ethereum from a legal standpoint and potentially smoothing the way for regulated products and deeper institutional involvement. Days later, Web3 heavyweight Animoca Brands disclosed an investment and strategic partnership with Ava Labs aimed at growing Avalanche’s footprint in Asia and the Middle East, including targeted deployments in RWA, digital identity and entertainment. On the technology side, the November 2025 Granite mainnet upgrade and prior Octane hard fork dramatically cut fees, improved cross‑chain messaging and introduced biometric‑friendly cryptography, making it cheaper and simpler to launch subnets and onboard mainstream users.
Yet price remains stuck in a tight range because this fundamental progress has not fully translated into sustained spot demand for AVAX. Analysts note that real‑world asset TVL on Avalanche has pushed above $1.3 billion, with institutional pilots from major financial firms, but these flows are gradual rather than explosive, and many treasuries hedge or amortize their AVAX exposure. As a result, the current tape looks like a classic disconnect: structurally bullish long‑term narrative, but near‑term price dictated by whether $9.00 can hold in the face of lingering risk‑off sentiment across non‑Bitcoin, non‑Ethereum large‑caps.

LayerZero has become the first interoperability protocol live on the Canton Crypto Network, the institutional blockchain backed by Goldman Sachs, Microsoft, and DTCC, enabling regulated financial institutions to route tokenized assets across more than 165 public blockchains while preserving compliance standards.
This is kind of Wall Street’s tokenization infrastructure opening a direct channel to the entirety of onchain liquidity.
- Integration Scope: LayerZero is now live on Canton Network, connecting its $100 billion ecosystem to Canton’s institutional rails and enabling cross-chain access to 165+ public blockchains.
- Institutional Signal: Canton already processes more than $350 billion in daily U.S. Treasury repo volume; testing participants include Goldman Sachs, BNP Paribas, Tradeweb, and Citadel Securities.
- Market Implication: Nearly 400 ecosystem participants on Canton now have a credible path to cross-chain tokenized asset deployment — a structural liquidity unlock for institutional RWA markets.
Discover: The best crypto presales gaining institutional momentum right now
Routing $350 Billion in Daily Repo Volume Across 165 Chains
Canton crypto core infrastructure, built by Digital Asset on the DAML smart contract language, already handles serious institutional volume. Broadridge’s distributed ledger repo platform processes between $300 billion and $400 billion in daily U.S. Treasury repo transactions through Canton — establishing it as operating infrastructure, not a proof-of-concept.
— Fundraising Digest (@CryptoRank_VCs) March 26, 2026
 Goldman Sachs‑backed Canton Chain taps LayerZero
"@CantonNetwork has already built the rails for traditional finance, processing more than $350 billion in daily U.S. Treasury repo volume"
– Bryan Pellegrino, CEO @LayerZero_Core
This move is a step toward… pic.twitter.com/6IJqAaukMs
The LayerZero integration now sits on top of those rails. LayerZero Labs CEO Bryan Pellegrino framed the division of labor precisely: “Canton has already built the rails for traditional finance, processing more than $350 billion in daily U.S. Treasury repo volume. LayerZero’s job is to make sure those assets are available in every global market, across blockchains.”
The distinction matters technically. LayerZero does not operate as a traditional bridge, it is designed to make any token or application natively compatible with any blockchain, avoiding the custodial risk that has plagued earlier cross-chain solutions. For Canton’s compliance-focused participants, that architecture matters as much as the connectivity itself.
Testing has already involved Goldman Sachs, BNP Paribas, DRW, QCP, Liberty City Ventures, and Tradeweb, the same institutions that underwrote Digital Asset’s $135 million funding round in June 2025, led by DRW Venture Capital and Tradeweb Markets with participation from Circle Ventures and Citadel Securities.
Discover: The best presale crypto projects launching on cross-chain infrastructure right now
The post Goldman Sachs-Backed Canton Crypto Chain Adds LayerZero Interoperability appeared first on Cryptonews.
The US Treasury Department announced Thursday, March 26, that Donald Trump will become the first sitting president to have his signature appear on the US dollar, a move officials say is intended to commemorate America’s 250th anniversary.
The decision raised immediate questions about the notes’ future once the current administration leaves office. While US law guarantees all issued currency remains legal tender indefinitely, a future administration could quietly stop printing them.
Trump is Breaking a 165 Year Economic Tradition
Treasury Secretary Scott Bessent’s signature will appear alongside Trump’s, beginning with $100 bills in June, with other denominations to follow. In a press release, Bessent framed the decision as recognition of the administration’s economic record.
“There is no more powerful way to recognize the historic achievements of our great country and President Donald J. Trump than US dollar bills bearing his name, and it is only appropriate that this historic currency be issued at the Semiquincentennial,” he said.
Treasurer Brandon Beach echoed the sentiment, describing Trump as “the architect of America’s Golden Age economic revival.”
“Printing his signature on the American currency is not only appropriate, but also well deserved,” Beach said.
The announcement marked a significant departure from longstanding practice.
Since 1861, US banknotes have carried only the signatures of the Treasury Secretary and the Treasurer. The current bills in circulation bear the signatures of former Secretary Janet Yellen and former Treasurer Lynn Malerba.
The reaction was swift. California Governor Gavin Newsom was among the first to respond, posting to X:
“Now Americans will know exactly who to blame as they’re paying more for groceries, gas, rent, and health care.”
The decision represented the latest in a series of moves by the Trump administration to attach the president’s name to American institutions.
A Broader Naming Campaign
Last December, the administration renamed the United States Institute of Peace after Trump, placing his name on the organization’s headquarters following a prolonged dispute over control of the institute.
Roughly two weeks later, the Kennedy Center added Trump’s name to the performing arts complex. Congress had originally designated the venue as a living memorial to former President John F. Kennedy.
By December 22, the pattern extended to war equipment.
Trump announced plans for the Navy to develop a new class of large surface battleships, which the administration said would meet the demands of modern maritime conflict. Sky News reported at the time that a senior administration official had confirmed the fleet would be known as “Trump Class” battleships.
Unlike renaming a building or rebranding a battleship, removing a president’s signature from the US dollar is not simply a matter of political will. Any future administration seeking to undo it will face considerable logistical and legislative hurdles.
What the Next US President Can and Cannot Do
Under the Legal Tender Act, all currency issued by the United States government remains valid and redeemable at face value indefinitely.
No president, treasury secretary, or act of the executive branch can unilaterally invalidate notes already in circulation. While Congress holds constitutional authority over legal tender, no administration would willingly risk the economic disruption the process entails.
The practical path available to a future administration is narrower. It would involve instructing the Bureau of Engraving and Printing to stop producing notes bearing Trump’s signature. New currency would then be issued, quietly reverting to the previous norm.
No legislation would need to be passed. The existing notes would simply fade from circulation on their own as newly printed dollars replace them.
That process, however, will take time. Depending on how many notes are printed before any future administration changes course, Trump-signed currency could remain in widespread use for the foreseeable future.
The post Donald Trump is Leaving His Forced Legacy On the US Dollar Bill appeared first on BeInCrypto.
Zcash’s ZEC is consolidating near $235–$240 after a sharp February selloff, with a $25m ZODL raise, Foundry’s new mining pool and rising shielded use turning it into a 2026 privacy‑trade leader.
Summary
- Zcash’s ZEC is trading near $235–$240 after a mid‑March surge of over 20% in a single day, extending a multi‑week recovery from February’s steep drawdown.
- The privacy‑focused coin has seen daily volumes in the hundreds of millions of dollars during the latest upswing, as traders respond to fresh venture funding, new mining infrastructure and improving technical momentum.
- Sector‑wide interest in privacy assets has picked up in 2026, with ZEC outpacing many peers as on‑chain shielded usage rises and developers accelerate work on new wallets and consensus upgrades.
Zcash’s (ZEC) native token ZEC, one of the longest‑running privacy coins in the market, is holding near the $235–$240 range this week after a volatile first quarter that saw it sell off sharply in February before rebounding on strong March news flow.
Data from BestCryptoChecker shows ZEC’s price dropped about 20.93% in February 2026, falling from $302.80 to close the month at $239.41, underscoring how aggressively the asset had been de‑risked before the latest move higher. The token, which uses zero‑knowledge proofs to enable shielded transactions and is categorized as a privacy and payments coin, has now re‑emerged as a focal point in the renewed 2026 privacy narrative.
ZEC extends rebound as $25m ZODL raise and Foundry mining pool revive Zcash story
Momentum turned decisively in March. On March 16, ZEC posted a 23.26% daily gain to trade around $285.35, with market capitalization at roughly $4.74 billion and 24‑hour trading volume reaching $583 million, according to MEXC’s tracking. CoinMarketCap’s Zcash dashboard later highlighted that ZEC broke above $235 on March 25 on “strong volumes” following a major ecosystem funding announcement, extending a weekly gain above 10% on elevated spot turnover. While some shorter‑term RSI screens still flag periods of selling pressure on lower timeframes, 14‑day readings near the low‑to‑mid‑50s indicate neither extreme euphoria nor deep exhaustion, leaving room for trend continuation if demand persists.
Behind the tape, a series of structural developments has reframed the Zcash story for 2026. The Zcash Open Development Lab (ZODL), a new core development entity formed after the breakup of the Electric Coin Company’s engineering team, closed a funding round of more than $25 million on March 25 from backers including Paradigm, a16z crypto and Coinbase Ventures, with capital earmarked for expanding the Zodl wallet and other privacy‑first tools. CoinMarketCap also reports that Foundry Digital, the largest Bitcoin mining pool, plans to launch an institutional‑grade ZEC mining pool in April 2026, marking its first move beyond Bitcoin and signaling growing confidence in Zcash’s long‑term viability. Additional roadmap items, including the CashZ wallet launch, consensus protocol upgrades and continued ZODL‑led ecosystem expansion, underline an effort to modernize infrastructure and make shielded transactions more accessible, potentially deepening ZEC’s role as a base layer for private finance.
Beyond Zcash itself, privacy coins as a group have begun to stage a comeback in 2026, with MEXC noting that ZEC and peers have delivered double‑digit daily moves as regulatory clarity around “digital commodities” and renewed interest in zero‑knowledge technology shift attention back to privacy‑preserving chains. That broader context matters: while some traders still see scope for a deeper correction toward the $100–$150 range based on ZEC’s longer‑term breakdown from much higher levels, recent funding, infrastructure and usage data have opened the door to a sustained repricing if the privacy trade continues to attract both retail and institutional capital.
2 Reasons Why $35 Is a Critical Juncture for Hyperliquid (HYPE) Price

Kenny Smith nixes UNC job talk, calls for long-term commitment from next coach
Turns Out That Advertisers Not Wanting To Fund Neo-Nazi-Adjacent Content Isn’t An Antitrust Violation

Smart energy pays enters the US market, targeting scalable financial infrastructure

Why Israel is blocking foreign journalists from entering

Bitcoin: We’re Entering The Most Dangerous Phase

Mine Bitcoin 5X Cheaper Without Rigs? How to Stake HNO Coin #bitcoinmining #Crypto #Altcoin #shorts

Business Studies Class 12: Financial Markets One Shot NCERT Revision | CBSE 2026

COCKROACHES in the Financial System! (Private Credit)
-
 NewsBeat3 days ago
Manchester United reach agreement with Casemiro over contract clause amid transfer speculation
-

 Crypto World6 days ago
Best Crypto to Buy Now: Strategy Just Spent $1.57 Billion on Bitcoin During Fear While Early Investors Quietly Enter Pepeto for 150x Potential
-

 Crypto World6 days ago
Bitcoin Price News: Bhutan Sells $72 Million in BTC Under Fiscal Pressure, but the Smart Money Entering Pepeto Sees What the Market Does Not
-

 News Videos2 days ago
Parliament publishes latest register of MPs’ financial interests
-

 Sports5 days ago
Remo Stars and Kano Pillars Strengthen Survival Hopes in NPFL
-

 Sports4 days ago
Gary Kirsten Accuses Pakistan Cricket Board Of ‘Interference’, Mohsin Naqvi Responds
-

 Business5 days ago
No Winner in March 21 Drawing as Prize Rolls to $133 Million for Next
-

 Tech5 days ago
Give Your Phone a Huge (and Free) Upgrade by Switching to Another Keyboard
-

 Tech5 days ago
AI enters the chat: New Seattle dating app relies on tech to facilitate meaningful human connections
-

 News Videos4 days ago
Ch 9 Financial Management Part 1 | Detailed One Shot | Class 12 Business Studies Boards 2026
-

 Tech6 days ago
Today’s NYT Connections Hints, Answers for March 22 #1015
-

 Business1 day ago
Instagram, YouTube Found Responsible for Teen’s Mental Health Struggle in Historic Ruling
-

 Business6 days ago
Will Duke Basketball Win It All? Duke Basketball Enters Second Round as Third Favorite to Claim NCAA Title
-

 Sports5 days ago
2026 Kentucky Derby horses, odds, futures, preview, date: Expert who hit 12 Derby-Oaks Doubles enters picks
-
 NewsBeat5 days ago
Update on Wisbech river crash as search for teenage boy enters fifth day
-
 Entertainment4 days ago
Cynthia Bailey Dishes on ‘RHOA’ Season 17, Discusses Kandi
-

 Tech4 days ago
Samsung will soon let you control smart home devices from your car’s dashboard
-
 NewsBeat2 days ago
Tesco is selling new Cadbury Dairy Milk bar and people can’t wait to try it
-

 NewsBeat7 days ago
The 3 airlines that have entered insolvency in 2026 so far
-

 Tech6 days ago
SteamOS update adds support for Steam Machine and other non-Valve hardware
You must be logged in to post a comment Login