

Crypto World
Citi predicts the tokenized securities market will grow to $5.5 trillion by 2030

Putting real-world investments onchain, a process called tokenization, is moving out of the testing phase and into everyday business.
Citi’s new report Tokenization 2030: Wall Street On-Chain shared with CoinDesk ahead of Proof of Talk in Paris, shows that the global market for thse digital investments sits at just $17 billion today.
However, Citi expects this market to increase to $5.5 trillion by 2030 in its base forecast. Depending on how fast adoption take place, that could land anywhere from a low end estimate of $2.7 trillion to a bullish forecast of $8.2 trillion, Citi said.
As the report points out, this is a major turning point: “You’re seeing the full weight of American financial power and the global reserve currency moving on change at scale,” Citi says in the report. “When DTCC and the NYSE embed tokenization into capital markets, this marks a tipping point.”
According to Citi, three big shifts are driving this trillions of dollars move.
First, the traditional companies that run the world’s stock markets are building this technology directly into their regular trading systems.
In early May, Wall Street giant Depository Trust & Clearing Corporation (DTCC) announced it would start limited production trades of tokenized securities in July, with a broader launch of its platform set for October. Nasdaq is working on a framework for companies to issue blockchain-based shares with a potential launch as early as 2027. Intercontinental Exchange, which owns the New York Stock Exchange, also has plans for tokenized stocks.
Nasdaq also received regulatory approval to allow certain stocks to be issued and traded in this digital onchain form.
Second, the rise of trusted digital cash is providing the missing piece to make thse trades settle instantly. Standard stablecoins are expected to grow to $1.9 trillion market by 2030, working alongside digital bank deposits to allow assets and cash to swap at the exact same moment. The report expects that the growth of stablecoins alone could create about $1 trillion in new demand for U.S. government bonds, because the companies issuing stablecoins back their digital cash with these real bonds.
Third, the government rules are getting clearer, with a key piece of U.S. digital asset legislation moving forward to a full U.S. Senate vote. On May 14, the Senate Banking Committee managed to end a four-month stall with a 15-9 bipartisan approval by the committee, which advanced the Clarity Act to its next step.
The Citi report notes that the growth they forecast will happen in mainstream public markets, such as U.S. stocks and government bonds, rather than private markets, which are harder to trade and change slowly.
Citi assumes that 10% of the U.S. Treasury bill market and 3% of the U.S. public stock market will be tokenized by 2030. If just 10% of everyday U.S. investors switch to these new digital trading platforms, it would create $2.6 trillion in demand for digital stocks.
On the other side, complex areas like private credit and private equity are each expected to reach a much smaller $100 billion globally by 2030.
The shift will not happen overnight, Citi noted, saying that instead, old and new financial systems will have to run side by side for a while.
The report compares this to how highways adopted electronic toll tags like E-ZPass. Toll roads did not become fully automated in one day. Instead, states built wider roads with parallel lanes for both cash and automated drivers, which added extra cost and confusion before everyone eventually switched over to the fully automated system.
Ultimately, this new setup will give a major advantage to “Structural Orchestrators”. These are the specific big banks and investment firms that control both the real assets and the digital cash rails used to pay for them, allowing them to handle the entire trade inside their own network.

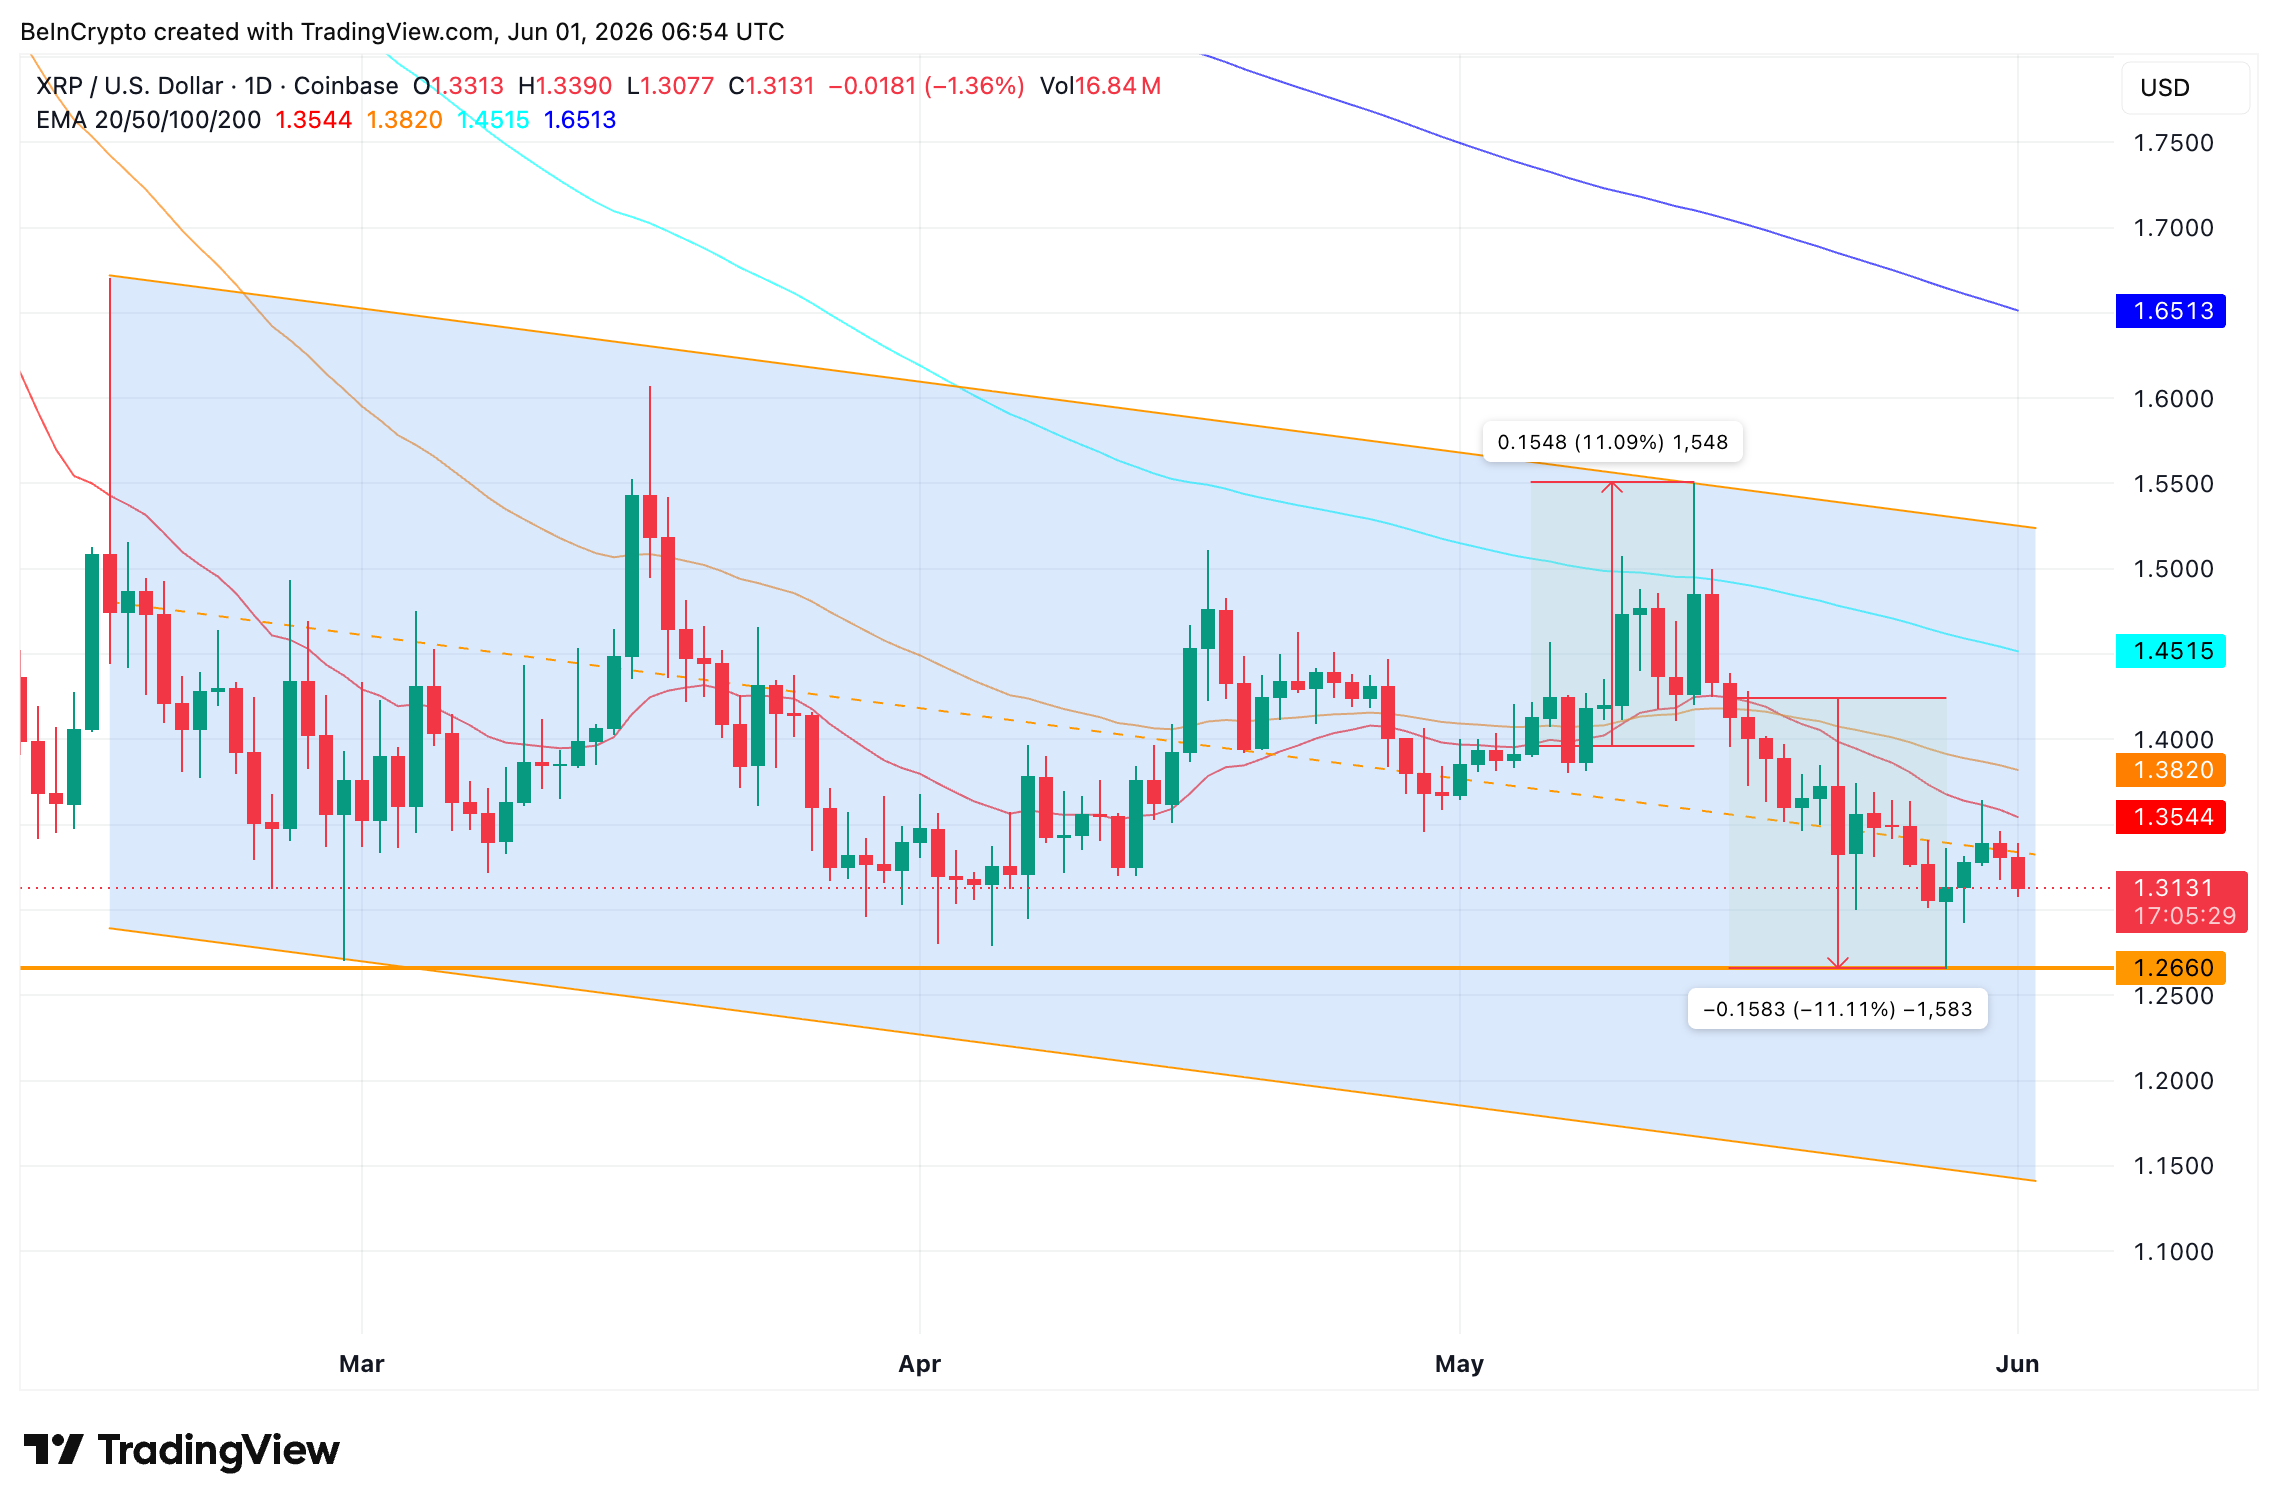
XRP (XRP) price is stuck near $1.31 inside a falling channel, unable to reclaim a single level that has capped key recovery attempts.
Beneath the surface, the two largest whale cohorts and long-term holders all cut their stash this weekend, leaving the token’s next move resting on whether buyers can take back one critical line.
Price Slides in a Falling Channel as Whales Cut Exposure
XRP has traded inside a falling channel since mid-February, a pattern where price grinds lower between two downward-sloping parallel lines while printing lower highs. Price has crept back toward the channel’s midline after a recent drop, yet reclaiming that midline alone would not turn the structure bullish.
Want more token insights like this? Sign up for Editor Harsh Notariya’s Daily Crypto Newsletter here.
Now the key levels come into focus. XRP price must reclaim the 20-day exponential moving average (EMA), a trend line that weights recent prices more heavily, sitting near $1.35. History shows why it matters. When XRP lost the 20-day EMA on May 16, it corrected roughly 11%. When it reclaimed the line in early May, price rose nearly 11%. This makes this technical line a critical pivot point.

Yet, the bigger warning sits in XRP whale behavior. The two largest cohorts both trimmed holdings starting May 31, suggesting they expect a weak June.
The 100 million to 1 billion XRP cohort cut its share from 11.54% to about 9.9%, a sharp drop. The smaller 10 million to 100 million cohort eased from 17.61% to 17.36%.

Both moving lower at once points to inherent weakness rather than a single seller. That selling raises the question of whether anyone is stepping in to absorb it.
Holders Cut Stash as Accumulation Signal Weakens
The picture does not improve among longer-term owners. The Hodler Net Position Change, a metric that tracks whether mid-to-long-term holders are net adding or shedding coins, dropped hard this weekend.
The reading fell from roughly 268.4 million XRP on May 30 to about 216.6 million XRP a day later, a steep 19% one-day decline that suggests distribution rather than accumulation.

With whales and holders both reducing exposure at the same time, the buy-side support needed for a clean recovery looks thin. XRP exchange outflows elsewhere hint at some accumulation, but that demand has not yet shown up in price. That leaves the XRP price chart to settle whether the weakness deepens or stalls.
XRP Price Levels to Watch as the 20-Day EMA Reclaim Stalls
The critical 20-day EMA level closely aligns with the 0.618 Fibonacci level at $1.348 (the $1.35 zone).
A move above $1.35, a gain of about 2.6%, opens the path toward $1.38 (50-day EMA), then $1.42 and $1.47. A push over $1.55 would flip the bias bullish. On the downside, XRP must hold $1.29 and $1.26. The immediate risk sits at $1.29, just 1.45% below current price, and losing $1.26 exposes $1.22.

For now, $1.35 separates a double-digit recovery from a slide back toward $1.22.
The post XRP’s $1.35 Reclaim Is Failing as Whales and Holders Bail Together appeared first on BeInCrypto.

Crypto ownership has grown faster than crypto spending in Australia. 33% of Australians now invest in or hold crypto. Yet the Reserve Bank of Australia’s 2025 Consumer Payments Survey found that only around 2% of respondents had used cryptocurrency to make a payment in the past year. The numbers show how far everyday payment use still trails investment adoption.
KuCoin’s KuCard launch in Australia brings crypto balances closer to daily consumer payments. The card runs on Mastercard’s global network, allowing eligible users to pay at merchants accepting Mastercard. It also supports Google Pay, placing crypto-backed payments inside payment flows Australian consumers already use.
At launch, KuCard supported real-time USDC payments and 37 USDC trading pairs. Supported digital assets are converted into fiat at checkout and settled through Mastercard’s payment network. Users can pay from supported crypto balances without converting assets manually before purchase.

Australia Offers a Strong Market for Crypto Cards
Australia already has a mature digital payments culture. Card payments, contactless transactions, and mobile wallets are part of everyday consumer behavior. This creates an opening for crypto-backed cards, since users already understand the payment experience.
Crypto ownership in Australia is also relatively high. Yet ownership alone does not create everyday usage. Many users still treat digital assets as investment holdings rather than spendable balances.
KuCard connects these two behaviors. It allows eligible users to keep supported assets in their digital account while using a familiar card or mobile wallet at checkout.
Local Expansion Came Before the Card Rollout
KuCard’s Australian launch follows a wider local strategy from KuCoin.
- In November 2025, KuCoin announced a larger investment in Australia, appointed James Pinch as Managing Director for Australia, and opened a Sydney CBD office. The local office supports compliance, operations, cybersecurity, and product development.
- Later in November 2025, KuCoin secured AUSTRAC Digital Currency Exchange registration. This placed its relevant digital currency exchange services in Australia under AUSTRAC’s regulatory framework and supported stronger local fiat access.
These steps helped prepare the ground for local product launches. KuCoin’s Australian presence now covers local teams, regulated exchange activity, fiat access, and payment use cases.
How KuCard Works
KuCard gives eligible Australian users a crypto-backed card payment experience. The card connects supported digital assets with Mastercard merchant acceptance.
When a user pays, supported assets are converted into fiat at checkout. Settlement then runs through Mastercard’s global payment network. This reduces payment friction because users can spend supported balances without a separate pre-conversion step.
The consumer experience stays familiar. Users can pay with Google Pay. Merchants receive payment through existing card acceptance channels.
This design is key because mainstream users usually prefer payment tools fitting existing habits. KuCard places crypto spending inside card and tap-and-pay behavior instead of asking users to adopt a new checkout method.
Familiar Access Points Still Drive Crypto Usage
KuCoin’s Australia Market Report showed how important familiar financial access remains. Bank transfers were the most common funding method among surveyed Australian users, at 52.4%. Credit and debit cards followed at 40.1%.
This suggests active crypto users still value stable and familiar ways to fund accounts. Crypto adoption grows faster when access feels simple, trusted, and close to existing payment behavior.
KuCard extends this pattern into spending. It connects digital assets with the card and mobile wallet systems already used across the Australian market.
A Note on Stablecoins
USDC support gives KuCard a more stable payment base than many volatile crypto assets. For everyday purchases, price predictability plays an important role. Consumers want smooth checkout experiences. Merchants need settlement through accepted payment channels.
Crypto-backed cards can combine both sides. Stablecoin balances support payment use, while Mastercard acceptance gives users access to a wide merchant network.
For exchanges, this also expands the relationship with users. Trading platforms gain more value when users can fund, hold, manage, and spend assets within one ecosystem.
Final Thoughts
KuCard’s launch in Australia marks another step in the exchange’s local market buildout. The company invested in local leadership, regulatory registration, and fiat access before introducing a product aimed at everyday payments.
Australia’s card-heavy payment culture and strong mobile wallet adoption make it a suitable market for this type of rollout. KuCard brings supported digital assets into familiar payment flows, giving eligible users a simpler path from holding crypto to spending it.
The post KuCoin’s KuCard Launch in Australia Brings Crypto Closer to Everyday Payments appeared first on BeInCrypto.
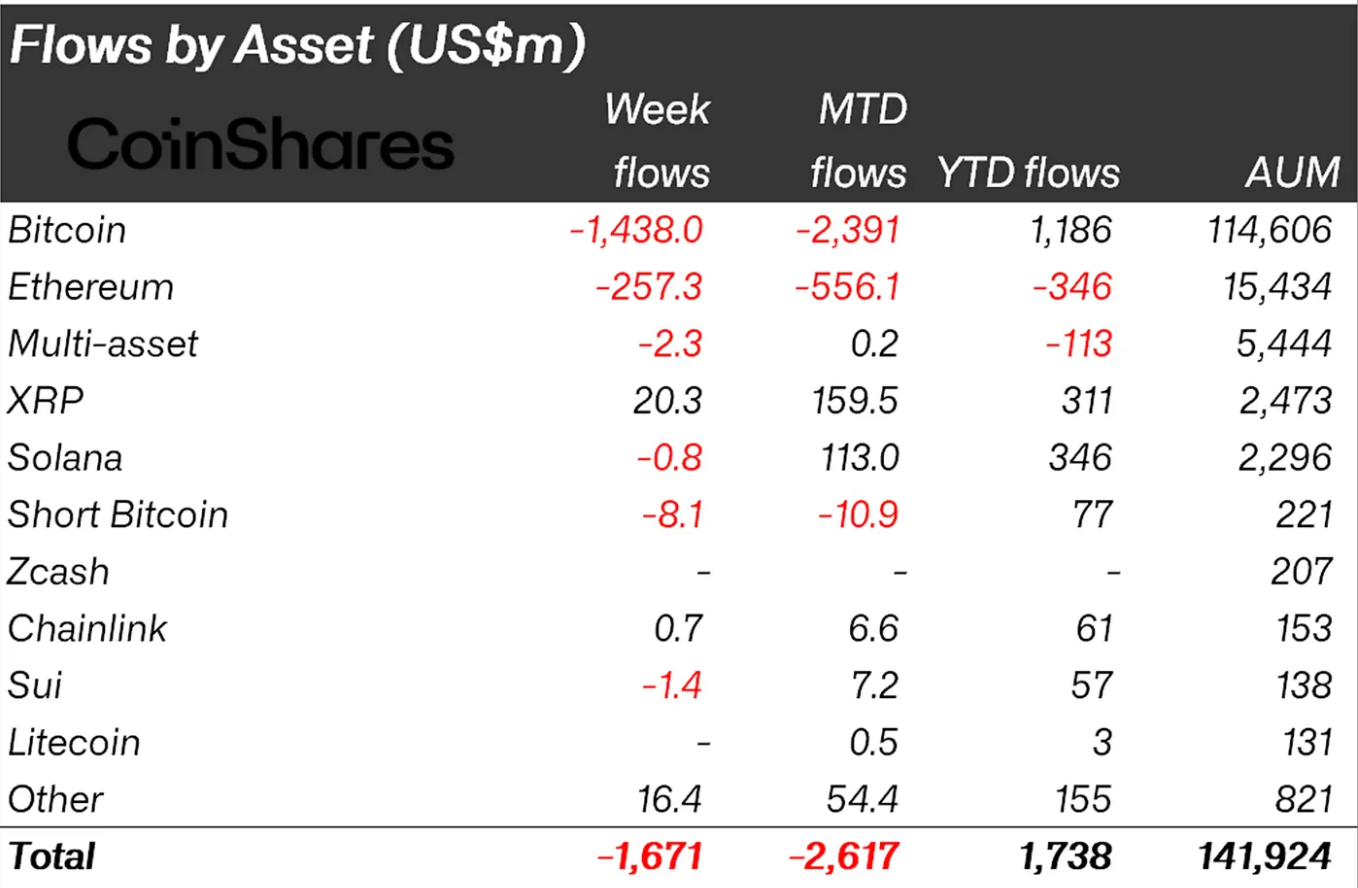
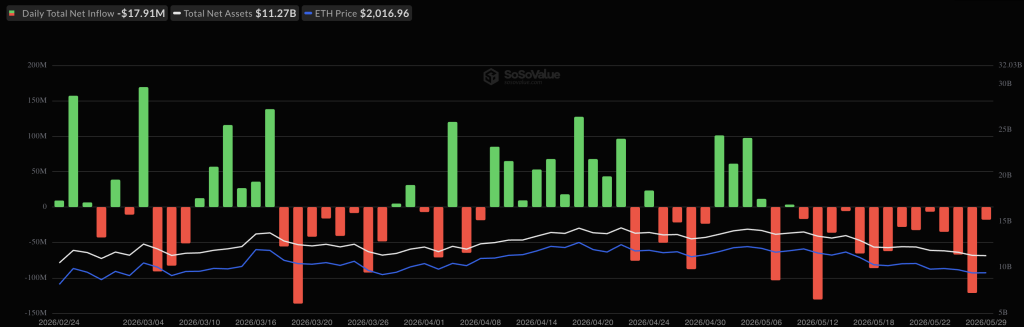
XRP emerged as one of just five digital assets to attract fresh capital last week, drawing $20.3 million in inflows. Meanwhile, global crypto investment products bled $1.67 billion in their third straight week of redemptions.
The figures show altcoin participation collapsing to five assets from 11 three weeks ago, with Bitcoin (BTC) alone shedding $1.44 billion in its largest weekly outflow of 2026.

XRP and Two Altcoins Defy the Outflow Wave
XRP’s $20.3 million inflow led a narrow group of assets bucking the institutional selling. HYPE drew $10.8 million following its Hyperliquid top-ten ranking, and NEAR Protocol (NEAR) added $7.6 million.
Only five digital assets posted inflows above $1 million, down from nine the prior week.
The narrow breadth signals that institutional buyers are picking specific names rather than rotating into altcoins broadly.
XRP’s reading extends the XRP ETF monthly inflows run recorded across May.

Bitcoin Drives Record Outflows as Risk-Off Deepens
Bitcoin’s $1.44 billion exit topped both the prior week and the January peak, sustaining the broader Bitcoin ETF outflow streak. Year-to-date Bitcoin inflows have compressed to $1.2 billion, down from $3.9 billion just two weeks ago.
CoinShares strategist James Butterfill said the sell-off echoes the January and February episode, which produced five consecutive negative weeks, according to the report.
“AuM has fallen to US$141bn from US$148bn the prior week, the lowest level since early April. The pattern is reminiscent of the January-February episode that delivered five consecutive negative weeks,” read an excerpt in the report.
The firm tied the weakness to Iran-related geopolitics, which has overwhelmed any cushion from CLARITY Act progress.
Ethereum (ETH) products shed $257 million, deepening recent Ethereum ETF outflow pressure.
US Leads Regional Sell-Off, Europe Joins In
The United States accounted for $1.63 billion of the global figure. Germany joined the risk-off with $25.7 million in outflows after holding firm through prior episodes, while Sweden recorded $6.6 million and Hong Kong $4.5 million.
Assets under management slipped to $141 billion from $148 billion.
BTC traded near $72,545 at the time of writing, down 1.73% over 24 hours, according to BeInCrypto data. The token has slipped 6.35% over the past week.

With altcoin breadth at its narrowest in three weeks, the next weekly print will show whether XRP and Hyperliquid hold their bid or join the broader risk-off.
The post XRP Leads Rare Altcoin Inflows as Crypto Funds Lost $1.67 Billion in a Week appeared first on BeInCrypto.


Knots leader Bitcoin Mechanic, aka “GrassFedBitcoin,” was banned from Reddit’s most popular Bitcoin community on Sunday after posting about the contentious BIP-110.
BIP-110 attempts to limit non-monetary data on Bitcoin like images, documents, and other inscriptions and, according to moderators, posting about it in the r/Bitcoin subreddit breaks a long-standing rule against promoting protocol changes that lack broad agreement.
Bitcoin Mechanic posted just two sentences: “7 blocks in the last difficulty period flipped version bit 4. I wonder what they’re signalling for?”
However, even this was enough to cause moderators to immediately remove the post and permanently ban his account
“I expected them to delete the post, didn’t expect them to ban my account,” he posted on Sunday alongside a video about the removal. It drew 40,000 views within hours on X, plus thousands more on YouTube.
“I know that they ban all mention of Knots and BIP-110. I know that already,” he said. “They have that as an unwritten but official policy at this point.”
He also claimed that he was simply describing an “on-chain reality.”
However, Reddit moderator BashCo tapped the sign and told Bitcoin Mechanic that the established rules meant the outcome should have been obvious.
Read more: BitcoinCore website hosts letter from one side of OP_RETURN debate
What was Bitcoin Mechanic trying to say — and why was it a problem?
The current dispute continues a multi-year feud over what type of speech is permitted on r/Bitcoin.
Rules about acceptable speech on this subreddit matter because it’s one of the most visible Bitcoin communities outside of X.
Its moderation has been a flashpoint since the blocksize wars of 2015-2017, when the forum’s administrators were accused of scrubbing dissent during blocksize scaling debates.
In the context of Bip-110 — the latest escalation in Bitcoin’s long-running OP_RETURN war, which Protos chronicled in detail — blocks by miners whose version has bit 4 set “yes” are signaling a type of vote for activating BIP‑110.
Version bit 4 means that the fifth bit (counting from 0) in the 32‑bit nVersion field is being used by BIP‑110’s deployment logic as that miner’s signal that they’re ready to enforce the BIP‑110 rules.
Read more: Bitcoin’s OP_RETURN war just went nuclear: a chain fork proposal
Bitcoin developer Dathon Ohm wrote the first version of BIP-110, floating it as BIP-444. Originally, node operators who activated it would have limited data unrelated to the on-chain movement of BTC within OP_RETURN outputs to less than 90 bytes of data.
It targeted inscription protocols like Ordinals and Runes that Ohm and the Knots community, including Bitcoin Mechanic and Luke Dashjr, dismiss as spam.
Protos has previously documented how the fight went nuclear when the blockchain fork idea first surfaced.
Whether Bitcoin Mechanic’s post was promotion or neutral reporting of on-chain activity is a microcosm of the Bitcoin Core versus Knots feud.
To moderators of the subreddit, signaling support for an unactivated fork is unacceptable promotion. To fans of Knots and/or BIP-110, as well as many agnostics, reporting that a newsworthy number of miners flipped version bit 4 in their blocks is an act of journalism.
Got a tip? Send us an email securely via Protos Leaks. For more informed news and investigations, follow us on X, Bluesky, and Google News, or subscribe to our YouTube channel.

Ethereum’s market dominance is retreating toward critical support as the sell-the-news phase following U.S. spot Ethereum ETF approvals transitions into sustained net outflows.
Two compounding dynamics are driving the slide: institutional capital rotating out of ETH products at an accelerating rate, and a structural Layer 2 migration pulling liquidity and fee-generating activity off the mainnet.
The result is a dominance chart under pressure and a spot price that has failed to reclaim key moving averages for weeks.
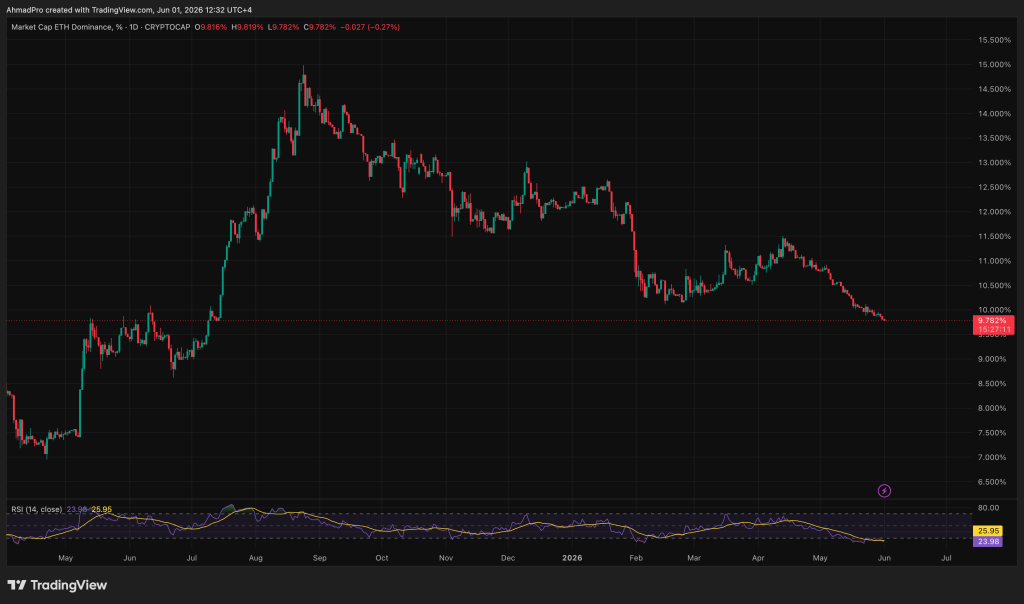
Market Dominance for ETH has slipped toward the 9.7% range, levels that previously acted as launchpads for recovery but are now being tested from above.
The ETH/BTC ratio has also breached critical support, signaling that Ethereum is underperforming not just the broader market but its closest institutional benchmark.
Discover: The Best Crypto to Diversify Your Portfolio
Ethereum ETF Outflows News Signal Institutional Repositioning, Not a Temporary Dip
The numbers are unambiguous. Ethereum spot ETFs have recorded approximately $540 million in net outflows year-to-date, according to aggregated flow data tracked across major products.
ETH-specific ETF outflows hit $306 million in the recent week, the largest weekly withdrawal since late January. The bleeding has not stopped. 14 consecutive days of outflows have now totaled over $708 million.
That is not noise. That is a pattern of Institutional Outflows consistent with what analysts at BestBrokers have described as fading institutional enthusiasm, a dynamic where post-approval euphoria gives way to fundamental reassessment.
The Ethereum ETF products briefly attracted strong inflows in early 2025 as broader crypto risk appetite surged, pushing ETH to local highs. That bid has since evaporated.
The rotation is directional, not a broad crypto exit. Flow data show XRP pulling in +$68 million and Solana attracting +$55 million in the same week ETH bled –$249 million.
Institutional and fund capital is not leaving crypto, it is leaving Ethereum specifically. That distinction matters for how this move is framed.
This is distribution dressed in post-ETF normalization language, and the price action reflects it. ETH has shed roughly 25% over three months even as it posted a modest ~10% gain over the trailing month, a dead-cat bounce structure, not a trend reversal.
Standard Chartered has maintained a bullish long-term thesis for ETH, projecting a recovery toward $4,000, but even the bank has flagged a potential flush toward $1,400 before that move materializes – which is not a bullish near-term signal when outflow data is running this hot.
Can ETH Dominance Find a Floor, or Is This a Structural Repricing?
ETH is trading beneath its 50, 100, and 200-day EMAs with support tested in the $2,000 level.
Any bounce from current levels runs directly into thick overhead supply built from months of ETF-related selling. This is not a thin resistance zone. It is a ceiling constructed by sustained institutional exit.
If ETF flows reverse on renewed institutional demand and the Pectra upgrade delivers a tangible catalyst for mainnet activity, dominance reclaims the 14% to 16% zone and a path toward $3,000 spot reopens.
If outflows stabilize without reversing, ETH consolidates between $2,100 and $2,500 while dominance drifts sideways at the 9% to 10% floor waiting for a durable narrative shift.
If the ETH/BTC ratio continues lower and ETF redemptions accelerate through the next monthly rebalancing cycle, dominance breaks below 8% and spot tests the $1,800 level that several technical models have flagged as the next structural support.
Discover: The Best Token Presales
The post Ethereum ETFs Bled $708m in 14 Straight Days as XRP and Solana Gained appeared first on Cryptonews.
Crypto World
Bitcoin Slips Below Key $73K Support as Bears Eye $70K Demand Zone (BTC Price Analysis)
Bitcoin remains under bearish pressure after a recent consolidation around the 100-day MA of $73K. The asset has now slightly broken below the MA. Upcoming price action will determine whether the recent pullback evolves into a leg deeper or forms a base for recovery.
Bitcoin Price Analysis: The Daily Chart
On the daily timeframe, BTC continues to trade within a large ascending channel that has contained price action since the February lows. The 200-day MA, currently located around $80K, has acted as dynamic resistance throughout the recent decline.
Meanwhile, the 100-day MA is positioned near $73K and is now being tested as immediate support. Price is trading directly around this level, making it a pivotal area for the broader trend.
A daily stabilization below the 100-day MA could expose the lower channel boundary and the major demand zone around $70K-$71K. This region also aligns with a previously established order block, increasing its technical significance.
On the upside, any recovery attempt is likely to face resistance around $75K-$76K, where a supply zone has already triggered a strong rejection. Beyond that, the 200-day MA near $80K remains the key obstacle. A successful reclaim of this level would improve the medium-term structure and open the door toward the $87K-$90K resistance region.

BTC/USDT 4-Hour Chart
The 4-hour timeframe highlights the loss of bullish momentum more clearly. BTC has established a sequence of lower highs and lower lows after failing to sustain its breakout above $82K.
Price is currently consolidating within a narrow range between roughly $72.8K and $74.5K. This range is developing directly above the rising lower trendline of the broader channel, creating a crucial decision point for the market.
The short-term structure remains neutral to bearish as long as BTC trades below the $75K-$76K supply zone. A breakout above this area could trigger a relief rally toward $78K and potentially $82K, where the next major liquidity cluster resides.
However, if sellers force a breakdown below the current range and the ascending trendline, the market could quickly rotate toward the higher-timeframe order block at $70K-$71K. Given the lack of significant support between these levels, a move into that zone could occur relatively fast.
For now, the market appears trapped between nearby support and overhead supply, with a likely expansion in volatility.

On-chain Analysis
The UTXO Realized Price Age Bands chart reveals an important development among short-term holders. Bitcoin is currently trading below the realized price of the 1M-3M cohort, which has risen steadily to approximately $73K-$74K.
Historically, this cohort has often served as a key gauge of sentiment. When price remains above the realized price of recent buyers, market participants tend to stay profitable, reducing immediate selling pressure. Conversely, sustained trading below this level can increase the probability of capitulation from weaker hands.
At the same time, the realized price of the 18M-2Y cohort continues to climb and currently sits near $70K. This level closely aligns with the major daily support zone and reinforces the importance of the $70K-$71K region as a potential accumulation zone.
Meanwhile, the older 3M-6M cohort remains significantly higher near $83K-$84K, reflecting the average cost basis of holders who accumulated during the previous advance. This level now represents a major overhead resistance area, aligning with the upper portion of the current trading range.
Taken together, the on-chain data suggests that Bitcoin is testing a critical short-term holder cost basis around $73K-$74K, while stronger long-term support continues to build near $70K. As long as the latter level remains intact, the broader market structure appears constructive despite the ongoing correction.

The post Bitcoin Slips Below Key $73K Support as Bears Eye $70K Demand Zone (BTC Price Analysis) appeared first on CryptoPotato.

Executive Summary
- BMNR experiences pre-market decline despite staked Ethereum exceeding $9.5 billion
- Company maintains $11.6B total position across cryptocurrency assets and cash reserves
- Ethereum holdings represent 4.49% of total ETH supply following recent acquisitions
- MAVAN validator network underpins company’s expanding Ethereum staking operations
- Management sets sights on controlling 5% of Ethereum supply with projected staking yields
Bitmine Immersion Technologies disclosed total holdings of $11.6 billion across digital assets, cash positions, and strategic investments as BMNR stock demonstrated volatility. Shares concluded regular trading at $19.27, representing a modest 0.10% gain, before retreating 2.25% to $18.82 during pre-market hours. This downward movement occurred alongside announcements of Bitmine’s enlarged Ethereum treasury and staked ETH crossing the $9.5 billion threshold.
Bitmine Immersion Technologies, Inc., BMNR
Substantial Ethereum Treasury Accumulation
According to its most recent disclosure, Bitmine possessed 5,416,901 ETH as of May 31, 2026. With each token valued at $2,003, the company’s Ethereum allocation exceeds $10.8 billion. Beyond its primary Ethereum holdings, Bitmine maintains 203 Bitcoin alongside $446 million in liquid cash reserves.
Management indicated these ETH reserves constitute 4.49% of Ethereum’s circulating supply totaling 120.7 million tokens. This concentration establishes Bitmine as the dominant corporate holder of Ethereum worldwide. Among all corporate cryptocurrency treasuries globally, only Strategy surpasses the company’s position.
Over the preceding seven days, Bitmine acquired an additional 26,497 ETH as part of its ongoing accumulation strategy. Company executives stated their objective of controlling 5% of total Ethereum supply before 2026 concludes. This milestone forms a cornerstone of the firm’s extended treasury approach and equity market narrative.
Staking Operations Eclipse $9.5 Billion Mark
As of May 31, 2026, Bitmine disclosed 4,718,677 ETH actively staked across its validator infrastructure. With Ethereum priced at $2,003, this staked allocation represents approximately $9.5 billion in value. The figure accounts for over 87% of the company’s complete Ethereum portfolio.
MAVAN, the company’s Made in American Validator Network, powers its Ethereum validation activities. Bitmine developed this infrastructure initially for internal treasury management, with plans for broader deployment. Leadership anticipates MAVAN will eventually accommodate institutional clients, custodial services, and additional ecosystem participants.
The company disclosed a 7-day annualized staking yield of 2.73% for BMNR operations. Extrapolating from this performance metric, Bitmine forecasts annualized staking income of $258 million. Operating at maximum capacity, the projection extends to $296 million in yearly staking rewards.
Stock Maintains Elevated Trading Volumes
While BMNR registered marginal gains to close at $19.27, early pre-market activity drove shares down to $18.82. The pullback followed the company’s latest treasury disclosure. The equity continues ranking among the most actively exchanged securities across U.S. markets.
According to Fundstrat analysis, BMNR averaged $628 million in daily dollar volume across the four-day period concluding May 29, 2026. This trading activity positioned the stock at rank 225 among 5,704 U.S.-listed equities. The placement situated BMNR between Marathon Petroleum and Blackstone in terms of liquidity metrics.
Beyond core cryptocurrency positions, Bitmine revealed strategic equity holdings in emerging ventures. These encompass a $180 million investment in Beast Industries and $93 million allocated to Eightco Holdings. Combined with digital assets and cash, the company’s aggregate holdings including moonshot investments total $11.6 billion.


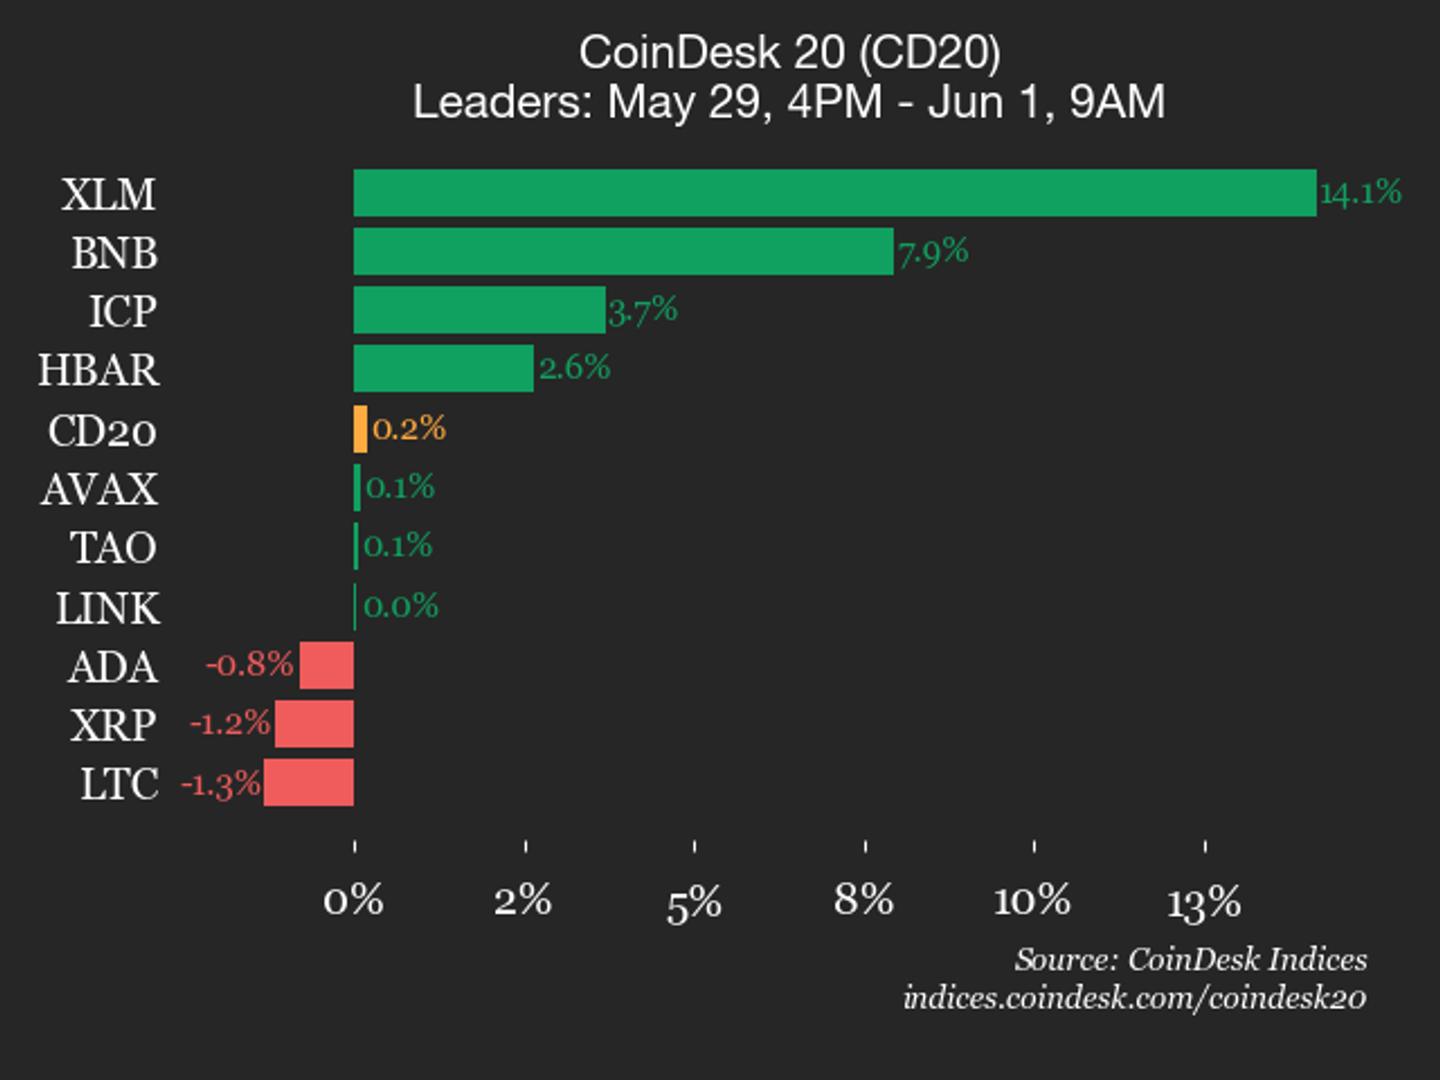
Binance Coin (BNB), up 7.9%, was also a top performer.
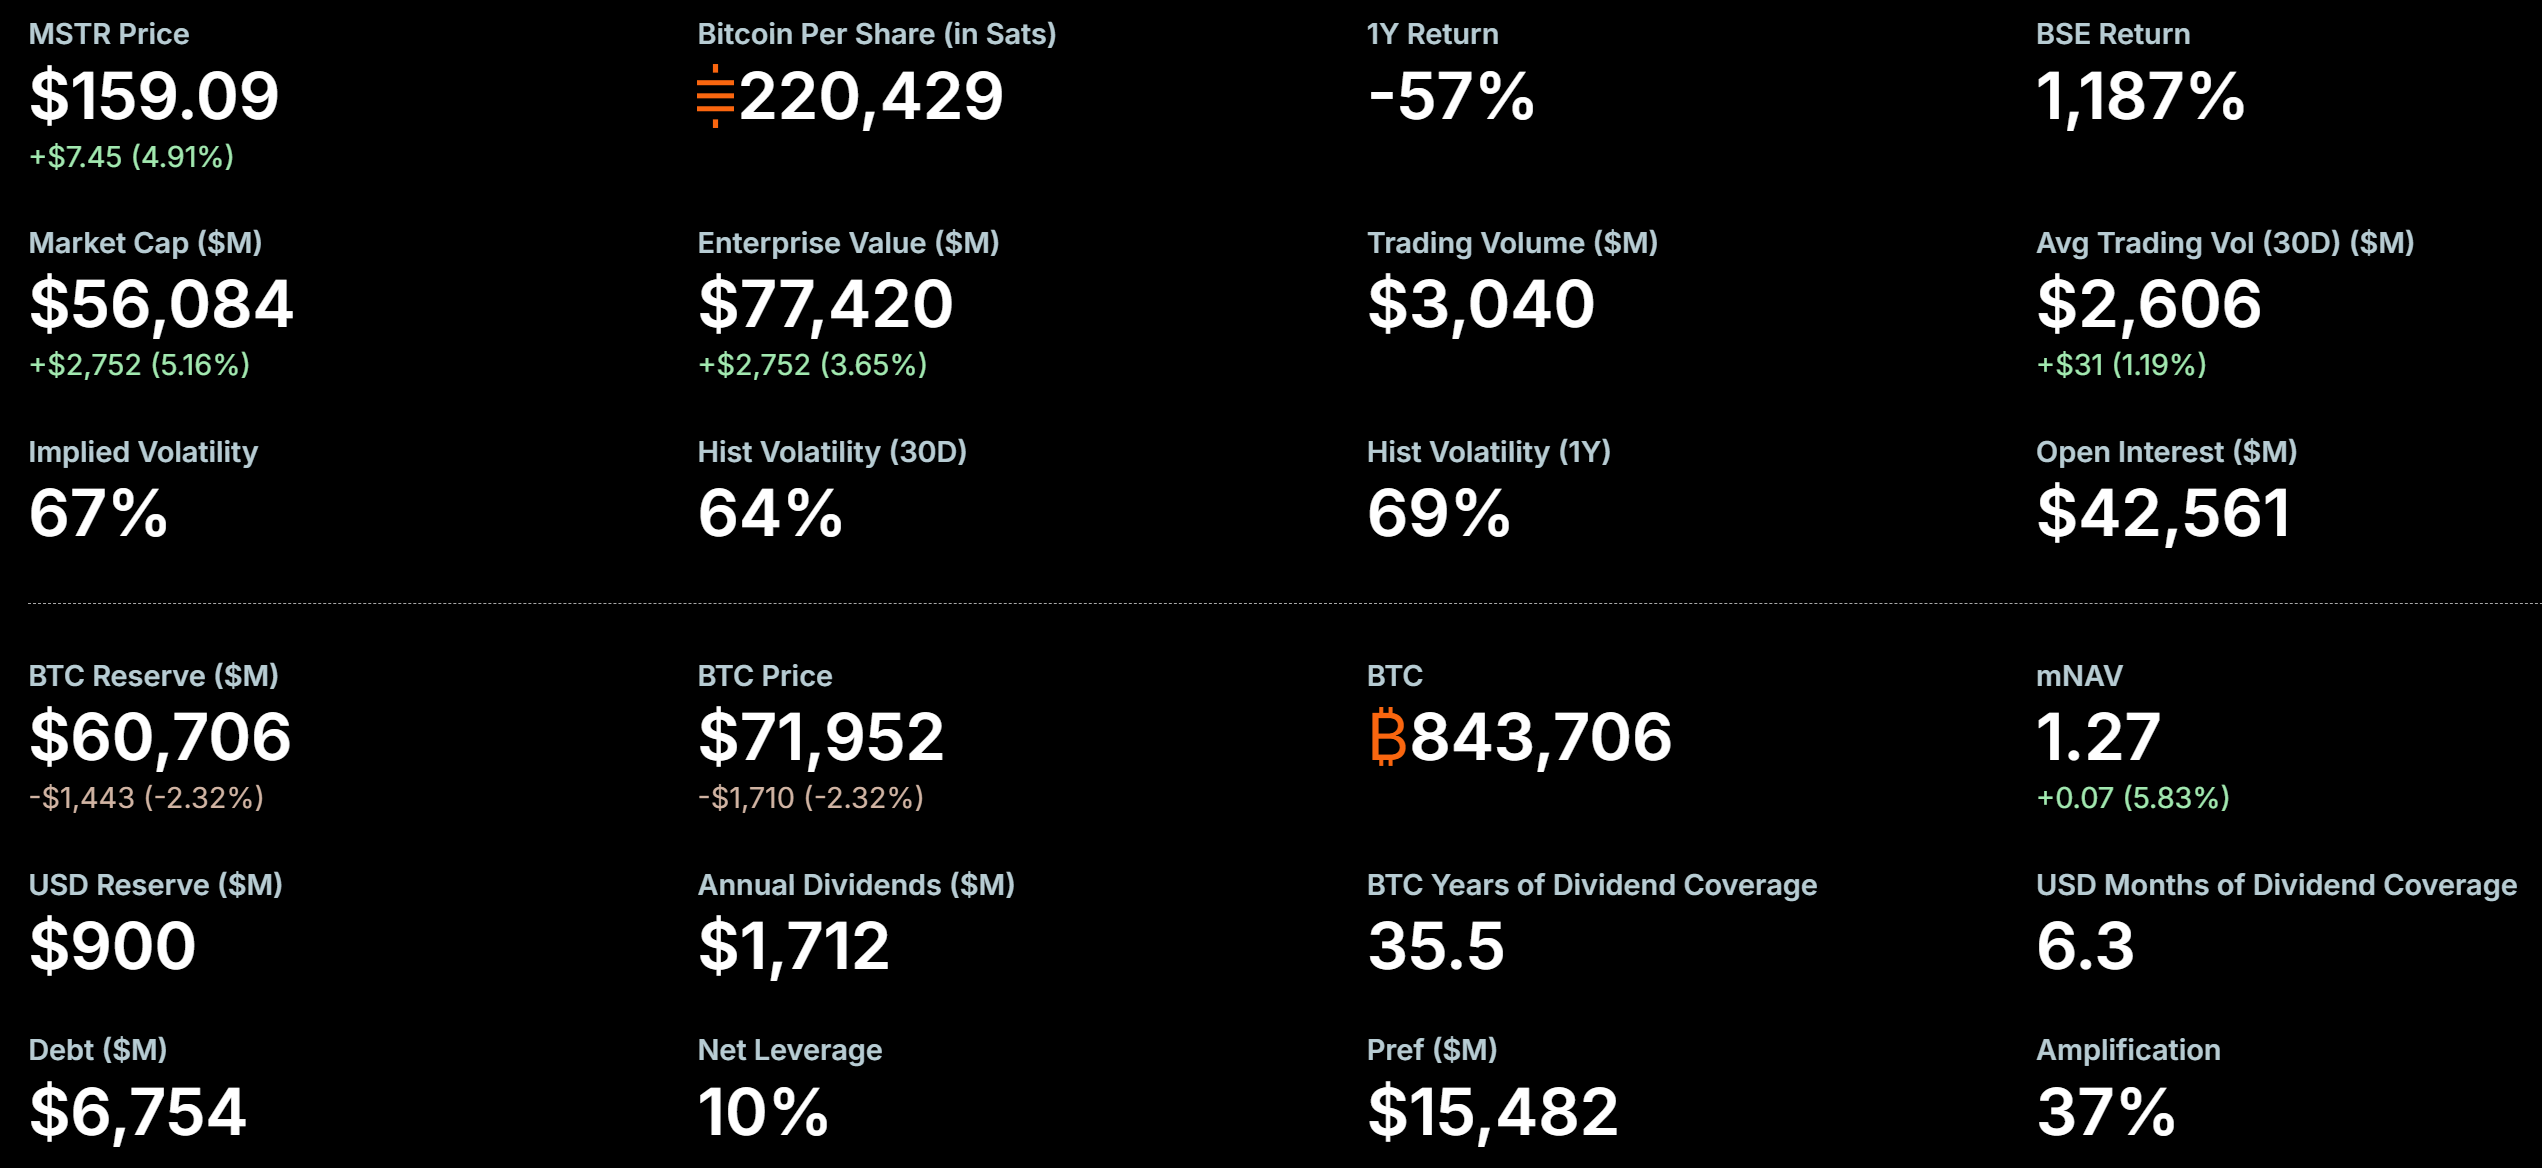
Strategy Inc, the largest corporate Bitcoin holder, confirmed its first Bitcoin sale in the June 1, 2026 Form 8-K filing.
The company offloaded 32 BTC for approximately $2.5 million during May 26–31, while maintaining a massive 843,706 BTC treasury.
On-Chain Suspicion Meets Official Confirmation
Traders and on-chain analysts spotted MicroStrategy wallets moving BTC to Coinbase Prime days earlier, sparking intense speculation.
Arkham Intelligence and community trackers highlighted the unusual activity, which fueled a Polymarket bet on whether any sale would occur by May 31.
One trader bet big on YES when the market priced the probability around 11%. The June 1 filing resolved the market in his favor, delivering an estimated $200,000 payout.
Follow us on X to get the latest news as it happens
The last time MicroStrategy sold Bitcoin was in December 2022, when they disposed 704 BTC for tax-loss harvesting before repurchasing more of the pioneer crypto two days later.
Details from the latest filing, showing last week’s Bitcoin sales include:
- Sold: 32 BTC at an average of around $77,135 each (net of fees).
- Holdings as of May 31: 843,706 BTC with approximately $63.87 billion cost basis (average of around $75,699 per BTC).
- Purpose: Proceeds support preferred stock dividends (STRF, STRC, etc.).
- USD Reserve: $900 million earmarked for obligations.

Bitcoin traded near $72,000–$74,000 around the period, meaning MicroStrategy sold at a premium to recent levels.
The sale represents a tiny fraction (<0.004%) of holdings but marks a shift from pure accumulation.
MicroStrategy has aggressively grown its treasury via ATM equity and preferred stock raises, often buying thousands of BTC weekly.
This disciplined approach, selling selectively while replenishing via capital markets, aligns with executive comments on proactive treasury management.
Preferred dividends and debt service remain key priorities, backed by the dedicated USD reserve.
With Bitcoin volatility persisting and corporate treasuries under scrutiny, any larger sales or accelerated buys could influence sentiment.
MicroStrategy’s Bitcoin-per-share metric and yield targets will likely remain central to its narrative as it balances growth, obligations, and long-term conviction in Bitcoin.
The post MicroStrategy Sells Bitcoin For the First Time Since 2022, Hands Trader a $200,000 Win appeared first on BeInCrypto.

Key Takeaways
- Barclays launched coverage of IBM on Monday with an Overweight rating and set a $350 price target.
- Shares of IBM climbed approximately 11-12% to near $330 during premarket hours.
- The optimistic outlook focuses on IBM’s software division, which accounts for nearly 50% of revenue and most profits.
- According to Barclays analyst Raimo Lenschow, IBM’s infrastructure software caters to large, regulated corporations — establishing a durable customer base resistant to AI disruption.
- This bullish call adds to recent strength: IBM has climbed 28% in the last month and recorded its best weekly performance in a quarter-century.
IBM shares experienced significant upward momentum on Monday following a bullish initiation from Barclays — and the catalyst wasn’t related to quantum computing developments.
International Business Machines Corporation, IBM
Shares of IBM jumped approximately 11% in premarket action, reaching $330.11, after Barclays analyst Raimo Lenschow launched coverage with an Overweight recommendation and established a $350 price objective. This target suggests additional upside potential of 17.5% from premarket levels.
The technology giant has been experiencing remarkable momentum. IBM has advanced 28% during the past 30 days and recently delivered its most impressive weekly performance in two and a half decades. Shareholders of Big Blue have enjoyed substantial gains in recent weeks.
While quantum computing has dominated recent headlines — IBM secured $1 billion in federal CHIPS and Science Act funding to construct a dedicated quantum chip fabrication facility, subsequently committing over $10 billion of corporate capital toward quantum development and production over five years — Lenschow’s investment thesis focuses elsewhere.
The Enterprise Software Narrative
His investment case is more straightforward: IBM has transformed into a software-driven enterprise, and the market hasn’t fully recognized this evolution.
Software accounts for approximately half of IBM’s total revenue while generating the majority of corporate profits. Lenschow anticipates this revenue composition will expand over time due to software’s superior growth characteristics.
The critical element of his analysis centers on IBM’s software specialization. This isn’t consumer-facing applications or fashionable AI tools. Instead, it’s fundamental infrastructure — Red Hat Enterprise Linux, Red Hat OpenShift, automation solutions, and data analytics platforms — engineered specifically for large, sophisticated enterprises operating hybrid cloud and on-premises infrastructures.
These clients will never transition entirely to cloud environments, Lenschow observes. This dynamic creates a captive, predictable revenue stream that’s difficult to disrupt.
“We see mid single digit organic revenue growth and ongoing margin leverage, which should create a stable earnings compounder with a Quantum option,” he wrote.
A Growing Consensus
Lenschow’s perspective isn’t breaking new ground. Oppenheimer’s Param Singh employed similar terminology in January, characterizing IBM’s software assets as “sticky.” Evercore ISI’s Amit Daryanani reinforced this view in February. And during April, Citi Research’s Fatima Boolani portrayed IBM’s software and hardware as deeply embedded “across the most critical points of the world’s largest, most complex IT infrastructures.”
This convergence of analyst endorsements illustrates a compelling investment narrative gaining momentum: IBM’s enterprise software foundation represents a competitive advantage rather than a burden.
Additional attention has emerged from social media channels. Statements from Donald Trump in December commending IBM’s chief executive have reemerged online, circulating alongside discussions of other occasions where the president has publicly recognized particular equities in 2025.
The overall Wall Street sentiment remains measured. Among analysts currently tracking IBM, 10 maintain Buy recommendations while 11 rate it at Hold — establishing a Moderate Buy consensus. The average price objective stands at $291.69, indicating the stock may be appropriately valued at present levels following its recent appreciation.
IBM’s latest financial results demonstrated continued outperformance in the software division, with the corporation emphasizing hybrid cloud capabilities and AI integration throughout its enterprise customer portfolio.

Antim to Aman: Full list of Indian wrestlers qualified for Asian Games 2026 | Asian Games 2023
US export curbs push China’s AI chips away from GPUs to custom ASICs
Honey may be the natural buzz you need to fuel your workouts


-

 NewsBeat5 days ago
Israel says it has killed new Hamas military leader in Gaza City airstrikes
-

 Tech5 days ago
NASA taps Blue Origin to deliver lunar rovers for Moon Base initiative
-

 Sports6 days ago
2026 NBA Finals schedule, odds: Knicks await Thunder or Spurs after winning East
-

 News Videos5 days ago
XRP *JUST* SUCCEEDED!!!! CLARITY ACT EXPOSED!!! (SHE EXPOSED IT)
-

 News Videos3 days ago
This is BROKEN! INSANE 5x MONEY CAR WASH WEEK! The NEW GTA Online UPDATE Today! (GTA5 New Update)
-
 Crypto World6 days ago
Micron Crosses $1 Trillion Market Cap as AI Demand Reshapes Memory Sector
-
 NewsBeat7 days ago
Hottest May day ever as London hits 34.8C in 2C leap from previous records
-

 Business6 days ago
Selena Gomez Reportedly Upset Over Benny Blanco’s Comments on Her ‘Terrible’ Diet
-
 Tech6 days ago
China assigns ID codes to 28,000+ humanoid robots
-

 Business7 days ago
Nikkei 225 Surges Past 65,000 for First Time as Iran Peace Hopes Fuel Record Rally
-

 Tech3 days ago
Waymo dominates autonomous vehicle registrations as Tesla trails behind
-
 Entertainment7 days ago
‘Breaking Bad’ Star’s Easy-to-Binge 6-Part Crime Series Spin-Off Is Finally Heading to Free Streaming
-

 NewsBeat7 days ago
Crowds find riverside shade in York as temperatures soar
-

 Tech5 days ago
The Samsung pay deal is the moment Korean unions changed register
-
 Tech2 days ago
SpaceX just won a second Golden Dome contract. This one is $4.16 billion.
-

 Entertainment6 days ago
Days of our Lives 2-Week Spoilers May 25-June 5: Gwen Rages, Abe Confesses & 2 Tragic Anniversaries!
-
 Entertainment6 days ago
Taylor Swift Fans Label Travis Kelce’s Beer-Chugging A ‘Red Flag
-
 NewsBeat3 days ago
FIRST NIGHT REVIEW: Take That bring the Circus back to life in spectacular sun-soaked style
-

 Tech6 days ago
Millions of AI agents imperiled by critical vulnerability in open source package
-

 News Videos3 days ago
SHE IS KILLING XRP!!! WATCH URGENT AND ACT FAST
You must be logged in to post a comment Login