

Crypto World
Candlestick Wick Analysis in Trading
Candlestick wicks often contain critical information about buying and selling pressure that body patterns alone may not reveal. By analysing wick length and position, traders can understand price rejection, momentum shifts, and liquidity zones.
In forex and CFD markets, sessions run long and liquidity shifts across the day. That setup often produces rejections at session boundaries, round numbers, and structural levels. Wick analysis trading may offer a quick read on sentiment that body-only views can miss. This article explains the candle wick meaning and outlines several strategies traders may use.
What Candle Wicks Show in Price Action
Candle wicks, or shadows, are the thin lines above and below a candlestick’s body that indicate how far the price moved during a specific period. The upper wick marks the highest price reached during the candle’s period, and the lower wick marks the lowest.
Candle wicks, extending beyond the body of the candlestick, offer a deeper insight into market dynamics than open and close price levels. Their lengths and positions relative to the candle body unveil the tug-of-war between buyers and sellers within a given timeframe.
Wicks reflect rejection and volatility in a single visual. Each wick records a price the market reached but failed to hold. Longer wicks point to wider intraperiod ranges and more aggressive two-way action. Short wicks suggest price stayed close to its open and close throughout the period.
A long wick candle to the upside suggests that buyers pushed the price higher, but sellers eventually overcame, driving the price down from its peak. Conversely, a lengthy lower wick indicates sellers initially dominated, with buyers making a strong comeback.
Such patterns are not merely reflections of high volatility; they signal potential market reversals or continuations, depending on their context and the prevailing trend. For instance, a series of increasing lower wicks in a downtrend could hint at a building bullish pressure. Traders often scrutinise these subtle cues, aligning them with other technical indicators to refine entry and exit points.
The table below summarises how the three main wick patterns are commonly read:
Wick Size and Candle Body Ratio
The wick-to-body ratio sorts candles into four rough categories of candlestick patterns.
Indecision candles have a small body between two long wicks. Both sides pushed price away from the middle and neither held ground. Doji and spinning tops fall into this group.
Rejection candles have a small body at one end of the range and a single long wick at the other. One side pushed hard before the other overwhelmed them, producing a rejection candle pattern often seen at key levels.
Momentum exhaustion shows up after a strong directional run. A large body with disproportionately long wicks suggests the move stretched far enough that opposing pressure started pushing back, hinting momentum rejection is building.
Strong momentum candles usually have a large body with small or no wicks. This reflects sustained directional pressure where price closed near the session high or low with limited rejection. Marubozu candles are a common example and are often associated with strong breakout or trend continuation moves.
Reading Market Conditions with Wick Analysis
Wicks serve as a lens to view underlying market conditions, offering insights into trader sentiment, potential reversals, and the strength of current trends. This analysis predominantly focuses on the length and frequency of long wicks, as they often carry more significant information than their shorter counterparts.
Context shapes what a wick is telling traders. A long wick on a 5-minute chart in a quiet session reads differently to the same wick on the daily at a multi-month high. Traders typically check the prevailing trend, the timeframe, and nearby structural levels before drawing conclusions from any single candle.
Trend Continuation
Long lower wicks during pullbacks in an uptrend, or long upper wicks during bounces inside a downtrend, often indicate the dominant side stepped back in to defend the trend. A cluster of these wicks across consecutive candles tends to reinforce the read. Traders sometimes treat them as a trend continuation signal aligned with the existing direction.
Reversal Risk
- Long Upper Wicks: Typically indicate a rejection of higher prices by the market, showing that buyers were unable to maintain control. When observed in an uptrend, these can signal an impending reversal or a pause in momentum as sellers start to outweigh buyers at higher prices. Upper wick trading typically focuses on these setups near established resistance.
- Long Lower Wicks: Suggest a rejection of lower prices, showing that sellers couldn’t keep the price down. In a downtrend, long lower wicks can be a precursor to a reversal, indicating that buyers are beginning to dominate the price action. Lower wick trading typically focuses on these setups near established support.
- Repetition and Placement: The significance of long wicks is amplified when they occur repeatedly over several candles or near key support and resistance levels. A series of candles with long upper wicks near a resistance area, for example, could hint at a strong selling pressure, suggesting an area for a reversal.
Failed Breakout
A wick that pierces a level and closes back inside the prior range is the textbook failed breakout candle signature. One side attempted to extend the move, found no follow-through, and price snapped back. These wicks are common after consolidation breaks that lack volume or wider confluence.
Liquidity Sweep
A long wick spiking through an obvious swing high or low before reversing may indicate a liquidity sweep, where price extended just far enough to trigger clustered stop orders before reversing. Wicks of this type often appear at session highs and lows, where stops tend to accumulate.
Common Wick Signals in Forex and CFD Markets
Forex wick trading and CFD wick analysis tend to focus on a handful of repeatable settings where wicks carry more weight than usual.
- Support and Resistance: Long wicks tagging well-tested horizontal levels often reflect support and resistance rejection, where resting orders at the level absorb the move.
- Session Highs and Lows: In forex, wicks forming at the highs and lows of the Asian, London, or New York sessions tend to mark zones where liquidity changes hands as the next session takes over.
- Moving Averages: Wicks rejecting dynamic levels such as the 50, 100, or 200-period moving average may suggest the average is acting as a trend filter for the period in question.
- Volatility Spikes: Wicks during news releases or sharp volatility expansions reflect volatility rejection as much as informed flow, so they often need follow-up confirmation before being trusted.
Wick Trading Strategies
The wick analysis trading strategies below share a common foundation. Each one treats a long wick as evidence of price rejection candle behaviour at a level that already carries technical weight. Wick candle trading is usually based on the conditions when the wick lines up with prior structure, a Fibonacci level, a moving average, or another reference point that other traders are also watching.
A single candle in isolation is rarely enough for candlestick wick analysis. Traders typically wait for the candle to close, look for confirmation from surrounding price action, and check the broader trend before treating any wick as a setup.
Now, let’s explore three long-wick trading strategies. If you’d like to see how they work in practice, consider following along in FXOpen’s TickTrader platform.
Long Wick During Trend Pullbacks

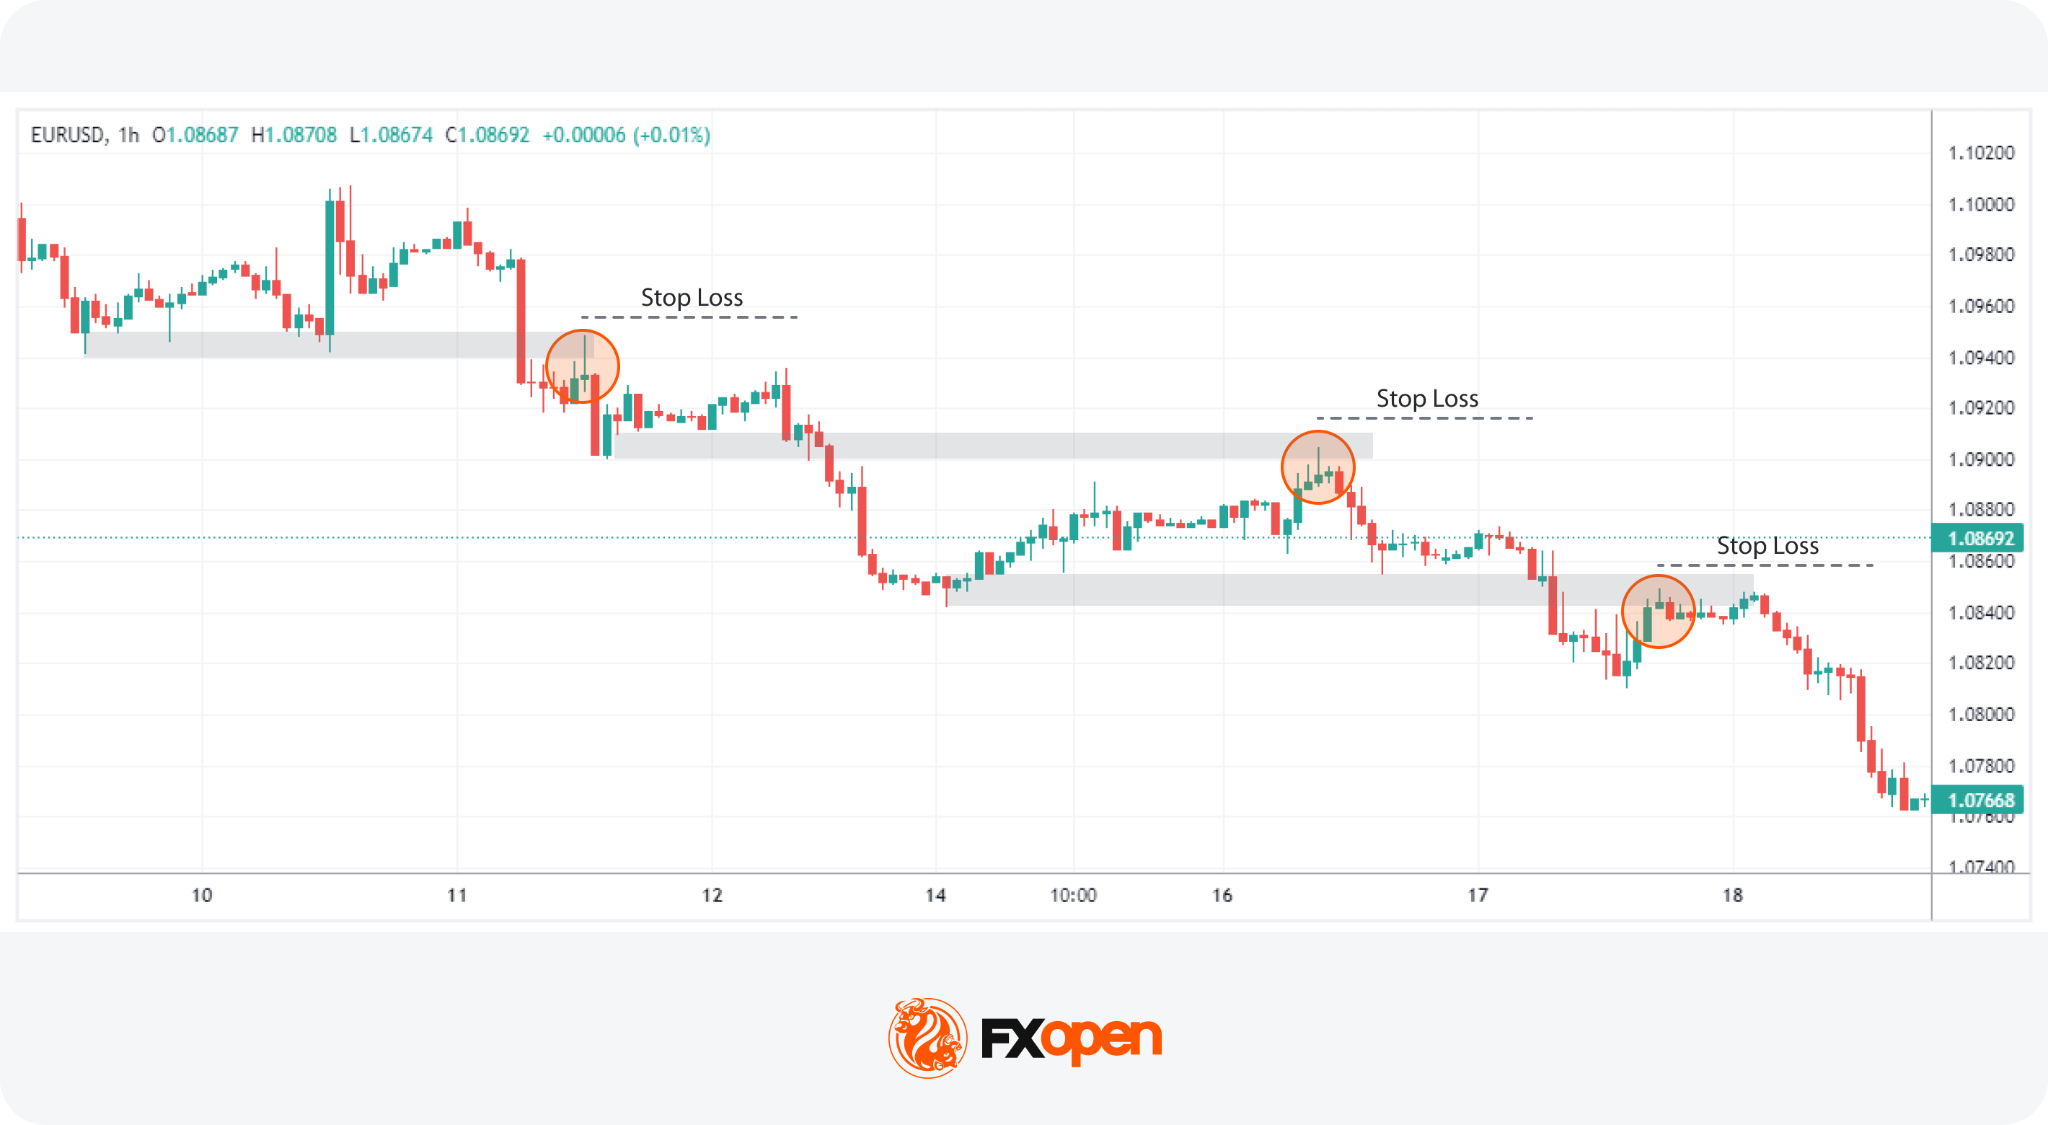
In the realm of long-wick candle trading, the strategy focusing on extended wicks during trend pullbacks may be insightful. The strategy focuses on temporary pullbacks within an established trend, using long wicks as signs of rejection and potential trend continuation.
Identifying the trend first is what separates wick candle trading from random wick-chasing. Traders typically look for a sequence of higher highs and higher lows in a bullish trend, or lower highs and lower lows in a bearish one. A 50- or 200-period moving average may also support the read on direction. On 15-minute and 1-hour charts, the trend is judged against intraday structure. On the 4-hour, traders typically take a broader swing view spanning several days.
Entry
- Traders watch for a long wick to form when the price begins to pull back to the previous range (i.e. at or above the last swing low in a bearish trend or at or below the last swing high in a bullish trend), indicating an area where the trend may continue.
- The presence of a long wick candle, usually at least a third or half its overall size, signals that market participants may be stepping in to support the overall trend.
Stop Loss
- According to the theory, a common approach is to set stop losses just beyond the entry candle for a buffer against market reversals.
- Alternatively, traders might place stop losses beyond a nearby swing point or a well-established support or resistance area.
Take Profit
- Profit targets might be identified by assessing upcoming resistance levels in a bullish scenario or support levels in a bearish scenario. Traders may also consider a fixed risk-reward ratio instead.
Wick Rejection Strategy at Support and Resistance
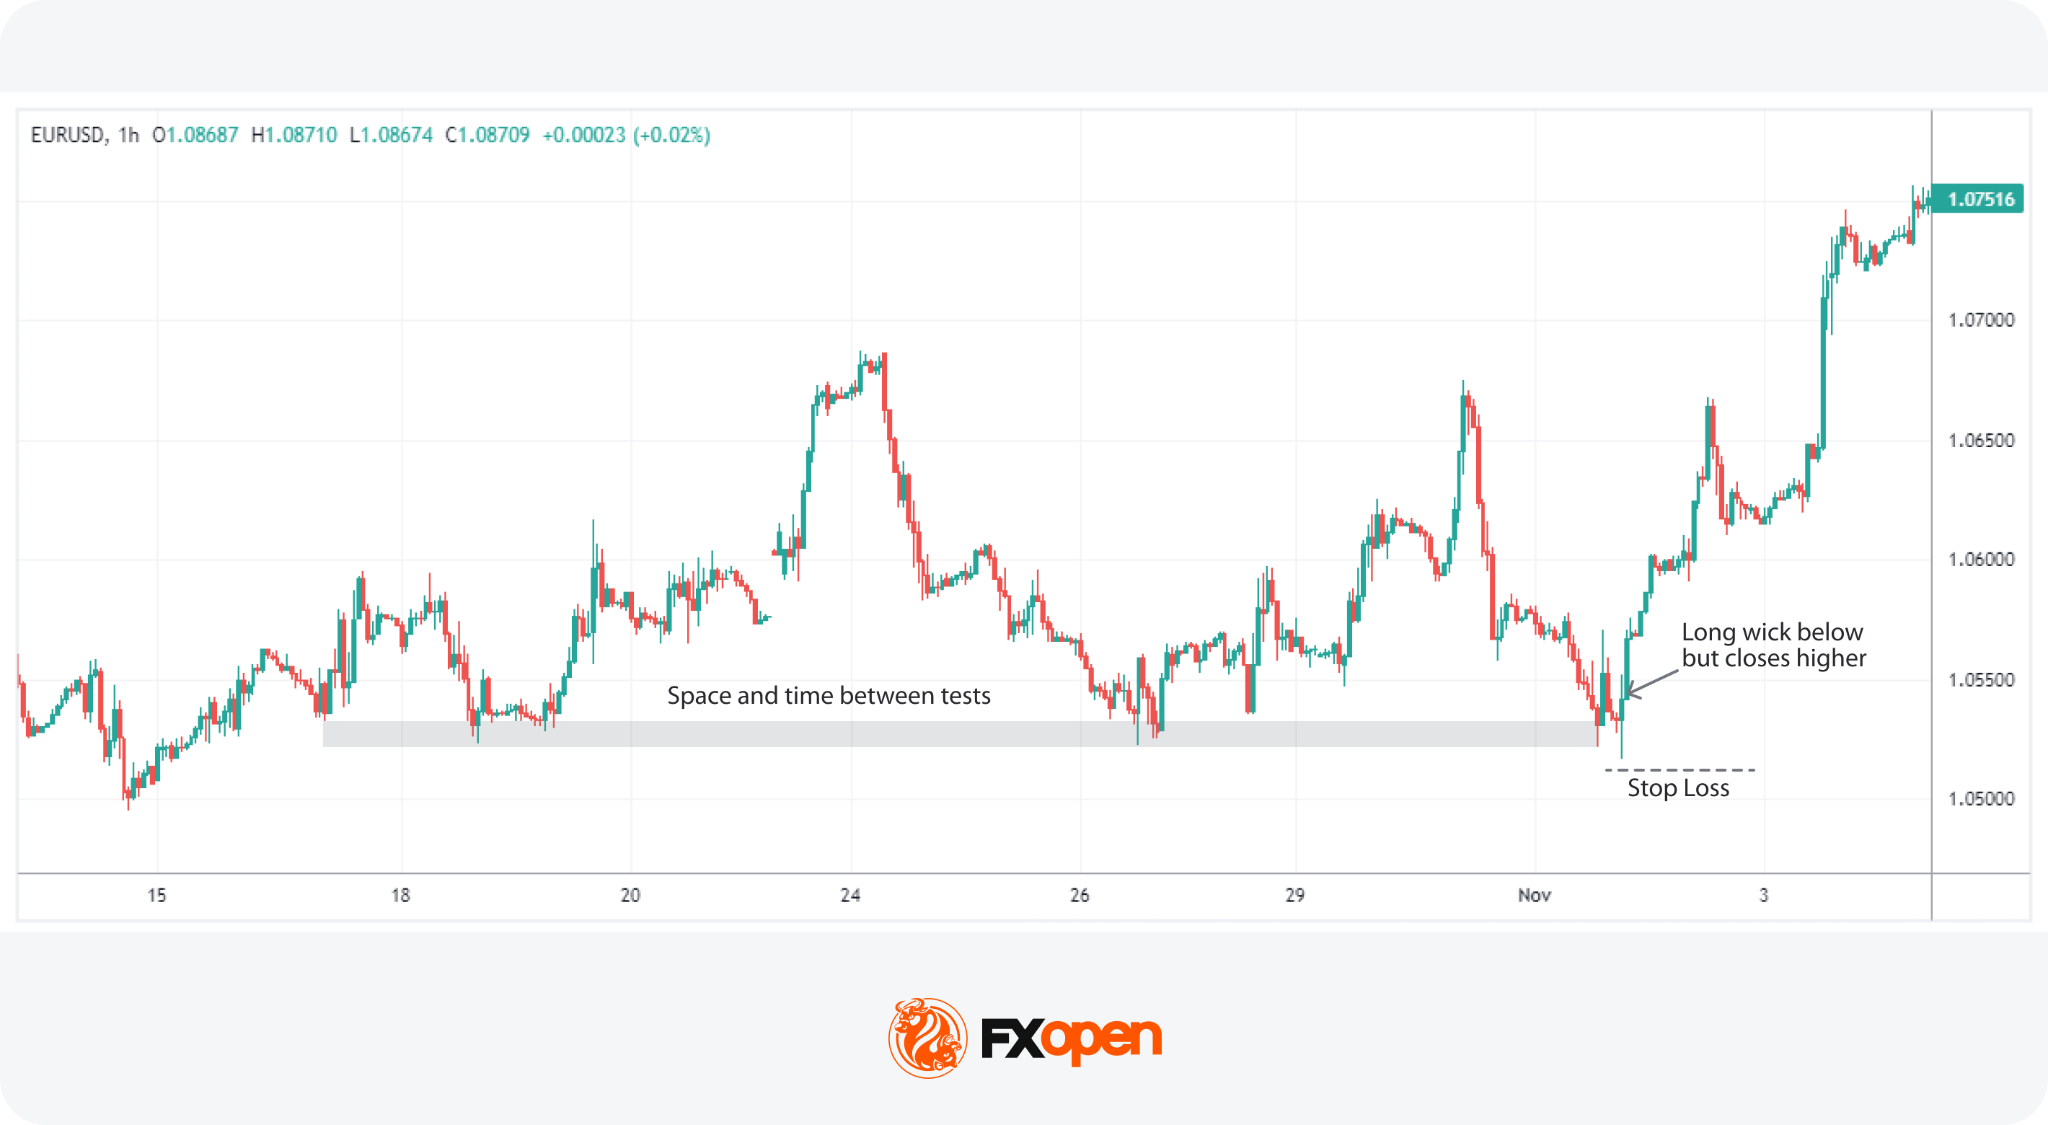
The strategy of focusing on long wicks on candlesticks at significant support or resistance levels leverages the market’s reaction to these critical areas. It’s a technique that thrives on the premise that major horizontal support or resistance, which have been tested multiple times with significant highs or lows, act as strong psychological barriers for price movements.
This method is more popular when there is clear visual space on the chart and considerable time between the tests of these areas, emphasising the significance of these levels.
When price briefly moves beyond support or resistance before quickly reversing, the resulting long wick may indicate rejection of higher or lower prices. Some traders interpret this type of move as a failed breakout, especially when the candle closes back inside the prior range.
On the risk-management side, traders often place stop losses beyond the wick high or low while keeping position size aligned with their overall risk limits.
Entry
- Traders often look for a candle that moves sharply into a major support or resistance area and then reacts away, leaving a long wick. This indicates a strong rejection of the price beyond these areas.
- A movement above or below the previous highs or lows, accompanied by a long bull wick or bear wick, adds confirmation to the trade setup.
Stop Loss
- Traders could set stop losses just beyond the candle’s high or low.
Take Profit
- Traders typically target an opposing support or resistance area for placing take-profit levels, as they expect a bounce from the tested level. However, some traders may opt for a fixed risk/reward ratio instead.
Wick Rejection Near Fibonacci Levels
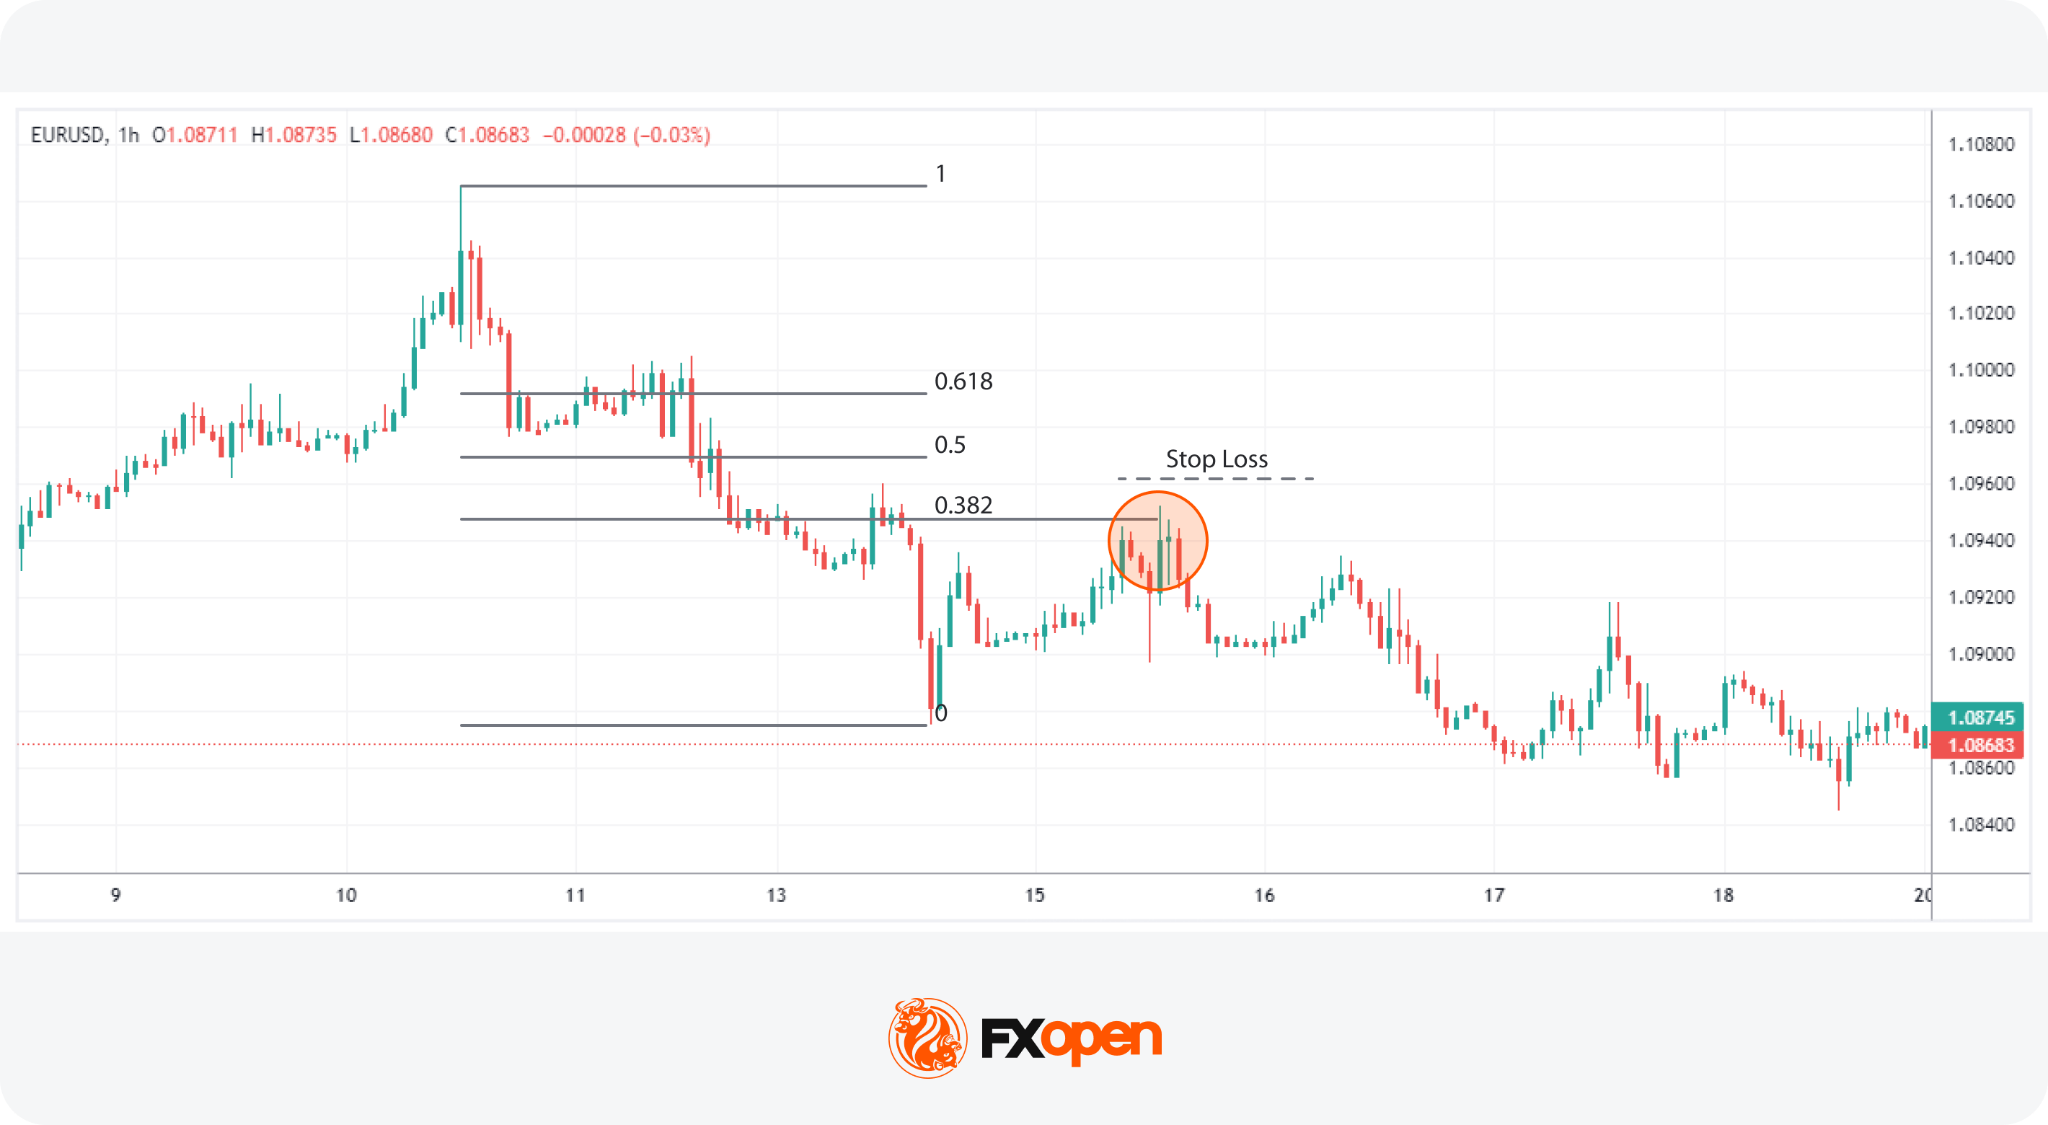
In this strategy, traders use Fibonacci retracements in tandem with candlestick analysis to anticipate trend continuations. The approach starts from a clear trend, with the retracement drawn across the most recent swing.
Fibonacci levels carry more weight when they line up with other technical reference points. Key levels of interest are the 0.382, 0.5, and 0.618 retracement levels, which act as zones of interest rather than precise lines. Traders look for them to overlap with horizontal support or resistance, a prior swing point, or a moving average. A long wick rejecting a Fibonacci level in isolation is generally read with more caution than the same wick at a Fibonacci-plus-structure confluence.
Entry
- Attention is centred on the 0.382, 0.5, and 0.618 Fibonacci retracement levels, awaiting price action that touches these zones.
- The presence of a long wick touching one of these zones reflects a strong rejection of further price movement against the trend, hinting at a potential continuation of the established trend.
- Additional confirmation is sought when these Fibonacci levels coincide with other recognised support or resistance areas, reinforcing the likelihood of a trend continuation.
Stop Loss
- Stop losses are typically positioned just beyond the wick, a nearby swing high/low, or the next Fibonacci retracement level.
Take Profit
- Profit targets might be set at the high or low used to draw the retracement, aiming to capture the full extent of the trend’s movement.
- Alternatively, traders may choose another significant support or resistance level as a profit-taking point based on the prevailing market structure.
Wick Analysis with Volume Confirmation
Candlestick wick analysis often works alongside volume. A wick that prints on noticeably higher volume than the surrounding candles tends to carry more weight than the same wick on thin participation. Relative volume, judged against an average of the prior 20 or 50 periods, is the common way traders frame this read.
Absorption is one behaviour worth watching. When price pushes into a level and the candle prints a long wick on elevated volume, it may suggest that resting orders on the defending side absorbed the move without giving ground. The wick records where buyers or sellers tried to extend the move, and the volume records how much pressure it took to push them back.
Rejection behaviour reads similarly. A long upper wick on heavy volume at resistance may indicate selling interest was meaningful rather than incidental. The same wick on light volume offers less confirmation, and traders typically treat it with more caution.
Traders using volume indicators in forex often supplement them with tools such as Volume Profile or session-based reads.
Common Considerations in Wick Trading
In the world of big wick candle trading, there are some common practices that traders may consider:
- Context: It’s common for traders to analyse wicks within the broader market context to make decisions based not only on one candlestick pattern, but also on other market factors.
- Volume Confirmation: Many traders look for volume confirmation to validate the signals provided by long wicks. A significant volume spike accompanying a considerable wick can indicate strong market interest at certain prices.
- Looking For Confluence: Likewise, seeking areas that coincide with other technical levels can add extra confirmation to a wick-based trade. Fibonacci retracements, support/resistance zones, and moving averages are commonly used.
- Practice Patience: Traders often exercise patience, waiting for the candle to close before making a move. This may help in avoiding false signals that might occur during the candle’s formation.
Avoiding Isolated Candle Analysis
A single wick says far less than the sequence around it. Traders typically zoom out before acting on any wick, checking the prior two or three candles for confirmation that rejection was sustained rather than fleeting.
A long lower wick that prints below support is one signal. The next candle closing back inside the range with a strong body is a second. Without that follow-through, the original wick can be a false alarm, especially during low-volume periods or news-driven spikes. Reading wicks alongside trend, structure, and at least one secondary signal tends to filter out the noise that catches traders acting on a single bar in isolation.
Limitations of Wick Analysis
Wick trading strategy approaches have real limits and traders typically build that into how they use them:
- Low liquidity periods: in thin sessions such as the Asia-Pacific open or late Friday trading, wicks can form on minimal flow. A wick built from a handful of ticks reflects sparse participation more than meaningful rejection.
- News spikes: economic releases and central bank announcements often produce dramatic wicks that have little to do with technical structure. These tend to revert as algorithms unwind initial reactions, so the wick can be misleading as a setup.
- Ranging conditions: in choppy, sideways markets, wicks form constantly at the range extremes and most lack predictive value. The signal-to-noise ratio drops sharply outside trending environments.
- False signals: even in clean conditions, a meaningful share of wick setups fail. Wicks are probabilistic reads on order flow, not certainties.
Wick analysis is usually used as one input in a broader technical framework that also draws on trend identification, structural levels, volume, and risk management. Treating it as a standalone system invites the limitations above to dominate the results.
Summary
While candle wicks may seem like minor visual elements, they often reveal some of the market’s most telling signals. From highlighting rejection zones to exposing failed breakouts, wicks can support traders when building a trading strategy. Many traders use wick analysis inside a broader price action trading framework, alongside trend identification, structural levels, volume, and risk management rather than in isolation.
If you would like to trade with over 1,200 tools and indicators, you can consider opening a forex trading account with FXOpen and gain access to trading in over 700 markets.
FAQ
What Do Long Wicks Mean in Trading?
Long wicks indicate a potential rejection of a given price level. A long upper wick suggests selling pressure after a price hike, while a long lower wick indicates buying support following a drop.
How May Traders Read Candle Wicks?
To read candle wicks, traders examine their length and direction. A long wick signals rejection of prices, especially if it occurs at a support or resistance area. Upper wicks denote selling pressure; lower wicks point to buying interest.
How May Traders Trade Candle Wicks?
Trading candle wicks involves analysing long wicks for potential market reversals. Traders often look for wicks at support or resistance levels as signals to enter or exit trades, using them alongside other indicators for confirmation.
What Is the Candle Wick Trading Strategy?
The candle wick trading strategy utilises the presence of long wicks as indicators for making trading decisions. This approach relies on the idea that wicks signify price rejections and potential shifts in market direction, aiding in identifying entry and exit points.
What Does a Long Upper Wick Indicate?
A long upper wick indicates that buyers pushed price higher during the period but sellers reclaimed control before the close. It typically reflects rejection of higher prices. Near resistance or after an extended rally, it may suggest weakening demand and the potential for a reversal or pause in the trend.
Can Wick Analysis Be Used in Forex Trading?
Yes. Wick analysis is widely applied across forex pairs, particularly at session highs and lows, round-number levels, and major support and resistance zones. Forex traders often combine wick reads with broader price action and risk management rather than treating any single candle as a standalone signal.
What Timeframe Is Commonly Used for Wick Analysis?
Wick analysis works across timeframes, though the read changes with each one. Day traders often watch 5-minute and 15-minute charts, swing traders favour the 1-hour and 4-hour timeframes, and position traders typically focus on daily and weekly candles. Higher timeframes generally produce wicks that carry more weight.
Are Wick Signals Reliable During News Events?
Wick signals during major news events may be weak. Sharp volatility, widened spreads, and algorithmic reactions can produce dramatic wicks that revert quickly. Many traders avoid acting on wicks formed inside news windows and wait for the market to settle before reassessing the technical picture.
This article represents the opinion of the Companies operating under the FXOpen brand only. It is not to be construed as an offer, solicitation, or recommendation with respect to products and services provided by the Companies operating under the FXOpen brand, nor is it to be considered financial advice.


Toss Bank has signed a memorandum of understanding with the Solana Foundation to test blockchain-based global remittance and settlement infrastructure.
Summary
- Toss Bank will test Solana-based remittance and settlement infrastructure before broader digital asset reviews begin.
- The partnership arrives as South Korea prepares new rules for virtual asset transfer services nationwide.
- Crypto.news reported similar stablecoin remittance tests by KB Financial, Western Union and SBI Remit recently.
The agreement was signed in Seoul on June 19 and disclosed on June 22, according to Digital Today.
The bank called the deal the first direct one-to-one strategic partnership between a South Korean internet-only bank and the Solana Foundation. The two sides will study how the Solana network can support overseas transfers, payments and later digital asset services.
Remittance test leads cooperation
The first area of work will be a proof of concept for global remittances and settlement. Toss Bank plans to test whether stablecoins can make overseas transfers faster and easier while keeping the service close to existing banking flows.
Toss Bank said the cooperation covers a joint review of blockchain-based payment and settlement models. It will also assess future financial services linked to stablecoins, digital assets and tokenized assets. Park Jin-hyeon, head of strategy at Toss Bank, said the deal was a “starting point” for applying blockchain-based financial infrastructure to services the bank already runs.
South Korea rules shape timing
The timing links the Toss Bank plan to South Korea’s changing digital asset rules. As crypto.news recently reported, South Korea is considering whether fintech firms should join a new licensing regime for cross-border virtual asset transfers due to take effect in December.
That policy shift may matter for banks and fintech firms testing blockchain remittances. Approved firms could offer blockchain-based overseas transfers and foreign exchange services under formal oversight. Toss Bank said it will review its plans while responding to domestic moves to legislate stablecoin-related rules.
Stablecoin pilots move into banking
The Toss Bank deal follows other bank-linked stablecoin tests in Asia. As crypto.news earlier reported, KB Financial tested won stablecoin issuance, offline QR payments, merchant settlement and Vietnam remittances. The Vietnam transfer finished in under three minutes and cut fees by about 87%, according to that report.
Meanwhile, stablecoin remittance trials are also expanding beyond Korea. As previously reported by crypto.news, Japan’s SBI Remit partnered with Fasset to build cross-border stablecoin infrastructure for remittances, payments and settlements across international markets.
Toss has already shown interest in blockchain beyond remittances. Crypto.news reported in April that the broader Toss group had been weighing a custom Layer 1 or Layer 2 blockchain and a native token for its “Money 3.0” stablecoin strategy. The Solana MOU gives Toss Bank a separate path to test public blockchain infrastructure before any broader rollout.
Solana gains payment use case
For Solana, the partnership adds another financial institution to its payments and stablecoin work. As crypto.news reported in May, Western Union launched USDPT on Solana, using the network for a regulated payment stablecoin tied to settlement and future customer services.
Lily Liu, chair of the Solana Foundation, said the partnership could help create a “new standard” for faster and smoother global remittances by combining bank trust with blockchain efficiency. The statement places the project inside a broader market shift toward stablecoin settlement, where banks, payment firms and fintech companies are testing faster cross-border rails.
The MOU does not mean Toss Bank has launched a live stablecoin remittance service. It starts with testing and feasibility reviews. The main questions now are whether the proof of concept can meet Korean regulatory standards, reduce transfer friction and fit into Toss Bank’s existing financial services. No public launch date has been announced yet.

Bitcoin started the week drifting near $64,000, sitting out a rally in Asian equities as the US and Iran moved closer to a lasting peace deal.
The token traded around $63,996 on Monday, down 0.4% over 24 hours and 2.2% on the week, per CoinDesk data. The rest of the market was mixed. Solana rose 3.7% on the week to $74 and tron added 2.2%, while ether held roughly flat at $1,733. The losses ran deeper down the board, with BNB off 4.2% on the week, XRP down 4.3% to $1.13 and dogecoin the weakest major, off 6.5%. Hyperliquid’s HYPE, the standout of early June, fell 5% on the day and has cooled to a 1.9% weekly gain.
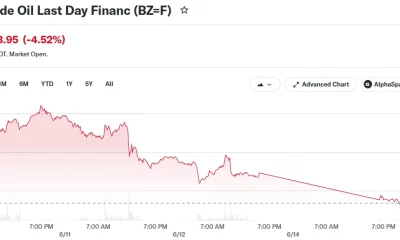
The macro backdrop turned friendlier without pulling crypto along. The US and Iran agreed on a roadmap toward a final peace deal within 60 days, and Brent crude slid 1.7% to about $79 a barrel.
An MSCI gauge of Asian stocks rose 0.6%, led by a technology rally tied to continued optimism over artificial intelligence, while US futures were softer, with S&P 500 contracts down 0.5%.


The first session of high-level US-Iran talks concluded in Switzerland on Monday. Mediators from Qatar and Pakistan confirmed a roadmap toward a final deal within 60 days under the framework of the Islamabad Memorandum of Understanding.
The joint statement confirmed the creation of a High-Level Committee providing political oversight, with chief negotiators leading dedicated working groups on nuclear issues, sanctions, and dispute resolution.
The parties also formed a communication line to prevent incidents and ensure safe commercial passage through the Strait of Hormuz. A de-confliction cell involving the US, Iran, and Lebanon will enforce the termination of military operations there. Technical talks continue through the remainder of the week at Burgenstock.
What to Expect When Markets Open
The statement resolves the sharpest fear heading into Monday’s session. A reported Iranian walkout on Sunday had raised Black Monday fears across oil and crypto, keeping traders on edge into the open.
Oil is the most direct read. The Strait of Hormuz communication line, confirmed explicitly in the joint statement, is the detail markets will price most aggressively. When the original June 14 memorandum was announced, oil fell over 12% and the Dow Jones hit a record high. A credible, institutionalized Hormuz mechanism could extend that oil price relief.
Equities should follow, with lower energy costs easing inflation expectations and improving the earnings outlook. That same macro channel feeds crypto. Bitcoin has tracked risk sentiment tightly throughout the conflict, rising on de-escalation and selling off on fresh strikes, with BTC holding near $64,200 ahead of Monday.
The ceiling on any rally remains the Federal Reserve. The Fed’s hawkish hold on June 17 erased post-MoU gains across stocks and crypto. The Lebanon de-confliction cell is the geopolitical tripwire to watch, Iran’s Foreign Minister Abbas Araghchi called it the “first real test” of the agreement, and any renewed fighting there is the fastest path back to risk-off across all asset classes.
The post US-Iran Agree on 60-Day Deal Roadmap: Markets Open Monday appeared first on BeInCrypto.


Cardano founder Charles Hoskinson has defended recent AI content tests after users criticized an AI-generated post shared through Input Output’s X account.
Summary
- Hoskinson said AI agents could help Cardano scale updates, community tasks and Midnight City activity.
- Midnight City uses autonomous agents to test privacy views for users, auditors and regulators alike.
- The debate followed backlash over AI-generated influencer content shared through Input Output’s X account recently.
The discussion followed his June 20 post titled “AI Slop, IOG X, and the Future of Marketing,” where he addressed how the team is testing new tools for communication.
Hoskinson said the AI-generated influencer came from work around Midnight City and was shared in good faith. He said the goal was to show what new systems can do, not to replace people or mislead the community. The response showed that parts of the Cardano audience remain careful about synthetic media.
Midnight City becomes test ground for agents
Midnight City is an interactive simulation tied to the Midnight Network. It uses autonomous AI agents that work, trade and create economic activity inside a digital city. The project lets users watch activity through different views, including public, auditor and regulatory lenses.
The platform also serves as a testing area for privacy tools. Midnight Network uses zero-knowledge technology and selective disclosure to protect data while still allowing approved parties to see needed information. This design supports the project’s wider pitch around private but compliant blockchain activity.
Marketing plans move toward AI agents
Hoskinson said Cardano and Midnight cannot rely only on human teams if the user base grows by millions.
“We’re going to need agents and AI to be able to organize and sort all that out and broadcast on a regular basis what’s going on in Midnight City,” he said.
He also linked the discussion to OpenClaw, an open-source AI agent platform. Hoskinson described AI agents as tools that could support community management, media updates and broadcasting. He said the team is watching “where the future is going with AI CMOs” and lifelike content systems.
Cardano context and next steps
The comments come as Midnight remains one of the main projects connected to Cardano’s next phase. Crypto.news earlier reported that Midnight launched its federated mainnet on March 31, 2026, with a privacy model built around programmable disclosure. The network also uses NIGHT for governance and DUST for transaction costs.
Cardano has faced a harder market backdrop in recent weeks. As previously reported by crypto.news, ADA fell below $0.20 earlier this month, hitting its lowest level in more than five years.
Meanwhile, at press time, the token traded at $0.16, indicating over 2% decline in the past 24 hours (per crypto.news market data). That price pressure has kept attention on whether Midnight can bring more builders, users and activity to the ecosystem.
Hoskinson said the team will keep testing AI standards as Midnight City grows. “It’s why it’s one of our most important projects,” he said, adding that the team plans to explore where the technology goes next. He also said agentic trading and affiliate relationships could help bring more users to Midnight.
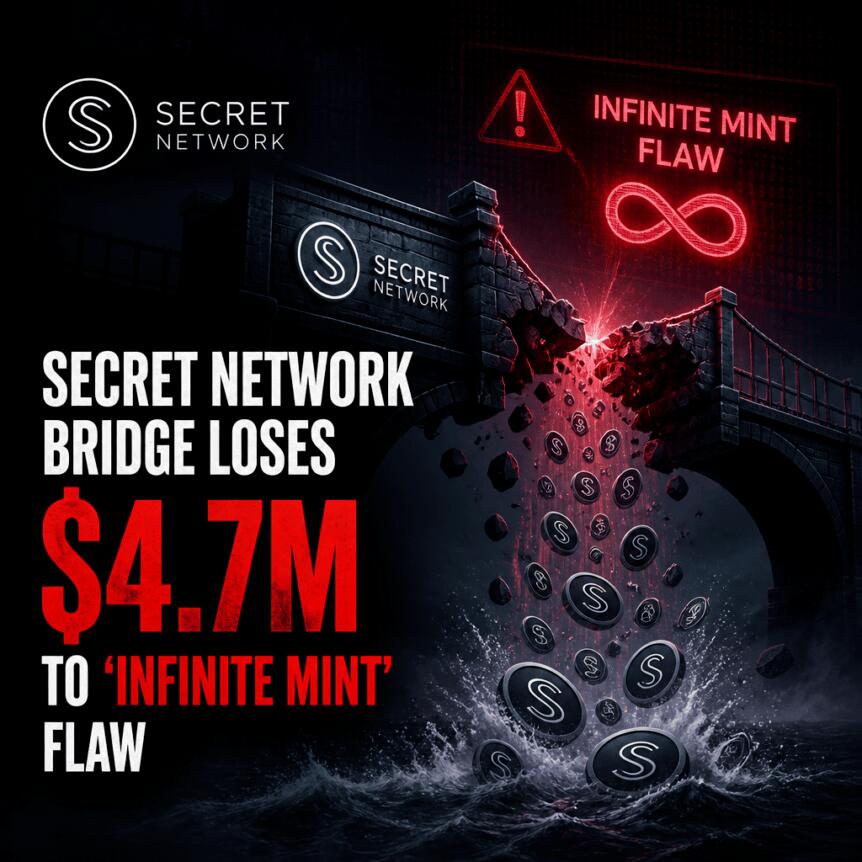
An attacker exploited an “infinite mint” vulnerability in a smart contract on the Secret Network, creating wrapped Axelar assets without proper backing. The incident resulted in a reported $4.67 million loss, according to blockchain research firm Common Prefix.
The breach occurred on June 10 but was identified a week later, on June 17, after a failed cross-chain transaction triggered an “insufficient funds” error tied to the drained account, Common Prefix said in a report released Friday. The funds were then routed to Ethereum and distributed across multiple wallets before being moved to exchanges, the firm added.
Key takeaways
- Common Prefix attributes the $4.67 million exploit to an infinite-mint flaw in a Secret Network contract that minted unbacked Axelar-wrapped tokens.
- The issue was traced to missing verification of the source of inbound transfers before minting, allowing forged deposits on an attacker-controlled channel.
- Wrapped assets affected included saUSDT, saUSDC, saDAI, saWETH, saWBTC, saWBNB and sawstETH.
- Secret Network said holders of Axelar-bridged saXXX tokens may face loss, while both Secret and Axelar emphasized that Secret’s token SCRT and Axelar’s infrastructure were not directly compromised.
How the exploit worked on Secret’s Axelar bridge
Secret Network is a privacy-focused layer-1 blockchain built on the Cosmos ecosystem. Axelar, meanwhile, is designed to enable interoperability between different blockchain networks. The exploit targeted a smart contract handling Axelar-wrapped assets on Secret, where wrapped “saTokens” are expected to represent collateral held in escrow.
Common Prefix reported that the contract failed to verify the provenance of inbound transfers before minting. As a result, the attacker could “forge” deposits over an attacker-controlled channel, triggering the minting of “genuine saTokens with no assets backing them,” the firm said.
After minting, the attacker redeemed the Axelar-wrapped assets back through legitimate channels. Common Prefix said the redemption drained the real Axelar-wrapped assets held in escrow, converting the unbacked representations into backed value.
Timeline and discovery: from June 10 to June 17
While the exploit itself took place on June 10, the crucial indicator of trouble appeared later. Common Prefix said the breach was discovered on June 17 after a cross-chain transaction failed due to an “insufficient funds” error connected to the account that had been drained.
This delay matters for users because it highlights how bridge or escrow-related systems can continue operating normally—or at least not immediately signal obvious failures—until specific downstream actions surface the shortfall. In practice, that can mean the window between minting and detection may be long enough for assets to be redistributed before investigators fully connect the dots.
Where the stolen funds went
Common Prefix reported that after exploiting the wrapped tokens, the attacker moved the assets to the Ethereum blockchain and converted them to Ether (ETH). The firm also said the attacker split the proceeds among roughly 30 wallets.
Those wallets were then used to move funds into exchanges, including KuCoin, ChangeNow, and HitBTC, according to the report. The multi-wallet approach is a common tactic in laundering activity, aimed at complicating tracing by breaking up transaction flows and distribution patterns.
Which tokens were affected—and what Secret said to users
The affected Axelar-wrapped assets minted without backing included saUSDT, saUSDC, saDAI, saWETH, saWBTC, saWBNB and sawstETH. Common Prefix emphasized that the backing of these tokens was compromised, meaning token holders may not be able to redeem them for their intended collateral.
On Saturday, Secret Network issued a security notice stating that holders of Axelar-bridged saXXX tokens on Secret should expect their backing to be affected and that their funds “may be lost.”
Secret’s own native token, Secret (SCRT), was not reported as impacted by the incident. However, the notice underscores that this was not a general compromise of the network itself, but a targeted weakness in the minting path for specific bridged assets.
Axelar’s response: not compromised, firewall contained impact
Axelar acknowledged the incident on Saturday after “some confusion” emerged around the breach. In its statement, Axelar said neither Axelar nor IBC (Inter-Blockchain Communication) was compromised.
Axelar added that the exploited token smart contract “was not developed, deployed, or maintained by Axelar,” and that Axelar’s firewalling prevented the impact from spreading to other chains.
For investors and builders, the distinction is significant: it narrows the likely source of failure to the contract logic on the Secret side rather than Axelar’s core interoperability infrastructure. Even so, cross-chain systems remain tightly coupled through assumptions about escrow, message integrity, and minting verification—exactly where this exploit appears to have broken those assumptions.
Part of a wider wave of protocol attacks
This breach arrives amid a broader pattern of cross-chain and protocol exploitation. Common Prefix noted it is among a series of hacks and exploits occurring this month, with at least 22 incidents reported by DeFiLlama’s ongoing hack tracking.
Within that same recent period, other reported bridge-related losses included Humanity Protocol and Syscoin Bridge, which earlier this month suffered reported losses of $32 million and $8 million respectively, according to coverage referenced in Common Prefix’s context.
While each event has its own root cause, the recurring theme is similar: many of the highest-value failures occur where bridging logic meets asset accounting—especially when systems mint representations based on messages or deposits that are not strongly authenticated end-to-end.
Going forward, users holding affected saTokens should watch for further announcements from Secret and for any guidance on whether and how remaining balances can be redeemed. The key open question is how quickly and completely the affected minting pathway can be audited and patched—because in cross-chain ecosystems, even small verification gaps can translate into real, backed-value drains once an attacker finds a redemption route.

An attacker has used an “infinite mint” bug in a vulnerable smart contract on the Secret Network to create unbacked, wrapped versions of Axelar-wrapped assets, resulting in a $4.67 million exploit.
The exploit happened on June 10 but was discovered a week later on June 17, after a failed cross-chain transaction caused by an “insufficient funds” error in the drained account was detected, blockchain research firm Common Prefix reported on Friday.
The attacker redeemed the Axelar-wrapped assets (saTokens) back over legitimate channels to drain the real Axelar-wrapped assets held in escrow because the smart contract did not verify the source of the inbound transfer before minting, so “deposits forged over an attacker-controlled channel minted genuine saTokens with no assets backing them,” Common Prefix said.
It is the latest in a series of crypto protocol hacks and exploits this month, which now number at least 22, according to DeFiLlama. The Secret Network was one of the largest, behind the Humanity Protocol and Syscoin Bridge, which lost $32 million and $8 million, respectively, earlier this month.
The Secret Network is a privacy-focused, layer-1 blockchain built on the Cosmos ecosystem, and Axelar is a decentralized interoperability network that connects different blockchain ecosystems.
The Axelar-wrapped assets minted without backing in the exploit included saUSDT, saUSDC, saDAI, saWETH, saWBTC, saWBNB and sawstETH.
Related: Aztec Connect’s abandoned smart contract exploited for $2.1M
The attacker moved the exploited assets to the Ethereum blockchain and converted them to Ether (ETH). They then split the haul between around 30 wallets, eventually depositing the funds into exchanges including KuCoin, ChangeNow, and HitBTC, according to Common Prefix.
“If you hold Axelar-bridged saXXX tokens on Secret, please be aware their backing was affected, and your funds may be lost,” the Secret Network said on Saturday.
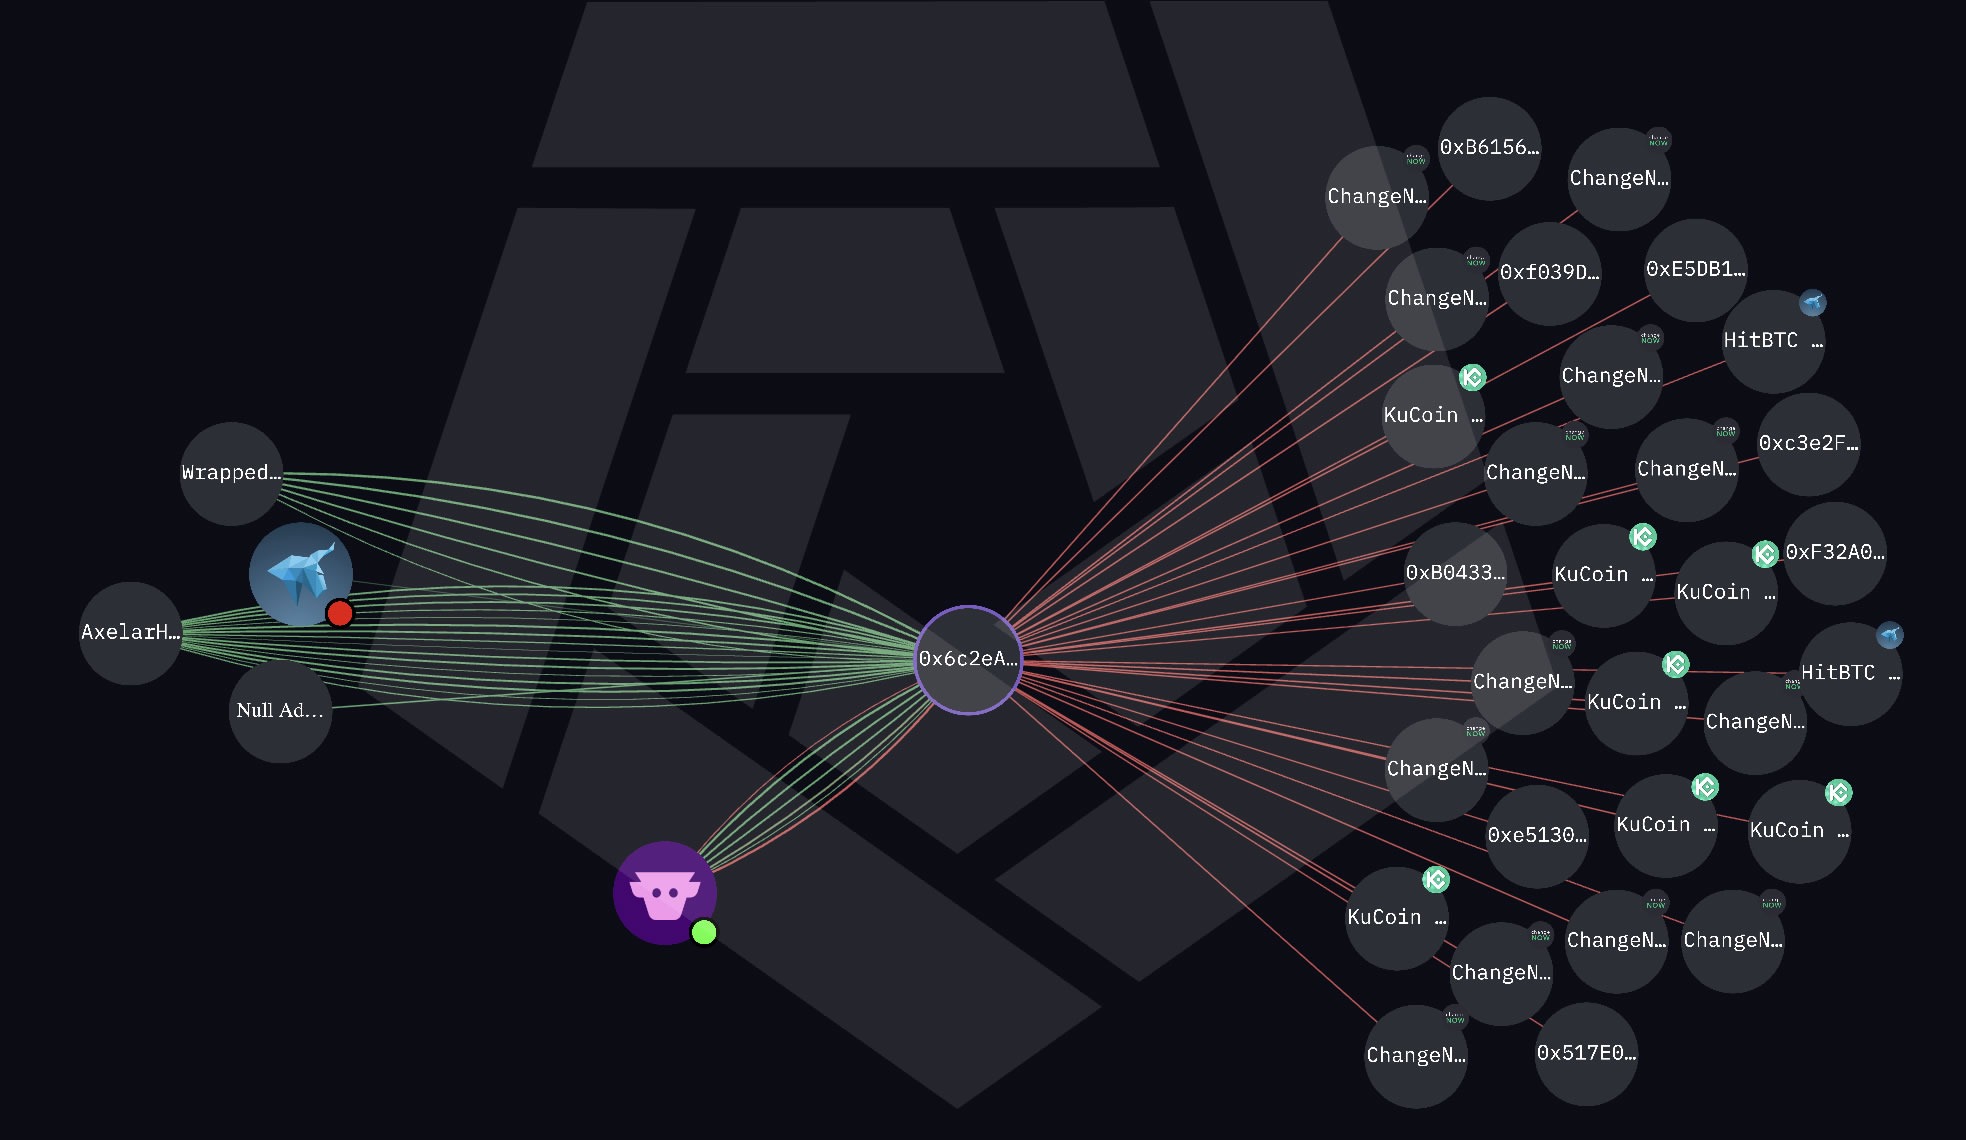
Stolen funds split into multiple wallets for obfuscation. Source: Common Prefix
The Secret Network’s token, Secret (SCRT), was not impacted by the incident, but it remains down 99% from its 2021 all-time high, currently trading at $0.058. Axelar’s native token, Axelar (AXL), is in a similar state, trading at $0.045, down 98% from its 2024 peak.
Axelar posted a confirmation on Saturday following “some confusion” around the incident.
“Neither Axelar nor IBC [Inter-Blockchain Communication] was compromised. The exploited token smart contract was not developed, deployed, or maintained by Axelar. Axelar’s firewalling prevented the impact from spreading to other chains,” it said.
Magazine: Bitcoin decouples from tech stocks, Ether eyes ‘selling wave’: Market Moves


Senator Cynthia Lummis wrote on X: developers should not need lawyers to know if their code is legal. The CLARITY Act, she argues, is the fix.
The Digital Asset Market Clarity Act has recently cleared two major legislative hurdles, passing the House in July 2025 with a 294-134 bipartisan vote before the Senate Banking Committee advanced it 15-9 in May 2026. The bill now sits on the Senate Legislative Calendar awaiting a floor vote.
When Writing Code Became a Federal Risk
The case that brought this debate into focus is that of Roman Storm, a co-founder of Tornado Cash, an open-source privacy protocol built on Ethereum (ETH).
On August 6, 2025, following a four-week trial, a jury found Storm guilty of conspiracy to operate an unlicensed money transmitting business. The jury was deadlocked and unable to reach a verdict on the two more serious charges: conspiracy to commit money laundering and conspiracy to violate sanctions.
The charge carries a maximum sentence of five years in prison.
The conviction turned on a contested legal question that the CLARITY Act is aiming to address. Tornado Cash provides an open-source protocol that breaks the link between senders and recipients of cryptocurrency in order to enhance privacy. Once deployed, neither the platform itself nor its creators ever took custody of the assets at issue.
Storm’s defense argued that holding a developer liable for what independent users do with self-executing code sets a dangerous precedent. The case asked whether writing and deploying open-source privacy software can expose its creator to criminal liability for how others use it, and after the verdict, that question remains only partially resolved.
The Tornado Cash case was not isolated. The SEC issued a Wells Notice to Uniswap Labs in 2024, alleging the primary developer of the world’s largest decentralized exchange protocol was operating an unregistered broker-dealer.
The Commodity Futures Trading Commission (CFTC) separately pursued the Ooki DAO developers, arguing that participating in open-source governance made individual contributors personally liable for how end-users interacted with the platform.
What the CLARITY Act Changes for Developers
The CLARITY Act addresses this directly through Section 604, drawn from the Blockchain Regulatory Certainty Act (BRCA). The provision codifies a principle from FinCEN’s 2019 guidance: that developers and infrastructure providers who do not take custody or control of user funds are not money transmitters under federal law.
Writing open-source software, running a node, or validating transactions would not trigger Bank Secrecy Act obligations.
More than 60 CEOs and founders across the industry, including executives from Coinbase, Uniswap, Kraken, a16z crypto, and Paradigm, signed a letter to Senate leadership in June calling on the full Senate to pass the bill with the developer protections intact, describing Section 604 as a non-negotiable condition of their support.
The post Lummis Says CLARITY Act Will End Crypto Developer Prosecution for Writing Code appeared first on BeInCrypto.
Taiko lost roughly $1.7 million on Monday after an attacker compromised the chain-state verification mechanism.
The latest hack adds to the growing list of attacks targeting crypto networks in 2026.
Taiko Becomes Latest of 20-Plus Crypto Hacks This June
Taiko runs as an Ethereum-equivalent-based rollup that settles its activity back to the mainnet. Earlier today, Blockaid flagged an ongoing exploit in a post on X (formerly Twitter).
Taiko confirmed the compromise in a security notice and warned that bridge security assumptions could no longer be trusted.
Follow us on X to get the latest news as it happens
Meanwhile, on-chain data shared by Lookonchain shows the attacker has already started cashing out. The wallet moved 1.99 million TAIKO, worth about $189,000, to MEXC. The same address still holds 870.8 ETH valued at nearly $1.52 million.
Taiko said it is working with its Security Council and ecosystem partners to contain the incident. In addition, Taiko signaled that it may take technical and legal action against the attacker.
The team has asked centralized exchanges to suspend TAIKO deposits until it issues an official all-clear.
“We strongly advise all users to withdraw their funds from all bridges deployed on Taiko immediately,” the team said.
Meanwhile, it also shared 4 attacker addresses:
- 0x7506DeA0c38ca0B55364B22424374c5A1ae1B76a
- 0x5fbc60a12bc6635e7d587d8dac52e4b1388b4990
- 0x3cc936b795a188f0e246cbb2d74c5bd190aecf18
- 0x9108828e30f2de407aadb0af677b4a9228e4acd4
Historically, bridges have ranked among crypto’s costliest weak points, and 2026 has been no exception. A tracker from DefiLlama counts more than 20 crypto hacks in June alone.
The published addresses of attackers give investigators a trail to follow as funds move. Whether Taiko can recover the stolen assets may hinge on how fast exchanges freeze the flagged wallets.
Subscribe to our YouTube channel to watch leaders and journalists provide expert insights
The post Taiko Exploit Adds to June Tally of Over 20 Crypto Hacks appeared first on BeInCrypto.
Global markets are entering the week of June 22 with a clearer pecking order of risk. The Strait of Hormuz and Trump’s war is no longer the dominant driver; the Federal Reserve is.
After months of whipsaw headlines from the US-Iran conflict, traders have largely stopped flinching at each new diplomatic twist. The bigger force repricing oil, gold, stocks, and Bitcoin (BTC) is Fed Chair Kevin Warsh’s hawkish debut at the June 17 FOMC meeting.
Oil Deflates as War Premium Fades
Brent crude settled around $80 on Friday, June 19, after US-Iran talks were abruptly called off, yet the reaction was muted. WTI traded near $76, down roughly 34% from conflict highs.
Three Saudi supertankers carrying roughly six million barrels transited the strait last week. Tanker owners report cautious but growing confidence in the waterway. The war premium that once consumed markets is unwinding, even without a signed peace deal.
Warsh Reframes Gold and Stocks
Gold fell to around $4,150 per ounce on Friday, as the dollar climbed to a one-year high. The driver was not geopolitics but the Warsh hawkish FOMC shift, where nine of 18 officials now project at least one rate hike in 2026.
Goldman Sachs cut its year-end gold target to $4,900 from $5,400. US equities held up better, with the S&P 500 recovering from Fed-day losses, closing its 11th winning week in 12.

Bitcoin Caught Between Two Headwinds
BTC trades near $64,000, holding above recent lows but unable to build meaningful momentum. As BeInCrypto reported, Warsh’s press conference sent Bitcoin lower alongside gold, with rate hike odds now at 66% squeezing liquidity expectations that had supported risk assets earlier in the year.
Bitcoin is trading nearly 50% below its October 2025 all-time high of $126,198. The week ahead brings US GDP and PCE data, two readings that will either reinforce Warsh’s hawkish lean or give Bitcoin price a brief reprieve.
The post Fed Hawkishness Displaces Hormuz Noise as the Dominant Market Risk appeared first on BeInCrypto.
Three catalysts are converging this week that could shift sentiment across equities, chips, and the inflation outlook. FedEx earnings, Micron’s fiscal Q3 results, and the May Personal Consumption Expenditures price index are all due in the coming days.
The combination arrives at a tense moment for markets still digesting the Iran war’s economic fallout and reassessing when the Federal Reserve might next move on interest rates.
FedEx Breaks New Ground Tuesday
FedEx (FDX) reports fiscal fourth-quarter results Tuesday, June 23. The print marks the company’s first as a pure-play logistics and parcel firm following the June 1 spinoff of FedEx Freight.
A calendar shift to a December fiscal year adds another layer of complexity, making year-over-year comparisons difficult. Analysts expect revenue for the quarter to reach $24.04 billion, up 8.8% from a year earlier, while full-year earnings per share are projected at $19.78, up 8.7% from fiscal 2025.
Micron Carries the AI Trade Wednesday
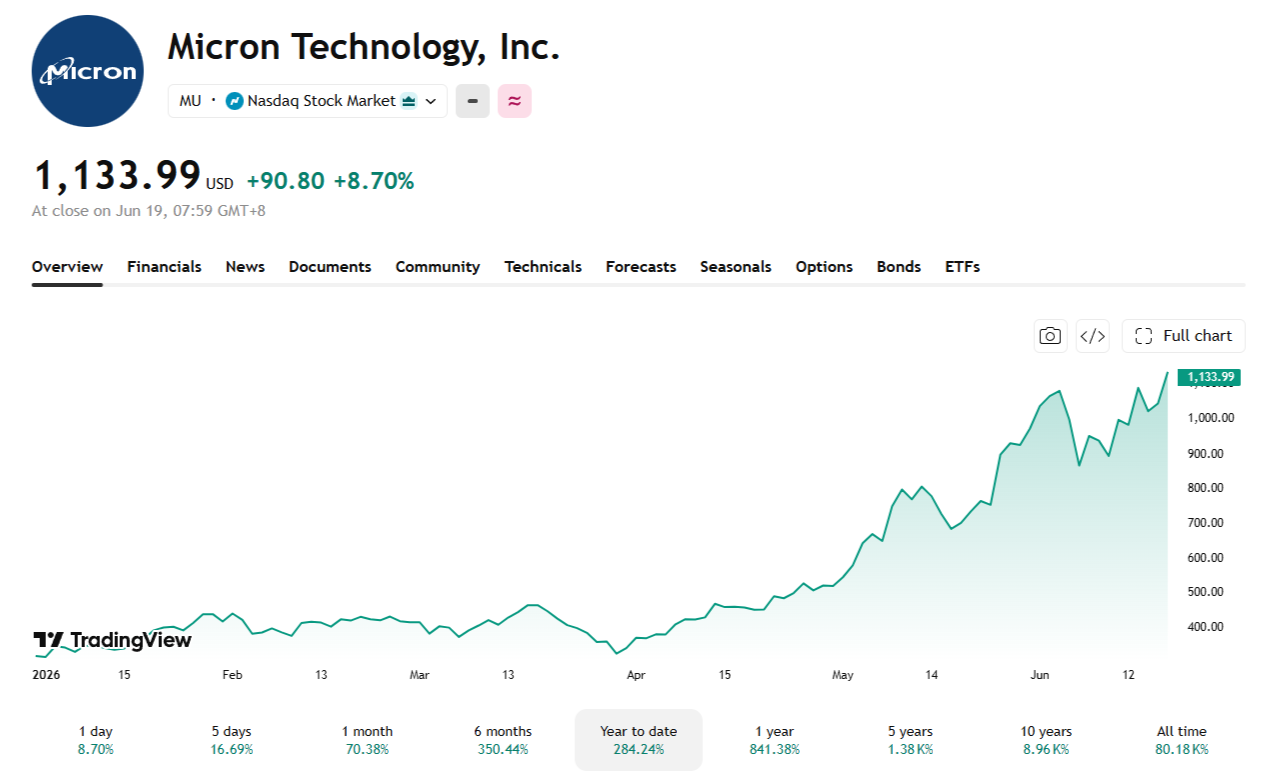
Micron Technology (MU) reports fiscal Q3 results Wednesday, June 24. After a roughly 280% gain in 2026 built almost entirely on the high-bandwidth memory that feeds AI accelerators, the print is the single clearest test of whether that boom is a durable, structural shift or another memory cycle that has run ahead of itself.

Analysts at Deutsche Bank and TD Cowen both raised price targets to $1,500 ahead of the Micron earnings results, citing AI demand outrunning supply through 2028. Key customers remain able to secure only between 50% and two-thirds of their bit demand requirements, with no expectation of supply catching up in the near term.
PCE Data Thursday Tests the Oil Relief Narrative
The Federal Reserve’s preferred inflation gauge, the PCE price index for May, drops Thursday, June 25. Research from the Federal Reserve Bank of Dallas estimates the Iran war pushed headline PCE inflation up 1.7 percentage points at an annualized rate in the first quarter of 2026, with effects expected to remain elevated through the third quarter.
However, WTI crude settling near $76 a barrel last week, down sharply from above $90 throughout May, could provide meaningful relief in the months ahead. Whether the chipflation risk from rising AI memory costs offsets some of that energy-driven easing remains an open question heading into the data.
The post FedEx, Micron Earnings and PCE Data Set to Shape Markets This Week appeared first on BeInCrypto.

Adam Blumenthal skips Perth trip as liquidators mull way forward

South Korea’s Toss Bank tests Solana rails for global payments

Jelly Roll’s Ex Bunnie Shows Him What He’s Missing In Crop Top


-
 Crypto World7 days ago
Crude Oil Plunges Over 4% as US-Iran Agreement Reopens Hormuz Strait
-

 Fashion2 days ago
Weekend Open Thread: Miami – Corporette.com
-
 Tech5 days ago
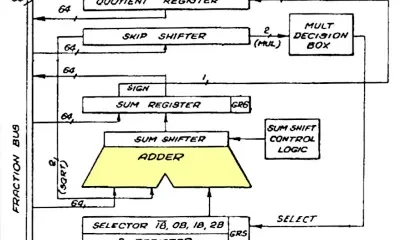
The Adder At The Heart Of Intel’s 8087 FPU
-
 Business2 days ago
Wall Street Week Ahead: Investors see Micron earnings as pulse check of AI rally momentum
-

 Crypto World2 days ago
HIVE shares jump as $220M AI deal speeds Bitcoin mining pivot
-

 Sports3 days ago
FIFA World Cup 2026: Canada beat 9-men Qatar 6-0 to register first ever win | FIFA World Cup 2026
-

 Business1 day ago
MHP SE 2026 Q1 – Results – Earnings Call Presentation (OTCMKTS:MHPSY) 2026-06-20
-

 Crypto World2 days ago
Jake Chervinsky accuses CME of protecting derivatives monopoly
-

 Business3 days ago
Brexit cost 6% of UK economy, Bank of England company data suggests
-

 Business1 day ago
Soccer-U.S. defends Iran World Cup travel restrictions, says discussions ongoing
-

 Crypto World4 days ago
Anthropic’s Dario Amodei Urged AI Unity at G7, Even as US Banned His Models
-

 Tech4 days ago
Weeks Of In-The-Field Testing And A Verdict
-
 Crypto World2 days ago
Can Charles Hoskinson Really Rescue Cardano?
-
 Tech4 days ago
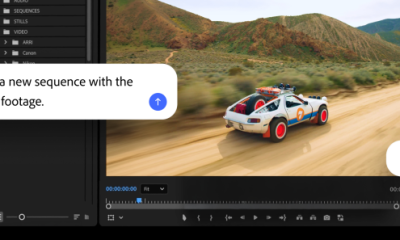
Adobe adds its AI assistant to Premiere, Illustrator and InDesign
-

 Entertainment1 day ago
Renter of Home in Anne Heche Crash Denies Settlement With Son
-

 Politics2 days ago
Andy Burnham and the meaning of Makerfield
-
 Crypto World4 days ago
Iren (IREN) Stock Surges on Jefferies Buy Rating: AI Infrastructure Play Gains Momentum
-

 Tech3 days ago
Instagram Now Lets You Add A Unique Caption To Each Carousel Slide
-

 Politics3 days ago
BBC Reporter Discusses Cross Party Criticism Of Trumps Iran Deal
-
 Crypto World4 days ago
Coinbase Stakes Out Brokerage Territory With SEC-Registered AI Advisor and Stock Options Push
You must be logged in to post a comment Login