
Crypto World
CME is letting traders bet on bitcoin volatility, not price, and two firms have already placed bets


CME’s bitcoin volatility index futures began trading last week, offering investors a new way to trade and hedge price volatility. DV Chain and Monarq Asset Management executed the first block trades, kicking off trading in the contracts.
These volatility contracts track the CME CF Bitcoin Volatility Index (BVX), which represents the market’s expectations for bitcoin volatility over four weeks. Their debut allows traders to take positions directly on expected price turbulence rather than just price direction.
That distinction matters because most derivatives, including futures, perpetual futures and options, require a view on where price is going. Volatility futures eliminate that complexity, letting traders express a view purely on how BTC will move in either direction.
That opens the door to a new set of hedging and portfolio strategies that were previously difficult to execute on regulated venues. Think of positioning for how much bitcoin might move around events like this week’s U.S. inflation data – traders can go long or short volatility depending on their outlook.
Shiliang Tang, CEO of Monarq, called the launch a positive step in broadening regulated volatility offerings.
“As bitcoin continues to mature into a more mainstream institutional asset class, the demand for sophisticated risk management instruments grows alongside it. Robust tools like CME Group Bitcoin Volatility futures are exactly what investors need to accurately express their market viewpoints and efficiently hedge their portfolios within a secure, transparent framework,” he said in the press announcement.
Monarq Asset Management is a institutional-focused quantitative and systematic digital asset investment firm managed by former executives from firms such as LedgerPrime, Tower Research, and BlockTower Capital. DV Chain is a liquidity and market-making service provider.
The launch of volatility futures expands CME’s existing product suite comprising bitcoin and ether standard and micro futures and options contracts. The platform’s crypto derivatives business has reached roughly 266,900 contracts year-to-date, up 38% year-on-year, while average daily open interest stands at roughly 274,500 contracts, up 18%.

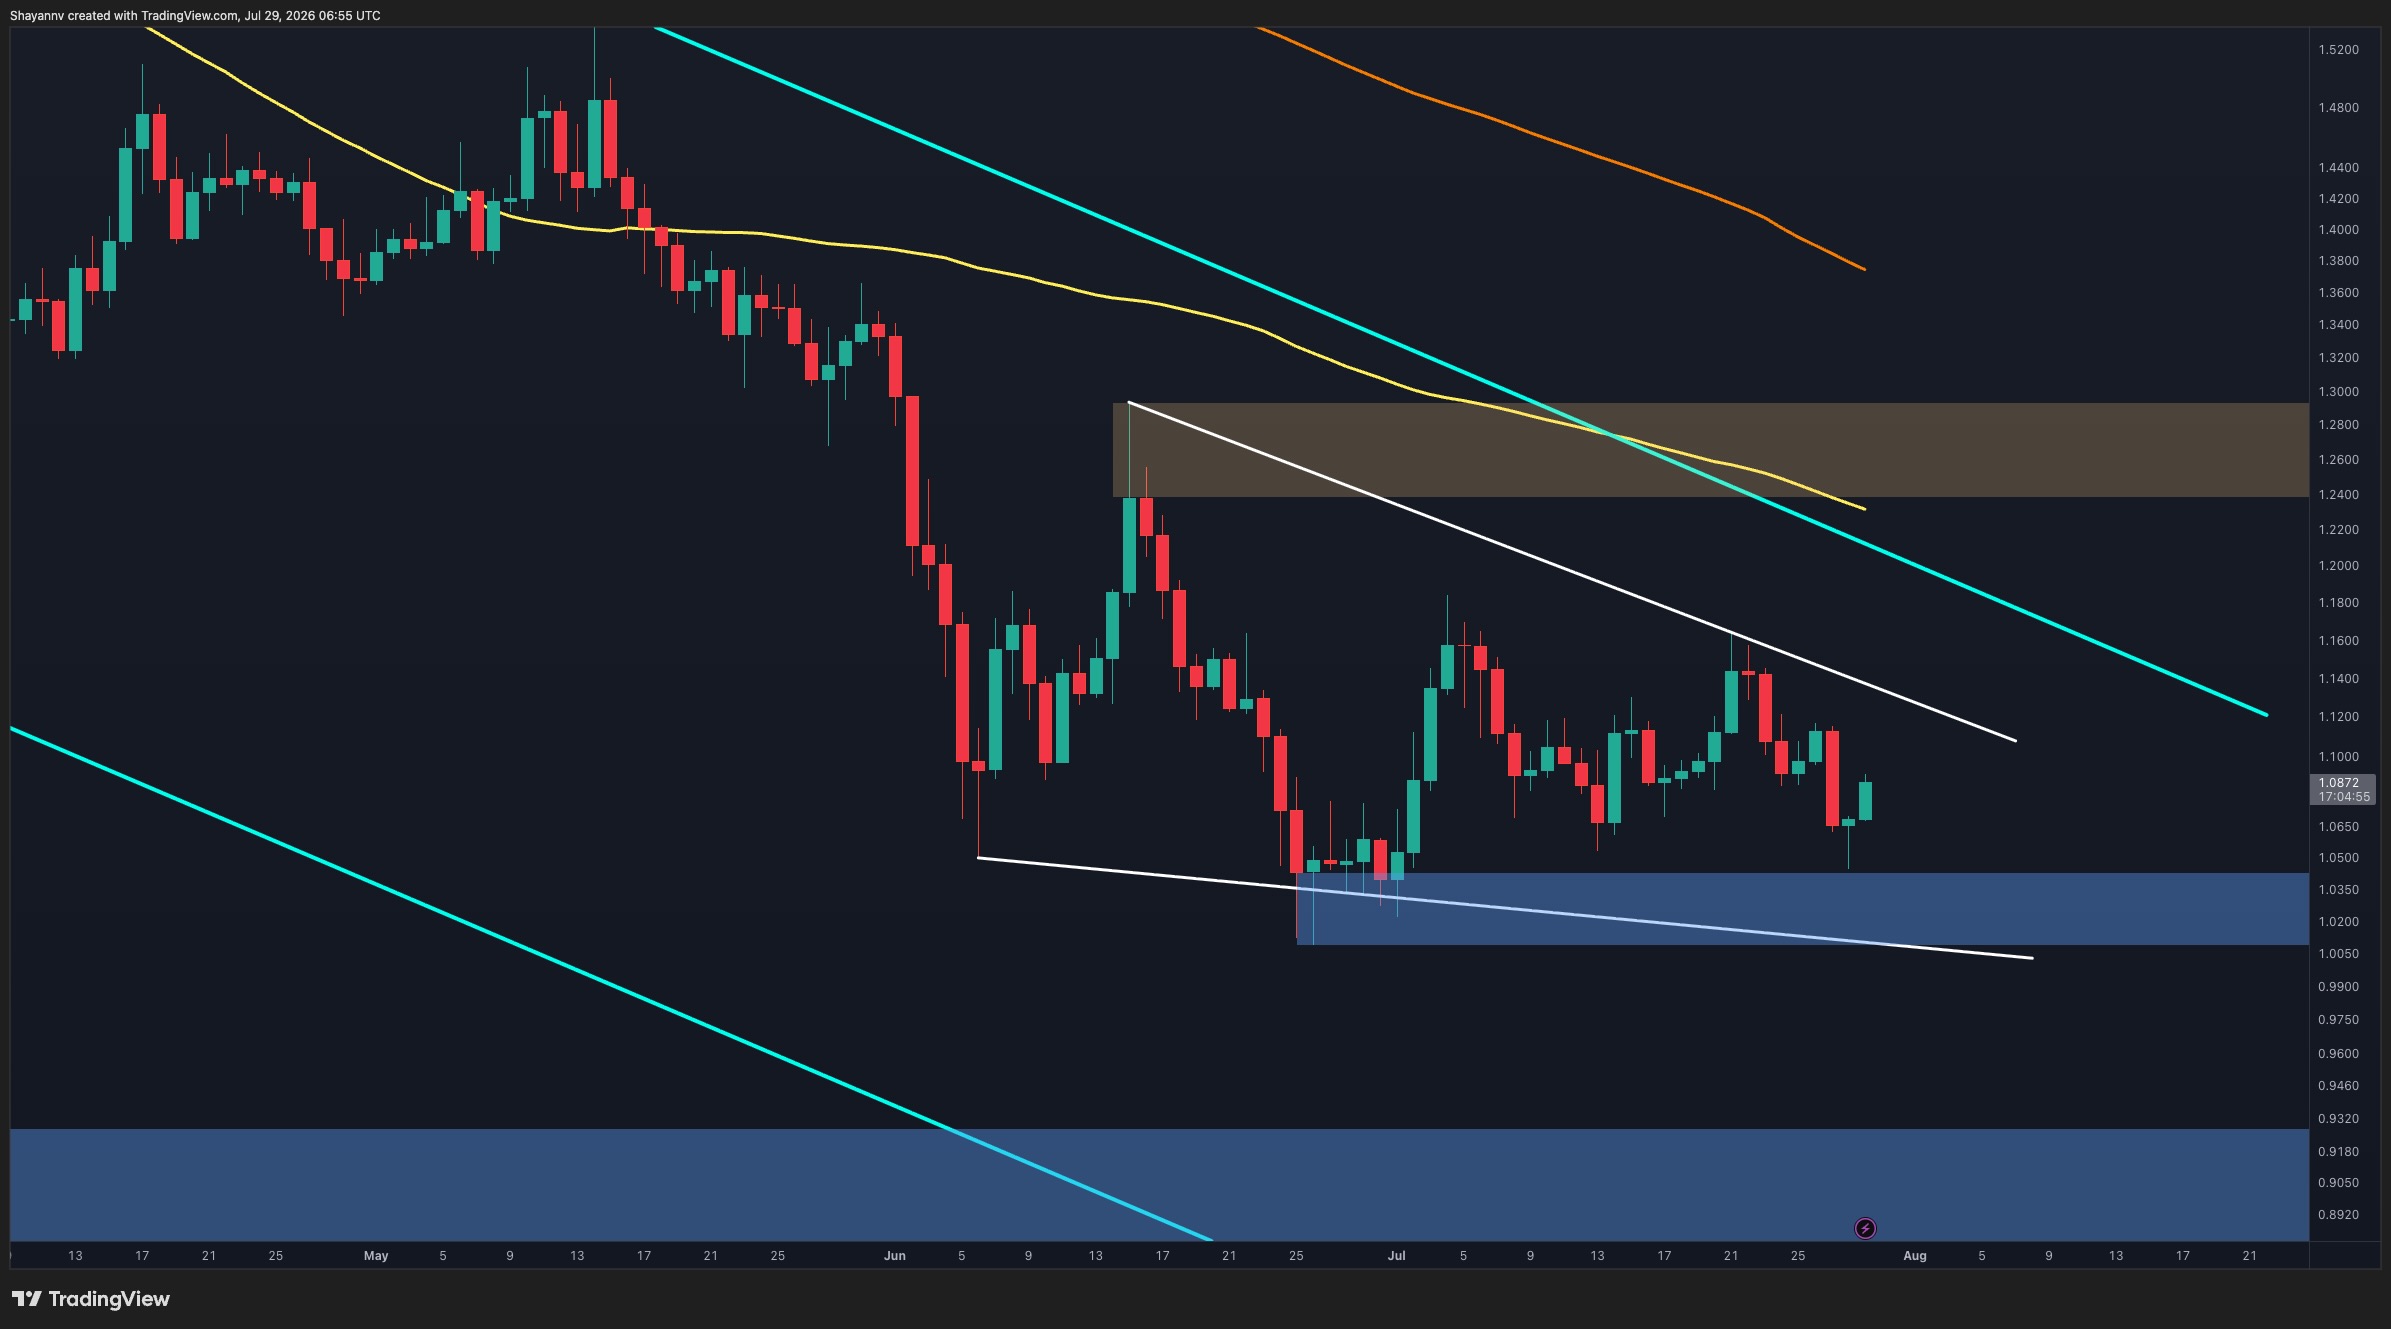
XRP has come under renewed selling pressure after failing to sustain its previous rebound, sending the price back toward a key support region. Although buyers have stepped in to defend the latest decline, the broader technical picture still favors caution as the asset trades below major resistance levels.
XRP Price Analysis: The Daily Chart
The daily chart continues to reflect a bearish market structure, with the cross-border token trading inside a long-term descending channel while remaining below both the 100-day and 200-day moving averages. The recent rejection from the upper portion of the range reinforces that sellers are still controlling the broader trend.
The $1.02 to $1.04 demand zone once again attracted buyers, triggering the latest rebound. However, the recovery remains vulnerable as long as the price stays beneath the descending trendline and the major resistance area around $1.24 to $1.28, where the moving averages also converge. A successful reclaim of this region would be the first meaningful sign that momentum is shifting in favor of the bulls.
On the downside, losing the $1.02 to $1.04 support would expose the broader demand zone around $0.89 and extend the prevailing bearish trend.
XRP/USDT 4-Hour Chart
The 4-hour timeframe highlights the recent breakdown below the yellow ascending trendline, confirming that buyers have lost short-term control after failing to defend the series of higher lows. That breakdown led to a sharp decline into the $1.02 to $1.04 demand zone, where buying interest quickly emerged.
The current rebound has pushed XRP back toward the $1.08 to $1.09 resistance area, which previously acted as support before the breakdown. This makes the current rally an important retest of former support turned resistance. As long as the price remains below this zone, the recent bounce could simply represent a corrective recovery within the broader downtrend.
A rejection from the current resistance would increase the probability of another move toward the $1.02 to $1.04 demand zone. Conversely, a decisive reclaim of the $1.08 to $1.09 region would improve the short-term outlook and open the door for a recovery toward the larger supply zone around $1.16 to $1.18.

The post Ripple Price Analysis: XRP Risks Falling Below $1 Unless It Breaks This Barrier appeared first on CryptoPotato.

But then, those mechanics—along with loads of elaborately fake-looking special effects, which now, rather than being dazzling, are just business as usual—are the hallmarks of all Marvel movies. It seems you can’t build one without them. You also can’t really explain the plot of Brand New Day without giving away the arrival of a surprise character, but here, roughly, is how it goes: Sad Peter Parker goes through the motions of being Spider-Man for four long years, as MJ and Ned study hard at MIT, the college the three of them were supposed to attend together. After graduation, MJ and Ned return to New York; Peter spies on them wistfully, and when he finally does get up the guts to talk to them, his face draws blank stares. He regularly leaves fresh flowers at Aunt May’s grave. The rest of his days are spent foiling workaday crimes, until some weird events shake the city: an unseen force capable of taking control of people’s bodies and brains has begun to wreak mayhem. Meanwhile, Spider-Man’s web-shooting capabilities have gone awry. His know-it-all AI assistant E.V.I.E. informs him that this is due to a massive increase in “arachnid hormones,” which is also causing him to be more aggressive. In other words, he’s angry and stressed out, and he has no idea how to handle his rage.
Although there was some uncertainty about the monetary direction the United States Federal Reserve will take following the July FOMC meeting, the central bank approved with a 9-3 vote to maintain the interest rates at 3.50% to 3.75%.
All eyes have turned to the incoming press conference by the new Fed Chair, Kevin Warsh, as investors anticipate which way he will lean.
“The Committee decided to maintain the target range for the federal funds rate at 3-1/2 to 3-3/4 percent, in support of the Federal Reserve’s dual mandate. The Committee is continuing its policy of maintaining ample reserves in the banking system,” reads the statement.
As reported earlier today, this meeting was described as the most unpredictable since the COVID-19 pandemic broke out in March 2020. The reason for this is that all meetings since then had a 99% agreement about the outcome ahead of their conclusion.
In contrast, futures markets and prediction platforms had assigned a 30%-38% probability for a rate hike for today’s meeting.
Investors apparently had de-risked from more volatile assets like bitcoin ahead of the event today, as the asset slumped by $3,000 yesterday. It rebounded to $64,500 today, where it was rejected and slipped to under $63,800 before the meeting.
Its minor volatility returned after the announcement, pumping above $64,000 as of now. However, it’s likely that the Warsh speech will impact it even more, especially if the new Fed chair hints at what the central bank will do next – a rate hike or another pause.
The post Bitcoin Volatility Returns After Fed Holds Interest Rates Steady appeared first on CryptoPotato.


Credit default swap (CDS) demand is surging throughout the AI industry. Five years of default protection on $10 million of Nvidia debt now costs about $82,000 a year — double since the start of July when it cost roughly $40,000.
CDS spreads are deteriorating rapidly across mega-cap AI stocks including Alphabet, Amazon, Meta, Broadcom, and SpaceX, which all hit record spreads this week.
Alphabet CDS contracts traded up to 67 basis points days after reporting its first negative quarterly free cash flow since its 2004 listing.
Investors refer to the “price” of a CDS by its basis point spread above the notional amount of debt it guarantees.
A basis point is one hundredth of a percentage point, and the higher they “spread” above the notional quantity of debt, the more investors have to pay as a de facto insurance premium.
Companies want their CDS contracts to be cheap. When basis points are low, investors aren’t bidding extra for the right to receive a payout in the event of a credit default. Low basis points on CDS contracts — or even better, no CDS demand at all — indicate confidence that the company will service its debt on-time and in full.
Insurance premium doubles to protect Nvidia credit
Unfortunately, Nvidia’s five-year CDS contracts reached a record 82 basis points on Monday.
Monday’s jump of roughly 14 basis points was the largest single-day move since those Nvidia CDS contracts began trading in November 2025, ICE Data Services reported.
The $330 billion AI company Oracle carries an even worse premium. Its five-year CDSs traded above 215 basis points this week, up from 145 at the end of last year.
S&P Global cut the company’s creditworthiness rating to BBB- earlier this month, the lowest rung of its investment grade band.
Oracle’s bonds that mature in 2056 and pay 6.7% interest widened eight basis points on Monday to 263 basis points over US Treasuries. Not good.
Even worse, CoreWeave topped 855 basis points on Tuesday. A popular CDS pricing model reads that as roughly a 50% chance of default within five years.
Disturbingly, the instruments themselves have become an unfortunate growth market for Wall Street.
CDS for AI stocks shouldn’t be a growth sector
AI companies and tech stocks accounted for nearly $650 million of second-quarter corporate CDS trading, DTCC data shows. That is up 20% on the first quarter and almost 600% year on year.
The spike in CDS spreads this week followed a Bloomberg report that Nvidia is preparing AI commitments potentially worth more than $750 billion.
Those include a partnership with SK Group valued above $500 billion and talks over a guarantee of as much as $250 billion to help OpenAI lease computing capacity.
Doubt about its ability to service that debt sent CDS rates higher.
Read more: South Korea’s KOSPI has erased more than Bitcoin’s market cap in 29 days
CDS trader Michael Burry posted, “There is a reason Nvidia’s five-year credit default swaps are going parabolic.”
The short-seller blamed circular spending, i.e. companies buying services from one another in order to manufacture higher revenue for fundraising purposes.
Credit ratings agency Moody’s has already warned that unprecedented AI spending threatens the credit quality of Microsoft, Amazon, Alphabet, Meta, Oracle and CoreWeave.
Direct debt across those six names is worth roughly $460 billion. Land, office, and data center lease commitments add another $1.2 trillion.
The six largest tech stocks now account for 8.6% of duration times spread risk among US high-grade corporate bonds, per Barclays.
Got a tip? Send us an email securely via Protos Leaks. For more informed news and investigations, follow us on X, Bluesky, and Google News, or subscribe to our YouTube channel.


Aviva Investors has launched a tokenized share class of its US Dollar Liquidity Fund on the XRP Ledger, moving its Ripple partnership into production.
Summary
- Aviva Investors launched its first tokenized fund structure on the XRP Ledger.
- The Ireland-domiciled fund received Central Bank of Ireland approval for its new share class.
- Eligible investors can access the fund through digital wallets while BNY Mellon holds the underlying assets.
- XRP Ledger hosts approximately $4.37 billion in distributed and represented real-world assets.
Aviva brings its USD liquidity fund to XRPL
Aviva Investors and Ripple announced the launch on July 29, following a tokenization partnership disclosed in February. The product is a new share class of the Aviva Investors US Dollar Liquidity Fund, an Ireland-domiciled UCITS money market fund launched in its traditional form in 2020.
The companies are using a “digital twin” structure. Fund holdings are represented on the XRP Ledger, while the existing off-chain fund and its regulated framework remain in place.
Eligible investors with approved digital wallets will receive the same investment objective, risk profile, liquidity terms and regulatory protections available through the conventional share class, according to the launch announcement.
Mark Versey, CEO of Aviva Investors, described the launch as the asset manager’s first step into tokenized funds.
“It is our view that this trend will increase efficiency and ultimately lead to improved client outcomes.”
Central Bank of Ireland approves tokenized share class
The Central Bank of Ireland approved the new share class, allowing the product to operate within the fund’s existing regulated structure.
Aviva said the fund targets low-risk returns and daily liquidity through high-grade, short-term debt instruments denominated in US dollars. BNY Mellon will continue holding the fund’s underlying assets, separating regulated custody from the blockchain record representing investor holdings.
Komainu, a regulated digital asset custodian, supported the blockchain infrastructure, while Licuido provided technology for tokenizing the fund. The structure lets Aviva issue and manage fund shares on XRPL without moving the underlying securities directly onto the network.
For US investors, the fund’s dollar denomination does not automatically make it available in the United States. Access remains limited to eligible investors and depends on local securities rules, distribution approvals and Aviva’s onboarding requirements. The announcement did not identify a US retail offering or approval from the Securities and Exchange Commission.
Ripple expands its institutional product strategy
The launch turns Ripple’s first partnership with a European investment manager into a live product. When the firms announced their agreement in February, they said they intended to work together throughout 2026 and beyond on bringing regulated funds to XRPL.
Ripple has also expanded other parts of its institutional infrastructure. Last week, the company launched Ripple Mint, giving approved customers a direct channel to issue, redeem, bridge and track its Ripple USD stablecoin.
Ripple separately invested in compliance firm Notabene, which operates a payment and transaction network for regulated businesses. Together, the updates address token issuance, distribution and compliance rather than relying on a single blockchain product.
SBI Holdings, a long-time Ripple partner, is also broadening its blockchain exposure. The Japanese financial group recently renamed SBI Security Solutions as SBI Digital Practice and repositioned the subsidiary around the Canton Network. The move extends SBI’s institutional on-chain strategy beyond Ripple and XRPL.
XRP Ledger holds $4.37B in tokenized assets
The Aviva fund joins a growing group of tokenized financial products represented on XRPL.
RWA.xyz data showed $313.3 million in distributed assets and $4.06 billion in represented assets on the network as of July 29. Together, those categories placed XRPL’s tracked real-world asset value at approximately $4.37 billion.
The number of RWA holders increased 17.42% during the previous 30 days to 182. However, distributed asset value fell 5.24%, while represented value declined 0.47% over the same period.
XRPL also held $952.25 million in stablecoins, including about $907.2 million attributed to RLUSD. Adding stablecoins to the network’s distributed and represented RWA figures would put the broader tracked total above $5.3 billion, although RWA.xyz lists the categories separately.
Aviva and Ripple have not disclosed the initial value of shares issued through the tokenized class. Future growth will depend on investor onboarding and whether Aviva expands the model to other funds under the partnership.


For years, Ethereum has been synonymous with decentralized finance. It pioneered onchain financial tools like lending protocols and tokenized assets, which today underpin much of the crypto economy. But one of crypto’s fastest-growing sectors, perpetual futures, or “perps”, has largely flourished elsewhere.
Ask traders where onchain perpetuals live today, and the answer is more likely to be Hyperliquid or Solana than Ethereum. That is because perpetuals demand something Ethereum’s base layer was never designed to optimize for: extremely fast, low-cost, high-frequency trading.
“Perps require frequent transactions, fast execution, and deep liquidity,” said AJ Warner, chief strategy officer at Offchain Labs, the main developer firm behind the layer-2 Arbitrum. “That makes them a natural use case for the Arbitrum platform.”
The distinction has become increasingly important as decentralized perpetual exchanges mature from crypto-native products into markets attracting institutional attention.
Why Ethereum L1 fell behind
Perpetuals are one of the most demanding applications in crypto. Their exchanges require thousands of rapid-fire updates, liquidations, funding payments, and order executions, all without interruption.
“Perps onchain are really hard,” said Brian Smith of the Jito Foundation. “It’s not just the average performance that matters, it’s the 99.99% success rate. If your perps platform goes down, that’s existential risk.”
Ethereum’s security-first architecture made it an ideal settlement layer, but historically, its block times and gas costs made it an expensive place to run latency-sensitive trading applications.
When decentralized perps exchange GMX launched on Arbitrum in 2021,, it helped establish a template that many others would follow. “Ethereum mainnet fees were prohibitively expensive, which naturally attracted perps builders to Arbitrum,” Warner said. Offchain Labs then leaned into that momentum, actively prioritizing perpetuals as a strategic category.
“By prioritizing the vertical, we were able to attract a concentration of builders and capital to the ecosystem.” Today, much of Ethereum’s perpetual trading activity lives not on the Ethereum mainnet, but on layer-2 networks like Arbitrum and, increasingly, Base.
Ethereum’s layer-2 ecosystem has become something of a compromise: preserving Ethereum’s security while dramatically improving trading performance. Networks like Arbitrum and Base have reduced block times while also becoming an increasingly attractive trading destination because of their growing user base and liquidity.
Chris Boulous of Dromos Labs, the main developer firm behind Aerodrome, a decentralized exchange that lives on the Base network, argued that technical performance is only part of the story.
“Trading is effectively a network-effects business,” he said. “You have to build where the liquidity and users currently exist.” That dynamic has become self-reinforcing: protocols launch where traders already are, liquidity providers follow the traders, and then new applications build around existing liquidity. It’s one reason Boulous sees Aerodrome as complementary to perpetual exchanges rather than competitive with them.
“You can kind of think of perps as a customer of spot exchanges,” Boulous said. Spot exchanges provide pricing, liquidity and hedging opportunities that perpetual markets depend on. “Spot and perps are two sides of the same liquidity coin.”
Why Solana and Hyperliquid surged
Still, Ethereum’s layer-2 ecosystem isn’t the only place where developers can build high-performance trading infrastructure. Hyperliquid built an application-specific chain optimized almost entirely for perpetual trading. Solana, meanwhile, combined low fees with a large base of retail traders already actively trading memecoins and other speculative assets.
According to Smith of Jito, that user base matters as much as the technology. “The most important ingredient for any exchange platform, but especially perps, is retail organic flow,” he said. “Solana is the king of retail trading activity.”
Smith also argues Ethereum faces an additional challenge: fragmentation. “You need to be able to trade everything in a single spot,” he said. “What Ethereum is suffering from is a level of fragmentation.”
Ethereum’s scaling strategy largely relied on layer-2 networks like Arbitrum and Base to handle high-volume activity. While that approach dramatically reduced costs and improved performance, it also dispersed users and liquidity across multiple ecosystems. Traders often need to bridge assets between networks, making the experience less seamless than on single-chain ecosystems such as Solana. Earlier this year, Ethereum co-founder Vitalik Buterin acknowledged that the original layer-2 roadmap vision “no longer makes sense” as layer 2s have decentralized more slowly than expected and Ethereum’s base layer has itself become more scalable.
Not everyone sees that fragmentation as a fatal flaw, however. Some Ethereum proponents argue the focus on execution misses the network’s longer-term role in the onchain financial stack. Matthieu Saint Olive, a staff product manager at MetaMask, argues the framing itself misses what’s happening. “I’d push back gently on the premise that it’s a competition in the first place,” he told CoinDesk.
Purpose-built trading chains may ultimately win on execution speed, but they still require somewhere to source collateral, liquidity, stablecoins, and settlement. “Ethereum’s role is the settlement and collateral base where the deepest liquidity, the widest range of assets, the stablecoins, and the most mature DeFi primitives live.”
Several leading perpetual trading platforms either operate directly on Ethereum layer 2s or remain closely connected to Ethereum’s ecosystem for collateral, settlement, and developer tooling. “L2s are how Ethereum scales into use cases like active trading without giving up the thing that makes the base layer valuable,” Saint Olive said.
The institutional question
As institutions begin paying closer attention to onchain derivatives, the conversation is shifting from whether decentralized perpetuals can work to whether they can compete with traditional infrastructure. “It comes down to execution, custody, and predictability, not ideology,” Saint Olive said.
Institutions, Warner of Offchain Labs argued, still need deeper liquidity, more efficient capital usage, and better execution before deploying significant trading volume onchain. “Capital is still fragmented across venues,” Warner said. “Institutions will want better access to credit, cross-margining, and the ability to trade across venues without leaving large amounts of capital idle.”
For Boulous, the next milestone is straightforward: “You have to be able to do things onchain that you can’t do, or can’t do as cheaply, in traditional markets.”
While much of today’s decentralized perpetual volume still revolves around crypto assets, market participants increasingly see the infrastructure supporting perps as the foundation for broader capital markets. Saint Olive believes perpetuals are already demonstrating what programmable markets can become.
“Perps are the leading indicator, the first place you can watch traditional financial activity genuinely migrate onchain,” Saint Olive said.
That may also explain why Ethereum’s role in the market is evolving rather than diminishing.
Solana and purpose-built chains like Hyperliquid have established themselves as the venues where traders execute high-speed transactions. Ethereum, meanwhile, is increasingly positioning itself as the settlement and collateral layer that underpins those markets through its layer-2 ecosystem and broader DeFi infrastructure.
Whether that division of labor persists will depend on how quickly Ethereum can solve some of the challenges its critics point to: fragmented liquidity across layer 2s, better interoperability between networks, and a smoother user experience. If it can, proponents argue Ethereum doesn’t necessarily need to become the fastest place to trade perpetuals. It simply needs to remain the deepest and most trusted place to settle them.
Read more: Perpetual futures could become crypto’s next ETF moment
Crypto World
Trump’s $100,000 Truth API Faces SEC Investigation Demand: Two Precedents Show How it Ends


Senators Elizabeth Warren and Adam Schiff asked the US Securities and Exchange Commission (SEC) to investigate Truth API, the Trump Media & Technology Group feed that sells Wall Street firms early access to President Donald Trump’s Truth Social posts.
Trump Media has discussed charging between $60,000 and $100,000 a month. The service goes live on August 1, leaving the agency three days to act.
Why Warren and Schiff Want an SEC Investigation Into Truth API
Warren is the ranking Democrat on the Senate Banking Committee. Schiff sits on Judiciary. They wrote to SEC Chair Paul Atkins on July 28.
Their argument concerns latency, not content. Truth API routes posts from the 10 most influential Truth Social accounts to paying clients first.
Trump owns roughly 41% of Trump Media through a trust his children oversee. He profits from every subscription.
The senators cited his record of naming tickers, including Citigroup, Intel and Palantir. A CNN review found he had bought shares before praising 21 companies. Researchers have separately flagged trades spiking before announcements.
“This appears to be an outrageous abuse of the President’s office for his personal benefit that undermines everyday investors and the integrity of our markets, while enriching Wall Street and other wealthy insiders,” Warren and Schiff wrote in the letter.
Follow us on X to get the latest news as it happens
How Truth API Compares to Past Paid Early-Access Deals
Regulators have already dismantled two arrangements like this one.
In July 2013, Thomson Reuters suspended a deal giving select clients University of Michigan consumer sentiment data two seconds early. Those subscribers paid up to $6,025 a month.
In February 2014, Berkshire Hathaway’s Business Wire terminated direct feeds to high-frequency traders. Both followed pressure from then New York Attorney General Eric Schneiderman.
Truth API’s ceiling price runs roughly 16 times the Michigan premium. Neither precedent involved a sitting president.
Why Regulation FD May Not Cover the Truth Social Feed
Regulation FD, adopted in August 2000, bars issuers from selectively disclosing material nonpublic information about themselves to brokers, advisers and funds.
Truth API sells policy signals, not company information. That gap explains why the senators reached for insider trading and market manipulation statutes instead.
What Happens Before the August 1 Launch
Trump Media rejects the framing outright.
“The Senators must have invented a new theory of ‘insider trading’ based on publicly available information,” a Trump Media spokesperson indicated.
The SEC confirmed receipt and declined comment. Atkins, sworn in during April 2025 after running the consultancy Patomak Global Partners, has favored lighter enforcement.
Trump Media says it has signed customers but will not name them. BeInCrypto reported that paying firms get priority over the public.
Revenue pressure explains the urgency. The company posted a $406 million quarterly loss in the first quarter of 2026, and DJT trades near $9.85, about 80% below its March 2024 debut.
A formal enforcement action within three days is unlikely. SEC investigations open quietly and the agency almost never confirms them.
The 2013 and 2014 cases ended differently. In both, the vendor withdrew the product voluntarily once buyers grew uncomfortable being named.
That makes the subscriber list the pressure point. Reuters reported that industry sources see rising legal and political risk for any firm that signs up.
Two signals matter over the next month. Whether Atkins opens a file at all, and whether a single bank admits to buying the feed.
The post Trump’s $100,000 Truth API Faces SEC Investigation Demand: Two Precedents Show How it Ends appeared first on BeInCrypto.


About 176,000 ZEC, worth roughly $81 million, had migrated into Zcash’s new Ironwood shielded pool by Wednesday, a day after the upgrade activated and sealed the pool where a counterfeiting flaw had gone undetected for four years.
That is roughly 5% of the 3.66 million ZEC held in Orchard at activation. Orchard’s balance has since fallen to about 3.51 million, with around 46,000 ZEC crossing over in the past 24 hours, according to the Ironwood migration tracker.
Zcash holds funds in separate compartments called pools, each one a generation of the network’s privacy technology. The transparent pool works like bitcoin, with every balance and transaction visible on the chain, and holds about 12.5 million ZEC.
The shielded pools hide amounts and participants. Sapling, introduced in 2018, holds about 582,000 ZEC, and Orchard, which arrived in 2022 and was the newest until this week, held about 3.5 million. Each time the network upgrades its privacy cryptography, it opens a new pool rather than rebuilding the old one, leaving holders to move their coins across themselves.

A key section of the bill states that “not later than 30 days after the date of the enactment of this Act, the President shall, notwithstanding any other provision of law, increase the rate of duty for all goods, including oil, natural gas, liquefied natural gas, petroleum, petroleum products, petrochemical products, coal, and coal products, imported into the United States from the Russian Federation to a rate of up to 500 percent ad valorem.”
Regarding the President’s tariff authority, if the bill were to become law, it would allow Trump to place tariffs of up to 100% on the top five purchasers of Russian oil and natural gas, among other penalties.
Graham announced during a visit to Kyiv, just shortly before his death, that he had secured the White House’s approval on his revised text.
The latest iteration also includes a last-minute addition of extended sanctions against Iran, at the request of Trump. Following Graham’s passing, and amid the resumption of the Iran war, Trump said on July 19: “Republicans should add Iran to the Russian Sanctions Bill. That’s what Lindsey wanted to do, and it was going to happen.”


Iranian hacker collective CyberAv3ngers is the main suspect in a series of cyber attacks that hit 30 different water companies across the state of Minnesota this week.
That’s according to security research firm Tenable, which claims the attacks are consistent with CyberAv3ngers’ past exploits.
Meanwhile, Minnesota’s state IT agency claimed the disruption was the result of a “coordinated cyberattack.”
Tenable not only believes the attack to be the work of CyberAv3ngers, but also says the timing of the attack is “significant” given a July 22 report from the US Cybersecurity and Infrastructure Security Agency (CISA).
In it, the CISA warned that Iranian actors were actively targeting internet-connected devices, such as programmable logic controllers, across US water, energy, and government sectors.
Read more: Nobitex hackers threaten to ‘destroy’ pro-Iran institutions
Tenable also warned that the US war with Iran means “Iranian cyber operations have escalated in parallel with kinetic hostilities, with confirmed targeting of U.S. critical infrastructure.”
It’s worth noting that US authorities are yet to attribute the attack.
Cybersecurity firm Sophos reports that CyberAv3ngers has claimed responsibility for a 2020 Israeli cyber attack that targeted 150 railway system servers and 28 railway stations.
Three years later, the group appeared to try to sell the data stolen from the railway hack for four BTC, worth $108,000 at the time of the data listing.
In 2025, internal CyberAv3nger documents were leaked that included domain registrations, BTC transactions, and European virtual private server hosting.
Tenable says these details overlapped with another group called Moses Staff, and revealed CyberAv3ngers’ structure as a “single coordinated effort directed by the state” instead of multiple Iranian individuals.
Got a tip? Send us an email securely via Protos Leaks. For more informed news and investigations, follow us on X, Bluesky, and Google News, or subscribe to our YouTube channel.
(VIDEO) DoorDash Wins FAA Approval and Launches DoorDash Air, Its Own In-House Drone Delivery Business
Ripple Price Analysis: XRP Risks Falling Below $1 Unless It Breaks This Barrier
Xbox Officially Launches PC Mode for 4 Classic Childhood Games


-

 Fashion5 days ago
Weekend Open Thread: Brooks Brothers
-
 Sports3 days ago
Commonwealth Games boxing: Jadumani Singh seals dominant 5-0 win over Pakistan’s Sumama Rehman to enter quarter-finals | Commonwealth Games News
-

 Tech3 days ago
Intel is reversing course and bringing hyper-threading back to its server chips
-

 Crypto World7 days ago
Ethics, other provisions in crypto Clarity Act to be further discussed
-

 Politics2 days ago
Luke Littler dismantles Gerwyn Price to retain title in Blackpool
-

 Crypto World4 days ago
Ripple bought a bank in pieces. The $4 billion audit
-
 Entertainment5 days ago
A New Post-Apocalyptic Gundam Anime Series Blasts Into SDCC
-

 News Videos3 days ago
BITCOIN JUST ENTERED THIS CRITICAL ZONE…
-

 Sports6 days ago
2026 3M Open leaderboard: Scottie Scheffler finds putter in Round 1, sits three back
-

 Fashion6 days ago
16 Dresses for the High Summer Event
-

 Politics1 day ago
The Part of the Electric Transition Nobody Wants to Discuss
-

 News Videos6 days ago
The Peugeot Family: How 200 Years of an “Old Money” Dynasty Died in A Boardroom
-

 Business13 hours ago
Major shareholder moves on Canyon
-

 Politics3 days ago
Spain sweeps the board at 2026 World Cup with individual awards
-

 Crypto World3 days ago
XRP Ledger adds $2.6B as RWA inflows rank second
-

 Crypto World6 days ago
Uniswap (UNI) pushes deeper into tokenized RWAs with permissioned trading pools
-
 Entertainment23 hours ago
‘Stargate’ Creator’s New Sci-Fi Series Returns for Season 3 Tomorrow
-

 Tech5 days ago
Anthropic launches Claude Opus 5, a cheaper AI model for coding, agents and enterprise workflows
-
Crypto World7 days ago
SEC Agrees to Overhaul Recordkeeping After Settling Coinbase Lawsuit Over Gensler’s Lost Texts
-

 Entertainment4 days ago
Sara Gilson Killed By Husband After Viral “Pedophile” TikTok Video
You must be logged in to post a comment Login