
Crypto World
Dario Amodei Claude AI Predicts Solana Could Be Heading for a Bigger Comeback Than Expected

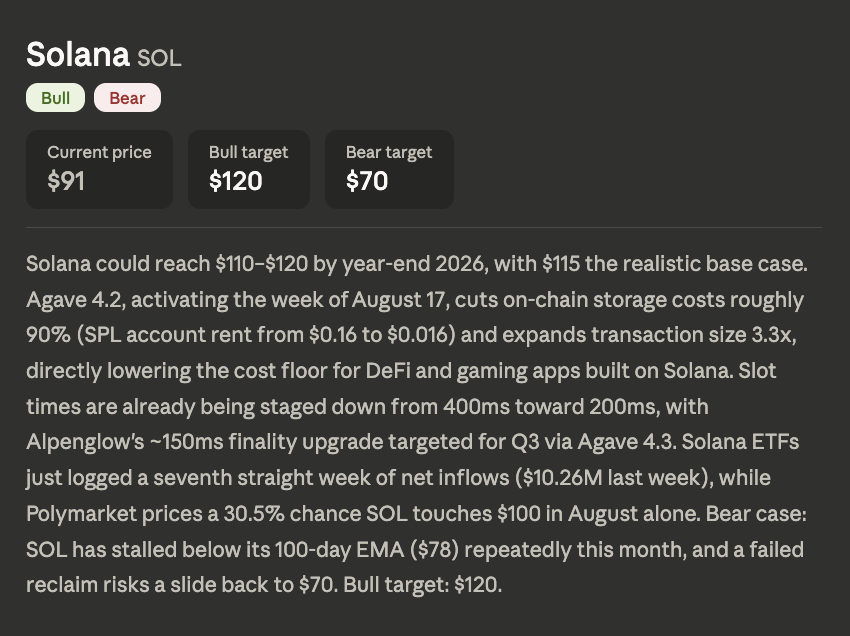
Storing an account on Solana used to cost $0.16 and now costs $0.016. Dario Amodei Claude AI predicts that a tenfold reduction changes what developers can build, and the price prediction places SOL at $110 to $120 by year-end 2026, with $115 as the realistic base case.
Agave 4.2 was activated the week of August 17. Alongside the storage cut, it expands transaction size 3.3x. Now, both changes lower the cost floor for DeFi and gaming applications directly. Cheaper primitives mean designs that were uneconomic become viable.
Speed is moving in parallel. Slot times are already being staged down from 400ms toward 200ms.

Alpenglow’s roughly 150ms finality upgrade is targeted for Q3 via Agave 4.3. Capital is arriving alongside the technical work.
Solana ETFs just logged a seventh straight week of net inflows, taking in $10.26M last week. Polymarket prices a 30.5% chance that SOL touches $100 during August alone.
The bear case is technical. SOL has stalled below its 100-day EMA near $78 repeatedly this month. A failed reclaim risks a slide back to $70. That level sits far below where the price now trades.

Discover: Everyone’s Got a Take. Get Free $25 from Kalshi to Actually Trade Yours
Solana Price Prediction: Claude AI Predicts A Tenfold Storage Cut Rewrites The Cost Floor
The daily chart has just broken a year-long ceiling. SOL peaked above $250 last September before an extended decline. November cut the price from $200 toward $120. February brought the capitulation move to roughly $67.
Spring settled into a range between $80 and $98. June broke it, marking the low near $61. July and August rebuilt patiently in the mid $70s. The past two sessions have surged, clearing $90 for the first time since May.
The close reads $92.09, up 5.08%, and $4.45. The daily range covered $87.55 to $93.38. Support sits at $85, then $78 at the EMA Claude names, with $70 beneath it. Resistance appears at $98, then $110, and $120.
RSI reads 81.86 with its signal line far below at 58.57. That gap of more than 23 points confirms an abrupt shift in buying pressure. The oscillator is now deeply overbought. Momentum is strongly bullish, though such extremes typically cool before extending.
Claude’s base case sits 25% above this close, and that gap has narrowed fast. Holding above the reclaimed $78 EMA is what keeps the path clean.
Discover: Your Market Calls Are Worth Something. Start with a free $25 on Kalshi
Solana Just Repriced the Upgrade. Kalshi Lets Traders Position for What Comes Next.
SOL has already reacted to cheaper storage, larger transactions, and the next stage of its speed roadmap. The harder trade now is deciding which upcoming catalyst actually keeps the move alive.
Kalshi gives traders a way to isolate those outcomes.
The platform offers markets around crypto, economic data, Fed policy, politics, and other events that can move asset prices. Instead of buying SOL after a sharp rally and taking exposure to every variable affecting the token, traders can focus on the specific event they have conviction on.
That matters with Alpenglow still ahead and SOL already deeply overbought. A successful rollout could validate the breakout. A delay or weaker-than-expected impact could change the setup quickly.
Kalshi lets traders act on that uncertainty before it is fully reflected in price.
Eligible new users who join Kalshi through CryptoNews can receive $25 through our referral link.
The post Dario Amodei Claude AI Predicts Solana Could Be Heading for a Bigger Comeback Than Expected appeared first on Cryptonews.



Richard Wyckoff published his market framework before the Great Depression, yet his distribution schematic remains one of the most referenced tools in crypto trading circles. This article breaks down how the method works, where it has appeared in Bitcoin price history, and what it actually tells traders about supply and demand.
Summary
- Richard Wyckoff developed his market cycle theory in the early 1900s, dividing price action into four phases: accumulation, markup, distribution, and markdown.
- The distribution phase contains specific sub-events, including the buying climax, automatic reaction, secondary test, sign of weakness, and last point of supply, each signaling a gradual shift from demand to supply.
- Volume analysis sits at the center of the Wyckoff method, with traders comparing effort (volume) against result (price movement) to detect when large operators are offloading positions.
- Bitcoin has displayed patterns consistent with Wyckoff distribution at several major tops, most notably in the first half of 2021 before a 50% drawdown.
- The method has limits: it does not predict timing or targets, and forcing its schematics onto every chart without confirming volume evidence is one of the most common mistakes traders make.
The first thing most people get wrong about Wyckoff analysis is the assumption that it predicts where price will go. It does not. The method was never designed as a forecasting system. It was designed as a reading system, a way to interpret what large, informed participants are doing with their capital based on the relationship between price and volume. That distinction matters because it changes how a trader uses the framework. Instead of drawing lines and waiting for a target, a Wyckoff practitioner watches for behavioral evidence that supply is overwhelming demand, or the reverse.
Who Richard Wyckoff was
Richard Demille Wyckoff was born in 1873 and spent his career on Wall Street during one of the most volatile periods in American financial history. He began working as a stock runner at age 15, eventually founding The Magazine of Wall Street in 1907, which grew into one of the most widely read financial publications of the era. He was a contemporary of Jesse Livermore, J.P. Morgan, and Charles Dow, and unlike many of his peers, he focused on educating retail investors rather than profiting from their mistakes.
Wyckoff believed that markets were driven by the activity of what he called the “Composite Man,” a conceptual figure representing the collective behavior of large institutional operators. His core argument was simple: if retail traders could learn to read the footprints left by these operators through price and volume, they could align their trades with the dominant force in the market rather than fighting it.
By the time of his death in 1934, Wyckoff had amassed a body of work that included books, articles, and a detailed correspondence course. The Stock Market Institute later formalized his teachings, and figures like Robert Evans and Hank Pruden carried the method into the late twentieth century. The core principles have survived largely unchanged because they describe something fundamental: the behavior of large participants operating in liquid markets. The Wyckoff method does not rely on indicators, oscillators, or mathematical formulas. It relies on reading the tape, a skill that translates directly into reading candlestick charts with volume data today.
The Wyckoff market cycle
Wyckoff divided all market behavior into four repeating phases:
Accumulation occurs when large operators quietly build positions after a prolonged decline. Price moves sideways in a range while volume patterns reveal absorption of supply. Retail sentiment is typically bearish during this phase, which is precisely why informed money can buy at low prices without pushing the market up prematurely.
Markup follows accumulation. Once large operators have built their positions, they allow price to rise, often quickly, as diminished supply meets renewed demand. This is the phase most retail traders recognize and attempt to trade.
Distribution is the mirror image of accumulation. Large operators begin selling their positions to eager buyers near the top of a trend. Price again moves sideways, but this time the underlying dynamic is the transfer of ownership from informed to uninformed participants. Distribution is harder to identify in real time than accumulation because bullish sentiment masks the selling pressure.
Markdown follows distribution. Once large operators have sold enough of their inventory, price falls, sometimes rapidly, as the remaining holders discover that demand has evaporated.
The cycle then repeats. Wyckoff did not claim that every cycle looks identical, but he argued that the underlying logic of supply and demand creates recognizable behavioral patterns at each phase.
Distribution phases in detail
Wyckoff and his later students, particularly Robert Evans and Hank Pruden, mapped specific events within the distribution phase. These events appear in a rough sequence, though real markets do not always follow the textbook order perfectly.
Preliminary supply (PSY) is the first sign that selling pressure is entering the market after a prolonged uptrend. Volume increases on a price advance, but the advance stalls or reverses. This event does not confirm distribution on its own. It signals that supply is beginning to appear.
Buying climax (BC) is a sharp, high-volume price spike that typically marks the highest point of the range. Retail enthusiasm peaks, volume surges, and price often gaps or extends rapidly. The key feature of a buying climax is that it occurs on the heaviest volume of the entire uptrend, yet price fails to sustain the advance. Large operators are using the demand created by retail excitement to offload inventory.
Automatic reaction (AR) is the selloff that follows the buying climax. Once the wave of buying exhausts itself, price drops under its own weight. The low of the automatic reaction defines the lower boundary of the distribution trading range.
Secondary test (ST) is a rally back toward the buying climax high on diminished volume. If volume and spread (the size of individual candles) decrease compared to the buying climax, the test confirms that demand is weakening. There can be multiple secondary tests.
Upthrust after distribution (UTAD) is an optional event where price briefly breaks above the buying climax high, trapping breakout buyers before reversing back into the range. Not all distribution ranges produce a UTAD, but when one appears, it is often the final bull trap before markdown begins.
Sign of weakness (SOW) is a decline that breaks below the lower boundary of the range, typically on increased volume. This event confirms that supply is in control. Price may bounce after a sign of weakness, but the character of the market has changed.
Last point of supply (LPSY) is the final weak rally before markdown accelerates. Volume and spread are noticeably lower than earlier rallies within the range. This event represents the last opportunity for large operators to sell remaining inventory before allowing price to fall freely.
Volume analysis in Wyckoff
Volume is not decoration in the Wyckoff method. It is the primary diagnostic tool. The core principle is effort versus result: if heavy volume (effort) produces little price movement (result), then the opposing force is absorbing the effort. If light volume accompanies a price move, the move lacks conviction and is likely to fail.
During distribution, traders watch for several volume patterns:
Volume climaxes on up-moves suggest that selling pressure is absorbing buying pressure. Even though price is rising, the extraordinary volume indicates that supply is meeting every bid.
Declining volume on rallies within the trading range confirms that demand is drying up. Each successive test of the highs produces less enthusiasm.
Expanding volume on declines within the range confirms that supply is increasing. Sellers are becoming more aggressive at lower prices.
A volume spike on a break below the range (sign of weakness) confirms that the distribution is complete and markdown is beginning.
One of Wyckoff’s most useful observations is that volume leads price. Changes in volume character often appear one or two events before the price action confirms the shift. This is why experienced Wyckoff practitioners spend more time studying volume bars than candlestick patterns.
Wyckoff applied to Bitcoin
Bitcoin’s 24/7 market structure and transparent on-chain data make it an unusually clean canvas for Wyckoff analysis. Unlike equities, which trade in sessions with opening and closing auctions that distort volume profiles, Bitcoin produces continuous price and volume data across global exchanges. On-chain analytics add a layer of confirmation that Wyckoff could never have imagined: the ability to see exactly when coins move from dormant wallets to exchange hot wallets, signaling that holders are preparing to sell. Two episodes stand out.
The 2021 top. Between February and May 2021, Bitcoin traded in a range between roughly $48,000 and $64,000. The April rally to $64,000 occurred on climactic volume across major exchanges, consistent with a buying climax. Price then dropped to approximately $47,000 (automatic reaction) before rallying back toward the highs on lower volume (secondary test). The May breakdown below $47,000 on sharply increased volume matched the sign of weakness event. The subsequent markdown carried Bitcoin to $29,000 within weeks. On-chain data later confirmed that long-term holders had been distributing coins to new buyers throughout the range, adding a data layer that Wyckoff himself never had access to.
The 2024 consolidation. After Bitcoin reached new highs near $73,000 in March 2024, it entered a multi-month trading range. Some analysts identified Wyckoff distribution features in the range, pointing to declining volume on rallies toward the highs. Others argued the pattern more closely resembled re-accumulation, a sideways pause within an ongoing uptrend. This disagreement illustrates an important point: Wyckoff analysis requires patience. The method reveals its answer only after the range resolves. Traders who labeled the range as distribution too early risked exiting before a continuation higher.
Wyckoff vs. modern technical analysis
Most popular technical analysis today relies on calculated indicators: moving averages, RSI, MACD, Bollinger Bands. These tools transform raw price data into derivative signals and generate buy or sell triggers based on mathematical thresholds.
Wyckoff analysis works differently. It reads raw price and volume directly, interpreting the behavior of market participants rather than the output of formulas. A Wyckoff practitioner asks “who is buying and who is selling at this price, and is the balance shifting?” An indicator-based trader asks “has RSI crossed above 70?”
Neither approach is inherently superior, but they answer different questions. Indicators excel at standardized, repeatable signals that can be backtested and automated. Wyckoff excels at contextual reading of market structure, identifying when the underlying dynamics of supply and demand are changing before indicators register the shift.
Many traders combine both. They use Wyckoff principles to identify the phase of the market cycle and then use indicators for timing entries and exits within that context. This layered approach avoids the main weakness of each method used alone: indicators without context generate false signals in ranges, and Wyckoff without precision can leave a trader waiting indefinitely for “confirmation.”
There is also a philosophical difference worth noting. Indicator-based analysis assumes that past statistical patterns will repeat in the future. Wyckoff analysis assumes that human behavior around greed, fear, and information asymmetry will repeat. Both assumptions have merit, but the Wyckoff assumption holds up more consistently across different asset classes and time periods because it is rooted in market structure, not in curve-fitting.
Common Wyckoff mistakes
Pattern-matching without volume. The most frequent error is identifying Wyckoff schematics based on price structure alone. A sideways range after an uptrend looks like distribution, but without confirming volume evidence, it might be a pause before continuation. The schematics are meaningless without the volume story.
Forcing the framework onto every chart. Not every top is a Wyckoff distribution. Not every bottom is accumulation. Some markets trend without forming recognizable ranges, and some ranges resolve in directions that contradict the expected schematic. Wyckoff himself acknowledged that the method works best in liquid markets with clear volume data. Applying it to illiquid altcoins with questionable volume reporting produces unreliable results.
Labeling events too early. Distribution takes time, often weeks or months. Traders who label a buying climax after one volatile day and then call for markdown the next week are misusing the method. Each event requires confirmation from subsequent price and volume behavior.
Ignoring the broader context. A distribution range that forms within a larger accumulation structure has a different meaning than one that forms after a multi-year bull run. Wyckoff analysis is fractal. The same patterns appear on daily, weekly, and monthly timeframes, and the higher timeframe context overrides the lower timeframe reading.
Treating Wyckoff as a crystal ball. The method identifies conditions under which a certain outcome becomes more probable. It does not guarantee that outcome. Even a textbook distribution schematic can fail if a macro event injects unexpected demand into the market.
What Wyckoff does not tell you
Wyckoff analysis does not provide price targets. It identifies phases and events, not destinations. A sign of weakness confirms that distribution is likely complete, but it does not tell you whether markdown will carry price down 20% or 60%.
It does not provide timing. Distribution can last weeks or months, and there is no formula for predicting when the LPSY will appear or when markdown will begin.
It does not work on all assets. Markets with low liquidity, manipulated volume data, or no continuous trading history produce unreliable Wyckoff readings. This is relevant in crypto, where many tokens trade on exchanges known for inflated volume.
It does not replace risk management. Even if a trader correctly identifies a distribution phase, they still need position sizing, stop placement, and a plan for what to do if the analysis is wrong. Wyckoff was explicit about this in his original course: reading the market correctly is only half the job. The other half is acting on that reading with discipline, which means accepting losses when the market does something the analysis did not anticipate.
It also does not account for external catalysts. A regulatory announcement, an exchange hack, or a macroeconomic shock can override any distribution or accumulation pattern. The method reads internal market structure. It does not read the news.
Practical checks for identifying distribution
Timeframe selection. Wyckoff analysis works best on daily and weekly charts for major assets like Bitcoin and Ethereum. Lower timeframes (1-hour, 4-hour) produce more noise and more false patterns. Higher timeframes (monthly) provide context but move too slowly for actionable trading.
Volume source. Use volume data from spot exchanges or aggregated across multiple venues. Futures volume can distort the picture because leveraged liquidations create artificial spikes that do not represent genuine supply and demand shifts.
Checklist approach. Rather than trying to identify the full schematic at once, check for individual events sequentially. Has there been a climactic price spike on extreme volume? Did the subsequent selloff define a clear range? Are rallies within the range producing less volume than the initial spike? Each confirmed event adds weight to the distribution thesis.
On-chain confirmation. For Bitcoin specifically, on-chain metrics like long-term holder supply changes, exchange inflows, and realized profit-taking can confirm or deny what the Wyckoff chart suggests. This is a modern advantage that Wyckoff analysts in traditional markets do not have.
Wait for the sign of weakness. The single most important discipline in Wyckoff trading is patience. Distribution is confirmed only when price breaks below the range on convincing volume. Acting before that event means trading a hypothesis, not a confirmed phase.
What to watch
Volume divergence on rallies near range highs. If price tests the top of a range on declining volume two or more times, demand is weakening, and distribution becomes more probable.
A sharp break below the range low on expanding volume. This sign of weakness event is the strongest single confirmation that distribution is complete and markdown has begun.
On-chain data showing long-term holders reducing positions. When holders who have not moved coins for over 155 days begin transferring to exchanges, it confirms that informed participants are distributing.
A UTAD that reverses quickly on high volume. A failed breakout above the range that traps buyers and reverses within one to three sessions is often the last event before markdown, and a high-confidence short signal for aggressive traders.
Decreasing spread on successive rallies within the range. When each rally produces smaller candle bodies (spread) on similar or declining volume, the market is telling you that buyers are losing conviction with each attempt to push higher.
What is Wyckoff distribution in simple terms?
Wyckoff distribution is a phase of the market cycle where large, informed participants gradually sell their holdings to smaller buyers near the top of a trend. Price moves sideways in a trading range while ownership transfers from strong hands to weak hands. Once the selling is complete, price declines.
How long does a Wyckoff distribution phase last?
There is no fixed duration. In Bitcoin, distribution phases at major cycle tops have lasted anywhere from several weeks to several months. The duration depends on how much inventory large operators need to sell and how much buying demand exists to absorb it.
Can Wyckoff analysis predict exact Bitcoin price targets?
No. The method identifies phases and events that signal shifting supply and demand dynamics. It does not produce numerical price targets. Traders who use Wyckoff typically combine it with other tools, such as support and resistance levels, Fibonacci extensions, or on-chain data, for target estimation.
Is Wyckoff analysis still relevant in the age of algorithmic trading?
Yes. Algorithmic trading has changed the speed at which events unfold, but the underlying dynamics of supply and demand have not changed. Large participants still need to build and exit positions without moving the market against themselves, which creates the same behavioral footprints Wyckoff identified a century ago.
What is the difference between Wyckoff distribution and re-accumulation?
Both appear as sideways trading ranges after an uptrend. Distribution leads to markdown (price decline), while re-accumulation leads to further markup (price advance). The difference shows in volume behavior: distribution ranges show increasing volume on declines and decreasing volume on rallies, while re-accumulation ranges show the opposite.
How do you confirm a Wyckoff distribution pattern on Bitcoin?
Confirmation requires a sign of weakness: a break below the lower boundary of the trading range on significantly increased volume. Until that event occurs, the range could resolve in either direction. On-chain data showing large holders moving coins to exchanges adds a secondary layer of confirmation.
Does Wyckoff work on altcoins?
The method works best on liquid assets with reliable volume data. Major altcoins like Ethereum can produce readable Wyckoff structures. Smaller tokens with low liquidity and potentially inflated exchange volume produce unreliable patterns. Volume data quality is the limiting factor.
What timeframe is best for Wyckoff analysis on crypto?
Daily charts offer the best balance between signal quality and actionability for major cryptocurrencies. Weekly charts provide important structural context. Timeframes below 4 hours tend to produce excessive noise and false patterns unless the trader has significant experience with the method. This is educational analysis, not investment advice.
Disclaimer: This article is for informational purposes only and does not constitute financial, investment, or trading advice. Cryptocurrency markets carry substantial risk. Always conduct your own research and consult a qualified financial advisor before making investment decisions. Published Aug. 21, 2026.
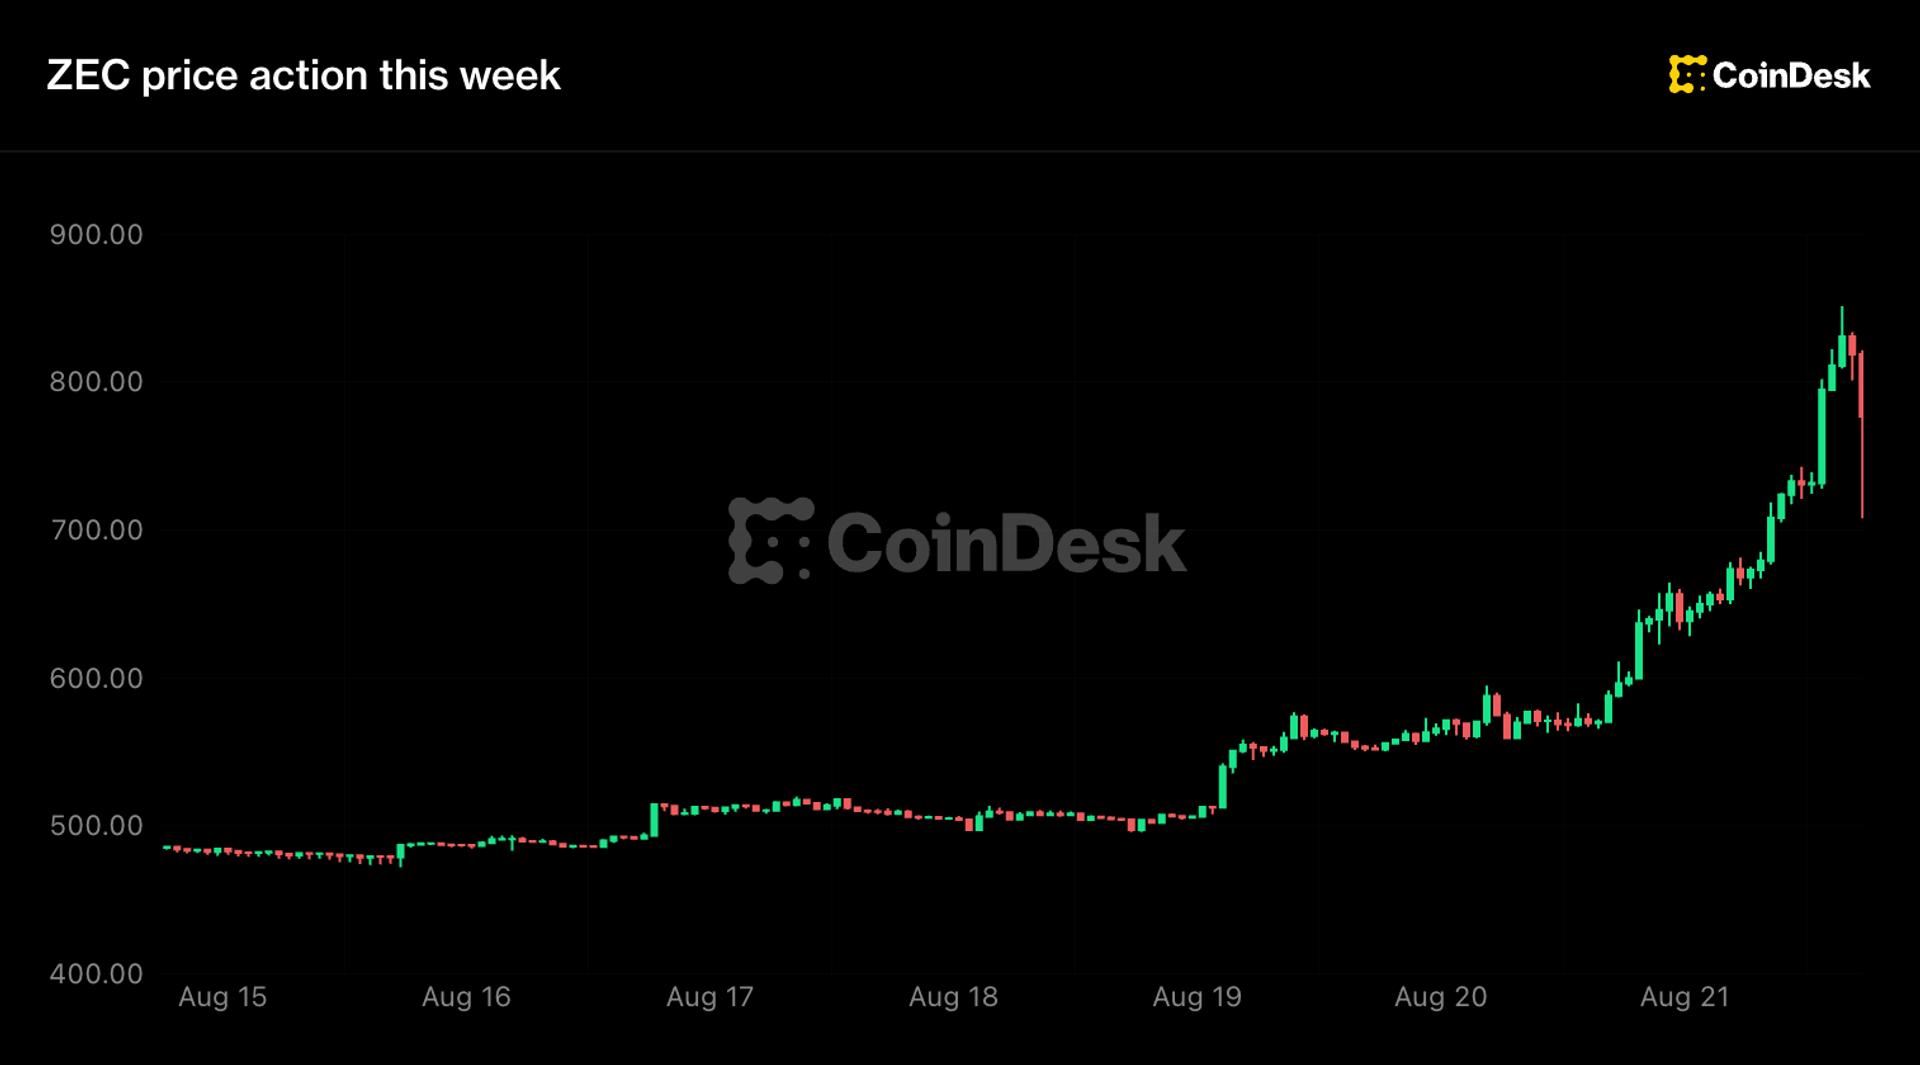
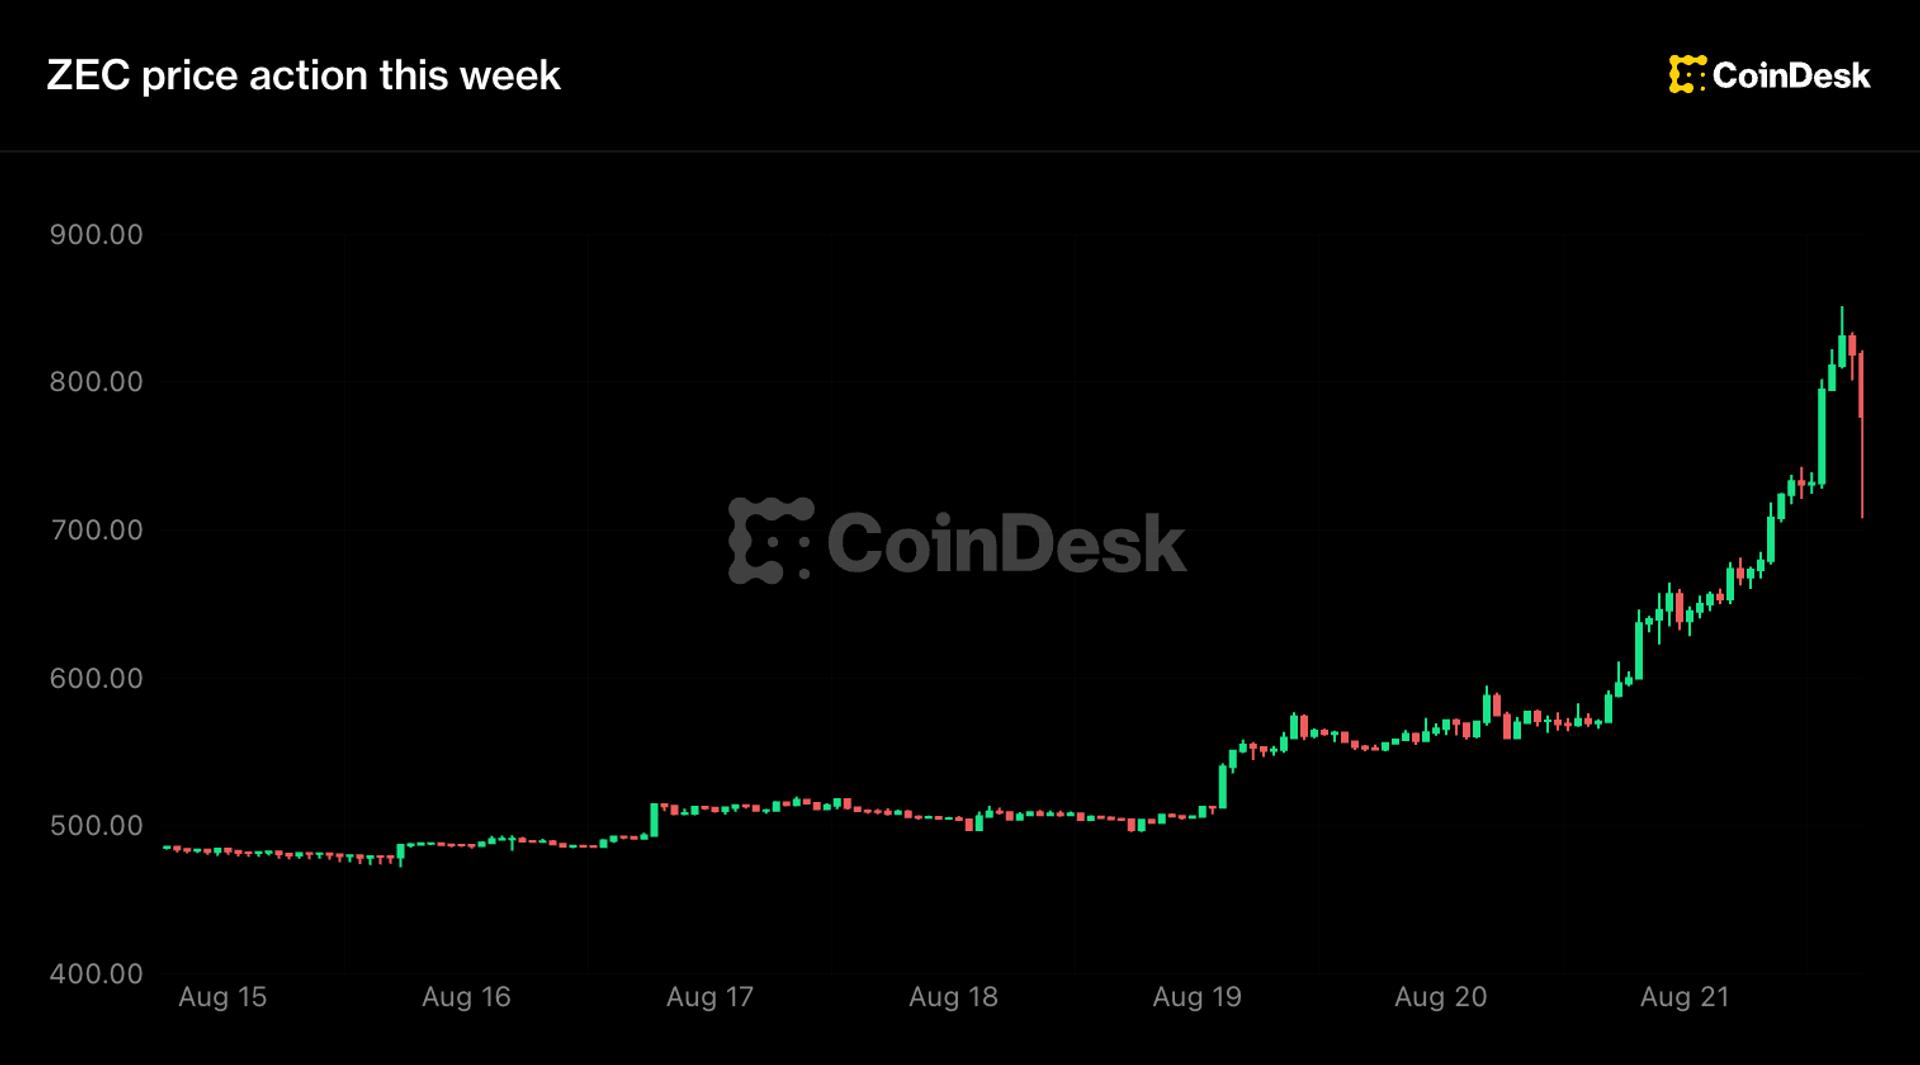
ZEC traded above its January 2018 peak as futures volume hit billions of dollars and a Grayscale filing showed fresh progress toward converting its Zcash Trust into a spot ETF.
Crypto World
Binance just gave AI bots a trading license. The safeguards are thinner than they look.


Binance Agent OS lets ChatGPT, Claude, and other AI agents place trades across spot, margin, and futures through a single protocol. Five competitors launched similar systems in the past 30 days. The custody models are different, the liability language is almost identical, and nobody has answered the question that matters most: what happens when an agent loses money.
Summary
- Binance launched Agent OS on Aug. 20, 2026, bundling its APIs, a dedicated agent wallet hub, an x402 payment layer, and a skills marketplace into a single platform that any Model Context Protocol compatible AI agent can access.
- Once authorized, an agent operates through an isolated sub-account with no withdrawal scope, meaning it can read market data and execute trades across spot, margin, convert, and futures products but cannot move funds to external wallets.
- Coinbase, Gemini, MetaMask, MoonPay, and Ledger all shipped competing agent-trading products between July and August 2026, each using a different custody architecture ranging from exchange-hosted sub-accounts to self-custodial AI wallets to hardware-wallet spending caps.
- A U.S. survey published Aug. 12 found that 79% of prediction market users lost money in the past year, with 51% using borrowed funds, offering an early warning about retail behavior when automated tools meet volatile markets.
- No platform in the current wave has published a liability framework that assigns responsibility when an agent executes a losing trade, a failed arbitrage, or a liquidation cascade, leaving the entire risk surface on the user side of the terms of service.
The largest cryptocurrency exchange in the world announced on Wednesday that AI agents can now trade on its platform. Not through a workaround, not through an unofficial API wrapper, but through a purpose-built system called Binance Agent OS that connects directly to the exchange’s markets, wallets, and execution engine.
The system uses Model Context Protocol, an open standard created by Anthropic that gives compatible AI applications a uniform way to plug into external tools. Binance listed Claude, ChatGPT, Codex, and VS Code among the agents that can connect. Once linked and granted permission, an agent can pull live market data, check balances, and place trades across spot, margin, convert, and futures products.
Binance is not the first exchange to do this. It is the fifth major platform to launch agent-trading infrastructure in less than 30 days. But it is the largest, and the architecture it chose reveals something about where the industry thinks risk actually lives.
What Binance Agent OS actually does
Agent OS bundles four components that previously required separate integrations into a single access layer. The first is the exchange’s existing API, which handles market data and order execution. The second is an agent-focused wallet hub that creates and manages isolated sub-accounts. The third is x402, a payment protocol layer that handles fee routing and micropayments between agents and services. The fourth is a skills marketplace where developers can publish and discover pre-built trading strategies that agents can load and execute.
At the center of the system sits a new Binance MCP Server. MCP is an open standard that lets AI applications connect to external tools without users juggling API keys locally. An agent running on a user’s machine or in the cloud connects to the MCP Server, requests access to specific capabilities, and operates within the scope the user grants.
The skills marketplace is the component that distinguishes Agent OS from a simple API upgrade. Binance had already shipped seven AI Agent Skills in March 2026, covering spot trading, USD-margined futures, margin trading, Alpha market data, wallet data, execution tools, and asset management. Agent OS wraps these skills into a discovery layer where any compatible agent can browse, evaluate, and activate strategies without the developer writing custom integration code.
This means a user does not need to program a trading strategy. They can point an AI agent at the skills marketplace, describe what they want (“rebalance my portfolio to 60% Bitcoin, 30% Ethereum, 10% stablecoins every Monday”) and the agent selects and executes the appropriate skills. The gap between intention and execution has collapsed to a single sentence.
The critical design choice is the sub-account architecture. Every agent operates through what Binance calls an “Agentic sub-account,” a walled-off partition of the user’s holdings. The sub-account can receive funds from the main account but cannot send them anywhere external. If the agent is compromised, stolen, or simply makes bad decisions, the damage is theoretically contained to whatever the user deposited into the sub-account.
Binance also chose not to grant agents withdrawal scope. An agent can buy, sell, convert, and open leveraged positions, but it cannot move assets to an external wallet. This is the single most important guardrail in the system, and it is worth understanding exactly what it does and does not protect against.
What it protects against: an agent draining funds to a third-party address. What it does not protect against: an agent making a series of bad trades that reduce the sub-account balance to zero, or opening leveraged positions that get liquidated. The guardrail prevents theft. It does not prevent loss.
The five competitors and their custody models
Binance is not building in isolation. Five other platforms launched agent-trading products between July and August 2026, and each made fundamentally different choices about where risk sits.
Coinbase rolled out a tool in late July that lets agents trade and make payments. Coinbase is also funding agent-focused startups through its Base accelerator program, signaling a long-term commitment to the category. The custody model mirrors Binance: exchange-hosted, with agent access scoped to specific capabilities. But Coinbase went further by integrating agents directly into its Base Layer 2 network, creating a path for agents to interact with on-chain protocols without leaving the Coinbase ecosystem. A Coinbase-connected agent can, for example, provide liquidity to a decentralized exchange on Base, claim yield, and reinvest the proceeds, all without the user touching a wallet.
Gemini introduced its own agentic trading feature in June. Gemini’s approach is the most conservative of the group. Agent access is restricted to read operations and spot trading only, with no margin or futures capability. The exchange positions this as a safety-first approach, arguing that agents should prove reliability on simple tasks before gaining access to leveraged products. Critics counter that the restrictions limit the utility enough to make agents impractical for anything beyond simple rebalancing, which is precisely the type of task that did not need an AI agent in the first place.
MetaMask took the opposite approach by launching a self-custodial AI wallet. In this model, the agent holds its own private keys and operates autonomously on-chain. The user sets spending limits and asset restrictions, but the agent can interact with any decentralized protocol within those bounds. This is the highest-risk, highest-flexibility option. If the agent’s key management is compromised, there is no exchange to freeze the account. The funds are gone in the same way they are gone when any private key is stolen: irreversibly.
MoonPay built agent products specifically for Telegram, targeting the messaging platform’s large crypto-native user base. MoonPay agents can execute purchases, check balances, and manage portfolios through conversational commands. The custody model is MoonPay-hosted, similar to the exchange models but with a payment processor’s compliance infrastructure underneath. The Telegram integration is significant because it meets users in a platform they already use daily, removing the friction of downloading a separate application or navigating an exchange interface.
Ledger and MoonPay jointly developed a system that lets users cap how much an agent can spend from a hardware wallet. This is the most novel approach in the group. The hardware wallet acts as a spending limit enforcer: the user approves a maximum transaction amount and a time window, and the agent can operate freely within those constraints. Once the cap is hit, the agent stops until the user physically approves a new allocation on the device. The elegance of the design is that the security guarantee comes from hardware, not software. Even a fully compromised agent cannot spend more than the user authorized on the physical device.
The range of architectures reveals an industry that has not converged on a standard. Exchange-hosted sub-accounts, self-custodial wallets, hardware-enforced spending caps, and payment-processor models are all live simultaneously, each making different tradeoffs between convenience, security, and user control.
The liability gap nobody is talking about
Every platform in the current wave shares one characteristic: the terms of service place the entire risk of agent-driven trading on the user.
Binance’s announcement included a disclaimer stating that use of its AI services is “at the user’s own risk” and that outputs “should not be relied on alone for decisions.” Binance also cautioned users to review each order and transfer before confirming, placing the responsibility for keeping an agent in check on the user rather than the exchange.
This language is standard across the industry. Coinbase, Gemini, MetaMask, and MoonPay all use variations of the same framework: the platform provides the infrastructure, the user assumes the risk, and the agent exists in a legal gray zone where it is treated as a tool rather than a fiduciary.
The problem is that agent trading is designed to be autonomous. The entire value proposition is that the agent acts without constant human oversight. Telling users to “review each order before confirming” while simultaneously building a system optimized for hands-off execution creates a contradiction that no platform has resolved.
Consider a scenario: a user connects an AI agent to Binance Agent OS, deposits $10,000 into the agentic sub-account, and sets the agent to execute a momentum-following strategy on Bitcoin futures with 10x leverage. The agent opens a long position at $77,000. Bitcoin drops 10% overnight. The position is liquidated. The $10,000 is gone.
Who is responsible? Under the current terms of service, the user is. The agent is a tool. Binance provided the infrastructure. The user chose the strategy, the leverage, and the allocation. But the user also chose to use an AI agent specifically because they did not want to monitor every trade manually. The terms of service and the product design are pulling in opposite directions.
Now consider a more complex scenario: the same agent, running the same strategy, opens a position that triggers a cascading liquidation across multiple accounts. The agent’s trade was the marginal order that pushed a thinly traded futures market past a liquidation level, forcing other positions to close, which pushed the price further, which triggered more liquidations. The user lost $10,000. Other traders collectively lost $500,000. The agent was following its instructions exactly as written.
In traditional finance, this type of cascade has clear accountability. The exchange’s risk management system should have circuit breakers. The broker should have position limits. The algorithmic trading firm should have kill switches. In crypto agent trading, none of these safeguards are required.
This is not a hypothetical concern. A U.S. survey published on Aug. 12 by BadCredit.org found that 79% of prediction market users lost money in the past year, with 51% using borrowed funds. Prediction markets and agent-driven trading are different products, but they share a common dynamic: automated or semi-automated decision-making systems that attract retail users who may not fully understand the risk surface.
Model Context Protocol and why it matters
The technical foundation of Binance Agent OS is Model Context Protocol, and understanding MCP is essential to understanding why this moment is different from previous waves of algorithmic trading.
MCP is an open standard created by Anthropic that gives AI applications a uniform interface for connecting to external tools. Before MCP, integrating an AI agent with an exchange required custom API wrappers, authentication flows, and error handling for each platform. A developer building a trading agent needed separate integrations for Binance, Coinbase, and every other exchange.
MCP changes this by creating a single protocol that any compatible agent can use to discover and interact with any compatible service. A Binance MCP Server advertises its capabilities (read market data, place orders, check balances) in a standardized format. An agent discovers these capabilities, requests access, and begins operating.
The implication is that agent trading will scale much faster than previous waves of automation. Building a trading bot in 2020 required weeks of API integration work. Building an agent-trading system in 2026 requires connecting to an MCP Server and writing a prompt. The barrier to entry has dropped by an order of magnitude.
This is both the promise and the risk. Lower barriers mean more participants, more liquidity, and more competition among strategies. They also mean more untested strategies, more inexperienced operators, and a higher probability of correlated failures when many agents react to the same market signal simultaneously.
The speed of adoption is already visible. Binance shipped its first seven AI Agent Skills in March 2026. Five months later, it launched a full platform with a skills marketplace, a sub-account system, and an MCP Server. The iteration speed suggests that agent trading is not an experiment for Binance. It is a core product strategy.
The flash crash question
The crypto market has a history of flash crashes driven by algorithmic trading. The May 2021 crash saw Bitcoin drop 30% in hours as leveraged positions were liquidated in a cascade. The FTX collapse in November 2022 triggered a similar dynamic, with automated selling amplifying human panic.
Agent trading introduces a new variable: agents that share underlying models. If a significant fraction of trading agents use the same foundation model (GPT-4, Claude, or their successors), they may develop similar market views and execute similar trades. This is not the same as traditional algorithmic trading, where each firm writes its own strategy. AI agents using the same model may converge on the same analysis and act in the same direction at the same time.
No exchange has published research on this correlation risk. No regulator has proposed rules for it. The closest precedent is the concern about passive index funds creating systemic risk by all holding the same stocks. But index funds rebalance on fixed schedules. AI agents can act in milliseconds.
The counterargument is that agents will be configured with different strategies, risk tolerances, and time horizons, creating natural diversity even if the underlying model is the same. This is plausible but untested. The market will discover whether model diversity is sufficient when the first agent-driven liquidation cascade occurs.
There is a historical parallel in traditional finance worth noting. In August 2007, several quantitative hedge funds experienced simultaneous losses over a three-day period, despite running independently developed strategies. The cause was that many quant funds had converged on similar factor models, creating hidden correlation. When one fund began liquidating, the selling triggered losses at other funds running similar strategies, which triggered more selling. The episode became known as the “Quant Quake” and remains one of the most studied examples of model monoculture risk in finance.
What the regulators have not said
The CFTC, SEC, and global equivalents have been largely silent on agent-driven trading in crypto markets. The SEC’s proposed Regulation Crypto Assets framework does not mention AI agents. The CLARITY Act, currently working through Congress, does not address automated trading systems beyond existing algorithmic trading rules.
The regulatory gap is significant because agent trading does not fit neatly into existing categories. A human trader using a tool is subject to existing rules. A fully autonomous agent that discovers, evaluates, and executes trades without human intervention is something different. The question of whether the agent or the user is the “trader” for regulatory purposes has not been answered.
In traditional finance, the answer is clearer. Algorithmic trading firms register with regulators, maintain risk management systems, and face penalties when their algorithms cause market disruption. The SEC’s Market Access Rule requires brokers to implement pre-trade risk controls for automated trading. FINRA requires firms to have supervisory procedures for algorithmic strategies. MiFID II in Europe imposes specific obligations on high-frequency traders. Crypto exchanges offering agent trading to retail users face no equivalent requirements.
This gap will close. The question is whether it closes before or after a significant agent-driven market event creates the political pressure to act.
What a competitor could not write: the MCP monoculture risk
Here is a structural risk that no platform has disclosed: MCP is an open standard, but it is not a diverse standard. Anthropic created it. The major AI labs adopted it. The exchanges built on it. If a vulnerability is discovered in the MCP specification itself, or in the way exchanges implement MCP authentication, every agent-trading platform built on the standard is exposed simultaneously.
This is not speculative. Open standards have had specification-level vulnerabilities before. OpenSSL’s Heartbleed bug in 2014 affected every system using the library. Log4Shell in 2021 compromised systems across industries. A similar vulnerability in MCP would affect every exchange, every agent, and every user simultaneously.
The mitigating factor is that MCP is relatively simple compared to OpenSSL or Log4j. It is a protocol for discovering and invoking capabilities, not a cryptographic library or a logging framework. The attack surface is smaller. But “smaller” is not “zero,” and the industry is building critical financial infrastructure on a standard that has been in production for less than a year.
The specific risk vector is authentication. MCP defines how an agent discovers and invokes capabilities, but the authentication layer (how the agent proves it has permission to trade) is implemented by each exchange independently. If Binance’s MCP authentication implementation has a flaw, an attacker could potentially instruct an agent to execute unauthorized trades within the sub-account. The no-withdrawal guardrail would still hold, but the attacker could drain the sub-account’s value through market manipulation: buy a thinly traded token at inflated prices, sell at a loss, repeat until the balance is zero.
No independent security audit of any exchange’s MCP implementation has been published as of August 2026. The industry is asking users to trust infrastructure that has not been publicly tested.
What to watch
– Binance Agent OS trading volume within 30 days of launch. If volume exceeds $1 billion, it signals retail adoption at scale and accelerates the regulatory timeline.
– The first reported agent-driven liquidation cascade. This event will define the regulatory and media narrative around agent trading for years.
– CFTC or SEC guidance on AI agent trading. Any advisory, no-action letter, or proposed rule specifically addressing autonomous trading agents in crypto markets.
– MCP specification updates and security audits. Anthropic’s release cadence and whether independent security audits of the protocol are published.
– Convergence or divergence in custody models. Whether the industry settles on one architecture (exchange-hosted sub-accounts appear to be winning) or continues with multiple competing models.
What is Binance Agent OS?
Binance Agent OS is a developer platform launched on Aug. 20, 2026, that lets AI agents such as ChatGPT and Claude connect to Binance’s exchange to read market data, check balances, and execute trades across spot, margin, convert, and futures products through Model Context Protocol.
Can an AI agent withdraw my funds from Binance?
No. Agents operate through isolated sub-accounts with no withdrawal scope. An agent can trade within the sub-account but cannot move funds to external wallets. However, an agent can still lose money through bad trades or liquidated positions.
What is Model Context Protocol?
Model Context Protocol is an open standard created by Anthropic that gives AI applications a uniform interface for connecting to external tools. It allows agents to discover capabilities (such as trading or data access) offered by a service and interact with them through a standardized format.
Which other exchanges offer AI agent trading?
As of August 2026, Coinbase, Gemini, MetaMask (self-custodial wallet), MoonPay, and Ledger have all launched agent-trading products. Each uses a different custody model, from exchange-hosted sub-accounts to hardware-wallet spending caps.
Who is liable if an AI agent loses money on a trade?
Under the current terms of service at every major platform, the user bears full responsibility. Exchanges provide infrastructure and disclaim liability for agent-driven losses. No regulator has proposed an alternative liability framework for agent-driven trading.
Could AI agents cause a flash crash in crypto markets?
The risk exists. If many agents use the same underlying model, they may develop similar market views and execute similar trades simultaneously. The August 2007 “Quant Quake” in traditional finance showed how model convergence can amplify losses across independently operated systems.
Has any regulator addressed AI agent trading in crypto?
No. The SEC’s proposed Regulation Crypto Assets framework and the CLARITY Act do not specifically mention AI agents. The CFTC has not issued guidance. In traditional finance, the SEC’s Market Access Rule and FINRA supervisory requirements cover algorithmic trading, but no equivalent rules exist for crypto agent trading.
Is it safe to let an AI agent trade crypto for me?
The technology is new and largely untested at scale. Guardrails such as isolated sub-accounts and no-withdrawal policies reduce the risk of theft, but they do not prevent trading losses. No independent security audit of any exchange’s MCP implementation has been published. Binance itself advises users to review each order before confirming. This is educational analysis, not investment advice.
Disclaimer: This article is for informational purposes only and does not constitute financial, investment, or legal advice. Cryptocurrency markets are volatile, and past performance does not guarantee future results. Always conduct your own research. Published Aug. 21, 2026.
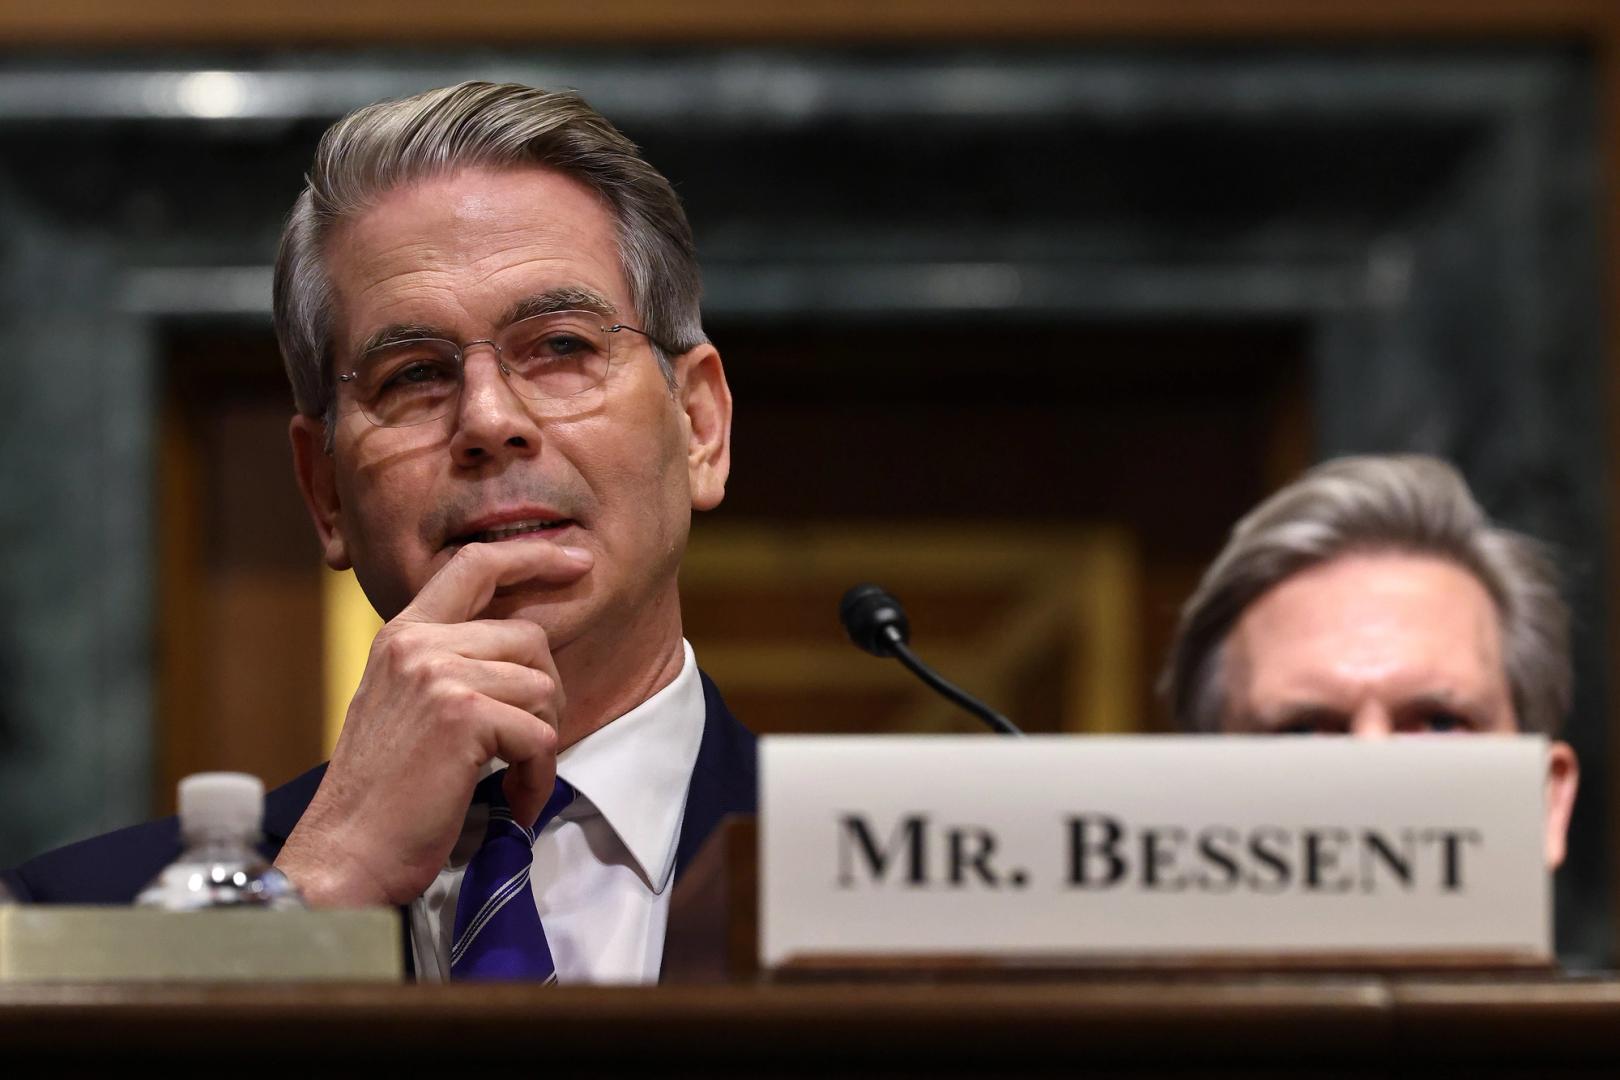
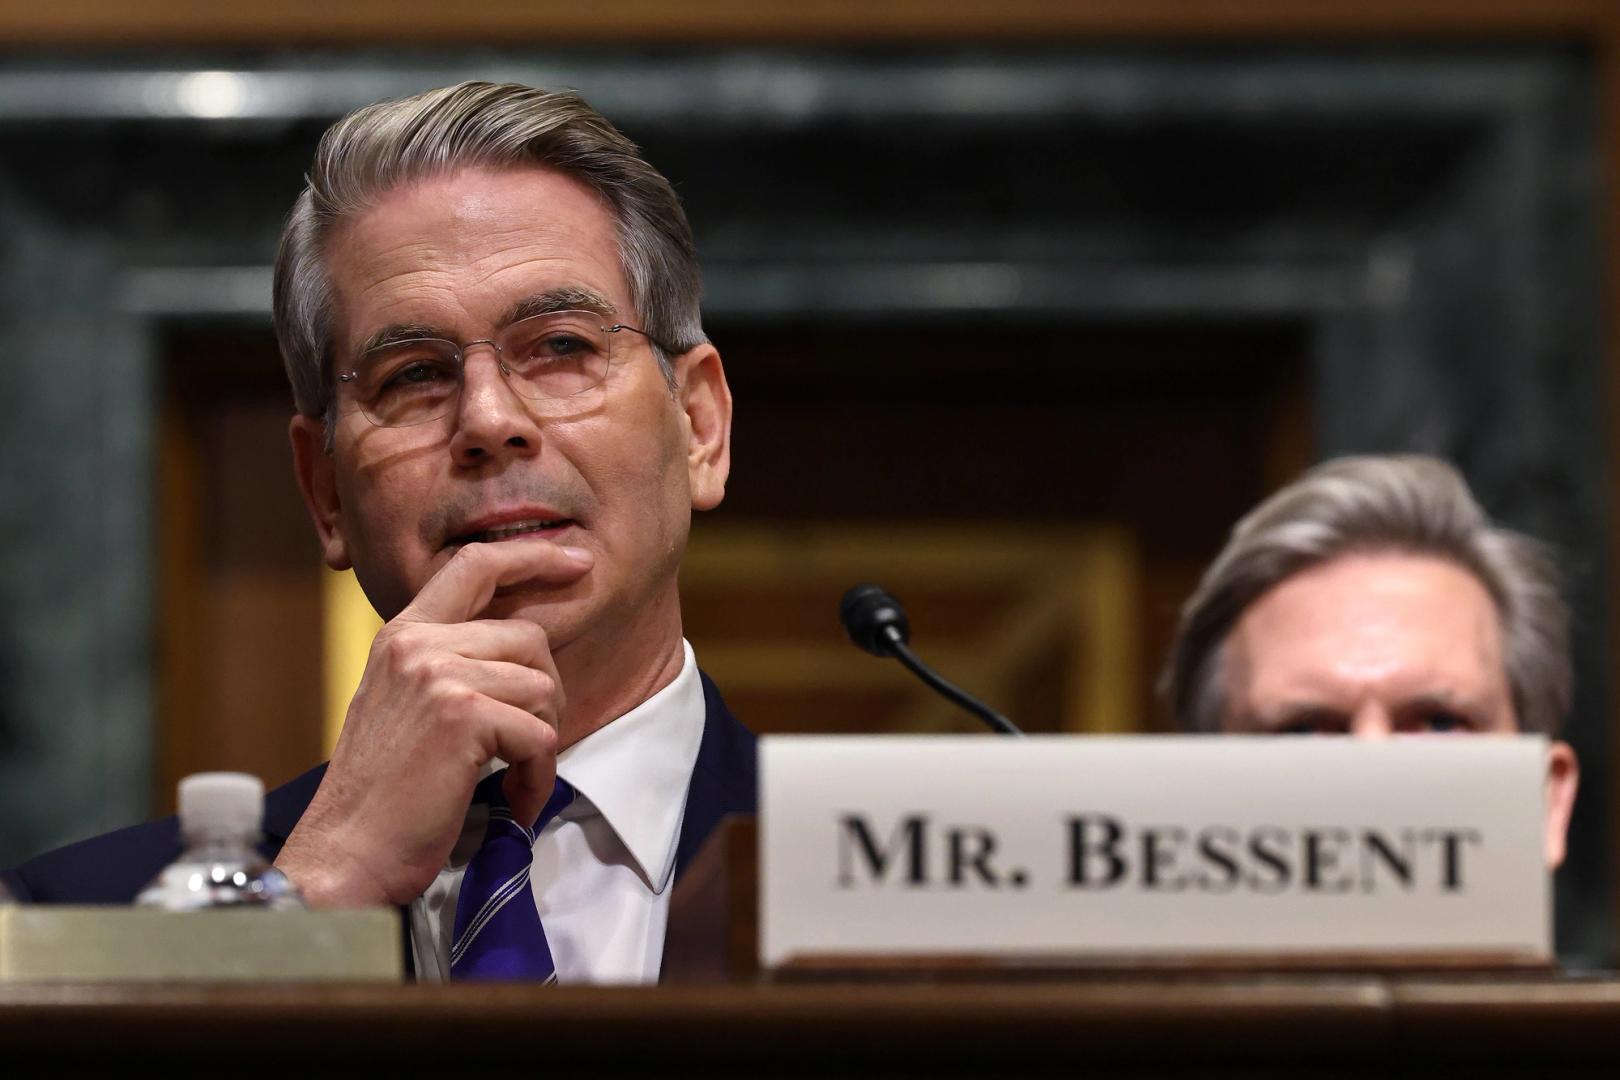
Treasury buybacks are not QE, analysts said, but the move helped pull long-term yields off 19-year highs and triggered a record short squeeze in a market already leaning too bearish.
The cryptocurrency market is on the move again, but this time the altcoins have taken the spotlight. Ripple’s XRP has reemerged from the $1.00 support and skyrocketed past $1.65 for the first time in many, many months, surpassing BNB on the way.
Meanwhile, bitcoin has rebounded from the dip to $76,200 and sits well above $78,000 now.
XRP Overtakes BNB as Alts Explode
What a time to be an altcoin investor, right? Let’s take XRP, for example. It dipped below $1.00 less than a week ago and fought for that level for days. However, the broader market’s rebound on Wednesday helped it recover significantly. It first flew to $1.40 but managed to break out even further and now trades above $1.65. This means it has soared by over 65% since Wednesday. Moreover, it’s now ahead of BNB in terms of market cap, even though the latter has soared by 10% on its own.
SOL, HYPE, DOGE, ADA, LINK, XLM, BCH, CC, and LTC have also posted double-digit gains today. ZEC has stolen the show with a 40% surge to $820. ETH has reclaimed the $2,500 level after another 7% pump.
Official Trump (TRUMP) has gone on a tear as well. It’s back in the top 100 alts by market cap after skyrocketing by over 60% in the past day.
The cumulative market cap of all crypto assets has added another $100 billion daily (and $500 billion since Wednesday) and is up to $2.760 trillion on CG.

BTC Eyes $80K Again
The primary cryptocurrency led the charge on Wednesday when it exploded from under $65,000 to $70,000 at first. After a brief pause, it went on the offensive again in the following days, surging to $72,000 and $75,000 later on.
The culmination, at least for now, took place on Friday when it came inches away from tapping $80,000 for the first time in just over three months. However, it was stopped there after gaining $15,000 in 48 hours and slipped to just over $76,000.
The bulls have managed to defend that level, and BTC now trades over two grand higher. Its market cap is at $1.575 trillion, while its dominance over the altcoins has been reduced slightly from 57.9% to 57.1%.

The post XRP Explodes 65% and Flips BNB as Altcoins Steal the Show: Weekend Watch appeared first on CryptoPotato.
Coinbase CEO Brian Armstrong says crypto spot trading is close to its next bull market, citing prior bear cycles that each ran roughly 370 to 380 days.
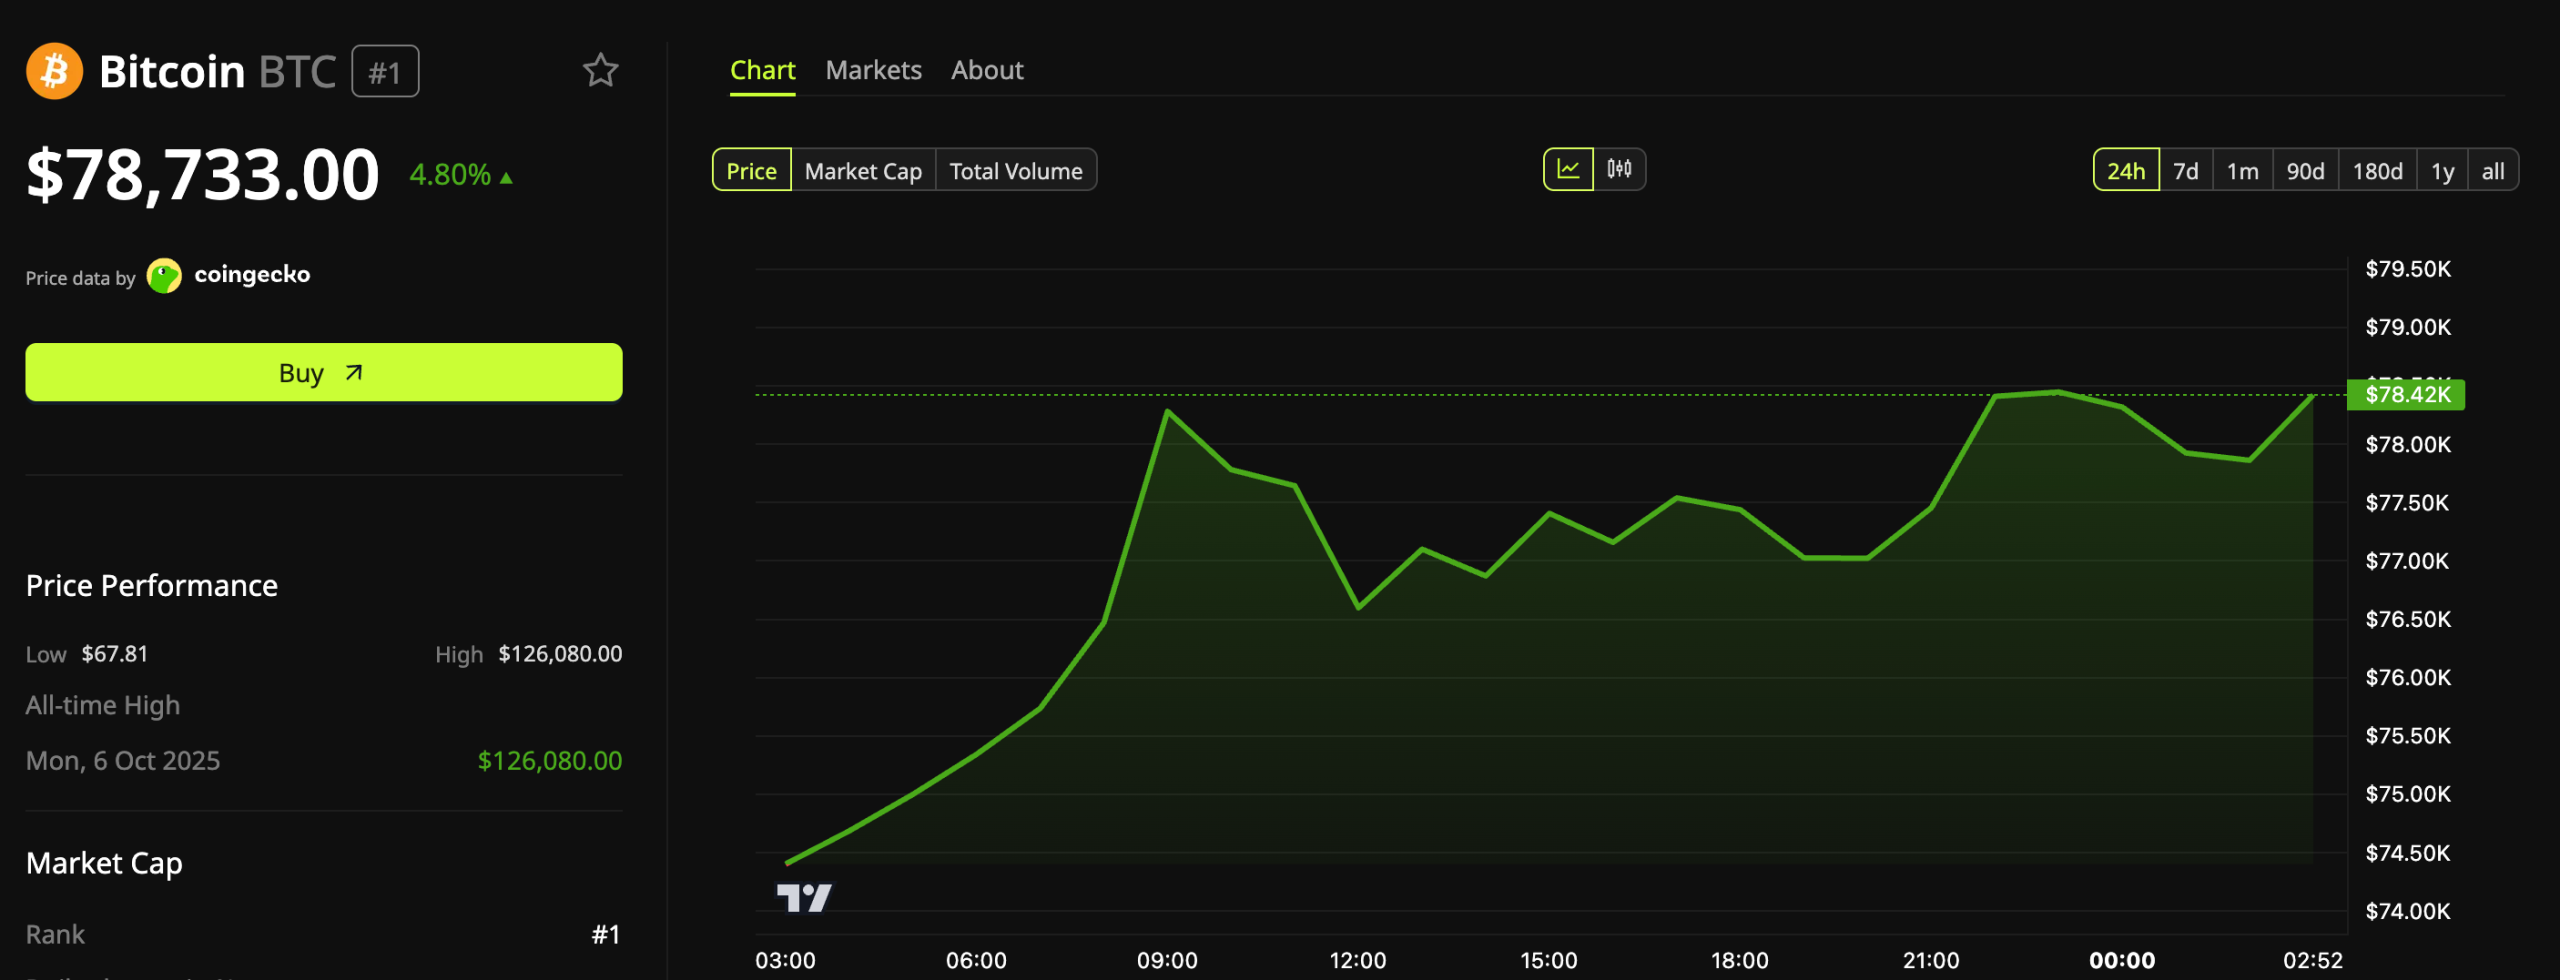
He spoke on CNBC after President Donald Trump hosted crypto executives and regulators at the White House. Bitcoin (BTC) has since climbed above $78,000.
Trading Activity Had Been Sliding for Months
Armstrong’s call follows a long stretch of thinning volumes and volatile prices. Spot turnover across 14 major exchanges dropped 21.7% in July to $429.0 billion from $547.9 billion in June, according to Wu Blockchain.
Every one of the 14 venues posted a monthly decline. Binance led with $196.5 billion, or 45.8% of the total. Coinbase recorded a 26.4% drop, the second steepest after Bitfinex at 59.7%.
Derivatives cooled too, falling 11.1% to $3.03 trillion. However, the futures-to-spot ratio climbed to 7.06x from 6.21x, showing traders leaned harder into leverage.
Sentiment also stayed depressed well into August, with the Fear and Greed Index sitting at 29 on August 13.
Follow us on X to get the latest news as it happens
A Bond Market Move Started the Turn
The mood shifted sharply on August 19. The Treasury doubled its bond buyback operations to at least $4 billion each and raised them from two to four per quarter, a plan that starts September 9.
Yields dropped on the news. The 10-year note closed 5.7 basis points lower at 4.647%, while the 30-year fell 9 basis points to 5.196%, according to CNBC.
Furthermore, President Donald Trump suggested that a sizable government purchase of Bitcoin has been discussed. Bitcoin has gained roughly 22% since that day and traded near $78,700 on Saturday.

Sentiment has flipped with it, and the Fear and Greed Index reached 71 at press time.
Armstrong Builds His Bull Case Around the Clock and the Calendar
Armstrong’s argument for a bull market with the cycle length. He said spot crypto trading has been in a bear market for about a year, and that each prior bear phase lasted roughly 370 to 380 days.
“We’re basically coming right up against that where people, you know, they’re going to say, well, this one’s about over. It’s time for the next bull run in crypto,” he stated.
Two catalysts sit on top of that. Armstrong pointed to the September 15 Senate vote for the CLARITY Act and to October through December, months he described as traditionally strong for Bitcoin under halving cycles.
“So I think there’s a good chance we’re on the cusp of the next bull market for spot trading in crypto,” he said.
Nonetheless, analyst Benjamin Cowen still puts a “decent chance” of one final selloff if prior midterm years repeat.
Subscribe to our YouTube channel to watch leaders and journalists provide expert insights
The post Coinbase CEO Brian Armstrong Sees Crypto Bull Market Starting Soon appeared first on BeInCrypto.


Capital.com plans to introduce spot cryptocurrency services in the United Arab Emirates after its affiliate, Capital Vault, received a virtual asset license from the UAE Capital Market Authority.
Summary
- Capital Vault received a UAE license covering virtual asset dealing, matching, custody, execution and settlement.
- UAE clients will eventually buy and hold actual crypto assets through the Capital.com application directly.
- Capital Vault will operate separately, with dedicated governance, custody and risk management arrangements for clients.
- The planned spot service differs from CFDs, which provide exposure without ownership of underlying cryptocurrencies.
- Capital.com has not announced the service launch date, supported cryptocurrencies, pricing or minimum account requirements.
Capital.com announced the approval on Aug. 21. The license authorizes Capital Vault to deal in virtual assets as an agent or matching principal and provide custody services for clients.
Once the service launches, eligible UAE customers will be able to buy and hold actual crypto assets through the Capital.com application. Capital Vault will handle trade execution, custody and settlement.
Capital.com did not disclose a launch date, list of supported cryptocurrencies, trading fees or minimum account requirements. The availability of every product may also depend on customer eligibility and local regulatory conditions.
Capital.com will offer ownership beyond CFD exposure
Capital.com currently provides crypto market exposure through contracts for difference in supported jurisdictions. A CFD tracks the price of an asset without transferring ownership of the underlying cryptocurrency to the trader.
The planned spot service changes that structure. Customers will acquire crypto held through Capital Vault rather than entering a derivative contract with exposure to price movements.
This distinction also changes how the product operates. Spot customers require custody and settlement arrangements, while CFD positions remain contracts between the broker and its clients.
Crypto ownership does not remove financial risk. Spot assets can lose value, and customers also depend on the custody provider’s operational, security and withdrawal procedures. Capital.com has not yet published detailed customer terms for the UAE service.
The company already operates a separate UAE brokerage entity, Capital Com MENA Securities Trading. Capital.com’s disclosure lists that business under CMA license number 20200000176 for its existing financial services.
Capital Vault will keep crypto operations separate
Capital Vault will operate as a separate regulated entity. Its governance, custody and risk arrangements will remain separated from Capital.com’s other regulated businesses, according to the announcement.
The affiliate has opened an Abu Dhabi office and is building a local digital asset team. The company did not disclose the number of employees hired or the size of its planned UAE investment.
Capital Vault’s authorization comes from the federal Capital Market Authority. It should not be confused with licenses issued inside the Abu Dhabi Global Market or by Dubai’s Virtual Assets Regulatory Authority, which operate under separate regulatory structures.
Capital Vault also has a European entity. Cyprus regulator CySEC’s public register lists Capital Vault Ltd as an authorized crypto asset service provider under the European Union’s Markets in Crypto Assets framework.
The European authorization covers custody, crypto exchanges, order execution and transfer services. However, the Cyprus and UAE entities remain subject to their respective local rules.
UAE framework expands regulated crypto activities
The Capital Market Authority introduced an updated virtual asset framework in April 2026. It expanded the number of regulated activities from three to eight.
The framework covers dealing, brokerage, custody, portfolio management, transfer services and alternative trading systems. It also establishes requirements for business conduct, capital, governance and anti money laundering controls.
The new rules provide a federal route for companies operating outside the UAE’s financial free zones and Dubai’s VARA jurisdiction. Capital Vault’s license gives Capital.com a path to add spot ownership alongside its established leveraged trading business.
Other companies have also broadened regulated digital asset services in the UAE. As previously reported, Binance secured exchange, clearing and custody permissions in Abu Dhabi through separately regulated entities.
In related coverage, Crypto.com received approval supporting regulated UAE payment services, while Bitpanda expanded into Dubai through a broker dealer license.
Capital.com must now complete its product and operational rollout. The next confirmed developments should include the launch date, available assets, fees, custody terms and rules governing deposits and withdrawals.


Six weeks of bearish positioning ended in 24 hours. Here is how the trade unwound, who got caught, and whether the squeeze has legs.
Summary
- More than $3 billion in leveraged short positions were liquidated across crypto derivatives markets on Aug 19 and 20, 2026, making it the eighth largest liquidation event on record and the largest concentrated short squeeze since November 2021.
- Bitcoin climbed from an intraday low near $64,100 to a peak above $72,000, while Ethereum surged roughly 18% in 24 hours, its strongest single day move since March 2024.
- The U.S. Treasury doubled the maximum size of its liquidity support buyback operations for long dated bonds from $2 billion to $4 billion per operation, compressing yields and pushing risk assets higher.
- Binance absorbed approximately $518 million in liquidations, Hyperliquid roughly $513 million, and Bybit around $303 million, with short positions accounting for 92% of all forced closures.
- The expanded buyback program runs only through Nov. 4, 2026. If long end yields stabilize by then, there is no guarantee that the larger operation size continues, limiting the macro tailwind.
Crypto derivatives markets had been building toward this moment for six weeks. Open interest in Bitcoin perpetual futures climbed steadily through July, with funding rates drifting negative as traders added to short positions. Bearish bets outnumbered bullish ones on every major exchange. On Binance, shorts held 51.64% of open interest. On OKX, 51.13%. On Bybit, 52.25%. The consensus was clear: the market was going lower.
Then, over the span of 24 hours, it went violently higher.
What triggered the squeeze
The first catalyst landed on Aug. 19 at approximately 2:30 PM UTC, when the U.S. Treasury announced it would at least double the maximum size of its liquidity support buyback operations for 10 to 20 year and 20 to 30 year nominal coupon securities. The cap moved from $2 billion to $4 billion per operation, effective Sep. 9 through Nov. 4.
Treasury buybacks are not quantitative easing. The department buys back illiquid, off the run bonds and replaces them with fresh, on the run issuance. The net effect on the government balance sheet is roughly neutral. But the market impact is not. By removing duration from the market, buybacks compress long end yields and improve liquidity conditions across risk assets. For more on the mechanics, see our breakdown of how the $4 billion Treasury buyback moved Bitcoin 8% in a day.
Bitcoin responded within minutes. The price moved from $64,100 to $66,800 in the first hour after the announcement. That initial move was enough to trigger the first wave of margin calls on leveraged shorts, and the cascade began.
The liquidation cascade
The mechanics of a short squeeze in crypto derivatives are straightforward but brutal. When a short position on a perpetual futures contract falls below its maintenance margin, the exchange liquidates it by placing a market buy order. That buy order pushes the price higher, which triggers more liquidations, which generates more buy orders. The feedback loop continues until the selling pressure from remaining shorts can absorb the forced buying.
On Aug. 19 and 20, the loop ran for roughly 18 hours before stabilizing.
Total liquidations across all major exchanges exceeded $3 billion. Short positions accounted for approximately $2.77 billion, or 92% of the total. Long liquidations were a rounding error at $264 million. According to CoinGlass data, roughly $1.29 billion in short positions closed within a single hour, the fastest concentrated squeeze of 2026. As we reported when Bitcoin first broke past $68K on the initial $1 billion short squeeze wave, the cascade was just beginning.
The breakdown by exchange reveals how concentrated the pain was. Binance saw approximately $518 million in liquidations. Hyperliquid, the decentralized perpetuals exchange that has grown rapidly this year, absorbed roughly $513 million. Bybit recorded around $303 million. The remaining liquidations spread across OKX, dYdX, and smaller venues.
Bitcoin shorts accounted for approximately $1.37 billion of the total, while Ethereum shorts contributed roughly $1.01 billion. The remainder came from altcoin positions, with Solana, XRP, and Dogecoin among the most affected.
The exchange level data reveals a secondary pattern that the headline numbers obscure. On Hyperliquid, a decentralized exchange that does not use a traditional order book for liquidations, the insurance fund absorbed roughly $47 million in losses during the cascade. The fund, which stood at approximately $380 million before the event, dropped to $333 million by the time the squeeze stabilized. On Binance, the auto deleveraging system activated twice during the peak liquidation hour, forcing profitable long traders to partially close their positions to cover the counterparty shortfall. These mechanisms prevented cascading failures at the exchange level but added to the speed and violence of the price move.
The altcoin liquidation data adds granularity that the Bitcoin and Ethereum headlines miss. Solana perpetual futures saw approximately $187 million in short liquidations, driven by the same macro catalysts plus the additional momentum from cumulative SOL ETF inflows crossing $1.16 billion earlier in the week. XRP shorts lost roughly $142 million, with the asset rallying 10% alongside the broader market. Dogecoin, which had seen a buildup of speculative short positions during a quiet July, contributed approximately $89 million. These figures matter because altcoin liquidations tend to be more violent per dollar of open interest. Altcoin perpetual markets are thinner, with fewer market makers and wider spreads. When liquidations cascade through these markets, the price impact per dollar liquidated is significantly larger than in Bitcoin or Ethereum.
Why the positioning was so extreme
The bearish lean in crypto derivatives markets did not appear overnight. It built over six weeks, from early July through mid August, during a period when multiple headwinds converged.
The CLARITY Act, the most comprehensive crypto market structure bill to reach the Senate floor, stalled after its procedural vote was postponed to September. The SEC finalized its “Regulation Crypto Assets” framework, which some market participants interpreted as an attempt to preempt Congressional legislation. For more on how these two frameworks conflict, see our analysis of SEC regulation crypto assets vs the CLARITY Act. Bitcoin had traded in a narrowing range between $60,000 and $66,000 since late June, with each rally attempt meeting selling pressure near the upper bound.
Funding rates on Bitcoin perpetual futures turned negative in late July and stayed negative through mid August, meaning that short traders were being paid to hold their positions. That dynamic attracted more shorts, creating a self reinforcing cycle of bearish positioning.
The numbers tell the story precisely. On Aug. 18, one day before the squeeze, the eight hour funding rate on Binance Bitcoin perpetual futures stood at negative 0.012%, a level that had persisted for three consecutive weeks. At negative funding, traders holding short positions receive a payment from traders holding long positions every eight hours. The payment is small in absolute terms but compounds meaningfully over weeks. A trader with a $10 million short position at negative 0.012% funding received approximately $3,600 per day simply for maintaining the position. That dynamic attracted capital into shorts not because of a directional thesis but because of the yield. When the forced unwind came, many of these yield seeking shorts had no thesis to defend and no plan for a stop loss.
The result was a market that was heavily one sided. When the Treasury announcement provided a fundamental reason for risk assets to rally, the positioning was too extreme to absorb the move without forced buying.
The second catalyst: the White House summit
The Treasury announcement alone might not have been sufficient to produce a $3 billion liquidation event. But it was followed within hours by reports that President Trump would host a crypto industry summit at the White House, attended by senior SEC officials and executives from major exchanges.
The summit, confirmed for late August, signaled that the administration remained committed to a regulatory framework favorable to the crypto industry. Coming on top of the Treasury buyback expansion, it created a second wave of short covering that pushed Bitcoin from $68,000 to above $71,000 on Aug. 20.
The combined effect of both catalysts was greater than either alone. The Treasury announcement provided the fundamental case for higher prices. The White House summit provided the narrative. Together, they forced the most aggressive unwind of bearish positioning since the collapse of FTX sent the market into a tailspin in November 2022.
How Ethereum outperformed
Ethereum’s 18% single day move was the standout of the squeeze. While Bitcoin gained roughly 8%, Ethereum outperformed by a factor of more than two. The reason lies in the composition of the short positions that were liquidated.
Ethereum shorts on major exchanges had grown disproportionately through July and August, partly because of skepticism about the Pectra upgrade timeline and partly because of persistent outflows from Ethereum spot ETFs. The net short positioning in Ethereum perpetual futures was, relative to open interest, more extreme than in Bitcoin.
When the squeeze began, Ethereum’s thinner order books amplified the price impact. Trading volume on Ethereum pairs surged 402% in 24 hours, according to AMBCrypto data. The asset moved from approximately $1,920 to above $2,270 before stabilizing near $2,250. For our full Ethereum price prediction, see our dedicated analysis.
The rally also exposed a structural risk in DeFi. On Aave, the largest decentralized lending protocol, just 9% of positions carry roughly half of the platform’s total debt. These positions are built around a leveraged Ethereum staking correlation trade, using WETH debt against liquid staking collateral like weETH, rsETH, and wstETH. The average health factor on these positions sits near 1.06, meaning an 8% to 9% wrapper discount could trigger a liquidation cascade on chain.
The staking correlation trade that dominates Aave’s risk profile operates on a simple premise that conceals significant complexity. A trader deposits weETH, a liquid restaking token issued by EtherFi, as collateral on Aave. The trader then borrows WETH against that collateral at a loan to value ratio near 90%. The borrowed WETH is restaked through EtherFi to produce more weETH, which is deposited again as collateral. Each loop multiplies both the staking yield and the leverage. At 10 times leverage, the effective annual yield on the trader’s equity approaches 40% to 50% before accounting for borrowing costs and gas fees. The trade is profitable as long as weETH maintains its peg to ETH within a narrow band. The moment the wrapper discount exceeds the health factor buffer, the entire recursive structure unwinds through liquidation.
The Aug. 20 rally did not trigger that cascade because ETH moved higher, not lower. But the concentration of risk in a small number of highly leveraged positions remains a vulnerability. If Ethereum corrects sharply from current levels, the same positions that survived the upside squeeze could face liquidation on the way down.
The institutional side of the trade added another layer to Ethereum’s outperformance. U.S. spot Ethereum ETFs, which had recorded net outflows for much of July and early August, posted net inflows of approximately $189 million on Aug. 19 alone. The reversal in ETF flows suggests that institutional investors were not only covering short positions in derivatives but also adding long exposure through regulated products. Weekly ETF inflow figures strengthened in tandem, signaling that the squeeze may have catalyzed a broader reassessment of Ethereum’s near term prospects among allocators who had been underweight the asset.
What the data says about follow through
Not every short squeeze leads to a sustained rally. The question is whether the forced buying created genuine demand or simply cleared out weak hands.
The evidence is mixed. On one hand, Bitcoin’s move above $72,000 broke a six week trading range and set a new short term high. Open interest has declined by approximately 15% since the squeeze, suggesting that leveraged positioning has been significantly reduced. Funding rates have turned positive, indicating that the market is no longer paying traders to be short.
On the other hand, the fundamental catalyst has a built in expiration date. The Treasury’s expanded buyback program runs only through Nov. 4, 2026. After that window closes, Treasury will reassess whether to maintain the larger operation size. If long end yields have stabilized by then, there is no guarantee that the program continues at its current scale.
The derivatives market structure itself has changed in ways that make comparisons to previous squeezes imprecise. Hyperliquid did not exist during the November 2021 squeeze. The decentralized exchange now handles roughly 15% of all crypto perpetual futures volume, and its liquidation mechanism operates differently from centralized exchanges. On Hyperliquid, liquidations are processed through a decentralized backstop pool rather than an insurance fund controlled by a single entity. The pool’s participants absorb losses in exchange for a share of liquidation fees during normal operations. During the Aug. 19 cascade, backstop participants absorbed approximately $47 million in losses, raising questions about whether the pool’s capitalization is sufficient for events of this magnitude.
The macro backdrop also remains uncertain. The Federal Reserve has not signaled rate cuts, and the next FOMC meeting in September could introduce volatility regardless of the crypto specific catalysts. The interplay between macro policy and crypto positioning has rarely been this tight, and the next two weeks will determine whether the squeeze was a reset or a turning point.
Historical parallels
The Aug. 19 squeeze is the eighth largest liquidation event in crypto history by total dollar value. But context matters. Measured as a percentage of total open interest, it ranks higher because the derivatives market in 2026 is smaller than it was during the 2021 bull market peak.
The closest parallel is the November 2021 squeeze that followed Bitcoin’s run to $69,000, which produced roughly $4.2 billion in liquidations. That event marked a local top. The March 2024 squeeze, which preceded Bitcoin’s all time high above $73,000, produced approximately $2.1 billion in liquidations and preceded a sustained rally. The bank custody race that followed the March squeeze suggests institutional infrastructure was a key factor in sustaining that rally.
The difference between a top signal and a continuation signal lies in what happens to open interest after the squeeze. If new positions rebuild quickly on the long side, the market may be setting up for another round of leverage driven volatility. If open interest stays depressed, the squeeze may have cleared the decks for a more organic move higher.
Another variable that distinguishes 2026 from previous squeeze events is the regulatory environment. In November 2021, crypto regulation in the United States was largely absent. By August 2026, the SEC has finalized its Regulation Crypto Assets framework, the CLARITY Act is moving through the Senate, and multiple spot crypto ETFs trade on regulated exchanges. This regulatory infrastructure creates both a floor and a ceiling for price action. The floor comes from institutional capital that can now access crypto through regulated products. The ceiling comes from the compliance costs and operational constraints that regulation imposes on market participants. Whether the post squeeze rally finds sustained support may depend less on derivatives positioning and more on whether the regulatory catalysts produce concrete outcomes before their momentum fades.
What to watch
The aftermath of a squeeze of this magnitude typically unfolds over two to four weeks. The initial move is mechanical, driven by forced buying. The follow through depends on whether new capital enters the market or whether the same participants simply reposition. In 2024, the March squeeze preceded a sustained rally because spot Bitcoin ETFs were absorbing supply at a rate that exceeded the forced buying from liquidations. In 2026, the question is whether the combination of Treasury buyback expansion, a potential White House summit, and the CLARITY Act’s September procedural vote creates a similar supply absorption dynamic or whether the squeeze was a one time clearing event that exhausts bullish momentum. The answer lies in the data that will emerge over the next 14 days, and five indicators in particular deserve close monitoring.
- Funding rates over the next two weeks. If perpetual funding stays positive but moderate (below 0.03% per eight hours), the market is resetting rather than overheating. If funding spikes above 0.05%, leveraged longs are replacing the liquidated shorts, recreating the same vulnerability in the opposite direction.
- Treasury buyback execution from Sep. 9. The first operation under the expanded program will reveal whether the $4 billion cap is the floor or the ceiling. Larger than expected operations would compress yields further and support risk assets.
- Aave health factors on the wstETH/weETH correlation trade. The 9% of positions carrying half of Aave’s debt have average health factors near 1.06. A sharp ETH correction of 8% or more could trigger on chain liquidations that amplify the move.
- Open interest rebuild pace. If total open interest on Bitcoin perpetual futures recovers to pre squeeze levels within 10 days, traders are re leveraging quickly and another squeeze (in either direction) becomes likely.
- White House crypto summit outcomes. The late August meeting between the administration and crypto industry executives could produce concrete policy signals that either sustain or undercut the current rally.
What caused the $3 billion crypto short squeeze on Aug. 19?
The U.S. Treasury doubled its liquidity support buyback operations for long dated bonds from $2 billion to $4 billion per operation. The announcement compressed yields, pushed risk assets higher, and triggered a cascade of margin calls on leveraged short positions across crypto derivatives markets.
How much were total crypto liquidations on Aug. 19 and 20?
Total liquidations exceeded $3 billion across major exchanges, with short positions accounting for approximately $2.77 billion (92%) and long liquidations totaling roughly $264 million.
Which exchanges had the most liquidations?
Binance recorded approximately $518 million, Hyperliquid roughly $513 million, and Bybit around $303 million. The remainder spread across OKX, dYdX, and smaller venues.
Why did Ethereum outperform Bitcoin during the squeeze?
Ethereum had more extreme net short positioning relative to open interest, thinner order books, and a 402% surge in trading volume. These factors amplified the price impact, producing an 18% gain compared to Bitcoin’s roughly 8%.
Is the Treasury buyback program permanent?
No. The expanded $4 billion per operation program runs only from Sep. 9 through Nov. 4, 2026. Treasury will reassess after that window closes based on whether long end yields have stabilized.
What is the Aave concentration risk related to the Ethereum rally?
Just 9% of Aave positions carry roughly half of the platform’s total debt. These positions use leveraged Ethereum staking correlation trades with average health factors near 1.06. An 8% to 9% wrapper discount could trigger on chain liquidations.
How does this squeeze rank historically?
It is the eighth largest liquidation event in crypto history by total dollar value. By percentage of total open interest liquidated, it ranks higher because the 2026 derivatives market is smaller than the 2021 peak.
Could the squeeze reverse quickly?
If the Treasury buyback program does not continue after Nov. 4 and the Federal Reserve maintains restrictive monetary policy, the macro tailwind driving the rally could fade. However, the reduction in open interest suggests that leveraged positioning has been cleared, reducing the risk of an immediate reversal. This is educational analysis, not investment advice.
Disclaimer: This article is for informational purposes only and does not constitute financial, investment, or trading advice. Cryptocurrency markets carry substantial risk. Always conduct your own research before making any investment decisions. Published Aug. 21, 2026.
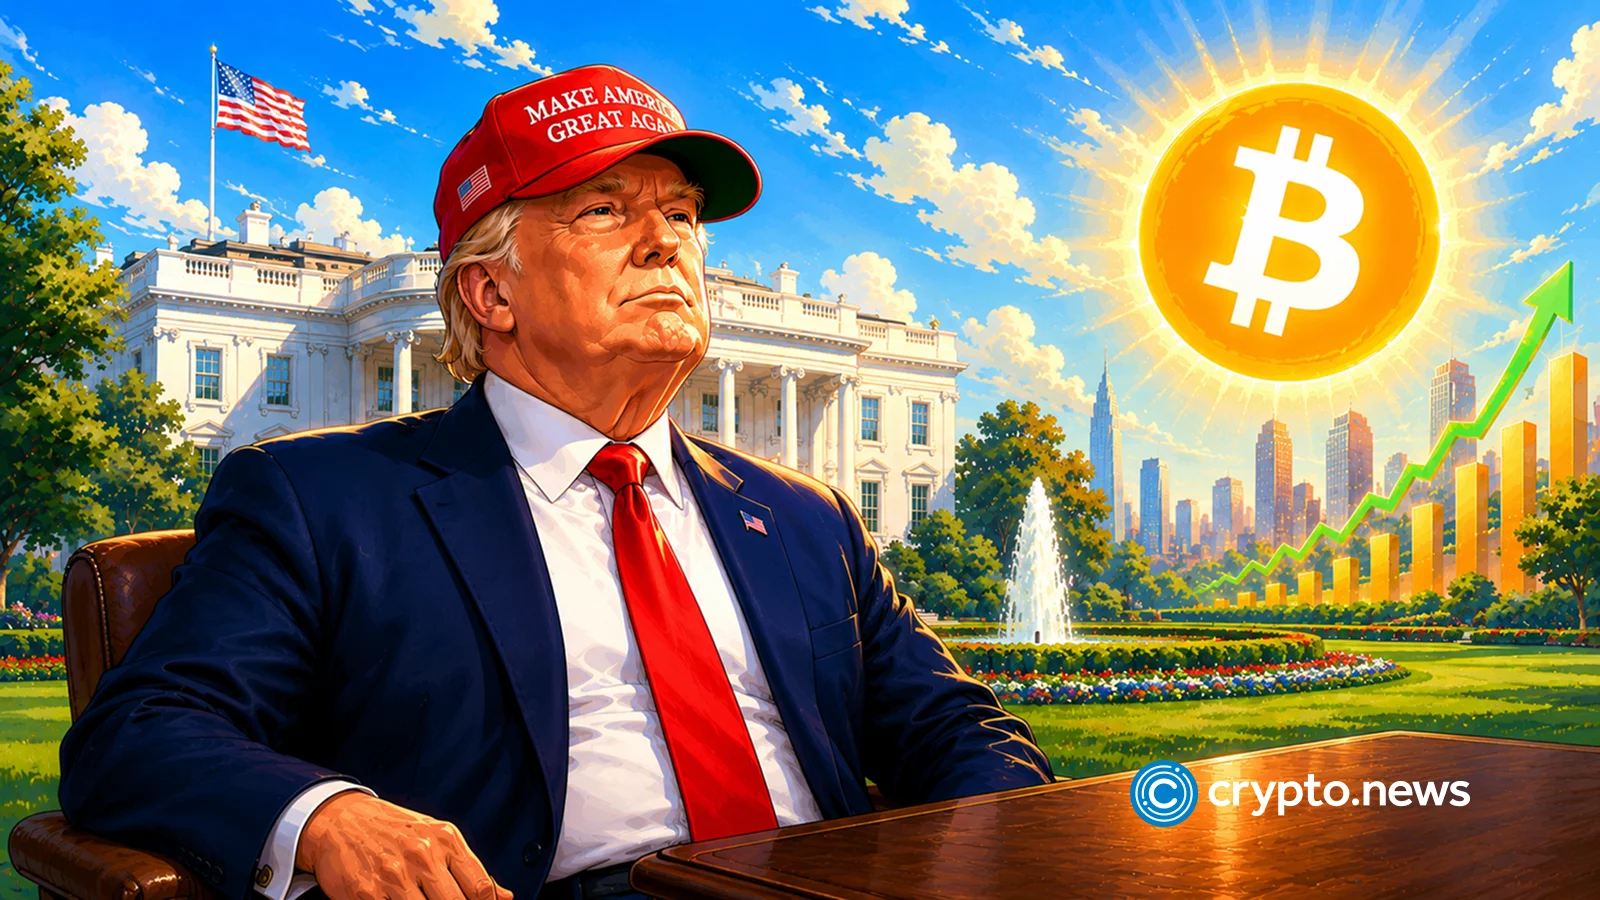
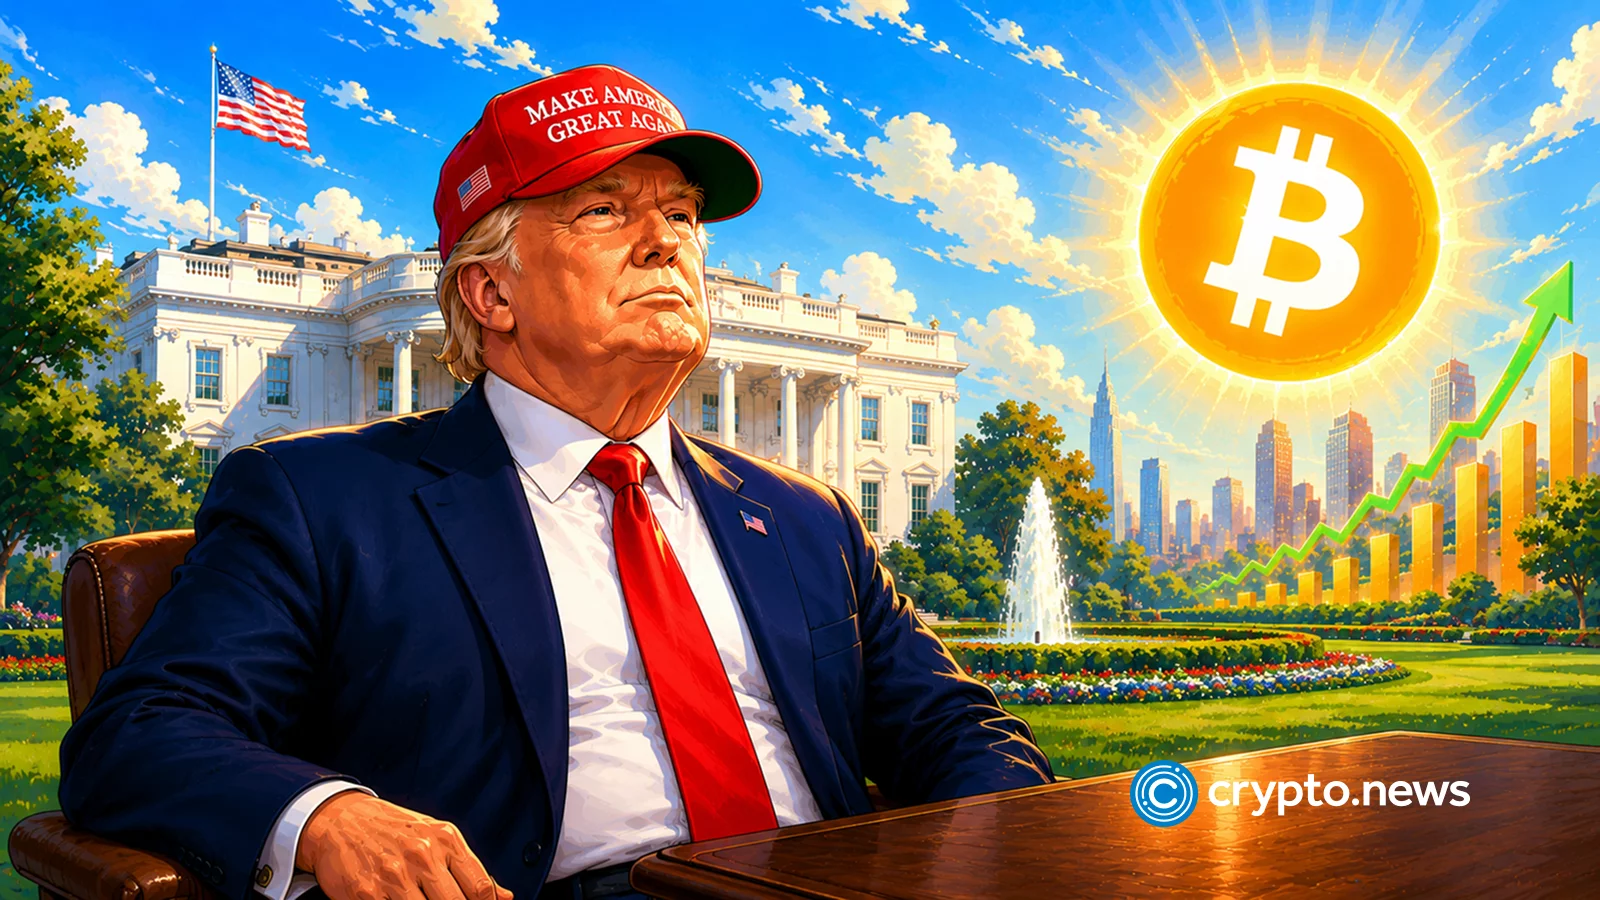
Most Americans believe President Donald Trump and his family should not earn money from cryptocurrency while he holds office, according to a Reuters/Ipsos poll released on Aug. 19.
Summary
- 63% of surveyed Americans called Trump family crypto profits inappropriate, while 32% considered them appropriate.
- 69% of Republicans considered the profits appropriate, while 92% of Democrats described them as inappropriate.
- 1,166 adults participated in the four-day Reuters/Ipsos poll with a three-point overall sampling error margin.
- Reuters calculated more than $1.4 billion in 2025 crypto income from Trump’s financial disclosure filing.
- 69% said private business interests influence presidential decisions, extending concern beyond cryptocurrency earnings and investments.
The survey found that 63% of respondents considered the Trump family’s crypto profits inappropriate. Another 32% viewed the activity as appropriate, while the remaining respondents did not answer the question.
Reuters and Ipsos conducted the nationwide online survey between Aug. 14 and Aug. 17. The poll included 1,166 U.S. adults and carried a margin of error of about three percentage points.
Trump crypto profits expose a partisan divide
Views differed sharply by political affiliation. About 69% of Republicans considered the family’s cryptocurrency earnings appropriate, according to the reported results. By comparison, 92% of Democrats said the activity was inappropriate.
The poll also examined broader concerns about private commercial interests. Around 69% of respondents said they believed Trump’s business interests influenced his presidential decisions. That included approximately two-thirds of independent respondents and nine in ten Democrats.
The findings measure public opinion and do not establish that Trump violated any law or influenced government policy for financial gain. The White House has consistently rejected allegations of a conflict.
“There are no conflicts of interest. The President only acts in the best interests of the American public,” White House spokesperson Anna Kelly told Reuters.
Trump has also said his investments are managed independently and that he does not participate in the family businesses’ daily operations.
Financial filing puts crypto income above $1.4 billion
The poll followed the publication of Trump’s annual financial disclosure in June. A Reuters analysis of the filing calculated that Trump reported more than $1.4 billion in income connected to cryptocurrency ventures during 2025.
The figure represents reported income rather than the current value of Trump’s personal cryptocurrency holdings. As crypto.news reported, the disclosure included more than $1 billion in crypto-related income from projects including World Liberty Financial and the Official Trump memecoin.
Companies linked to the Trump family received almost $800 million from World Liberty Financial activities, Reuters calculated. The total included more than $520 million connected to token sales and over $250 million from the sale of business interests.
The filing also reported approximately $635 million from licensing arrangements associated with the TRUMP token. In related coverage, blockchain analysis found that many buyers recorded substantial losses while Trump-linked entities continued receiving transaction-related revenue.
These figures should not be treated as a calculation of personal net profit. The disclosed revenue flowed through several companies and agreements, and some proceeds were shared among Trump family members and business partners.
Ethics concerns overlap with U.S. crypto policy
The debate comes as the Trump administration promotes legislation establishing clearer federal rules for digital assets. Lawmakers have disagreed over whether crypto market legislation should include restrictions on elected officials and their families.
As previously reported, proposed ethics provisions have become a central obstacle to advancing crypto legislation. Supporters argue that broad market rules remain necessary, while critics want stronger safeguards covering officials with financial interests in digital-asset businesses.
World Liberty Financial also received conditional approval on Aug. 14 to establish World Liberty Trust Company as a national trust bank. The Office of the Comptroller of the Currency listed the decision in its official records. Conditional approval does not allow immediate operations because the company must satisfy the regulator’s requirements before opening.
Congressional scrutiny, future financial disclosures and the conditions attached to World Liberty’s proposed trust bank will provide further tests of the separation between Trump’s public duties and family business interests. The Reuters/Ipsos results indicate that most Americans remain unconvinced that the current arrangements adequately address those concerns.


South Korea’s Shinhan Asset Management signed a four-party memorandum on Aug. 21 to test a Korean won tokenized fund using the Solana blockchain.
Summary
- Shinhan Asset Management signed a four-party agreement to test a won-denominated tokenized investment fund workflow.
- The Solana pilot covers investor checks, issuance, distribution and onchain liquidity during proof of concept.
- Etherfuse supplies tokenization infrastructure while Orca supports onchain liquidity design for fund distribution testing workflows.
- Korea’s amended securities laws are expected to take effect in early 2027 after preparations conclude.
- The project remains a proof of concept and has no confirmed public launch date yet.
The agreement brings together Shinhan Asset Management, the Solana Foundation, tokenization platform Etherfuse and decentralized exchange Orca. The participants will conduct a proof of concept covering the fund’s issuance and distribution process.
The planned product would invest in short term Korean won bonds and target overseas institutional investors. However, the participants have not announced the fund’s size, expected yield or public launch date.
Shinhan will test the complete tokenized fund process
The proof of concept will examine the steps needed to issue and distribute a regulated tokenized fund. These include know your customer checks, anti-money laundering controls, token issuance and onchain liquidity arrangements.
Shinhan will provide asset management and regulatory expertise. Etherfuse will supply infrastructure for creating and managing the tokenized assets. Orca will help design the liquidity system used to distribute or exchange the fund tokens on Solana.
The Solana Foundation said the model draws from BlackRock’s BUIDL fund, one of the largest tokenized money market products. The comparison refers to the blockchain based distribution model. It does not mean the proposed Shinhan fund will hold the same assets or offer the same legal rights.
BlackRock’s product primarily invests in U.S. Treasury bills, cash and repurchase agreements. By comparison, Shinhan’s test concerns a Korean won product backed by short term domestic bonds.
Solana expands its institutional fund activity in Asia
Solana offers low transaction fees and rapid settlement, which could support frequent subscriptions, redemptions and transfers. However, those technical features do not remove securities registration, custody or investor protection requirements.
The network has already attracted other Asian asset managers. As previously reported, SBI Global Asset Management launched a tokenized Japanese equity fund on Solana in July. That product targets institutional and accredited investors through regulated tokenization platform DigiFT.
Shinhan has also been testing more than one blockchain. On Aug. 14, the asset manager signed a separate agreement with Plume to develop a demonstration for a won-denominated tokenized fund.
The parallel projects suggest Shinhan is examining different technical and distribution models rather than committing exclusively to Solana. Results from the tests could determine which infrastructure the manager uses after South Korea’s regulatory framework becomes effective.
Korea’s 2027 framework will determine any launch
South Korea’s National Assembly passed amendments supporting tokenized securities on Jan. 15. The legislation recognizes distributed ledgers as valid securities registries and permits qualifying investment contract securities to circulate through licensed securities companies.
The Financial Services Commission said issuers will still need to satisfy existing securities registration and disclosure obligations. Unlicensed companies will not be allowed to broker tokenized securities.
The amendments are expected to take effect one year after their promulgation, with implementation anticipated in early 2027. Regulators are preparing account management infrastructure and investor protection rules before the rollout, according to the FSC’s official statement.
As crypto.news reported, South Korean authorities are preparing rules for stocks, bonds and funds alongside a blockchain platform operated for the Korea Securities Depository.
Market forecasts remain uncertain
Solana said the existing tokenized real world asset market was worth about $36 billion. The announcement also cited a Boston Consulting Group projection suggesting the sector could reach as much as $30 trillion by 2030.
That projection should be treated as a forecast rather than an expected outcome. BCG’s more recent middle scenario estimates tokenized real world assets could reach $14 trillion by 2030 and $55 trillion by 2035. Its faster growth scenario places the market as high as $88 trillion by 2035.
Current adoption remains much smaller. In related coverage, publicly visible onchain assets grew to approximately $30 billion by mid-2026, led by private credit and tokenized government debt.
The next stage will involve completing the proof of concept and aligning the fund structure with Korea’s final rules. Any commercial launch will depend on regulatory approval, operational testing and demand from eligible overseas institutions.

the century-old method traders still use on Bitcoin

This $27 Amazon Bag Looks Like a Beloved Hermès Style

Coronation Street’s Tracy Shaw health update on cancer fight





-

 Fashion11 hours ago
Weekend Open Thread: Madewell – Corporette.com
-
 NewsBeat7 days ago
Myanmar says over 300,000 Rohingya refugees verified for repatriation as exodus enters ninth year
-

 Business4 days ago
SMA Solar Technology AG (SMTGY) Q2 2026 Earnings Call Transcript
-

 Politics7 days ago
SEQ Code: The Three Letter Boarding Pass Code That Could Give You The Worst Seat
-

 Tech4 days ago
Qwen3.8-27B runs frontier-class coding agents and reasoning locally, no cloud API required
-

 Crypto World4 days ago
OCC Greenlights Trump Family Crypto Firm for Trust Charter
-
 Entertainment7 days ago
Marvel Studios Reveals New X-Men Cast Including Adam Driver and Sadie Sink
-
 Tech7 days ago
Every fusion startup that has raised over $100M
-
 Business7 days ago
Monarch Mutual Fund set to enter MF space with maiden overnight fund; files draft with Sebi
-

 News Videos2 days ago
Don’t Leave Your Financial Future To Chance | August 19, 2026
-

 Business7 days ago
Cristiano Ronaldo’s Secret Wedding Deepens As Presenter Claims Family Learned ’30 Seconds’ Before
-

 Business7 days ago
Facebook Down Now? Users Report Login And Loading Problems As Outage Trackers Monitor Ongoing Issues
-
 Crypto World5 days ago
Data of 54K Wallet Users Leaked, Clarity Odds Just 10%: Hodler’s Digest, Aug. 16
-

 Crypto World4 days ago
NAVI Prime launches institutional lending framework on Sui
-

 Politics6 days ago
Britain is facing a housing disaster
-

 Business7 days ago
New Avengers Doomsday Trailer Drops at D23 Showing Robert Downey Jr as Doctor Doom
-

 Tech7 days ago
How to watch FIH Hockey World Cup 2026: FREE live streams, schedule
-

 Business6 days ago
Rebel Creamery files Chapter 11 with $23.8M Van Leeuwen judgment on appeal
-
 Crypto World4 days ago
Dow’s 3-Year Winning Run Isn’t a Crash Signal, Still 49% Odds of Double-Digit Gains
-
 Tech7 days ago
Enterprise SSDs now consume 48% of global NAND flash supply
You must be logged in to post a comment Login