
Crypto World
Diamond Chart Pattern: Structure and Market Context

The diamond chart pattern is a technical analysis formation that appears on price charts after a strong trend and often signals a trend reversal. The structure consists of a broadening phase (higher highs and lower lows) followed by a contracting phase (lower highs and higher lows), creating a shape that resembles a diamond. Traders analyse this pattern to identify trend exhaustion, breakout levels, and possible changes in market direction.
This article explains the structure of the diamond chart pattern, the market psychology behind it, and how to trade the diamond pattern.
What Is the Diamond Chart Pattern?
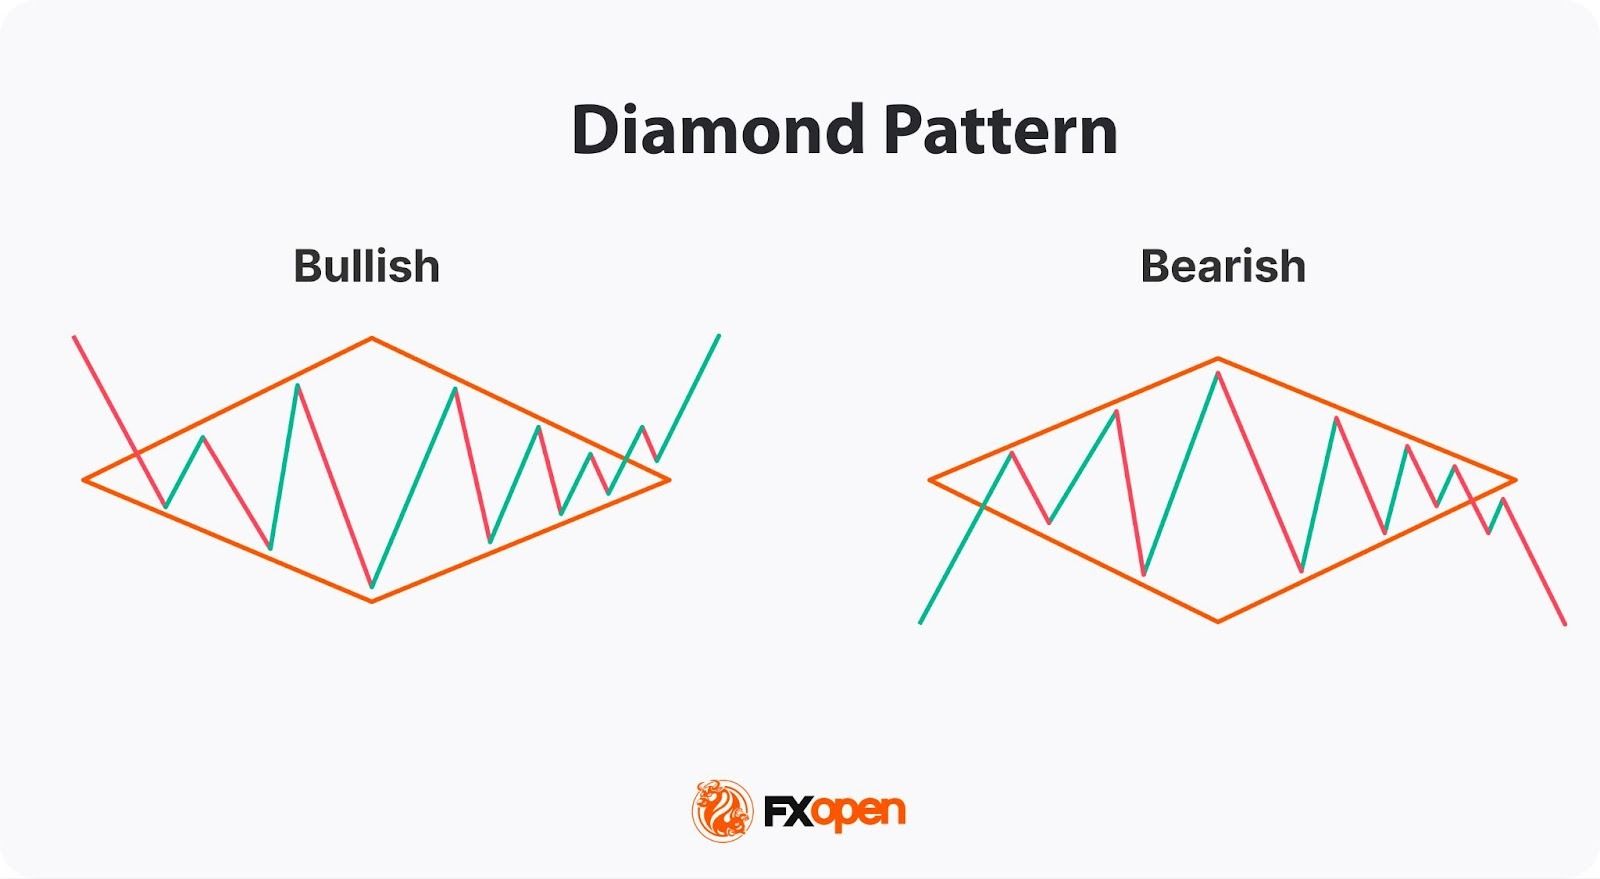
The diamond pattern is a technical analysis formation that develops after a strong trend and often signals a potential market reversal. It forms when price movements first create higher highs and lower lows, producing a broadening structure, and then shift to lower highs and higher lows, creating a contracting structure. Together these movements form a diamond-shaped pattern on the chart.
The diamond pattern can be either bearish or bullish, and it is also known as the diamond top pattern and diamond bottom pattern for trading. Both formations share the same structural characteristics but occur in different market conditions and signal different potential outcomes.
- A bearish diamond pattern occurs during an uptrend and signals a potential reversal to the downside.
- A bullish diamond pattern in trading forms during a downtrend and signals a potential reversal to the upside.
Market Psychology Behind the Diamond Pattern
The diamond pattern in trading reflects a gradual shift in market sentiment. During the expansion phase, price swings become wider as buyers and sellers compete for control of the market. This stage often reflects uncertainty and heightened volatility.
As the formation progresses, volatility begins to contract. Price movements become narrower, suggesting that the market is moving towards a new balance between supply and demand.
The eventual breakout from the pattern typically represents a decisive shift in control. If buyers dominate, the price may break upward. If sellers take control, the breakout may occur to the downside. For this reason, traders often analyse the diamond pattern as a signal of potential trend exhaustion and a possible change in market direction.
How to Identify a Diamond Pattern on a Chart
The diamond pattern has a distinctive but relatively straightforward structure. Traders follow certain steps to spot it on the chart.
- Look for a strong trend – A diamond usually forms after a strong upward or downward trend, when the market begins to lose momentum and volatility increases.
- Identify an expansion phase – Price forms a sequence of higher highs and lower lows, creating a broadening structure and reflecting increasing volatility.
- Identify a contraction phase – Price movements begin to narrow, producing lower highs and higher lows.
- Draw the trendlines – Traders outline the structure with four trendlines that form a diamond shape.
Diamond Pattern Statistics
The diamond chart pattern is less common than formations such as triangles or head and shoulders. However, it can precede significant price movements. Research by technical analyst Thomas Bulkowski shows that diamond bottom patterns break upward about 73–74% of the time, with an average rise of roughly 35–39% after the breakout. Diamond top patterns break downward about 54% of the time, with an average decline of around 17%.
How to Trade the Diamond Reversal Pattern
Like most chart patterns, this formation has particular rules traders can use to build their own trading strategies. These rules can be applied to the diamond pattern in forex, stock, commodity, and cryptocurrency* markets.
Entry
Traders typically buy after the price breaks above the upper boundary of the pattern and sell after the price falls below the lower boundary.
The breakout signals a potential trend reversal.
- If the breakout occurs above the upper trendline after a downtrend, it signals a bullish reversal.
- In the bearish diamond pattern, the breakout occurs below the lower trendline, which signals a bearish reversal.
Traders use several confirmation tools. The first one is rising trading volume. The breakout should be accompanied by an increase in trading volume. Low trading volumes usually signal a false breakout, whereby the price returns to its previous trend. Fakeouts can be caused by market volatility, news events, or other factors that disrupt its validity.
The second tool is multiple timeframe analysis. For example, if a diamond is forming on the hourly chart, traders may look at higher timeframes, such as the 4-hour or daily chart. If the breakout aligns with the trend on multiple timeframes, it may provide a stronger trading signal.
Target
The take-profit target typically equals the width of the diamond setup. Traders measure the vertical distance between the highest high and the lowest low and add that distance to the breakout point in the bullish formation or subtract this distance from the breakout point in the bearish formation.
Stop Loss
Traders typically place stop-loss orders just beyond the level opposite to the breakout. Another approach is to place stop loss beyond the apex, which is the highest point in a diamond top pattern or the lowest point in a diamond bottom pattern.
Special Consideration
Although the diamond is primarily considered a reversal formation, it can also indicate the continuation of an existing trend. Traders can see it appearing within the context of a strong trend and interpret it as a pause before it resumes.
In the case of a diamond continuation pattern, traders go short on the breakout of the lower trendline of the diamond and go long on the breakout of its upper trendline. Still, the profit target and stop-loss point will be calculated similarly to the reversal formation.
To confirm the diamond formation, traders often rely on a combination of technical indicators and fundamental analysis. These tools provide additional layers of validation and may help filter out false signals.
- Volume Analysis: An increase in volume accompanying the diamond pattern breakout suggests strong market interest. Conversely, low volume may indicate a false breakout.
- Momentum Indicators: Divergence—where the indicator moves opposite to the price—can signal a potential reversal and confirm the pattern’s signals.
- Moving Averages: When the price crosses above or below moving averages in conjunction with the diamond reversal pattern, it might offer stronger confirmation of the breakout direction.
- Fundamental News Events: Major economic announcements or geopolitical events can trigger significant price movements that align with a breakout from a diamond. Tracking these events may help us understand the broader context.
Diamond Pattern Trading Strategies
The diamond formation can be used in various trading strategies. Here are some common approaches that traders can utilise.
Diamond Pattern Breakout Trading
One of the most straightforward strategies with the diamond setup is to trade breakouts.
Entry: Traders enter the market in the breakout direction. They wait for the price to break above the upper trendline in a diamond bottom formation or below the lower trendline in a diamond top trading pattern.
Stop loss: Traders usually place a stop-loss order below the lower line in a bullish formation or above the upper line in a bearish formation. Another option is to consider the risk-reward ratio of 1:2 or 1:3.
Take profit: The most common approach is to measure the difference between the diamond’s highest high and lowest low. This distance is added to the breakout point for a bullish breakout and subtracted from the breakout point for a bearish breakout. If traders trade in a solid trend, a take-profit target can be trailed.
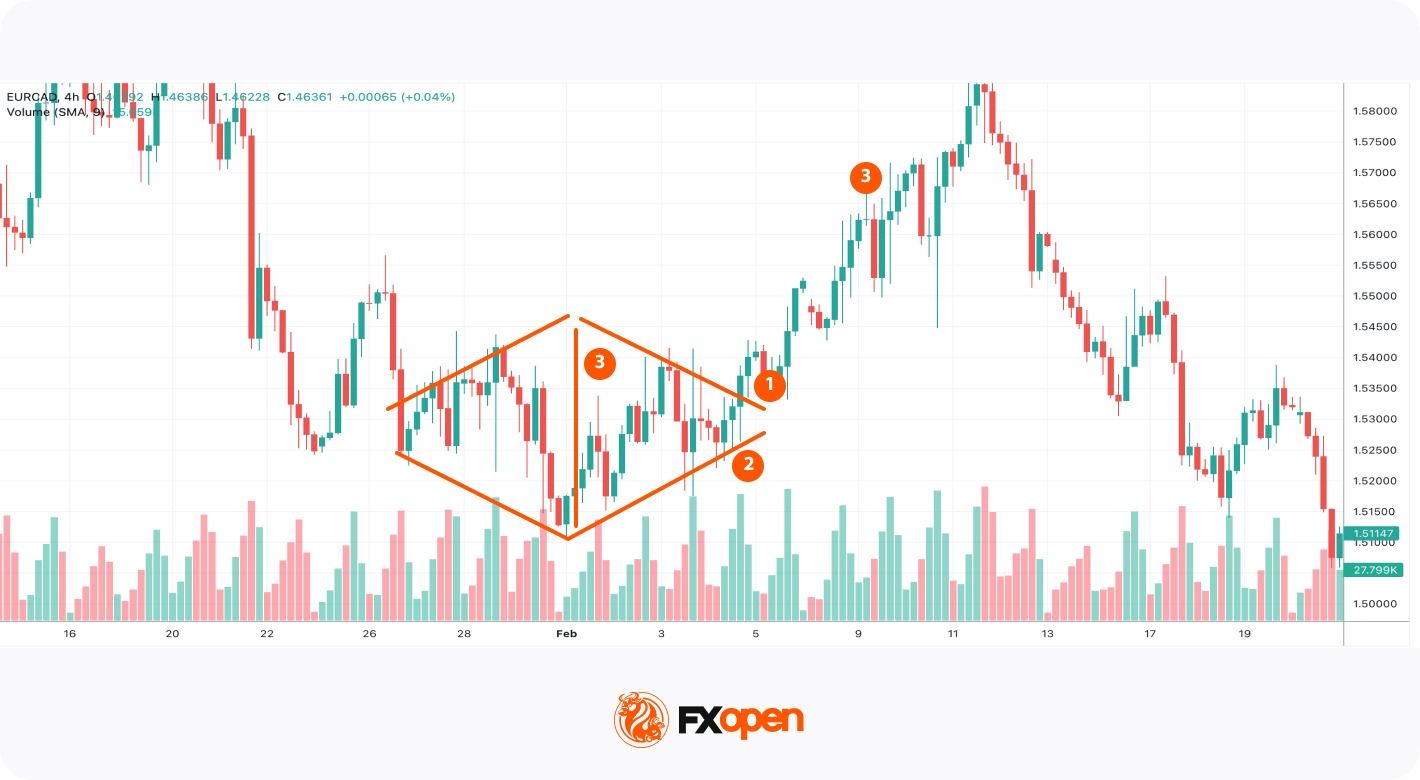
In the chart above, a bullish diamond formed after a prolonged downtrend. The price broke above the upper line (1). The volumes on the breakout increased significantly, so a trader could have expected bulls to push the price higher. A trader could have placed a stop-loss level below the lower line (2). After that, a trader could have measured the distance between the highest and the lowest points and added this to the breakout point (3). The bullish trend was strong, so a trader could have trailed that take-profit target.
Retracement and Reversal Trading
Another strategy is to look for price retracements.
Entry: Traders wait for the price to retest the broken trendline and then enter a trade in the breakout direction. In this approach, traders usually use a limit order.
Stop loss: Stop loss is placed below the retracement level in the bullish pattern and above the retracement level in case of a bearish setup.
Take profit: A profit target is calculated based on the distance between the highest and lowest points. The distance is added to the breakout point in the bullish formation or subtracted from the breakout point in a bearish formation.
Trailing stop-loss and take-profit orders can be applied to this approach.
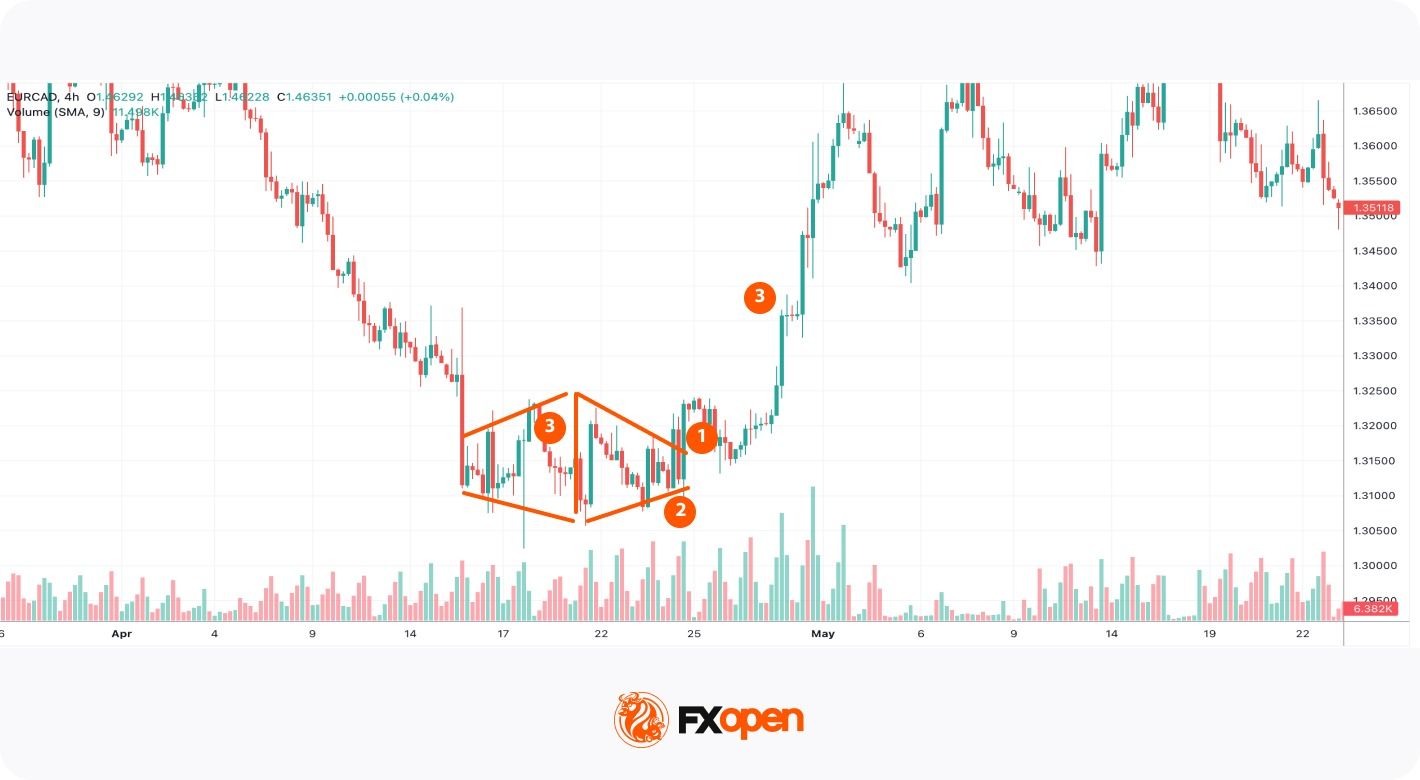
In the chart above, a diamond bottom pattern was formed. The price broke above the formation’s upper line, but it retested it later (1). A trader could have placed a buy limit order at the upper line. A stop-loss could have been placed below the lower line (2), while a take-profit target could have equalled the distance between the highest and lowest points of the formation (3).
This strategy may support traders in catching potential trend reversals. However, there is a risk of a missing trade as the price may keep moving in a breakout direction without a retracement.
If you want to practice these trading approaches, you may consider opening an account on FXOpen’s TickTrader trading platform and access numerous technical analysis tools and assets.
Diamond vs Head and Shoulders
The diamond formation is commonly compared to the head and shoulders setup. However, they have different trading rules; therefore, it’s vital to learn how to distinguish between them.
The head and shoulders formation consists of three peaks, with the middle peak (the head) being higher than the other two peaks (the shoulders) and is formed at the end of an uptrend. The inverse head and shoulders pattern consists of three troughs, with the middle one being lower (head) than the other two troughs, and it appears at the end of a downtrend.
The diamond, on the other hand, is characterised by a series of higher highs and lower lows which turn into lower highs and higher lows.
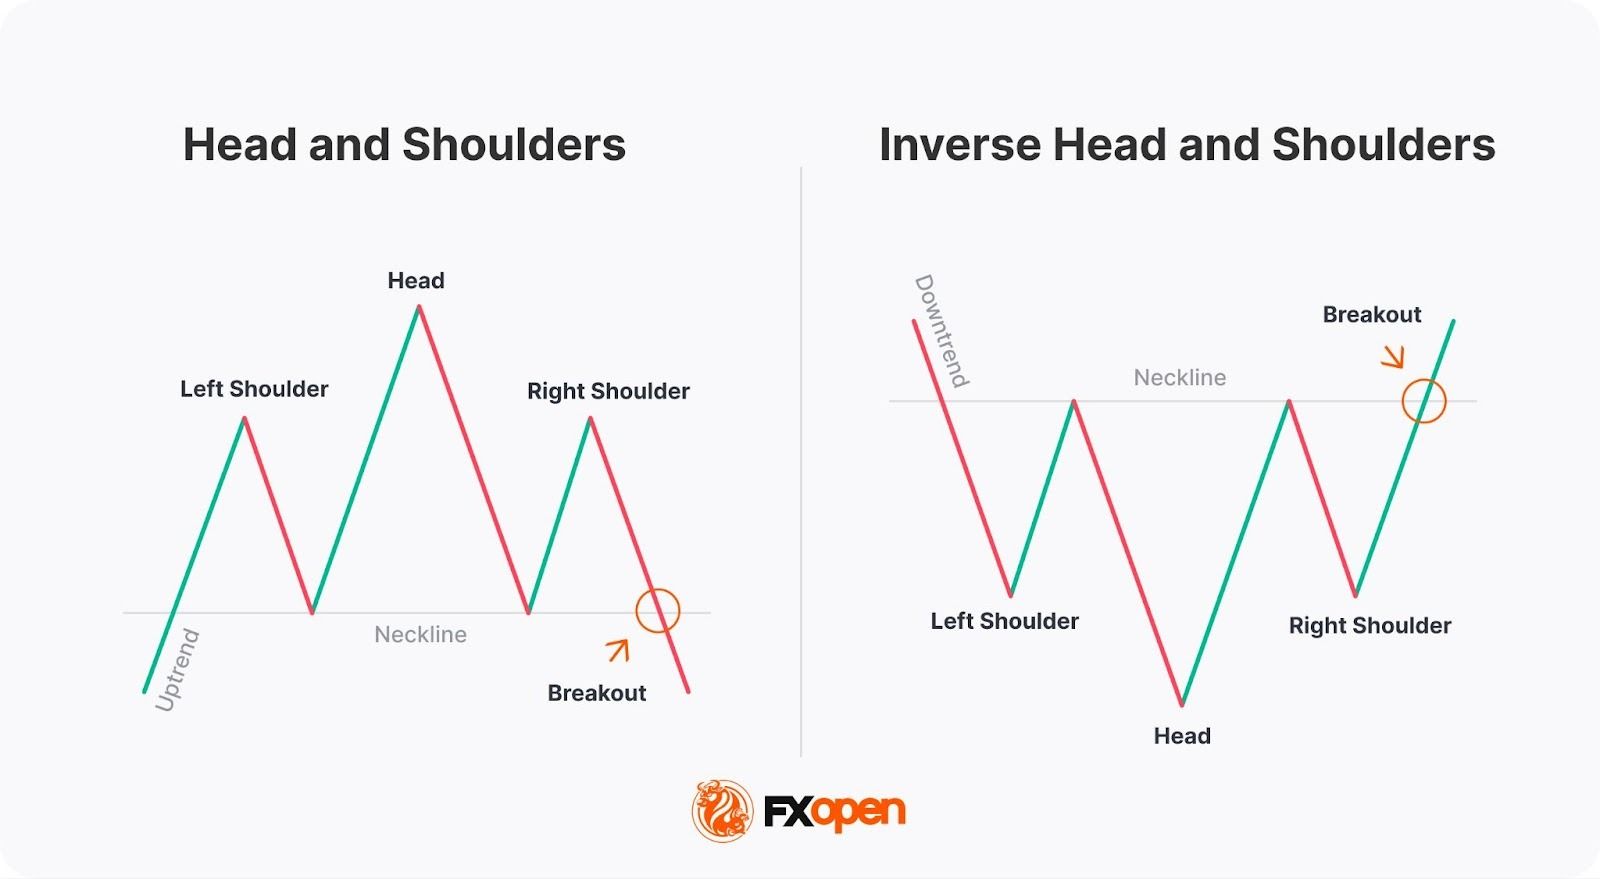
When trading the (inverse) head and shoulders setup, traders measure the distance between the head and the neckline (the line drawn through troughs in the head and shoulders and through peaks in the inverse head and shoulders) and add it to the breakout point.
Why the Diamond Pattern Matters in Technical Analysis
The diamond holds value in technical analysis due to its unique shape and ability to reflect future price reversals.
It represents a period of indecision in the market where neither buyers nor sellers dominate. This indecision is marked by a series of higher highs and lower lows that eventually narrow into a symmetrical structure resembling a diamond.
Although it is not the most common pattern, when it does appear, it often precedes significant market moves. However, traders should be aware that the reliability of its signals varies depending on many factors, including market conditions, volume, and external factors.
Advantages of the Diamond Pattern in Trading
The distinctive structure of a diamond may provide several advantages when assessing price behaviour on financial charts.
- Potential early signal of trend reversal – The pattern often forms after a strong trend, which strengthens a chance of a trend reversal.
- Clear chart structure – Expanding and contracting swings create a distinctive diamond shape.
- Defined breakout levels – The setup’s boundaries may help identify potential entry points.
- Applicable across multiple markets and timeframes – The diamond may appear across different asset classes, including forex, stocks, commodities, and cryptocurrencies*, and can be identified on both short-term and long-term charts.
- Compatible with other technical tools – Traders often combine the diamond with indicators such as RSI, MACD, moving averages, or support and resistance levels to confirm potential breakouts.
Limitations of the Diamond Pattern
While the diamond can be a valuable tool, it has limitations.
- Low frequency of occurrence – The diamond chart formation is relatively rare compared with other chart formations.
- Risk of false breakouts – Breakouts from the pattern do not always lead to sustained price movements. In some cases, the price may briefly move beyond the trendline and then reverse.
- Subjectivity in identification – The formation requires discretionary judgement when drawing trendlines and defining its boundaries. Different traders may interpret the same structure differently.
- Imprecise price targets – Price targets based on the height of the pattern provide only an approximate projection. Actual price movements may differ depending on volatility, liquidity, and market conditions.
- Dependence on market conditions – The strength of the diamond’s signals may vary depending on the broader market environment. In highly volatile or ranging markets, the probability of false signals may increase.
Important Factors When Trading the Diamond Pattern
Traders often focus on confirmation signals and overall market context rather than relying on the pattern alone. Applying a structured approach may help improve the quality of trade decisions.
- A confirmed breakout. A confirmed breakout above or below the pattern’s boundary may provide a clearer directional signal.
- The overall market trend. Diamond setups often appear after strong trends. Evaluating the broader market context may help determine whether the formation signals a reversal or continuation.
- Volume or momentum indicators. Some traders combine the pattern with indicators such as RSI, MACD, or volume analysis to assess the strength of the potential breakout.
- Risk management levels. Stop-loss levels are often placed near recent swing highs or lows within the setup.
Final Thoughts
The diamond chart pattern is a distinctive technical analysis formation that may signal trend reversals after strong price movements. Although it appears less frequently than other chart formations, its structure can provide valuable information about market indecision, volatility shifts, and potential breakout points. Traders typically combine it with volume analysis, support and resistance levels, and broader market context.
If you want to apply the diamond pattern in real trading, you may consider opening an FXOpen account to access over 700 markets and trade with low commissions from $1.50 and tight spreads from 0.0 pips.
FAQ
How Do Traders Identify a Diamond Pattern?
Traders identify a diamond chart formation by observing price movements that first expand and then contract, forming a diamond-shaped structure on the chart. The formation is typically outlined using four trendlines connecting higher highs, lower lows, lower highs, and higher lows. A confirmed breakout from the pattern often signals a potential change in trend direction.
Is a Diamond Pattern Bullish?
A diamond chart formation can be either bullish or bearish depending on where it forms in the market trend. A diamond bottom pattern develops after a downtrend and may signal a potential bullish reversal. A diamond top pattern appears after an uptrend and may indicate a possible shift to a bearish trend.
How May a Diamond Pattern Be Traded?
Trading a diamond typically involves waiting for a breakout from the formation. Traders often enter a position in the direction of the breakout and place stop-loss orders beyond the opposite side of the formation. The potential price target is often estimated using the vertical distance between the highest and lowest points of the formation.
*Important: At FXOpen UK, Cryptocurrency trading via CFDs is only available to our Professional clients. They are not available for trading by Retail clients. To find out more information about how this may affect you, please get in touch with our team.
This article represents the opinion of the Companies operating under the FXOpen brand only. It is not to be construed as an offer, solicitation, or recommendation with respect to products and services provided by the Companies operating under the FXOpen brand, nor is it to be considered financial advice.


Key Takeaways
- Wall Street analysts anticipate TER will deliver Q1 2026 EPS of $2.08, representing a 177.3% surge from the prior year’s $0.75.
- The company exceeded earnings projections by 32.4% in Q4 2025, posting $1.80 per share against the $1.36 forecast.
- Shares have skyrocketed 271.3% during the past year, dramatically outperforming the S&P 500’s 16.7% gain.
- A 6.5% single-day decline occurred on March 30 as Iran-related geopolitical risks sparked semiconductor supply chain worries.
- Coverage from 17 Wall Street analysts yields a “Moderate Buy” consensus with an average price objective of $311.20.
Teradyne’s performance has been nothing short of exceptional. Shares have climbed approximately 61% since the start of the year and more than 271% over the trailing twelve months, propelled primarily by robust appetite for AI-driven semiconductor testing systems.
The semiconductor equipment maker has consistently surpassed analyst earnings forecasts across its last four quarterly reports. In the most recent period, Q4 2025, the company delivered $1.80 in earnings per share—32.4% higher than the $1.36 Wall Street consensus. Quarterly revenue reached $1.08 billion, significantly exceeding the $970 million projection and marking a 43.9% year-over-year increase.
As the Q1 2026 earnings announcement draws near, expectations are running high. Analysts project earnings of $2.08 per share, which would mark a substantial 177.3% improvement over the $0.75 reported during the same quarter last year. While this represents an ambitious forecast, Teradyne has demonstrated a consistent ability to exceed elevated benchmarks.
For the complete 2026 fiscal year, Wall Street consensus calls for EPS of $5.91—a 49.2% jump from the $3.96 achieved in fiscal 2025. Extended projections point to earnings of $7.62 per share in fiscal 2027, reflecting 28.9% year-over-year expansion.
The stock currently commands a price-to-earnings ratio near 89, which sits well above historical norms. The twelve-month trading range spans from $65.77 to $344.92, illustrating the dramatic shift in investor sentiment as AI infrastructure expenditures accelerated.
Institutional ownership remains exceptionally strong, with approximately 99.77% of outstanding shares held by institutions and hedge funds. Recent filings show several prominent investors expanding their positions, including Integrated Wealth Concepts, which increased its holdings by 12.8% during Q1.
Wall Street Sentiment and Price Objectives
The analyst community maintains a predominantly positive outlook. Of the 17 analysts tracking the stock, 11 rate it “Strong Buy,” one assigns “Moderate Buy,” and five recommend “Hold.” The consensus twelve-month price target stands at $311.20, implying roughly 1.4% potential appreciation from present trading levels.
Multiple major financial institutions have revised their targets upward in recent months. Morgan Stanley established a $306 price objective. Goldman Sachs upgraded its target from $230 to $300 while maintaining a “Buy” recommendation. Evercore increased its forecast from $200 to $280 alongside an “Outperform” rating. Cantor Fitzgerald adjusted its target higher from $240 to $270.
Robert W. Baird has additionally identified TER as a compelling appreciation opportunity, contributing to the optimistic analyst sentiment surrounding the upcoming earnings release.
Challenges on the Horizon
The upward trajectory hasn’t been without interruptions. On March 30, shares tumbled 6.5% during a single trading session. The decline stemmed from escalating geopolitical concerns related to the Iran conflict, which triggered widespread anxiety across semiconductor equities.
A particular concern emerged regarding possible disruptions to helium supplies—a critical gas utilized in chip manufacturing processes. Such supply chain uncertainties typically impact test equipment manufacturers significantly, given their direct exposure to semiconductor production rhythms.
Teradyne recently commemorated its 25th anniversary of Chinese operations at SEMICON China 2026, where it unveiled four innovative AI infrastructure and semiconductor testing solutions. This underscores ongoing commitment to a market that presents its own geopolitical complexities.
With a beta coefficient of 1.79, the stock exhibits considerable volatility characteristics. As the Q1 earnings release approaches, investors are keenly evaluating whether AI-fueled demand can substantiate what many consider an elevated valuation multiple.


Coinglass’ Bitcoin liquidation map shows a $1.143b long wall below $65k and a $754m short pocket above $68k, turning a small move into a potential $1.9b forced‑flow event.
Summary
- Coinglass data indicates that if Bitcoin drops below $65,000, cumulative long liquidation intensity on major centralized exchanges reaches an estimated $1.143 billion.
- If BTC instead breaks above $68,000, cumulative short liquidation intensity on mainstream CEXs climbs toward roughly $754 million.
- The map measures liquidation “intensity” rather than exact contract counts, highlighting where price moves are most likely to trigger outsized liquidity waves.
Derivatives analytics from Coinglass show Bitcoin (BTC) perched between two dense liquidation clusters where nearly $1.9 billion in leveraged positions could be forced out in either direction. According to the platform’s latest liquidation heatmap, if BTC slides below $65,000, cumulative long liquidation intensity across mainstream centralized exchanges spikes to about $1.143 billion — signalling that a break of that level could unleash a powerful wave of forced selling. This cluster reflects where heavily margined longs have stacked up with stops or liquidation prices just under current spot levels, turning a modest percentage dip into a potential air pocket.
On the upside, Coinglass data marks $68,000 as the next major pressure point for bears. Should Bitcoin push through that level, the cumulative short liquidation intensity on major CEXs jumps toward roughly $754 million, implying a sizeable pocket of short interest vulnerable to a sharp rally.
A clean breakout through $68,000 would likely force these positions to cover, adding fuel to any upside move as exchanges automatically close losing trades to protect margin. In a thin‑order‑book environment, that kind of short covering can produce price spikes that overshoot fundamentals in the short term.
Crucially, Coinglass stresses that its liquidation chart does not display the precise number of contracts or the exact dollar value of positions that will be liquidated at each price point. Instead, the vertical bars on the map represent the relative significance of each liquidation cluster compared with nearby levels — what the platform calls liquidation “intensity.” In practice, that means the heatmap is a sensitivity gauge: it shows how strongly the market is likely to react if the underlying price reaches a specific zone, not a guarantee that a fixed notional amount will be wiped out.
A higher bar on the chart indicates that when price tags that level, the ensuing reaction from liquidity waves — forced liquidations, slippage, and knock‑on order flow — should be more pronounced than at adjacent prices. For traders using leverage, the message is simple: the $65,000–$68,000 corridor is now structurally dangerous. A move below $65,000 threatens a cascading long wipeout, while a break above $68,000 risks a short squeeze, making risk management around these thresholds more important than any single directional call.
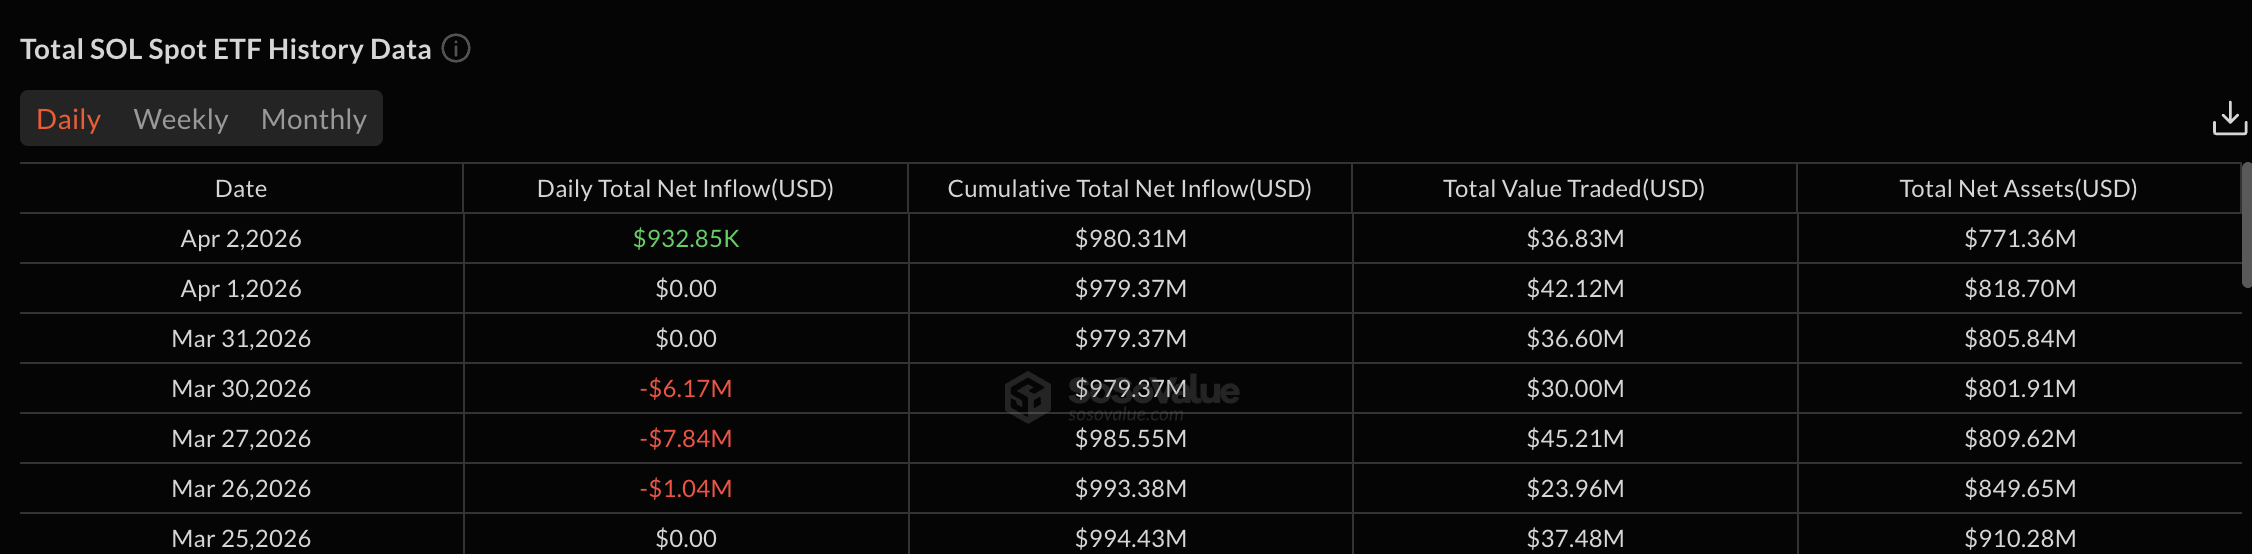
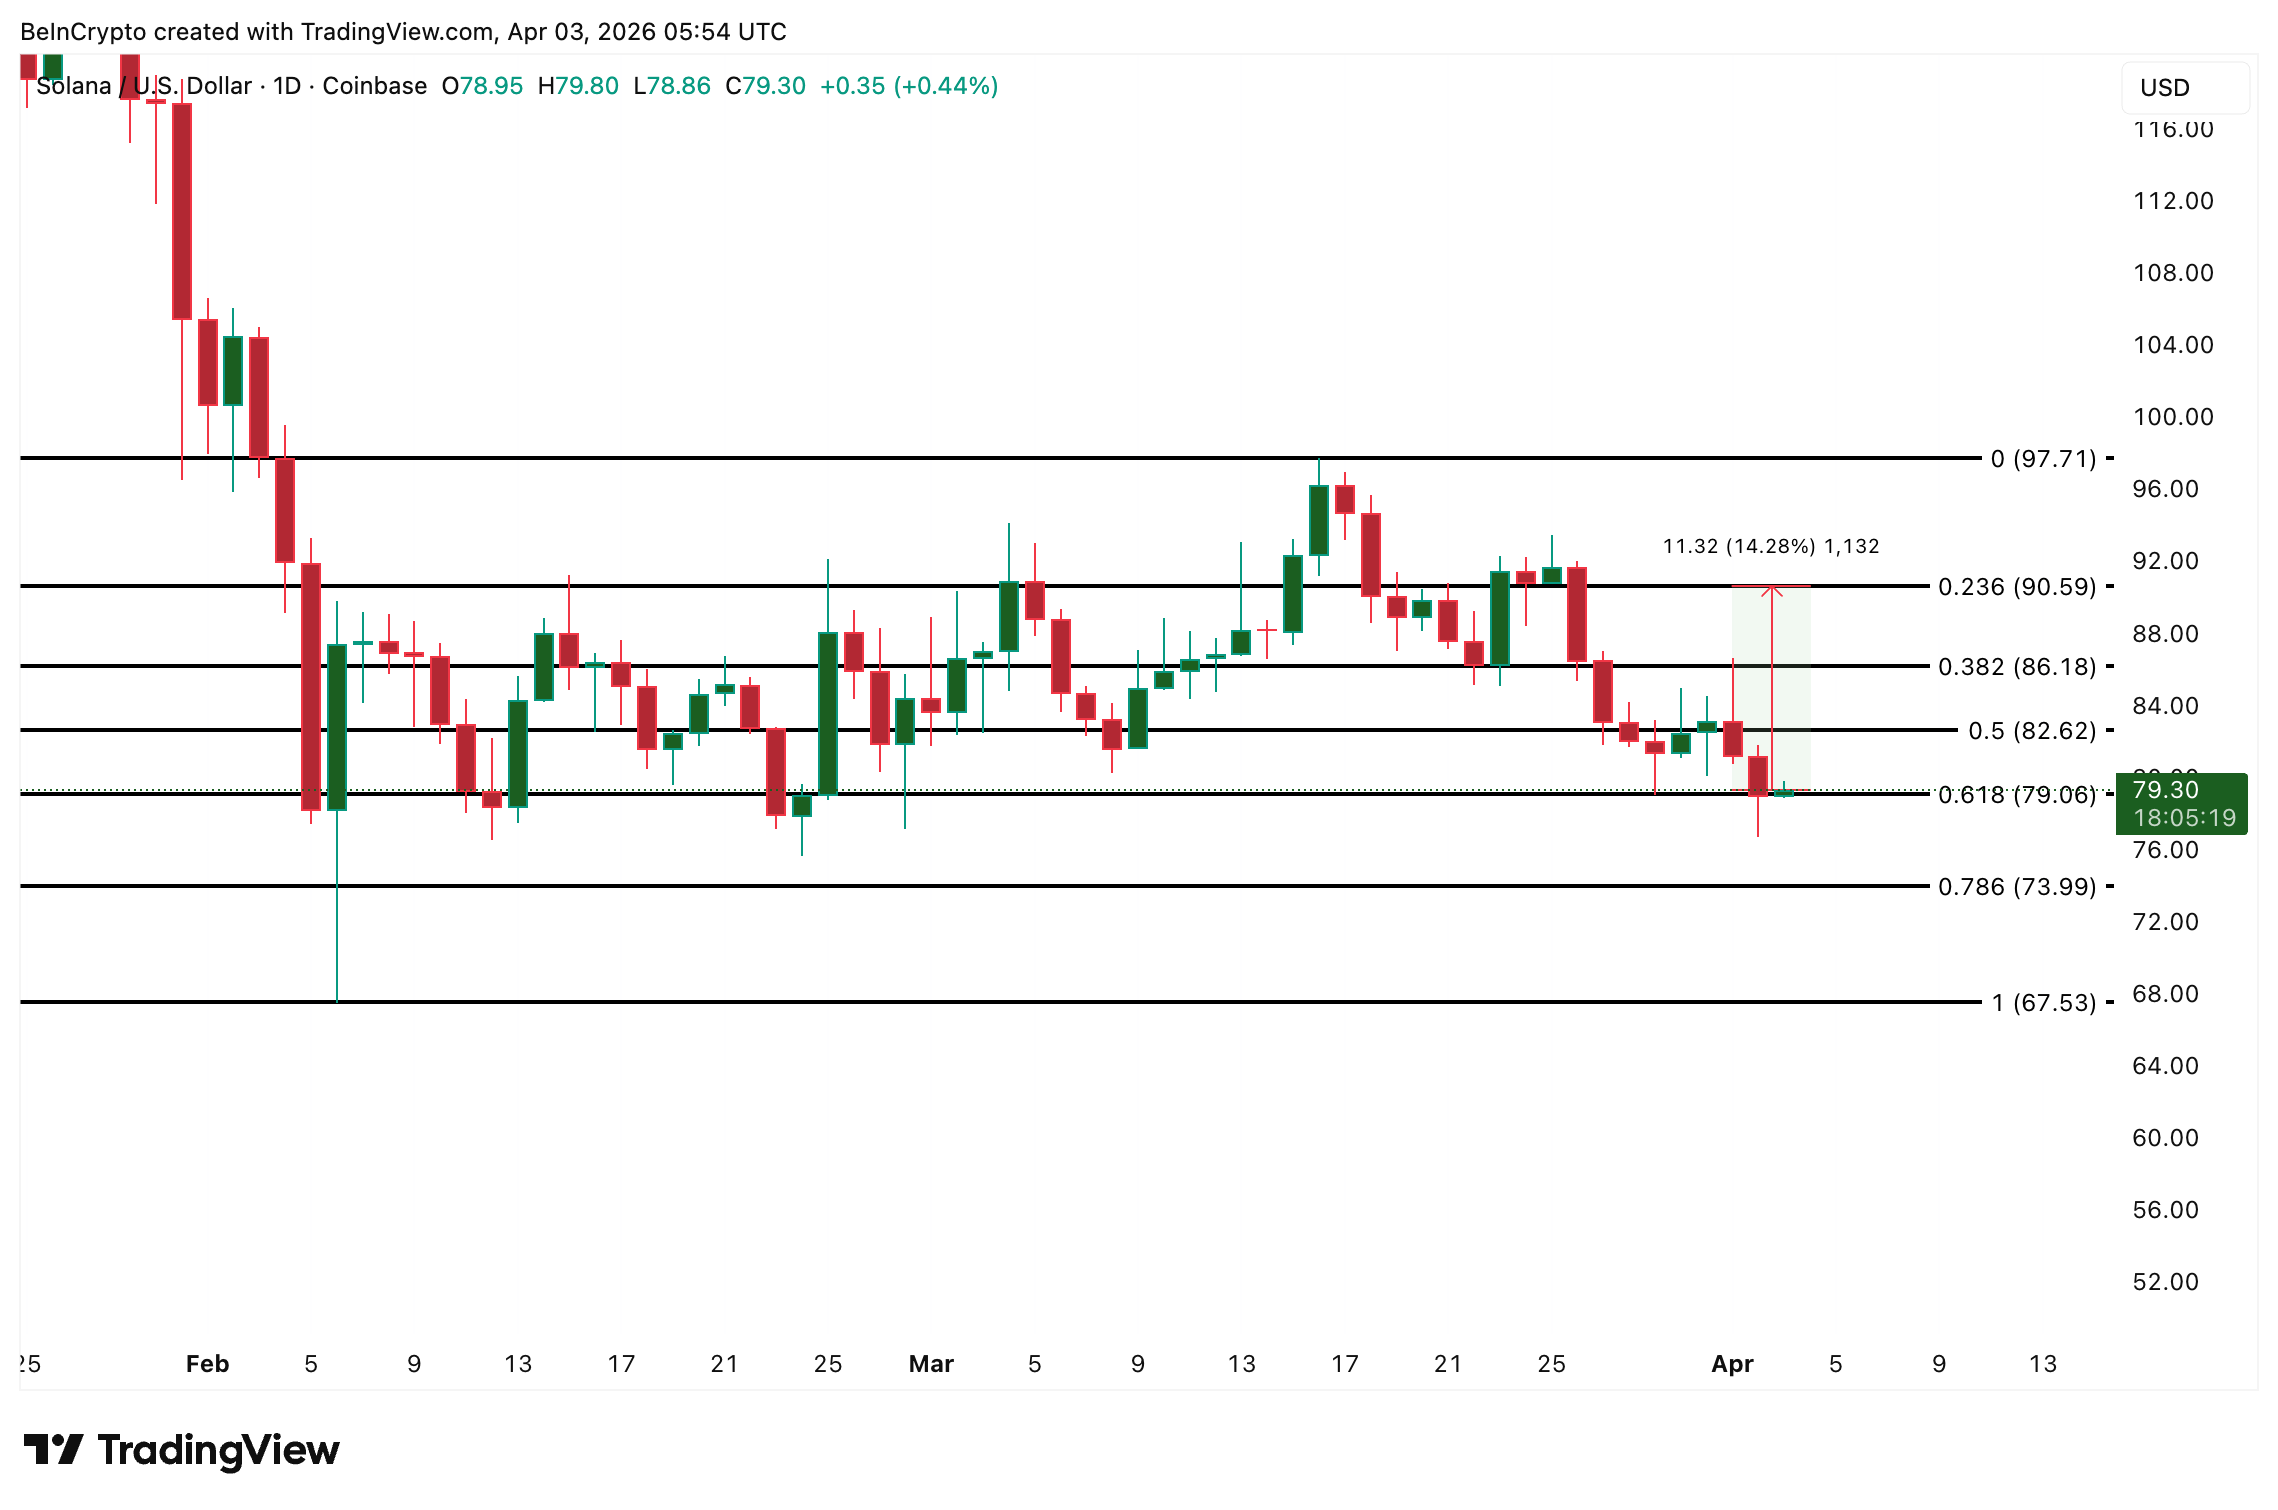
Solana (SOL) price trades near $79.30 on April 3, up 0.6% over the past 24 hours after its spot ETF recorded the first positive net inflow in six trading days.
The $932,850 inflow on April 2 broke a streak of zero and negative activity stretching back to late March. A bullish RSI divergence on the daily chart adds to the bounce case.
However, exchange data shows that participants are already selling into the early strength, a pattern that historically weakened prior rallies. The question is whether institutional flows through the ETF can overpower the selling pressure building on exchanges.
Solana ETF Comeback Meets a Familiar Divergence
Solana ETF flows turned positive on April 2 with $932,850 in net inflows, ending a six-day stretch that included three outflow days totaling roughly $15 million and three days of zero activity. The return of institutional interest, even at a modest level, provides a potential tailwind for the bounce that the daily chart is signaling.
Want more token insights like this? Sign up for Editor Harsh Notariya’s Daily Crypto Newsletter here.
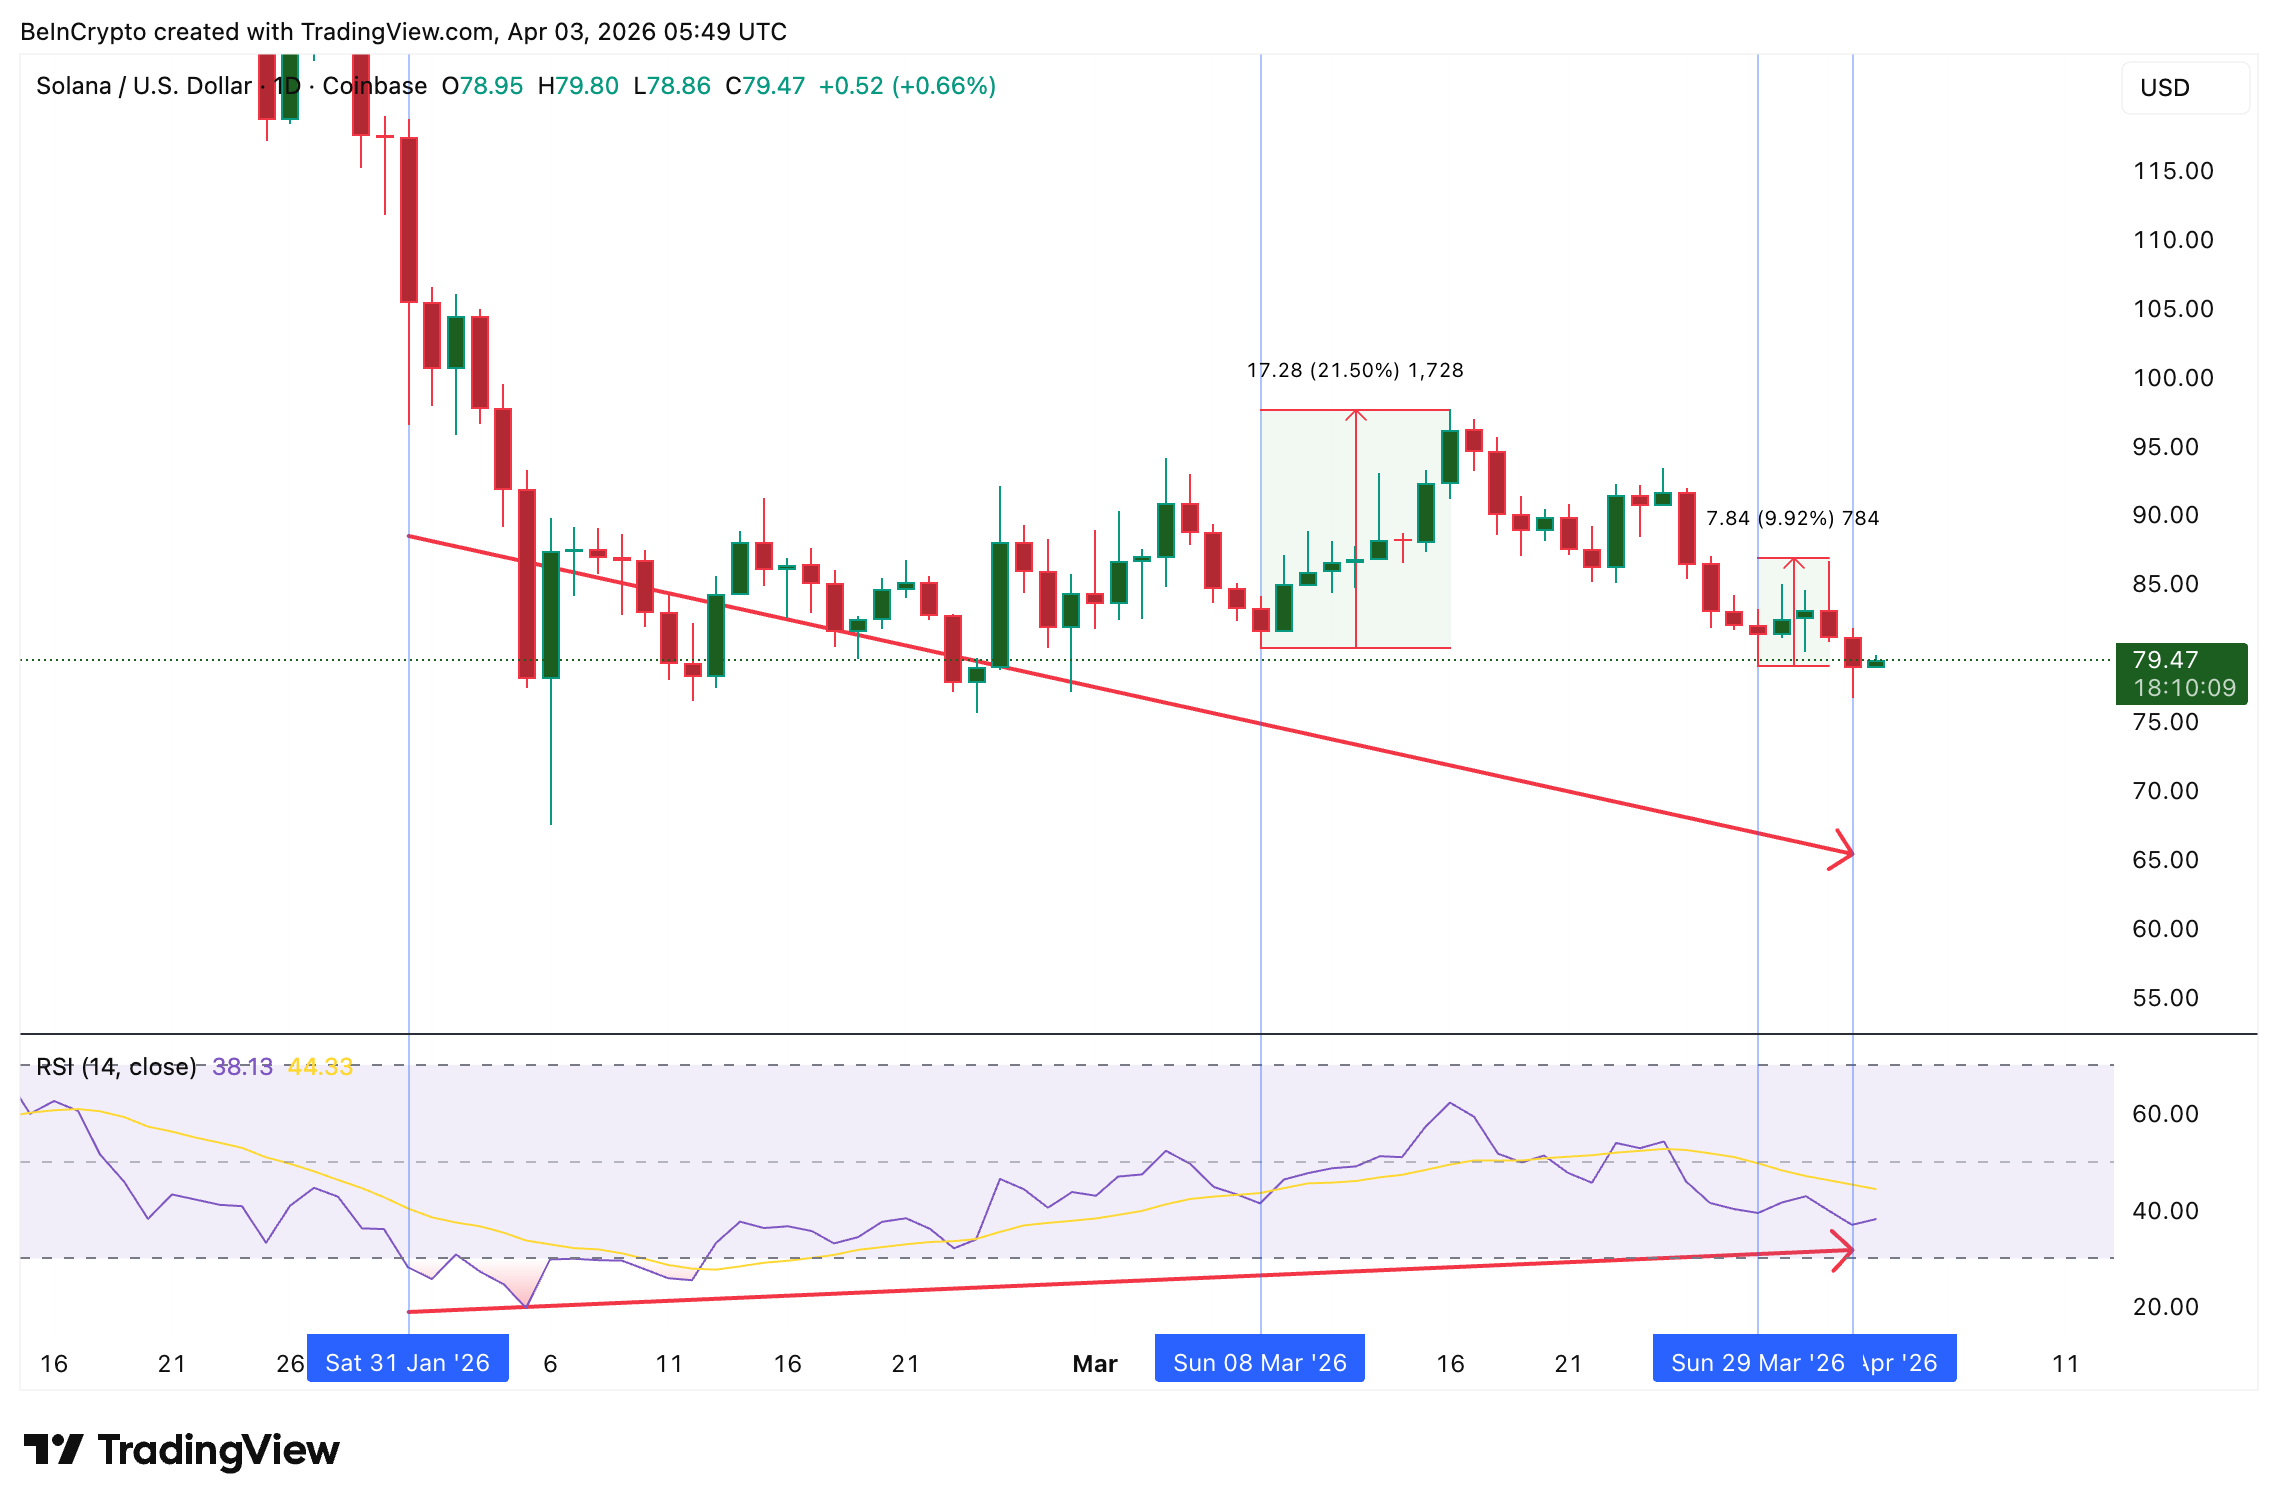
On the daily chart, between January 31 and April 2, Solana price made a lower low while the Relative Strength Index (RSI), a momentum oscillator, made a higher low. That standard bullish divergence signals weakening selling momentum.
This exact pattern has appeared twice before with different outcomes tied directly to ETF activity. The first divergence, confirmed around March 8, preceded a 21.5% rally between March 8 and March 16.
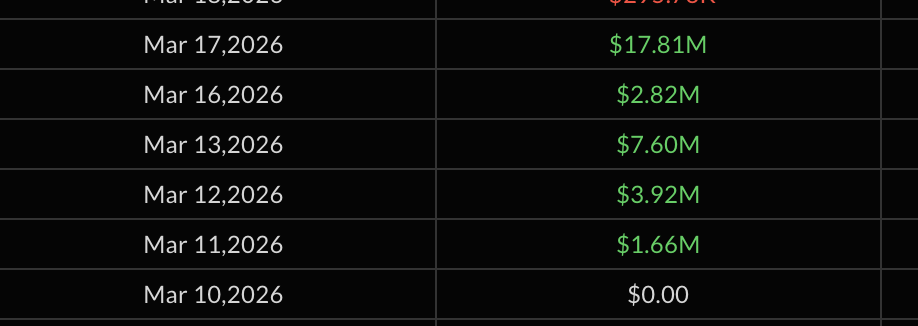
During that period, SOL ETF inflows were consistently positive, with daily flows of $1.66 million, $3.92 million, $7.60 million, and $2.82 million. The institutional tailwind helped the divergence convert into a sustained move.
The second divergence, confirmed around March 29, produced only a 10% bounce. Between March 29 and April 1, ETF flows were either flat or negative, offering no institutional support. The divergence technically worked, but lacked the fuel to sustain itself.
The current divergence, confirmed on April 2, now has its first day of positive flow. Whether the ETF streak continues will likely determine if this Solana bounce resembles the 21% rally or something weaker.
Exchange Sellers Are Already Moving
While the Solana ETF sent its first positive signal in nearly a week, on-chain exchange data tells a contrasting story. The exchange net position change, a Glassnode metric that tracks the net flow of tokens into and out of exchange wallets, turned sharply positive on April 2. The reading surged from 160,431 SOL on April 1 to 860,995 SOL on April 2, a more than fivefold increase in a single day.
A positive net position change means more SOL is flowing onto exchanges than leaving, which typically signals selling intent. The timing matters because this spike coincides with the early stages of the RSI divergence bounce.
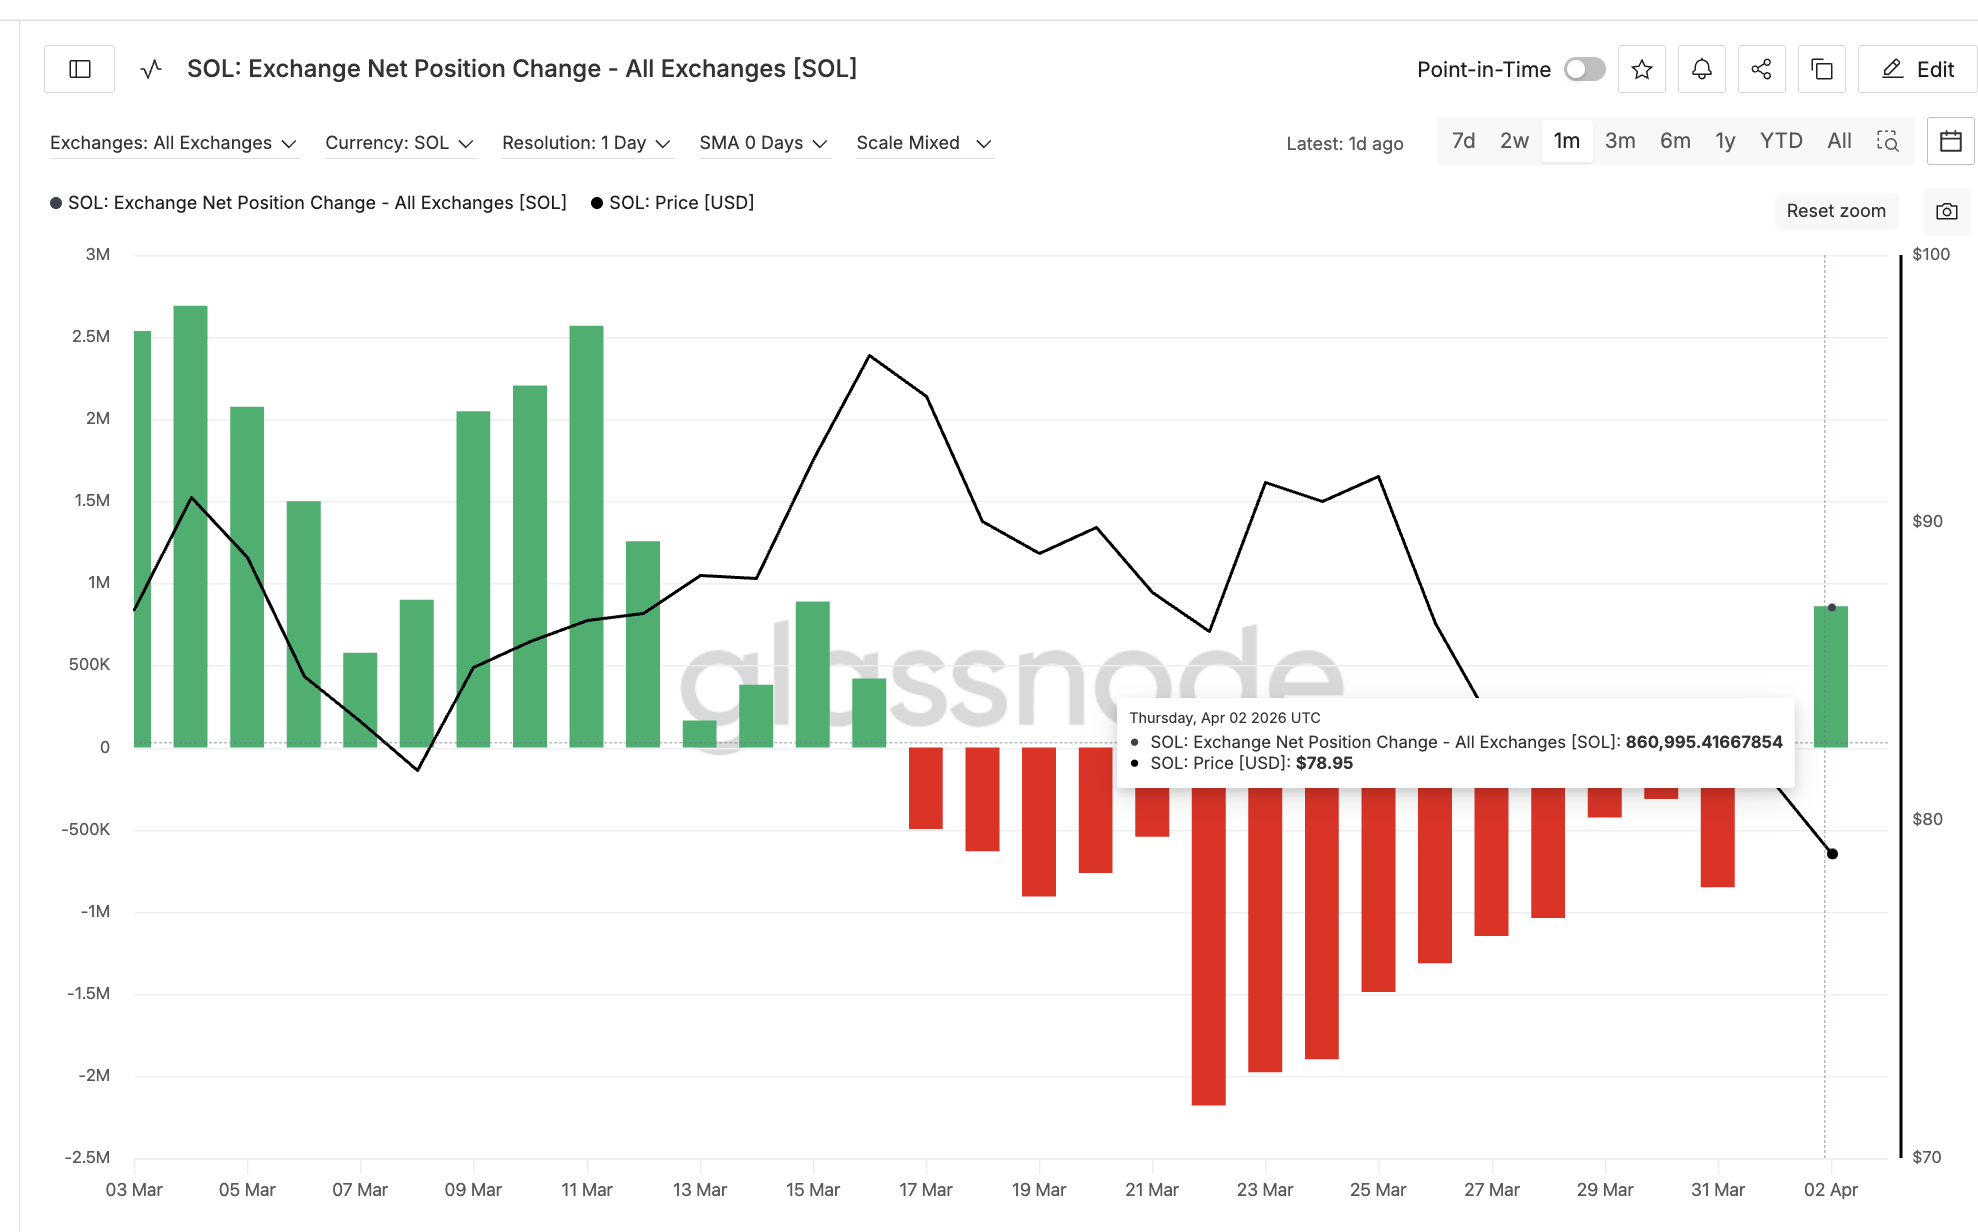
A similar dynamic played out during the March 8 to 16 rally. Throughout that entire 21% move, the exchange net position change remained in green, meaning sellers were active the whole time.
Despite that selling pressure, the ETF tailwind was strong enough to absorb it and push prices higher. When the rally ended and prices began correcting, the exchange metric flipped negative as participants started buying, effectively buying the top.
The current pattern suggests that exchange participants are once again selling into a bounce rather than accumulating ahead of it. This could also mean selling into strength to minimize losses.
If ETF inflows remain modest, this selling pressure may be enough to cap the move early. However, if institutional flows accelerate as they did in mid-March, the selling could be absorbed.
Solana Price and the $79 Floor
The daily chart frames every critical Solana price level from here. SOL currently trades at $79.30, sitting directly on the 0.618 Fib at $79.06. This level has historically acted as a strong support zone across multiple asset classes, and for Solana, it represents the most important floor in the current structure.
A daily close below $79 would weaken the bounce thesis and open the path toward $73.99, the 0.786 Fib. Below that, $67.53 becomes the next major support.
For the divergence to convert into a meaningful rally, Solana price needs to reclaim $82.62, the 0.5 Fib, followed by $86.18 at the 0.382 level. A move above $86 would confirm that the ETF tailwind is outweighing exchange selling and could target $90, representing approximately 14% upside from current levels. A push toward $97.71 would bring back the March 16 high.
The divergence provides the technical signal, the ETF provides the institutional catalyst, and the exchange selling provides the headwind. The March precedent shows that when ETF flows are strong enough, the bounce survives despite active selling. When they are not, the bounce fades quickly.
A daily close below $79 separates a divergence-driven bounce from a deeper correction toward $73.99, while reclaiming $82.62 with sustained ETF inflows would confirm the rally has institutional backing.
The post A 6-Day Solana ETF Drought Just Ended, but Price Bounce Faces an Immediate Problem appeared first on BeInCrypto.
Crypto World
Microsoft to pour $10B into Japan for AI expansion, cyber defense, and talent development


Microsoft said on Friday it plans to invest $10 billion in Japan over the next four years, focusing on artificial intelligence data centres and supporting infrastructure.
Summary
- Microsoft to invest $10 billion in Japan over four years to expand AI data centres, cybersecurity partnerships, and train one million engineers.
- Initiative builds on a prior $2.9 billion commitment and includes collaborations with SoftBank, Sakura Internet, NTT, and NEC.
- Microsoft also launched new multimodal AI models, positioning them as lower-cost alternatives while continuing its partnership with OpenAI.
The announcement followed a meeting between Microsoft President Brad Smith and Japanese Prime Minister Sanae Takaichi in Tokyo. Smith described the move as a “response to Japan’s growing need for cloud and AI services.”
Companies across Japan, the world’s fourth-largest economy, are accelerating efforts to strengthen their position in the evolving AI sector. However, expansion of data centres in the country has been slowed by land constraints and relatively high electricity costs.
Microsoft said it will work with SoftBank Group and Sakura Internet to scale domestic digital infrastructure. The new commitment follows a $2.9 billion investment announced in 2024 aimed at boosting Japan’s AI capabilities and reinforcing cyber defences.
Alongside infrastructure, the latest plan allocates funding to deepen cybersecurity cooperation with government agencies and to train one million engineers. The initiative will be carried out with major telecom and technology firms, including NTT and NEC.
The surge in data centre construction across the Asia-Pacific region, particularly in India and Southeast Asia, has also raised environmental concerns. These facilities place growing pressure on electricity grids — many still dependent on fossil fuels — and require significant water resources to cool high-performance servers.
In a parallel development, Microsoft’s AI division unveiled three new foundational models capable of generating text, voice, and images, signalling a continued push to expand its in-house capabilities.
The models are now available through Microsoft Foundry, with some also accessible via the MAI Playground testing environment. Pricing has been positioned as a competitive advantage, with Microsoft stating the tools are cheaper than comparable offerings from Google and OpenAI.
The rollout underscores Microsoft’s dual-track strategy: building its own AI systems while maintaining its long-standing partnership with OpenAI.
The company has invested more than $13 billion into the collaboration and continues to integrate OpenAI’s models across its products, even as it develops alternatives internally.
Disclosure: This article does not represent investment advice. The content and materials featured on this page are for educational purposes only.
The crypto market traded $20.57 trillion in Q1 2026, but declining volumes and concentrated liquidity told a story of cautious recovery, not euphoria.
A new quarterly research report from CoinGlass breaks down how capital, trading activity, and market depth shifted among exchanges during the first three months of the year. The findings paint a picture of a market still digesting the aftershocks of late 2025.
A Market Still Healing From Q4’s Crash
Q1 2026 unfolded against a difficult backdrop. The October 2025 tariff shock triggered $19 billion in liquidations within 24 hours, the largest single-day deleveraging event in crypto history.
Bitcoin (BTC) declined roughly 35% from its all-time high above $126,000, and open interest across exchanges dropped more than 40%.
By January, signs of stabilization had appeared. Total market volume for the quarter reached approximately $20.57 trillion, split between $1.94 trillion in spot and $18.63 trillion in derivatives.
However, each successive month saw lower totals. January posted the highest activity, and March fell to the quarterly low.
The derivatives-to-spot ratio held at roughly 9.6x throughout the quarter, slightly above the 2025 full-year average.
That ratio suggests traders preferred hedging and short-term positioning through futures rather than making directional spot bets.
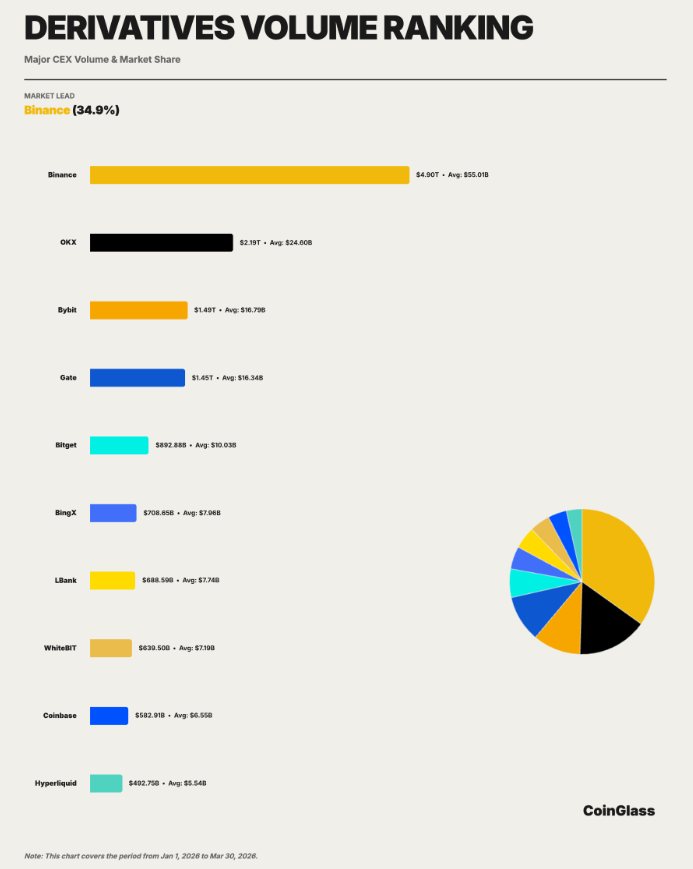
Binance’s Lead Extends Across Every Metric
The CoinGlass report measured exchanges across four dimensions, including trading volume, open interest (OI), order book depth, and user asset reserves. Binance ranked first in all of them.
In derivatives, Binance posted approximately $4.90 trillion in cumulative volume, a 34.9% share among the top 10 exchanges.
That figure exceeded the combined totals of OKX ($2.19 trillion) and Bybit ($1.49 trillion). In open interest, Binance averaged $23.9 billion daily, roughly 2.2 times second-ranked Bybit.
Liquidity depth told a similar story. In BTC futures, Binance’s average two-sided depth within 1% of the mid-price was approximately $284 million.
OKX followed at $160 million and Bybit at $76.55 million. The pattern repeated across BTC spot, ETH futures, and ETH spot markets. No single competitor matched Binance across all four sub-markets simultaneously.
The starkest gap appeared in user asset reserves. Binance held approximately $152.9 billion in custodial assets, accounting for 73.5% among the top 10 exchanges. OKX was a distant second at $15.9 billion. Gate, Bitget, and Bybit all fell within the $5 to $7 billion range.
That concentration far exceeds Binance’s share in trading volume or open interest. The CoinGlass report noted that asset retention reflects brand trust, product ecosystem breadth, and on/off-ramp convenience, making it a stronger indicator of long-term competitive position.
Hyperliquid Enters the Mainstream Conversation
One of the quarter’s most notable developments was the rise of Hyperliquid (HYPE), a decentralized derivatives protocol that posted approximately $492.7 billion in Q1 trading volume.
That placed it inside the top ten.
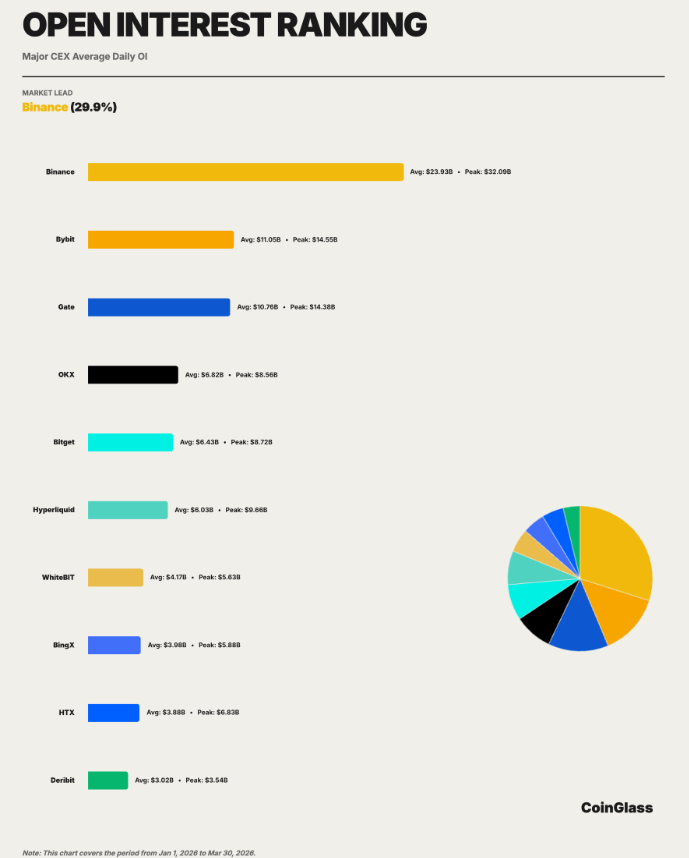
Its average daily open interest of roughly $6.0 billion, with a peak of $9.7 billion, drew close to that of centralized competitors like Bitget.
The growth validated what CoinGlass’s 2025 annual report had predicted, that decentralized derivatives were transitioning from proof-of-concept to actual market share competition.
JPMorgan flagged Hyperliquid in a March report, noting that demand for round-the-clock access to traditional assets was driving decentralized exchange growth and taking share from mid-tier centralized platforms.
Grayscale also filed an S-1 for a HYPE ETF in March, seeking a Nasdaq listing.
For now, Hyperliquid’s scale remains significantly below the leading centralized exchanges.
However, its entry into the competitive arena adds pressure to second-tier platforms competing for derivatives market share.
What Comes Next
The CoinGlass report identified several variables to watch heading into Q2. These include:
- The Federal Reserve’s monetary policy path,
- Changes in BTC spot ETF fund flows, and
- The progress of regulatory framework implementation across major jurisdictions.
Q1 was not about a return to all-time highs. It was about recovery, concentration, and a shifting market structure that is drawing clearer lines between the platforms that attract capital and those that risk falling behind.
The post New Report Finds Where All the Money Went in Crypto’s Brutal Q1 appeared first on BeInCrypto.

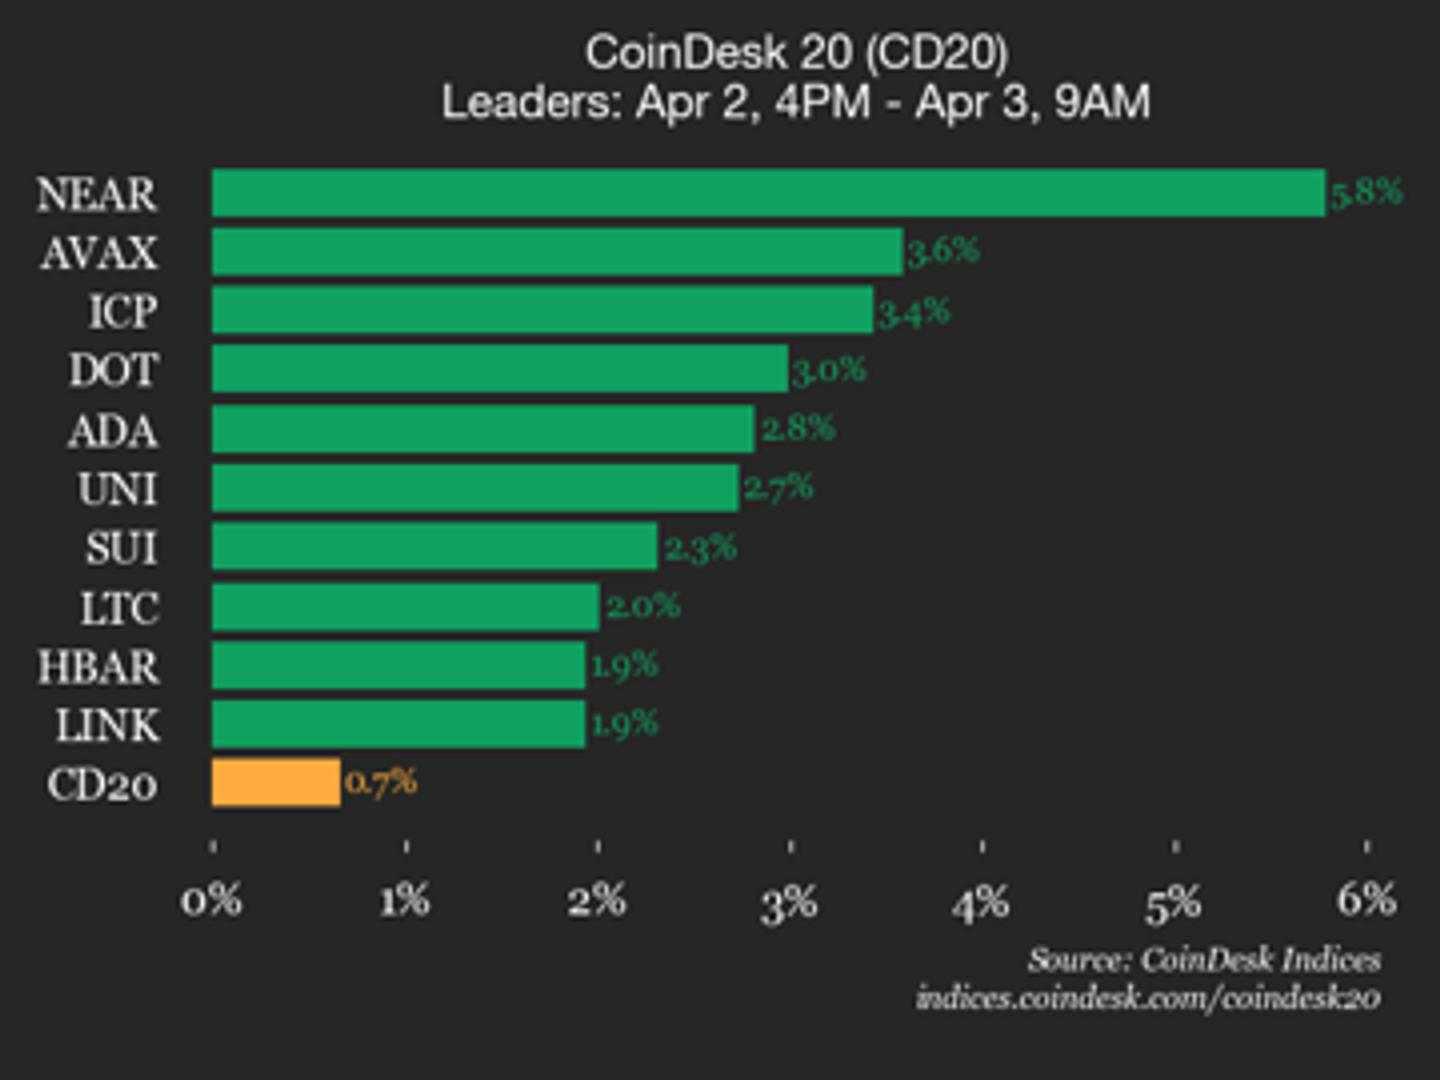
NEAR Protocol (NEAR) gained 5.8% and Avalanche (AVAX) climbed 3.6%.

Key Highlights
- ServiceNow (NOW) shares have declined approximately 32% year-to-date amid widespread SaaS sector pressure from AI disruption concerns
- CEO Bill McDermott reports that half of new business revenue originates from non-seat-based pricing models, including AI token consumption
- Benchmark launched coverage with a Buy recommendation and $125 price target, characterizing the decline as “unwarranted”
- McDermott demonstrated confidence by purchasing $3 million in NOW shares during February, describing it as an optimal entry opportunity
- Management projects 21% GAAP subscriber revenue expansion and identifies a $600 billion total addressable market opportunity
The shares of ServiceNow have experienced significant turbulence throughout 2026. With a decline of roughly 32% since the year began, the enterprise software provider has been swept up in a widespread retreat from SaaS investments that gained momentum in late 2025.
What sparked the exodus? Rapid advancements in AI capabilities from companies such as Anthropic and OpenAI exceeded market expectations, triggering investor anxiety that AI laboratories might erode traditional enterprise software demand.
CEO Bill McDermott challenges this interpretation. He maintains that ServiceNow differs fundamentally from conventional SaaS providers and is proactively pivoting toward AI integration rather than retreating from the technological shift.
“We’re not a feature company and we’re not a function company, we’re a platform company,” McDermott explained. He highlighted the company’s AI Control Tower solution, which orchestrates and oversees AI agents, models, and operational workflows throughout enterprise infrastructures.
Among McDermott’s most significant revelations: half of ServiceNow’s incoming business revenue derives from pricing structures unrelated to user seats. This marks the company’s first public disclosure of this metric.
Transitioning Beyond Per-Seat Licensing
The conventional software revenue model — billing based on individual user licenses — faces mounting challenges as artificial intelligence diminishes dependency on workforce expansion. ServiceNow is adopting a blended approach where clients pay for both user licenses and consumption-based AI tokens.
The strategy is clear: as the platform executes more autonomous functions, organizations purchase additional tokens. This decouples revenue expansion from employee headcount metrics.
Goldman Sachs analyst Gabriela Borges maintains a 12-month price target of $216 for NOW. She anticipates upward revisions to organic growth projections throughout the year as clients exhaust complimentary AI token allocations and transition to paid consumption after validating business value.
“Those packages are going to start getting burnt through, such that customers are now going to come back to ServiceNow and say, ‘Hey, we proved the value of this particular product. We are now ready to pay for it,’” Borges explained.
McDermott reinforced his optimism through action. During February, he acquired $3 million in NOW shares using personal funds.
Strategic Acquisitions and Market Expansion
ServiceNow has maintained an aggressive acquisition strategy recently. Last December, the company revealed plans for a $7.75 billion acquisition of cybersecurity provider Armis. Additional purchases included AI identity security specialist Veza and a $2.85 billion investment in Moveworks, a platform focused on AI assistance and reasoning agents.
During the Q4 earnings discussion, McDermott directly confronted shareholder concerns regarding acquisition velocity, emphasizing that purchases target innovation capabilities rather than revenue supplementation.
These strategic moves position ServiceNow more prominently within cybersecurity and customer relationship management sectors. McDermott asserts these expansions elevate the addressable market opportunity to at least $600 billion, a substantial increase from the $90 billion estimate when he assumed leadership in 2019.
On April 1, Benchmark launched coverage featuring a Buy rating alongside a $125 price target. Analyst Yi Fu Lee characterized the sell-off motivated by AI displacement concerns as “unwarranted” and positioned NOW as a primary beneficiary of the “Agentic AI super cycle.”
Wall Street consensus maintains a Buy recommendation for the company. ServiceNow’s price-to-earnings multiple registered approximately 61 times trailing 12-month earnings as of Thursday’s trading session.
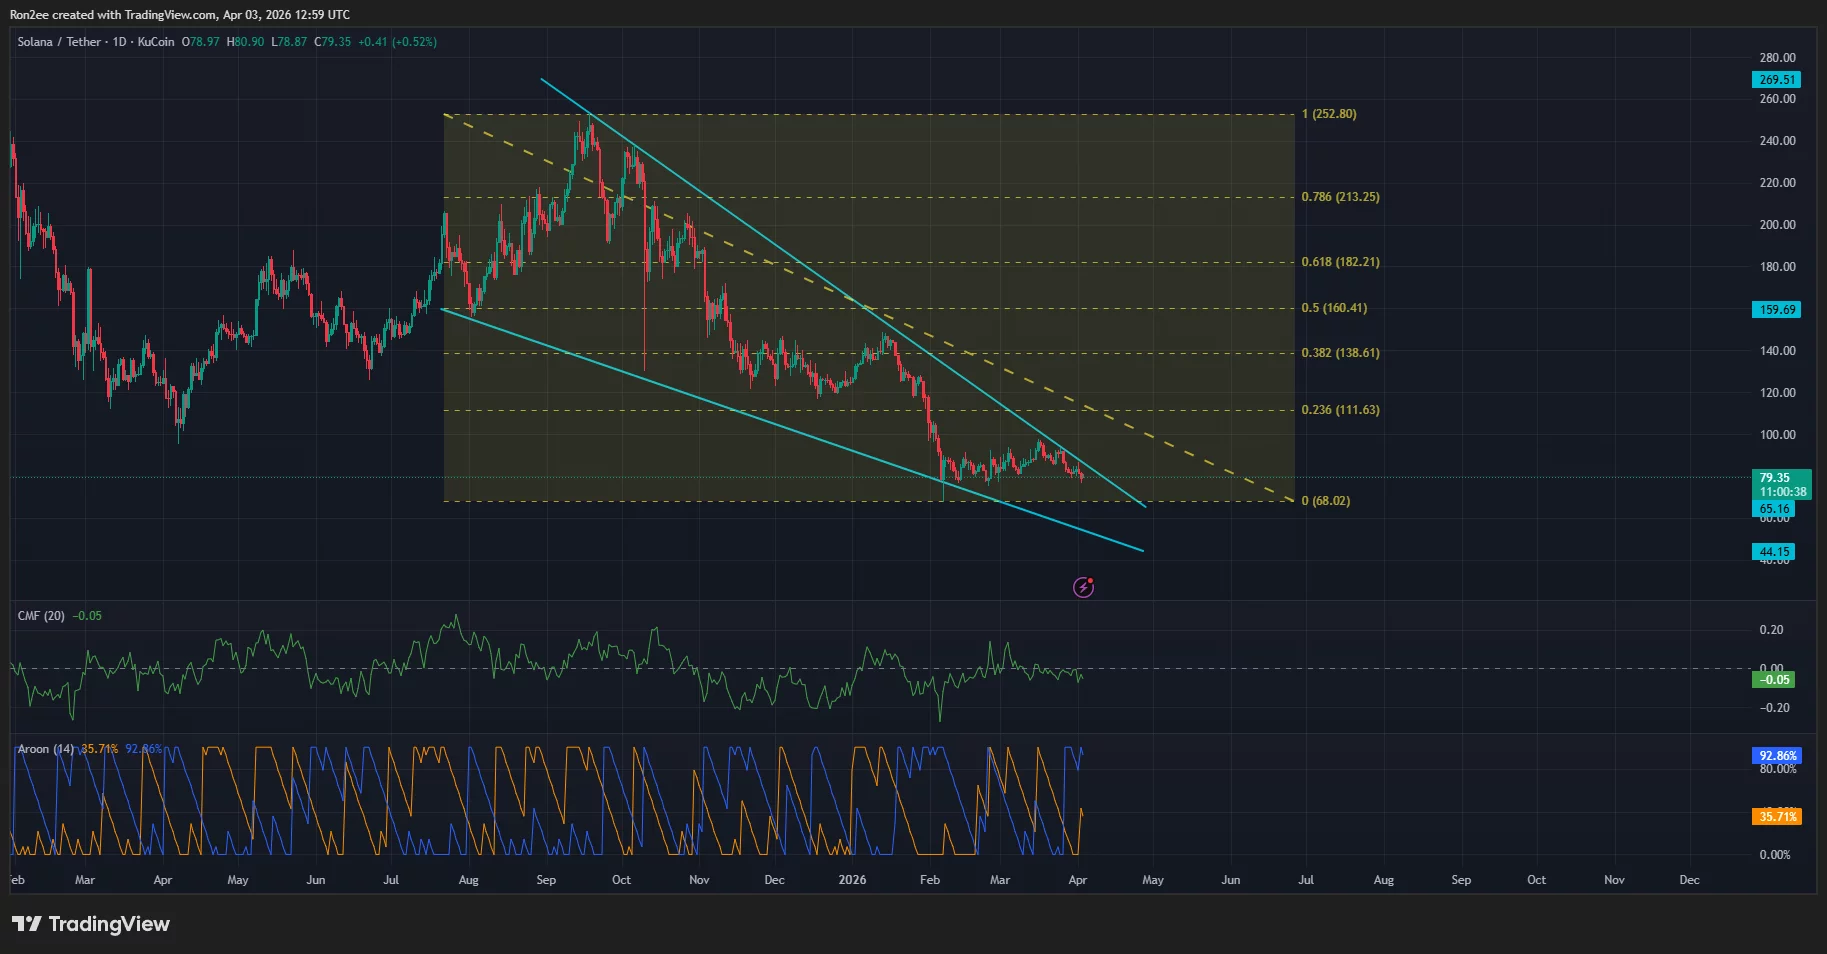
Solana price managed to hold above the $70 support on Thursday as bulls stepped in to defend the psychological level.
Summary
- Solana price dropped nearly 9% after a $270 million exploit on Drift and a sharp decline in network TVL.
- Broader risk-off sentiment driven by escalating Middle East tensions and rising oil prices added pressure on the token.
- Technical indicators show weakening momentum despite a potential falling wedge breakout, with bears still dominating trend strength.
According to data from crypto.news, Solana (SOL) price fell nearly 9% from an intraday high of $85.1 on Wednesday to an intraday low of $77.6 on Tuesday before stabilizing at $80 at press time.
Solana price fell following a $285 million exploit that occurred yesterday on Drift Protocol, a trading venue native to the Solana blockchain. Following the breach, the total value locked on Solana has shrunk by nearly $1 billion since the incident, per DeFiLlama.
The token also fell amid tensions in the Middle East that continued to drive investor sentiment away from risk assets. Notably, Iranian officials noted they would be targeting retaliatory measures against 18 U.S. military assets, including strategic bases in the region. On the other hand, the U.S. struck several key targets, including a critical supply bridge and logistics hubs.
The resulting conflict has fueled expectations that the Strait of Hormuz would continue to remain closed as the U.S. focuses its attention on bringing the regional threat to a standstill over the coming 2 to 3 weeks. Oil prices rose back above $110 amid fears of runaway inflation and supply chain disruptions.
On the daily chart, Solana price is close to breaking out of a multi-month falling wedge pattern formed of two descending and converging trendlines. A breakout from a falling wedge pattern often signals a powerful bullish reversal as selling pressure finally exhausts itself.

For Solana, a confirmed breakout from such a pattern could fling the price all the way to $111, which aligns with the 23.6% Fibonacci retracement level. Reaching this target would represent a significant recovery from recent lows and could reignite broader investor interest in the ecosystem.
However, current technical data suggests some caution on the way. Notably, the Chaikin Money Flow index showed a negative reading of -0.05. A negative reading on the indicator suggests that there is still a lack of strong buying pressure and that some capital is still flowing out of the asset.
At the same time, the Aroon Down stood at 92.86% while the Aroon Up was at 35.71%, which means the bears still hold the upper hand in terms of trend strength. This disparity indicates that while a breakout is possible, the downward momentum has not yet been fully broken by the bulls.
Disclosure: This article does not represent investment advice. The content and materials featured on this page are for educational purposes only.

Coinbase and the Linux Foundation launched the X402 Foundation on April 2, 2026, a non-profit tasked with stewarding an open-source protocol that finally puts the 30-year-dormant HTTP 402 status code to work as the web’s native payment layer.
The founding coalition includes Stripe, Cloudflare, AWS, Google, Microsoft, Visa, and Mastercard, which means this is not a crypto-native experiment – it is a bid to rewire how the entire internet handles money.
Key Takeaways:
- Protocol Scope: X402 standardizes the HTTP 402 “Payment Required” response code to trigger stablecoin or ERC-20 token settlement directly inside web and API interactions.
- AI-First Design: The protocol is built explicitly for autonomous AI agents – machines can encounter a paywall, read the X402 response, and settle the payment via a pre-authorized wallet with no human intervention required.
- Neutral Governance: By housing X402 under the Linux Foundation, Coinbase has structurally prevented any single corporation – including itself – from controlling the web’s new financial rails.
- Layer-2 Integration: X402 is blockchain-agnostic but debuted on Base, Coinbase’s Layer-2 network, with Cloudflare’s Agents SDK already supporting live transactions on Base Sepolia testnet using USDC.
- Micropayments at Sub-Cent Cost: Stablecoin settlement delivers near-instant finality at sub-cent transaction fees – a cost structure that credit card networks and ACH cannot match for machine-to-machine commerce.
- What to Watch: Reference implementation and SDK releases scheduled throughout 2026 are the critical adoption milestones – browser-level integration and sign-off from traditional financial members will determine whether X402 becomes infrastructure or a footnote.
Discover: The best crypto to diversify your portfolio during market turbulence
What X402 Actually Does – and Why HTTP 402 Sat Unused for Three Decades
HTTP 402 was reserved in 1995 as a placeholder for future payment systems that never arrived. The reason it never arrived is structural: the internet had no native settlement layer.
Every payment required routing through a third-party processor, a bank, or a proprietary API – none of which a web server could negotiate with autonomously at the protocol level.
X402 changes the handshake. When a server requires payment, it issues a standardized X402 response containing the price, accepted tokens, and payment terms. The client – whether a browser, an application, or an AI agent – reads those terms, constructs a signed payment payload in the X-PAYMENT HTTP header, and submits it. A payment facilitator (currently the Coinbase X402 Facilitator) verifies the signed payload before the server returns an X-PAYMENT-RESPONSE confirmation. The entire flow is atomic and requires no account creation, no API key provisioning, no manual authentication step.
The protocol supports all ERC-20 tokens – not just stablecoins, and is designed to be blockchain-agnostic, though its early infrastructure runs on Base, Coinbase’s Layer-2 network. Cloudflare has already shipped a withX402Client wrapper for its Agents SDK that lets developers toggle between human-confirmation and fully autonomous execution modes. The technical specification and codebase are publicly available at x402.org under LF Projects, LLC.
Linux Foundation CEO Jim Zemlin described the foundation as the “neutral home” for the protocol – language that signals deliberate insulation from the kind of corporate capture that killed earlier micropayments standards.
That governance decision is what separates X402 from Coinbase’s previous developer initiatives: this is not a product. It is an attempt to establish a standard.
Explore: The best pre-launch token sales with asymmetric upside potential
Who Benefits – and What X402 Needs to Actually Win
The immediate winners are developers building on Base and anyone deploying autonomous AI agents that need to purchase data, call premium APIs, or access metered content at scale.
Traditional payment infrastructure, built around two-factor authentication and fixed per-transaction fees – is structurally incompatible with high-frequency, low-value machine-to-machine payments. X402 is purpose-built for exactly that environment.
Coinbase benefits disproportionately in the near term. Base is the reference network, the Coinbase X402 Facilitator is the default payment verifier, and USDC, Circle’s stablecoin with deep Coinbase ties, is the primary settlement asset.
The x402 foundation launched on 4/02 by the way. https://t.co/WULpuBdVhW
— Coinbase
(@coinbase) April 3, 2026
The open governance structure prevents lock-in on paper, but network effects will concentrate volume on whatever infrastructure ships first. That is currently Base. The broader regulatory groundwork Coinbase has laid through FIT21 advocacy compounds this structural advantage – a company that shapes both the legal framework and the technical standard occupies a uniquely durable position.
The adoption risk is browser integration. X402 can function today at the application and API layer without any browser changes, but mainstream consumer adoption requires Chrome, Safari, and Firefox to natively parse X402 responses.
Google and Microsoft are founding members of the X402 Foundation, which is the strongest signal available that browser-level support is on the roadmap, but roadmaps are not shipping products. The protocol wins if the SDKs land before a competing standard gains traction. It stalls if the major browser vendors treat this as a low-priority governance commitment rather than an active engineering project.
The verdict: X402 is the most credible attempt to build a native payment layer into the web since the original HTTP spec reserved that status code. Execution is the only variable left.
The post Coinbase & Linux Foundation Debut X402: HTTP-Native Crypto Payment Standard appeared first on Cryptonews.

Arkham Intelligence published a comprehensive breakdown of the largest Ethereum (ETH) holders in 2026, revealing that staking contracts, exchanges, and financial institutions now control most of the supply.
The report draws on on-chain data from the Arkham Intel Platform and covers entities ranging from centralized exchanges to individual pre-sale investors.
Staking and Exchanges Control Most ETH
The ETH2 Beacon Deposit Contract sits at the top of the list with over 82 million ETH, valued at approximately $169 billion.
That figure represents roughly 66% of the total ETH supply, locked by validators securing the network.
Among exchanges, Coinbase leads with 4.2 million ETH ($8.6 billion), followed by Binance with 3.6 million ETH ($7.3 billion).
South Korean exchange Upbit ranks third at 1.7 million ETH. These holdings are custodial, held on behalf of users for trading, withdrawals, and staking services.
On the financial institution side, BlackRock holds over 3 million ETH ($6 billion) through its iShares Ethereum Trust ETF.
Treasury company Bitmine has declared 4.7 million ETH in total, though only 914,000 ETH has been verified on-chain by Arkham.
Bitmine aims to accumulate 5% of the total ETH supply.
Individual Holders and Lost Fortunes
Among individuals, Estonian pre-sale investor Rain Lohmus technically owns the most ETH at 250,000 tokens worth $530 million.
However, he lost access to his private keys after purchasing them for $75,000 during the 2014 presale.
Ethereum co-founder Vitalik Buterin is the largest individual holder with accessible funds, holding 224,000 ETH ($480 million).
Ethereum Foundation Shifts From Selling to Staking
Separately, Arkham reported the Ethereum Foundation staked an additional $46.64 million in ETH, its largest single-day deployment.
That brings the Foundation’s total staked amount to approximately $96.59 million.
The move is part of a broader plan announced in February to stake 70,000 ETH from its treasury. Staking rewards will fund research, ecosystem grants, and protocol development.
The Foundation previously relied on periodic ETH sales, which drew community criticism for creating sell pressure.
With institutions, exchanges, and now the Ethereum Foundation itself locking supply into validators, the distribution of ETH increasingly favors long-term holders over liquid markets.
The post Who Really Owns All the Ethereum? On-Chain Study Reveals Surprising Names appeared first on BeInCrypto.

Brandi Glanville Recalls Buying New Vagina With Ex’s Amex

Road to the Playoffs: Raptors’ schedule could help them sneak past 76ers

Met Office extended Storm Dave yellow weather warning

Smart energy pays enters the US market, targeting scalable financial infrastructure

Why Israel is blocking foreign journalists from entering

Bitcoin: We’re Entering The Most Dangerous Phase

“Bitcoin Is Following A Pattern Nobody Wants To Admit” | Anthony Scaramucci

Banking & Financial Current Affairs MARCH 2026 | Monthly Current Affairs Series By Sheetal Mam

How Is Everything Outpacing Inflation At The Same Time?
-

 NewsBeat7 days ago
The Story hosts event on Durham’s historic registers
-

 NewsBeat19 hours ago
Steven Gerrard disagrees with Gary Neville over ‘shock’ Chelsea and Arsenal claim | Football
-

 Sports7 days ago
Sweet Sixteen Game Thread: Tide vs Michigan
-
Entertainment4 days ago
Fans slam 'heartbreaking' Barbie Dream Fest convention debacle with 'cardboard cutout' experience
-

 Crypto World2 days ago
Gold Price Prediction: Worst Month in 17 Years fo Save Haven Rock
-

 Business14 hours ago
No Jackpot Winner and $194 Million Prize Rolls Over
-
 Entertainment6 days ago
Lana Del Rey Celebrates Her Husband’s 51st Birthday In New Post
-

 Tech4 days ago
The Pixel 10a doesn’t have a camera bump, and it’s great
-
Crypto World3 days ago
Dems press CFTC, ethics board on prediction-market insider trades
-

 Sports3 days ago
Tallest college basketball player ever, standing at 7-foot-9, entering transfer portal
-

 Tech4 days ago
Avatar Legends: The Fighting Game comes out in July and it looks pretty slick
-

 Tech3 days ago
EE TV is using AI to help you find something to watch
-

 Fashion5 days ago
Amazon Sundays: Soft Spring Layers
-

 Business1 day ago
Login and Checkout Issues Spark Merchant Frustration
-

 Fashion6 days ago
When Evening Dressing Gets Colorful for Spring
-

 Tech3 days ago
How to back up your iPhone & iPad to your Mac before something goes wrong
-

 Tech5 days ago
Elon Musk’s last co-founder reportedly leaves xAI
-

 Tech4 days ago
Apple will hide your email address from apps and websites, but not cops
-

 Crypto World4 days ago
U.S. rule change may open trillions in 401(k) funds to crypto
-

 Politics4 days ago
Should Trump Be Scared Strait?
You must be logged in to post a comment Login