
Crypto World
Dogecoin Hold Key Trendline for Sixth Day as Historical Profit Metric Hits All-Time High

TLDR:
- Dogecoin has tested a descending trendline across six consecutive daily candles without breaking below support.
- Analyst Trader Tardigrade warns that current momentum is weak and a volume spike is needed to confirm a breakout.
- Dogecoin’s Number of Days Spent at a Profit has surpassed 1,100 days, marking a first-ever reading for the asset.
- The 1,100-day metric shows most historical holders are at a loss, a level that often precedes long-term accumulation phases.
Dogecoin is drawing attention from analysts as two distinct market signals emerge simultaneously. The asset is holding a key trendline on the daily chart while posting a historic reading on a long-term cycle indicator.
Together, these developments are painting a complex picture for traders watching the market closely. The situation reflects both caution and structural interest in Dogecoin at its current price level.
Trendline Support Remains Intact but Momentum Raises Questions
Dogecoin has tested a descending trendline across six consecutive daily candles. Each test has so far resulted in the price holding above support.
Crypto analyst Trader Tardigrade noted that structure remains technically bullish under these conditions. However, the analyst also pointed out that the current price action appears to be running low on energy.
According to Trader Tardigrade, the move lacks the buyer conviction needed to confirm a genuine breakout. The analyst specifically called for a volume spike and strong conviction candles as confirmation signals.
Without those, the setup is considered more hopeful than reliable. The brakes, as the analyst described, are lightly tapped on any upward momentum.
Volume remains a critical factor in determining whether this trendline holds or breaks. Thin volume during a trendline test often leads to false signals in either direction.
Traders are advised to watch price behavior closely before committing to a directional position. A high-volume candle closing above resistance would carry more weight than multiple low-volume closes.
Until clear confirmation arrives, Dogecoin remains in a wait-and-see zone technically. The trendline holding is a positive sign, but it does not guarantee continuation.
The market requires participation from genuine buyers to shift the current dynamic. That participation has not yet shown up in a measurable way on the chart.
Historical Metric Hits Unprecedented Level for Dogecoin
On the on-chain side, Dogecoin has reached a notable milestone in a long-term cycle metric. Analyst Joao Wedson reported that Dogecoin has now accumulated more than 1,100 historical days where price traded higher than today’s level.
This is the first time the asset has reached this reading. The metric is called the Number of Days Spent at a Profit.
This indicator measures how many past trading days recorded prices above the current level. A higher reading reflects a longer history of trading at elevated prices compared to now.
It captures the aggregated positioning and memory of holders over time. This is a structural metric, not a short-term signal.
Wedson described the reading as a cycle-level development rather than a day-trading data point. It speaks to where Dogecoin sits relative to its entire price history.
More than 1,100 days of higher historical prices means a large portion of past holders are currently at a loss. That kind of data often precedes a longer-term accumulation phase in similar assets.
The combination of trendline support and this historical metric gives analysts two separate angles to monitor Dogecoin going forward.


MSBT will launch tomorrow as the lowest-fee Bitcoin ETF on the market, potentially kicking off a fee war among funds.
Morgan Stanley’s much-anticipated spot Bitcoin (BTC) exchange-traded fund is expected to begin trading on Wednesday, April 8, on NYSE Arca. Bloomberg senior ETF analyst Eric Balchunas confirmed the launch date in an X post today, citing the NYSE’s listing notice.
Bloomberg’s Isabelle Lee had signaled during a Monday broadcast that the launch was imminent, stating it would be “probably this week.“
The fund will enter the market as the lowest-cost spot Bitcoin ETF in the U.S. Per Morgan Stanley’s most recent S-1 amendment filed with the SEC, the annual expense ratio is just 0.14%, undercutting Grayscale’s Bitcoin Mini Trust, which is currently the lowest-fee option at 0.15%, and sitting well below BlackRock’s IBIT, which charges 0.25%.
Bloomberg’s Balchunas called the pricing a “semi-shock,” noting that the lower fee means none of Morgan Stanley’s roughly 16,000 financial advisors “will feel conflicted using it and they have shot at getting outside assets. Smart.”
The Defiant first covered Morgan Stanley’s filing for the ETF back in January, when the Wall Street giant — which manages nearly $9 trillion in assets — filed with the Securities and Exchange Commission (SEC) to launch both a spot Bitcoin and spot Solana ETF. At the time, Timot Lamarre of Bitcoin custody firm Unchained told The Defiant the launch would add to Bitcoin’s legitimacy and intensify fee competition among issuers.
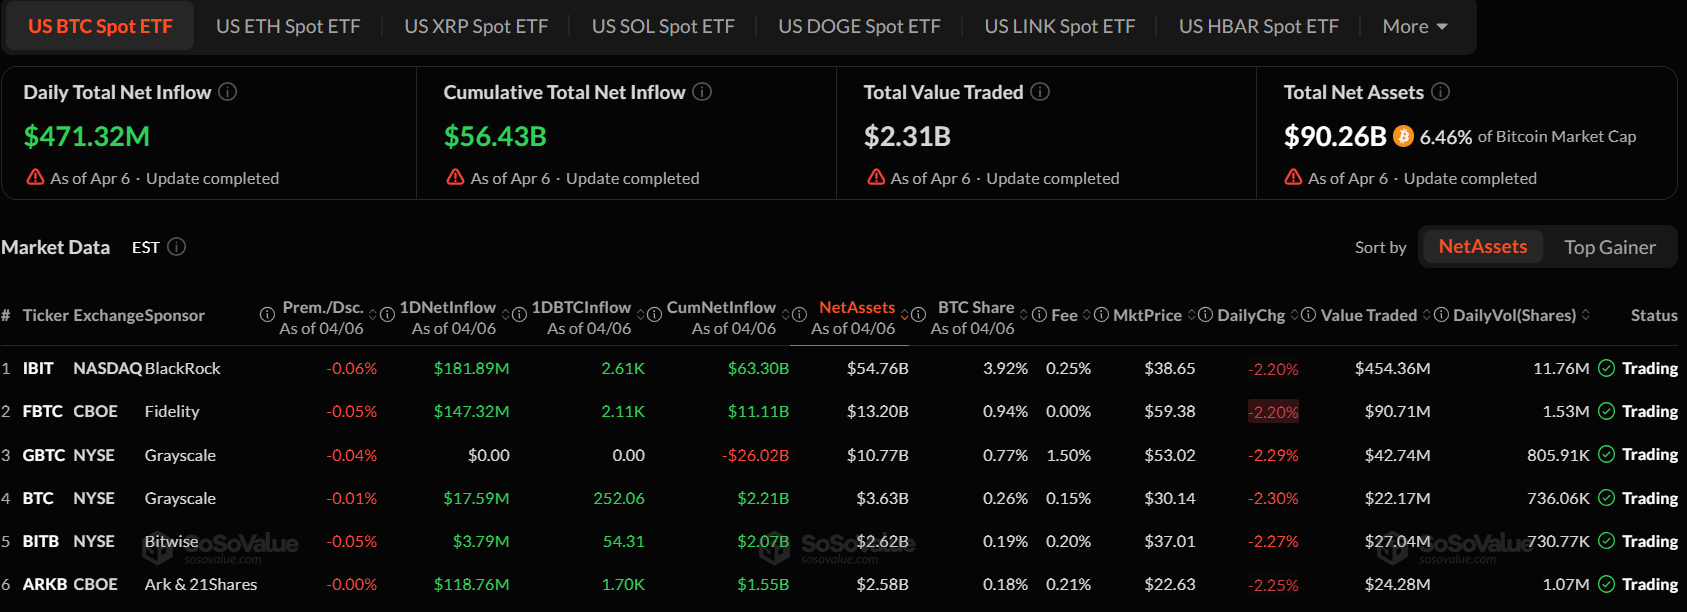
The launch comes at a moment of renewed momentum for Bitcoin ETFs broadly. Spot Bitcoin ETFs had a weaker start to 2026, but yesterday, April 6, marked the largest net inflow day for U.S. spot BTC ETFs since February, with $471.32 million in net inflows, per SoSoValue.
BlackRock’s IBIT remains the dominant player by a wide margin, with over $63 billion in cumulative net inflows per SoSoValue, whereas cumulative net inflows across all Bitcoin ETFs currently sits at $56.43 billion.
Since the launch of spot Bitcoin ETFs in the U.S. in early 2024, an historical moment for the crypto industry, multiple major TradFi players have moved to launch their own products.
Morgan Stanley’s MSBT will be the first BTC ETF from a U.S. investment bank, but it will trade alongside funds from major asset managers, namely BlackRock, Fidelity, VanEck, Franklin Templeton, and others.
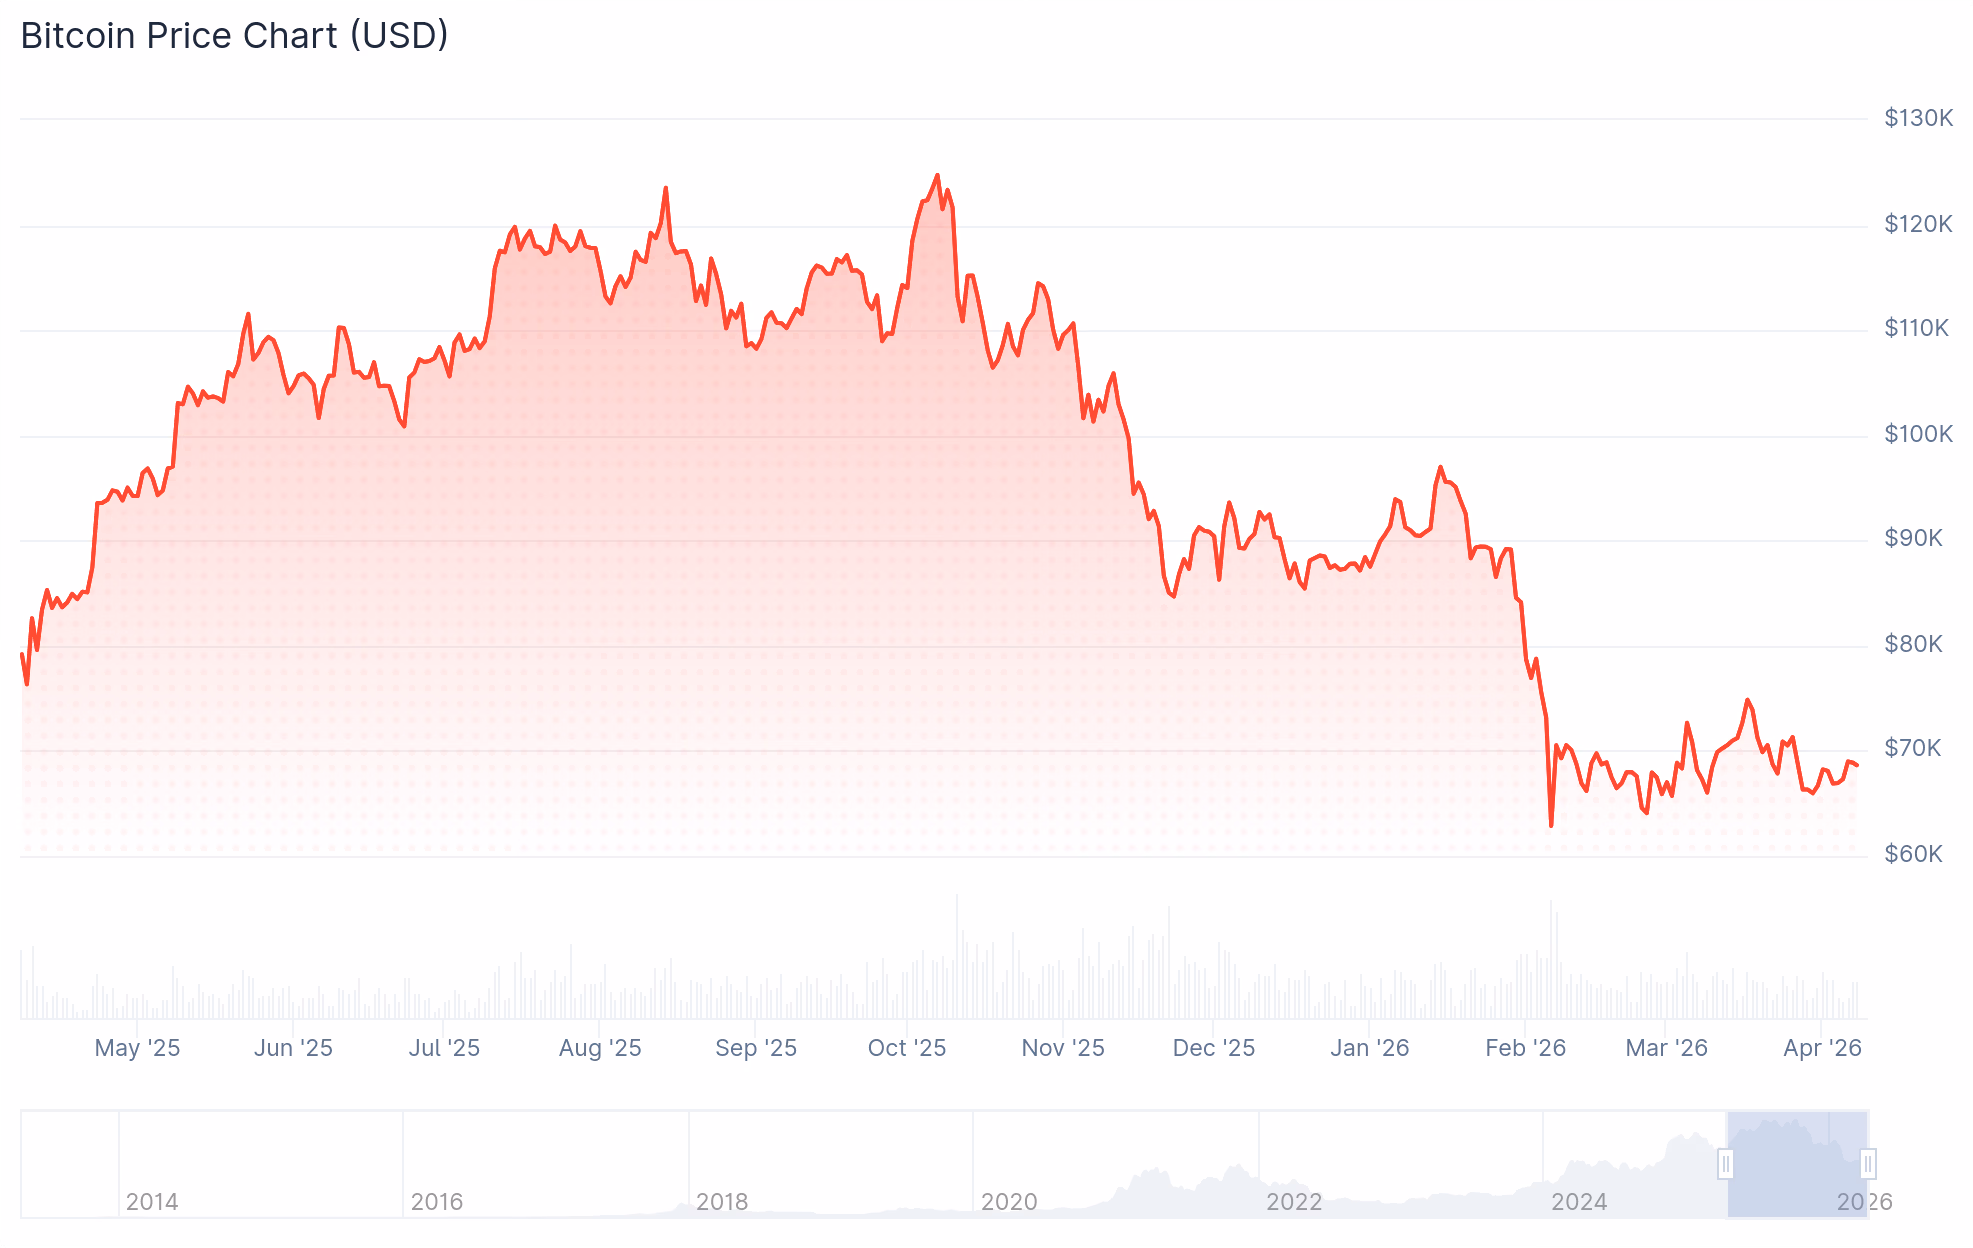
Spot BTC is currently trading around $68,600, down 13% on the year, and over 45% below its all-time high around $126,000, which was s4t in October of last year.

This article was written with the assistance of AI workflows. All our stories are curated, edited and fact-checked by a human.
The AAVE token has lost roughly 75% of its value since its most recent peak in August 2025.
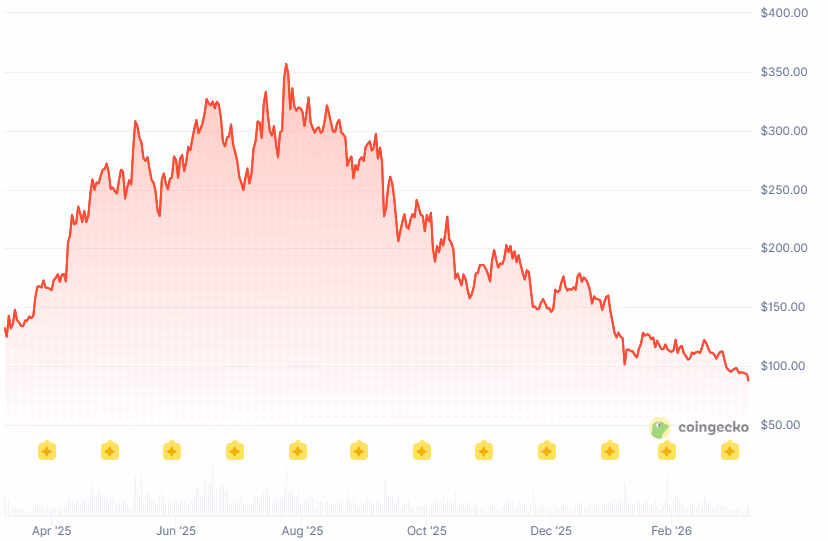
AAVE fell as low as $85 on Tuesday before partially recovering to trade near $88, extending a selloff that has now erased roughly 75% of the token’s value since its August 2025 high near $356.
The latest drop came as DeFi selling accelerated across the board, but AAVE has been underperforming the broader market for months amid an escalating governance crisis that has cost the protocol three prominent independent contributors.

Chaos Labs announced Monday that it is proactively terminating its engagement with the protocol, citing a fundamental disagreement over how risk should be managed and inadequate funding to cover expanded responsibilities under Aave V4.
Aave founder Stani Kulechov thanked the firm for its contributions but pushed back on several aspects of Chaos’ account.
Chaos Labs’ exit follows BGD Labs’ departure on April 1, citing what it called an increasingly centralized dynamic around Aave Labs and V4 development. Marc Zeller of the Aave Chan Initiative (ACI) called it “the most significant talent loss in Aave’s history.”
And Zeller’s own organization followed suit. In early March, ACI announced it would wind down its engagement with the DAO, citing structural breakdowns in governance.
Governance Dispute
It all started in December, when a governance dispute erupted after a delegate discovered that Aave Labs had been redirecting approximately $200,000 per week in interface fees — previously flowing to the DAO — to itself via a CowSwap integration.
The controversy escalated into a broader confrontation over tokenholder rights, brand ownership, and the balance of power between the DAO and Aave Labs. BGD Labs co-founder Ernesto Boado proposed a token alignment initiative to shift control toward the DAO, which Kulechov publicly opposed, saying it would “slow down and potentially derail” the protocol’s momentum. The proposal was ultimately voted down, with the token dropping roughly 20% over the course of the dispute.
In February, Aave Labs submitted its “Aave Will Win” framework, requesting up to $51 million in funding from the DAO in exchange for routing 100% of product revenue to the treasury. The proposal narrowly passed its Temp Check, though Zeller’s post-mortem analysis argued the broader delegate base had actually leaned against it when excluding Aave Labs–linked voting power.
The community turmoil has created a striking divergence between Aave’s protocol metrics and its token performance. The protocol remains DeFi’s largest lender with over $24 billion in total value locked (TVL), and generated $124 million in net revenue in 2025, up 72% from 2024, according to DeFiLlama.
Yet at roughly $88, AAVE is trading 86% below its May 2021 all-time high of $666 and roughly 75% below the $356 level it reached in August 2025. The token is also underperforming the broader crypto market — down about 10% over the past seven days while Bitcoin and Ether are up, according to CoinGecko.
This article was written with the assistance of AI workflows. All our stories are curated, edited and fact-checked by a human.
Crypto World
Trump-linked World Liberty Financial questioned over partner’s prior links to sanctioned network


A cryptocurrency venture tied to U.S. President Donald Trump is facing fresh scrutiny after partnering with a firm whose “flagship project” had recently involved individuals later sanctioned by the U.S. and U.K.
, a crypto business co-founded by Trump and partly owned by his family, said it carried out due diligence before integrating its USD1 stablecoin with the Southeast Asia-based blockchain project AB DAO.
However, a Times investigation released on Monday found the company was unaware that AB DAO had, until weeks earlier, promoted a resort project linked to figures associated with Cambodia’s Prince Group, an organization U.S. authorities have described as a major transnational criminal network.
The partnership was announced in November, shortly after coordinated U.S. and U.K. sanctions targeting Prince Group founder Chen Zhi and associates for alleged involvement in large-scale fraud. Individuals connected to the group had been involved in AB DAO’s promoted resort project before being removed following sanctions.
CoinDesk has contacted WLFI, launched in September 2024, for comment, but the company had not responded at the time of publication. However, WLFI told The Times it has “no association or relationship with the sanctioned individuals.”
The developments add to broader questions around World Liberty’s governance and external relationships. Reporting by The Wall Street Journal in January revealed that a company backed by United Arab Emirates (UAE) national security adviser Sheik Tahnoon bin Zayed Al Nahyan quietly agreed to acquire a 49% stake in WLFI for $500 million shortly before Trump returned to office.
The deal marked “something unprecedented in American politics,” according to the Wall Street Journal, which cited legal experts raising potential conflict-of-interest concerns. The White House has denied any impropriety.
There is no suggestion that WLFI had any direct connection to the Prince Group, according to The Times. However, the report raises questions about the effectiveness of due diligence around its partnerships.
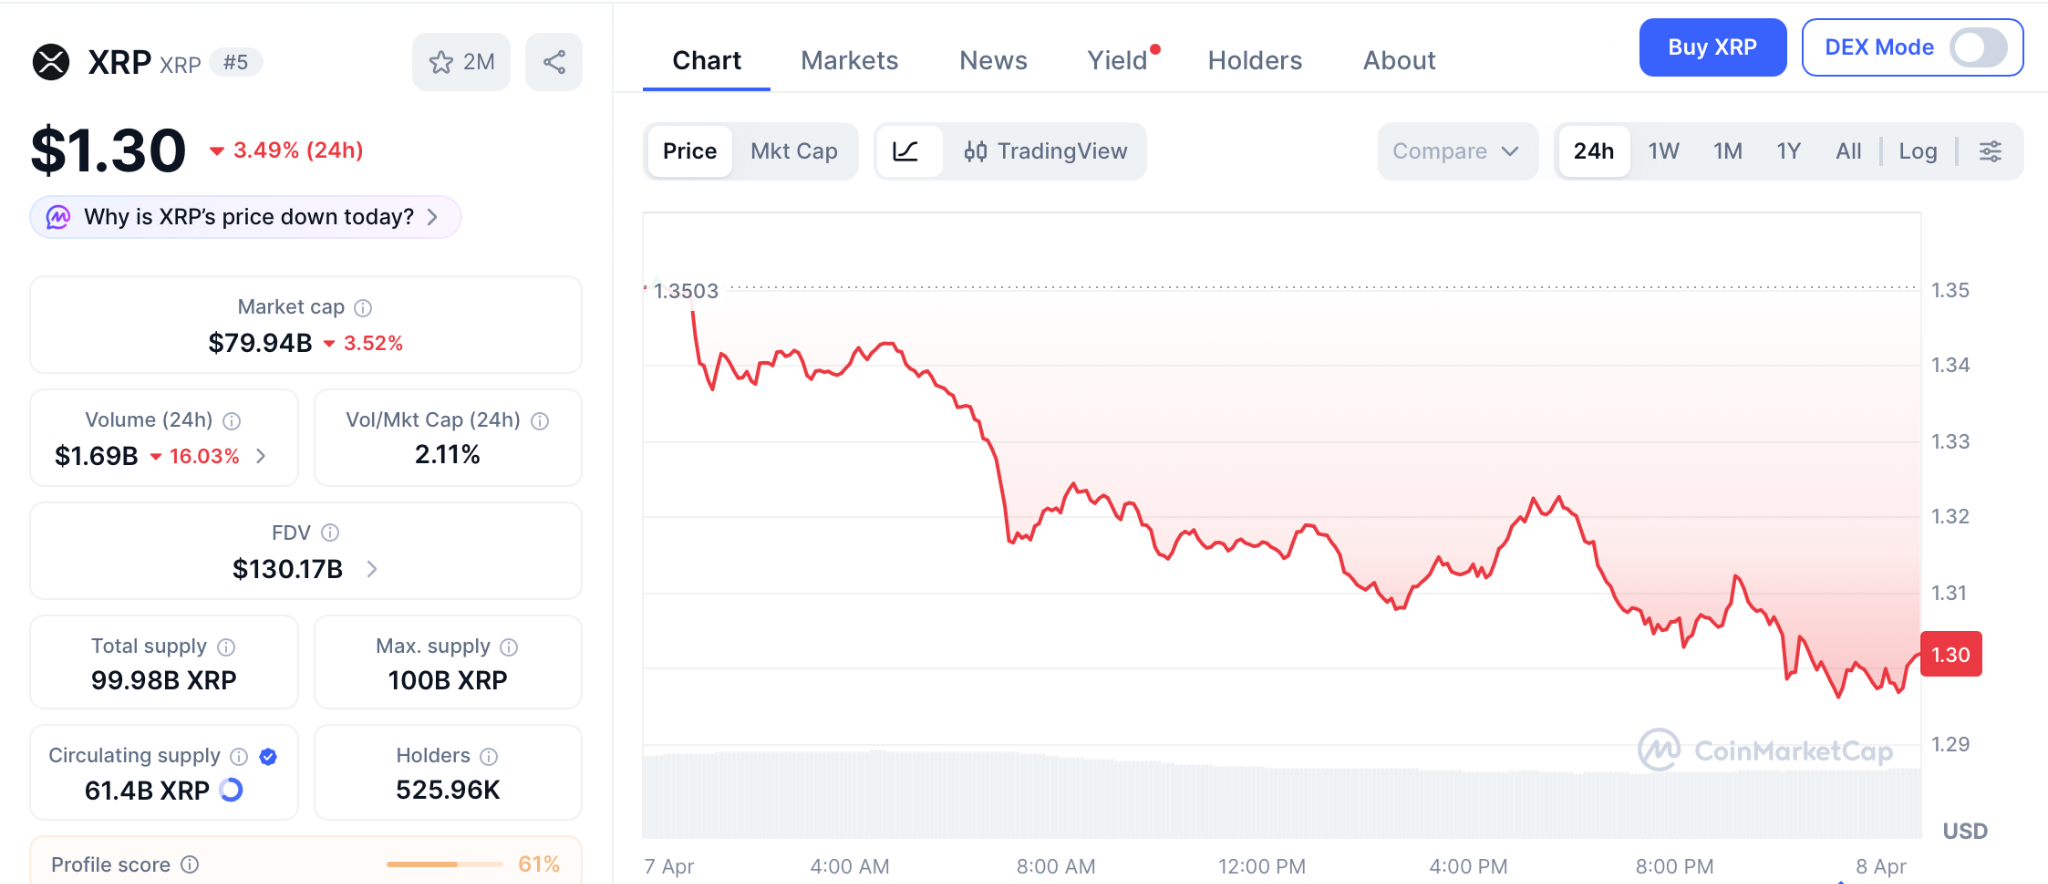
The XRP price sits around $1.30 as historical results from previous Aprils along with resistance at $1.60 influence the market outlook.
Key Insights
- Previous April has been volatile for XRP, with impressive gains in some years and losses in others.
- Consolidation at levels ranging from $1.28 to $1.36 indicates decreased volatility.
- $1.60 is an important resistance level to watch out for.
Unpredictability of the Market in April for XRP
April has proven to be inconsistent regarding its performance related to XRP, meaning that the asset is quite unpredictable when this month comes along.
Although XRP managed to show impressive gains during some periods, other years were characterized by negative movements, leaving many traders with an unsure feeling when analyzing the seasonality of this period.
For example, the coin experienced an increase by 66.11% in April 2018 and even more impressive growth — nearly 180% in April 2021. Thus, every upcoming April becomes a cause for optimism since the coin has managed to produce quite remarkable results in such periods before. However, it appears that this seasonality is gradually diminishing.
April 2022, 2023, and 2024 months witnessed negative movement, which leaves traders with concerns about the future movement. Hence, they have started taking into consideration seasonal information but at the same time using technical indicators.
Narrow Price Consolidation Suggests Upcoming Breakout
Currently, XRP trades in a tight range from $1.28 to $1.36, with this trend having been in place since late March. This type of price consolidation usually happens when there is low price volatility and is an indication that a major price movement will soon happen.
Whenever prices consolidate in a certain range, it normally implies that sellers and buyers have reached a temporary consensus, but sooner or later, one side takes control, resulting in a price explosion either upwards or downwards. For XRP, traders pay close attention to the volume of trades for validation purposes whenever a breakout happens.
Moreover, the occurrence of a falling wedge pattern implies that a bullish breakout might be expected. Falling wedge patterns are common occurrences that indicate upcoming uptrends, especially if trading volumes keep on rising.
Resistance Levels Determine Short-Term Trend
Currently, the $1.40 level has proved to be a key intermediate resistance level that is supported by the most important moving averages. A break above this level will indicate growing buying sentiment and can set the stage for a move towards the following resistance level of $1.60.
The $1.60 level still represents an important obstacle on the way to higher prices for XRP. The price had been rejected from this level back in March, confirming its importance as a strong resistance area. Breaking out above the $1.60 level will be a confirmation that upward trend momentum is intact.
If XRP fails to overcome the $1.40 level, it can be locked in the current range for some more time. Volume is another important aspect to pay attention to when analyzing the charts. High trading volumes can confirm the validity of a breakout move.
Benefits of Ripple Treasury System Introducing Digital Assets
In addition to technical analysis, Ripple continues to grow by adding new financial systems. The launch of Digital Asset Accounts and the Unified Treasury System represents a crucial move towards incorporating digital assets within traditional finance.
The Unified Treasury System will enable XRP and RLUSD balances to be monitored alongside traditional currencies in real-time. This integration between crypto assets and conventional financial practices makes it easy for organizations to incorporate digital assets.
It might be an essential step towards establishing a greater use and demand for XRP. Although this news might not affect prices, it can positively influence market sentiment.
Recovery Sentiments Begin to Emerge in Market
XRP is currently trading at around $1.31, showing signs of temporary weakness in the short term. However, the current state of the market has revealed signs of early recovery among the leading cryptos.
Trading sentiments remain cautious as investors await the breakout of prices above critical resistance levels. This shows that the market is at a decision point and the breakout could be significant in the next few weeks to come.
In any case, the performance of XRP in April will be determined by whether there is a breakout of prices above critical resistance levels or not.


Cloudflare, one of the world’s largest CDN and internet edge networks, has substantially accelerated its deadline to migrate to post-quantum cryptography amid fears that hardware breakthroughs could render current encryption obsolete within three years.
The quantum-vulnerable Bitcoin community rang alarm bells after the giant move.
Cloudflare announced its new post-quantum deadline, joining Google in an aggressive security sprint targeting 2029.
Two-thirds of human traffic to Cloudflare already uses post-quantum encryption, but the company wants that at 100% within three years.
Google set the same 2029 deadline two weeks ago, flagging concerning breakthroughs in quantum hardware, error correction, and factoring. The search engine giant has also already deployed post-quantum protections across Chrome, Android 17, and Google Cloud, and is forcing other engineering teams to follow suit.
By 2029, IBM plans to deliver its first fault-tolerant quantum machine, Starling.
The quantum breakthroughs just keep coming
The announcements continue a blistering pace of quantum breakthroughs over the last few weeks.
On March 30, Google Quantum AI released a whitepaper showing that fewer than 1,200 logical qubits could theoretically solve Bitcoin’s 256-bit Elliptic Curve Discrete Logarithm Problem.
On superconducting hardware, that meant fewer than 500,000 physical qubits by its estimate. That’s roughly a 20-fold reduction from the prior benchmark of approximately 9 million set in 2023.
The same day, Oratomic, a quantum startup founded by Caltech and Harvard faculty, theorized that Shor’s algorithm could run at cryptographically relevant scales with as few as 10,000 reconfigurable neutral-atom qubits, a step-change improvement in solving 256-bit elliptic curve discrete logarithms.
On April 5, IQM Quantum Computers and Germany’s Fraunhofer FOKUS compiled Shor’s algorithm, gate by gate, at RSA-2048 scale — a first by quantum researchers.
Prior estimates for cracking RSA-2048 relied on symbolic extrapolation and theoretical modeling, whereas this research team produced a gate-by-gate assembly with an exact qubit budget.
Read more: Google’s quantum computer could break Bitcoin in two ways
Bitcoin has a big quantum problem
There are well over $100 billion in quantum-vulnerable bitcoin (BTC), including legacy wallets such as Satoshi Nakamoto’s holdings.
Chaincode Labs, Bitcoin’s hub for technical development, estimated a comprehensive post-quantum migration could take seven years.
Taproot, Bitcoin’s prior upgrade, took four years from proposal to activation, while SegWit required two.
Approximately 1.7 million BTC have permanently exposed public keys. Chaincode puts the broader vulnerability to a cryptographically-relevant quantum computer at 20-50% of BTC, worth as much as $680 billion.
Justin Drake, a pro-Ethereum researcher who co-authored Google’s whitepaper, believes there’s at least a 10% chance a quantum computer recovers a Bitcoin private key by brute force from an exposed public key by 2032.
Bitcoin has a market capitalization of $1.36 trillion with a software upgrade process measured in years. Cryptographically-relevant quantum computers also have a deadline measured in years and could have as few as three left, according to Cloudflare, Google, and IBM.
Got a tip? Send us an email securely via Protos Leaks. For more informed news, follow us on X, Bluesky, and Google News, or subscribe to our YouTube channel.

April could be the month where the crypto market turns from panic to momentum, and the clues are piling up faster than most people notice. Bitcoin reclaimed $70,000 on April 6 after squeezing $196 million in shorts as ceasefire reports surfaced, per CoinDesk, and the Fear and Greed Index is sitting at 9, a level that has marked the bottom before every major rally in crypto history.
When BTC stabilizes and starts climbing, altcoins chase it with larger moves every time, and the question of will crypto go up in April is shifting from whether to which tokens catch the biggest wave when it happens. For anyone still asking will crypto go up in April, three projects stand out, and the first one already raised $8.82 million while everyone else is still figuring out whether to move.
The exchange covers every cryptocurrency across Ethereum, BNB Chain, and Solana through a single verified system, getting rid of the scattered apps that overcharge and make traders pay double for every cross-chain move. Pepeto puts cross-chain swaps, token bridging, and full portfolio tools into one place.
The exchange handles every tradable coin across the full crypto market, not just memes, so every trade and every bridge fills the same pipeline and pushes organic demand into the token.

Both SolidProof and Coinsult audited every contract, the founder behind the original Pepe coin is running the project, and the staking numbers alone answer will crypto go up in April for anyone doing the math. Put $10,000 in and stake at 186% APY and that position earns you $18,600 per year, which breaks down to roughly $1,550 every single month going straight back into your bag while the exchange prepares to go live and multiply every position you locked in early.
Each presale round sells out quicker than the last and the floor price jumps the instant the current window closes, so today’s entry is the lowest price this token will ever carry.
XRP Eyes Breakout as CLARITY Act Vote Hits the Senate
Anyone asking will crypto go up in April should watch what XRP is doing right now, because the chart is about as clear as it gets. The Senate Banking Committee is targeting a late April markup of the CLARITY Act, and Senator Moreno warned that if the bill does not reach the floor by May it is dead until after midterms.
Analysts project $2.60 for XRP this cycle if CLARITY passes, giving the token a 2x from $1.30 according to CoinMarketCap. That is a decent return for XRP holders, but Pepeto at presale with $1,550 monthly staking income on $10,000 and a Binance listing ahead delivers what large caps at multi-billion valuations cannot, and Cardano completes the trio.
Cardano Builds Strength as Whales Buy 220 Million ADA in One Week
Cardano whales bought 220 million ADA worth $53 million in a single week while retail panicked, pushing large wallet holdings to 13.84 billion coins, per Santiment. Stablecoin supply on the network doubled year over year and the Midnight mainnet launched with Monument Bank already running tokenized deposits.
Analysts see $2.20 as the top end this cycle if recovery builds into Q2. For long-term holders that is a strong 8x from $0.24, and it answers will crypto go up in April with a clear yes. But the largest gains are not hiding in coins that already reflect their recovery, they are waiting in presale entries with working tools and staking that is already compounding.
The Verdict
Will crypto go up in April? Every data point says yes, and XRP and Cardano are both lined up to ride the wave with 2x to 8x gains. But $8.82 million raised, two independent audits, and 186% APY staking turning $10,000 into $1,550 per month is the kind of entry that moves with or without the broader market.
Visit the Pepeto official website and secure your entry now, because the wallets that get in at presale always become the ones everybody else regrets not following.
The names that turn into legends in crypto never come from the tokens everyone already owns, they come from the presale nobody expected, and Pepeto at $0.0000001863 is writing that story right now.
Click To Visit Pepeto Website To Enter The Presale

FAQs
Will crypto go up in April 2026?
Will crypto go up in April looks likely as BTC reclaimed $70,000 squeezing $196M in shorts and Fear and Greed hit 9. XRP, Cardano, and Pepeto are set for the biggest gains.
How does Pepeto staking work for early buyers?
Stake $10,000 at 186% APY to earn $18,600 per year or roughly $1,550 per month. Rewards grow daily while the exchange launch approaches.
Disclaimer: This is a Press Release provided by a third party who is responsible for the content. Please conduct your own research before taking any action based on the content.


The 25th amendment Trump Iran war political crisis escalated sharply on Tuesday when former Rep. Marjorie Taylor Greene, conservative commentator Candace Owens, and media personality Alex Jones all publicly called for President Trump’s removal from office after his “a whole civilization will die tonight” Truth Social post.
Summary
- MTG posted “25TH AMENDMENT!!! Not a single bomb has dropped on America. We cannot kill an entire civilization. This is evil and madness,” becoming one of Trump’s most prominent former allies to call for his removal
- Alex Jones called Trump “an unhinged super villain from a Marvel comic movie,” while Candace Owens called him “a genocidal lunatic” and wrote “our Congress and military need to intervene”
- Former White House communications director Anthony Scaramucci said Trump was “calling for a nuclear strike” and demanded “immediate removal,” while VP Vance and the Cabinet remain fully supportive and have given no indication they would act
The 25th amendment Trump Iran war confrontation broke into open MAGA civil war on Tuesday as some of the president’s most prominent former supporters called for his removal from office. Former Rep. Marjorie Taylor Greene — once described as Trump’s most loyal congressional ally before her resignation earlier this year — posted on X: “25TH AMENDMENT!!! Not a single bomb has dropped on America. We cannot kill an entire civilization. This is evil and madness.”
Greene went further in an extended post, writing: “Everyone in his administration that claims to be a Christian needs to fall on their knees and beg forgiveness from God and stop worshipping the President and intervene in Trump’s madness. I know all of you and him and he has gone insane, and all of you are complicit.”
According to Newsweek, which first reported the wave of removal calls, Alex Jones wrote on X: “The definition of genocide is destroying an entire civilization/people! Trump literally sounds like an unhinged super villain from a Marvel comic movie. This IS NOT WHAT WE VOTED FOR!!!” Candace Owens posted: “The 25th amendment needs to be invoked. He is a genocidal lunatic. Our Congress and military need to intervene. We are beyond madness.”
Anthony Scaramucci, who served briefly as White House communications director during Trump’s first term, said on X: “It was at this point that our Founders thought the best thing to do would be to remove a mad man who has the executive office.”
How the 25th Amendment Works — and Why It Almost Certainly Will Not Happen
Section 4 of the 25th Amendment allows the vice president and a majority of the Cabinet to declare the president unable to discharge his duties. If the president contests the finding, the matter goes to Congress, where a two-thirds majority in both chambers is required to uphold the removal. The provision has never been invoked in US history.
In the current environment, it has no realistic path forward. VP JD Vance stated Tuesday morning that the US has “largely accomplished its military objectives” in Iran and expects the conflict to conclude “very shortly.” No Cabinet member has expressed any dissent. The calls from Greene, Jones, and Owens reflect outrage within a fractured MAGA coalition, not the Cabinet arithmetic the mechanism requires.
What This Means for the Political Landscape
The split is notable because it mirrors the broader market dynamic around this conflict. As crypto.news reported, each escalation in the Iran war has pushed Bitcoin lower, as investors reduce exposure to risk assets during periods of acute geopolitical uncertainty. The political fracturing of Trump’s base over Iran adds a new variable: domestic political instability now runs alongside geopolitical risk as a market headwind.
As crypto.news noted in earlier Iran war coverage, escalation phases have consistently produced 3 to 5% drops in major cryptocurrencies. Tonight’s 8 PM deadline introduces the possibility of either sharp relief, if a deal materializes, or another significant leg down across risk assets if large-scale strikes on Iranian infrastructure begin.
“How do we 25th amendment his a–?” Jones asked his co-host live on air Tuesday. The question went unanswered. The Cabinet’s silence on the matter strongly suggests the answer, for now, is that they don’t.
Morgan Stanley’s spot Bitcoin ETF, trading under the ticker MSBT, is set to debut on NYSE Arca on April 8 with a 0.14% management fee, the lowest of any US spot Bitcoin fund.
The product makes Morgan Stanley the first major US bank to issue a proprietary spot Bitcoin ETF rather than distribute a third-party fund. With roughly 16,000 financial advisors overseeing $6.2 trillion in client assets, the stakes extend well beyond a single ticker.
What Smart Money Will Track on Day One
Here’s what smart money and institutional investors will be tracking from the get-go:
1. Opening volume will test whether trillions in traditional wealth are moving
The combined launch-day volume across all spot Bitcoin ETFs in January 2024 reached roughly $4.6 billion. For a single new entrant, even $500 million to $1 billion would stand out.
Strong turnover would confirm that Morgan Stanley’s distribution network is converting interest into orders.
Weak volume would raise questions about whether investors have already committed to rivals.
2. The premium-to-NAV gap will expose real demand versus hype
New ETFs sometimes open at a premium when enthusiasm runs ahead of arbitrage.
A tight spread between MSBT’s market price and its net asset value (NAV) would signal efficient market-making and serious institutional participation.
A persistent discount, on the other hand, would suggest tepid early demand.
3. The 0.14% fee is a weapon, and competitors will need to respond
MSBT’s expense ratio sits one basis point below Grayscale’s Bitcoin Mini Trust at 0.15% and 11 basis points under BlackRock’s iShares Bitcoin Trust (IBIT) at 0.25%.
Because spot Bitcoin ETFs offer nearly identical exposure, even small cost differences can redirect billions over time.
4. Early advisor allocation signals matter more than Bitcoin’s price move
Morgan Stanley’s advisors have previously recommended portfolio allocations of 2% to 4% in crypto for eligible clients. The firm recently appointed Amy Oldenburg as Head of Digital Asset Strategy.
The move formalized crypto as a core execution priority rather than a research exercise.
Even a conservative shift of existing allocations into MSBT could generate tens of billions in new demand.
MicroStrategy CEO Phong Le has estimated that a 2% allocation across the platform could translate into roughly $160 billion in buying pressure, dwarfing most existing funds.
“Morgan Stanley Wealth Management oversees about $8 trillion in AUM and recommends a 0–4% bitcoin allocation. A 2% allocation would represent $160 billion, ~3X the size of IBIT. $MSBT: Monster Bitcoin,” he wrote.
5. Day-one flows will hint at whether MSBT becomes a gateway or stalls
MSBT launches with a small seed of approximately $1 million. Net creation activity on the first day will offer an early read on whether advisors are actively placing client orders.
The figure also matters because MSBT is not a standalone product. Morgan Stanley is simultaneously rolling out direct crypto spot trading through E*Trade for Bitcoin, Ether, and Solana, and has filed for a Solana trust.
Jed Finn, head of wealth management, has called direct crypto trading “the tip of the iceberg,” signaling plans for custody, wallets, and tokenized assets.
The Bigger Picture
The broader US spot Bitcoin ETF market holds roughly $90 billion in assets. If MSBT captures even a fraction of the wealth flowing through Morgan Stanley’s advisory network, it could shift competitive dynamics across the sector and compress fees further.
However, some analysts caution that investors have already picked their preferred funds, with IBIT alone holding over $54 billion.
While tomorrow’s open may not settle that debate, it will offer the first concrete data on whether a bank-branded, ultra-low-cost Bitcoin ETF can pull capital away from established players or whether the market has already consolidated around its early winners.
The post Morgan Stanley’s Bitcoin ETF To Go Live: 5 Things Smart Money Is Watching First appeared first on BeInCrypto.


The Iran US ceasefire deal update news today is contradictory and fast-moving: the New York Times reported that Iran halted ceasefire negotiations entirely after Trump’s “civilization will die” post, while Iran’s own Tehran Times simultaneously insisted that “diplomatic and indirect channels of talks with the US are not closed.”
Summary
- The New York Times, citing three senior Iranian officials, reported that Iran informed Pakistani mediators it was ending ceasefire negotiations after Trump’s 8 AM ET Truth Social post on April 7
- The Wall Street Journal separately reported that Iran cut off “direct communications with the US,” while Iran’s ambassador to Pakistan said mediation efforts had reached a “critical, sensitive stage”
- Iran submitted a 10-point peace proposal through Pakistani intermediaries rejecting a temporary ceasefire and calling instead for a permanent end to the war, the lifting of all sanctions, and reconstruction
The Iran US ceasefire deal update news today reflects a conflict between what different governments are saying publicly and what is happening through back channels. According to CNBC, citing the New York Times directly: “The New York Times, citing three senior Iranian officials, reported that Iran has stopped negotiation efforts with the U.S. and told Pakistan, which has acted as a mediator, that it would end ceasefire talks.” The Wall Street Journal added that Iran cut off “direct communications with the US.” But Iran’s Tehran Times posted on X that “diplomatic and indirect channels of talks with the US are not CLOSED” — and Iran’s ambassador to Pakistan said the peace efforts had reached a “critical, sensitive stage.”
The immediate trigger was Trump’s Truth Social post just after 8 AM ET on April 7, in which he wrote that “a whole civilization will die tonight.” Iranian officials cited the post as incompatible with negotiation. Foreign Ministry spokesperson Esmail Baghaei had already stated the day before that talks were “entirely incompatible with ultimatums, crimes and threats of war crimes.”
Before the breakdown, Iran submitted a formal 10-point proposal through Pakistani mediators. The proposal rejected any temporary 45-day ceasefire and instead demanded a permanent end to the conflict, a protocol governing safe passage through the Strait of Hormuz, the lifting of all US sanctions, and Iranian reconstruction funding. Trump publicly acknowledged the proposal on Monday, calling it “a significant step” but “not good enough.”
Why the 45-Day Ceasefire Was a Non-Starter for Iran
Iran’s refusal to accept a temporary ceasefire is rooted in its experience during Israel’s 12-day war in June 2025, which Iran argues showed it that ceasefire agreements do not prevent future attacks. As crypto.news reported, Iran has consistently demanded that any deal include guarantees against future attacks — not just a pause — and that the Strait of Hormuz’s full reopening would happen only under a final, comprehensive agreement, not as a confidence-building measure in a preliminary phase.
What Markets Are Doing With the Conflicting Signals
The contradiction between the official walkout and the back-channel communication is exactly what has made this conflict so difficult for markets to price. As crypto.news noted, Bitcoin pulled back below $69,000 when Trump confirmed Iran’s earlier proposal was insufficient, as traders returned to bearish positioning. The pattern throughout this conflict has been the same: ceasefire signals produce brief relief rallies, and their collapse reverses those gains within hours.
With 8 PM ET rapidly approaching, the credibility of any remaining indirect channel depends almost entirely on whether Iran uses the next few hours to signal something concrete to Pakistani mediators — or whether tonight sees the military escalation Trump has threatened.
“All elements need to be agreed today,” a source aware of the proposals told Reuters early Tuesday. “The initial understanding would be structured as a memorandum of understanding finalized electronically through Pakistan, the sole communication channel in the talks.”

In a high-stakes move that sharpens the focus on developer responsibility in crypto tooling, prosecutors in the U.S. Attorney’s Office for the Southern District of New York have asked a federal court to reject Tornado Cash co-founder Roman Storm’s bid for acquittal. The filing centers on the contention that Storm’s alleged actions go beyond a civil copyright dispute and implicate conspiracies to commit money laundering and sanctions violations.
Jay Clayton, the SDNY attorney who previously led the U.S. Securities and Exchange Commission, argued in court papers that Storm’s use of Tornado Cash was “window dressing at best and outright misdirection at worst.” The filing criticized Storm’s attempt to frame his defense around a civil copyright case, insisting there is no evidentiary basis for equating his conduct with civil liability and that such a line of defense is irrelevant to the criminal charges at hand. The motion responded to Storm’s plan to cite a 2026 Supreme Court case, Cox Communications, Inc. v. Sony Music Entertainment, as part of an argument about Storm’s intent to participate in the criminal activity prosecutors allege.
According to the SDNY, Storm’s alleged conduct bears little resemblance to the facts in the Cox case, which dealt with copyright infringement in a civil context. The government contends there is no evidence that Storm or Tornado Cash’s developers implemented any effective anti-money-laundering controls, a point Clayton stressed in the filing.
“The defendant’s conduct simply is not comparable to the conduct at issue in Cox,” Clayton said. “In any event, a civil copyright case has no relevance here in the first place.”
Last August, a jury convicted Storm of conspiracy to operate an unlicensed money transmitting business, but the panel deadlocked on two other charges — conspiracy to commit money laundering and conspiracy to violate sanctions — leaving the possibility of a retrial on those counts. The case has become a flashpoint in the broader debate over whether developers of open-source crypto tools can be held legally liable for how their code is used in illicit finance schemes.
Prosecutors and Storm’s defense team were slated to meet on the following Thursday to discuss the path ahead, including the possibility of a retrial date. In the meantime, the government has signaled continued pursuit of the remaining charges, while the defense has pressed for a dismissal or a narrow resolution based on civil-law considerations.
In a contemporaneous political thread surrounding the case, the conversation extended beyond the courtroom doors. Last week, reports circulated that U.S. lawmakers were advancing proposals intended to shield blockchain developers from broad prosecution, signaling a regulatory ambition to distinguish between personal risk and platform-level liability.
Key takeaways
- The SDNY explicitly rejects Roman Storm’s attempt to leverage Cox Communications as a defense, asserting the criminal nature of the alleged activity is not comparable to civil copyright disputes.
- Storm was convicted on conspiracy to operate an unlicensed money transmitting business, while two related charges ended in a mistrial, keeping the door open for a retrial on those counts.
- The case amplifies the ongoing debate about whether developers behind open-source crypto projects can be held criminally liable for how others use their code.
- News of a potential October retrial underscores the government’s intent to pursue the remaining charges, even as questions about evidentiary standards and defense strategy persist.
- In parallel, U.S. policymakers continue to explore protections for blockchain developers, highlighting tensions between enforcement goals and innovation incentives.
- The evolving DOJ posture, including commentary associated with acting Attorney General Todd Blanche, could influence how aggressively prosecutors pursue similar cases and how they frame regulatory boundaries around crypto platforms.
Courts, cases and a shifting DOJ posture
Clayton’s filing frames the Storm case within a larger legal question: when, if ever, does enabling code cross the line into criminal participation? The defense’s tactic of invoking a civil copyright precedent appears designed to downplay Storm’s alleged role in facilitating illicit activity, but prosecutors argue that the underlying conduct extends far beyond such civil concerns. The government’s stance rests on an assertion that there was no adequate safeguard against abuse by Tornado Cash’s tools, a factor central to charges of money laundering conspiracies and sanctions violations.
The legal strategy in play here matters beyond one defendant. It tests the boundaries of developer liability for open-source projects and raises critical questions about how prosecutors evaluate intent and control in decentralized tooling. If civil analogies or civil-law defenses fail to translate to criminal contexts, the door may remain open for tougher scrutiny of developers whose code can be used for illicit ends—even when they claim no direct involvement in wrongdoing.
Meanwhile, the timing of the potential retrial adds a layer of strategic calculus for both sides. The SDNY has requested October as a possible window for re-presenting the evidence on the two previously deadlocked counts, but no date has been officially set as of now. The outcome could influence how similar cases are positioned in the future and how aggressively prosecutors pursue open-source projects that enable or facilitate illicit activity, including cross-border sanctions evasion.
DOJ policy signals and the broader regulatory backdrop
The Storm case sits at the intersection of criminal enforcement and policy signaling within a changing regulatory landscape. Last week, headlines centered on how a reshuffled Justice Department might recalibrate its approach to crypto. Acting Attorney General Todd Blanche, who has previously commented on the need to end what he termed “regulation by prosecution,” laid out a vision that could affect enforcement priorities in the crypto space. While Blanche did not name Storm specifically, he argued that the department should avoid pursuing actions against platforms that criminals leverage to conduct illegal activity and called for alignment between enforcement actions and overarching policy goals. The implications for Tornado Cash and similar tooling are indirect but notable, as prosecutors weigh how to apply anti-money-laundering and sanctions laws to decentralized technologies.
Storm himself has publicly framed the stakes in stark terms. In March, after prosecutors indicated a path toward retrying the two deadlocked counts, he argued that the charges could carry substantial maximum penalties — up to 40 years in federal prison — for actions tied to writing open-source code for a protocol he says he didn’t control and transactions he didn’t touch. The rhetoric underscores the tension between a developer-centric view of code as a public good and a prosecutorial view that code can be weaponized for financial crime when used in unintended or illicit ways.
Beyond the courtroom, the case feeds into a broader policy dialogue about how to balance innovation with enforcement. Lawmakers have floated measures designed to protect blockchain developers from punitive prosecution while maintaining guardrails against illicit finance. The tension between protecting innovation and deterring abuse remains a central theme in crypto regulation discussions, a dynamic that could shape how the industry negotiates risk, compliance, and governance in the years ahead.
As the legal process unfolds, observers will be watching the interaction between civil-law arguments, criminal liability standards, and the practical realities of open-source development. The Storm case is not just about a single set of charges; it is a bellwether for how courts interpret developer intent, how anti-money-laundering controls are evaluated in decentralized systems, and how policymakers balance the dual aims of fostering innovation and safeguarding financial integrity.
Readers should keep an eye on timing updates from the SDNY as it relates to potential retrial dates and any new motions from either side. The outcome could influence not only this case but the broader approach to crypto tooling and developer accountability as enforcement bodies navigate a rapidly evolving technical landscape.
For policymakers and market participants alike, the central question remains: where should the line be drawn between legitimate open-source development and actions that trigger criminal liability in an environment built on privacy, pseudonymity, and permissionless participation?
As the courtroom drama continues, the crypto community will be watching closely to assess how the balance between innovation and enforcement is negotiated in this era of rapid technological change.
Morgan Stanley’s Bitcoin ETF Set to Launch on April 8: Bloomberg

Katseye’s Manon Discussed ‘Setting Boundaries’ Before Hiatus
‘Excellent’ crime drama with Gilmore Girls icon that ‘hooks’ fans now streaming


-

 NewsBeat5 days ago
Steven Gerrard disagrees with Gary Neville over ‘shock’ Chelsea and Arsenal claim | Football
-

 Business5 days ago
No Jackpot Winner and $194 Million Prize Rolls Over
-

 Fashion4 days ago
Weekend Open Thread: Spanx – Corporette.com
-

 Crypto World6 days ago
Gold Price Prediction: Worst Month in 17 Years fo Save Haven Rock
-

 Business2 days ago
Three Gulf funds agree to back Paramount’s $81 billion takeover of Warner, WSJ reports
-

 Business4 days ago
Expert Picks for Every Need
-

 Sports3 days ago
India men’s 4x400m and mixed 4x100m relay teams register big progress | Other Sports News
-

 Business6 days ago
Login and Checkout Issues Spark Merchant Frustration
-

 Crypto World7 days ago
Bitcoin enters the public bond market as Moody’s gives a first-of-its-kind crypto deal a rating
-
Business2 days ago
No Jackpot Winner, Prize to Climb to $231 Million
-
Crypto World7 days ago
Bitcoin stalls below key resistance as technical signals skew bearish
-

 Tech5 days ago
Commonwealth Fusion Systems leans on magnets for near-term revenue
-

 Politics7 days ago
Starmer’s centre has collapsed, and the left was right all along
-

 Fashion1 day ago
Massimo Dutti Offers Inspiration for Your Summer Mood Board
-

 Crypto World6 days ago
Ripple rolls out enterprise crypto treasury platform for corporates
-

 Crypto World6 days ago
Why It’s Partnering, Not Issuing
-
Crypto World7 days ago
AI Memory Rout Wipes 9% Off Nvidia Stock: Chart Says More Pain Ahead
-

 Business3 days ago
Akebia Therapeutics, Inc. (AKBA) Discusses Pipeline Progress and Strategic Focus on Kidney Disease Treatments at R&D Day – Slideshow
-

 Tech7 days ago
Solo Leveling: Ranking All Sung Jinwoo Shadows by Power
-

 Tech6 days ago
Drawing Tablet Controls Laser In Real-Time
You must be logged in to post a comment Login