

Crypto World
DZ Bank brings crypto trading to millions through German banks


Germany’s cooperative banking network has begun offering cryptocurrency trading through DZ Bank, opening digital asset access to millions of retail customers across the country.
Summary
- DZ Bank has started rolling out crypto trading through Germany’s cooperative banking network.
- DekaBank plans a phased crypto trading launch for the country’s savings banks later this year.
- Germany is also considering new crypto tax rules that could end long-term tax exemptions from 2027.
According to a Bloomberg report, the rollout gives customers of participating cooperative banks the ability to buy and sell cryptocurrencies directly through their existing banking relationships rather than using dedicated crypto exchanges.
The service is already being introduced through a platform developed by DZ Bank and currently supports cryptocurrencies including Bitcoin, Ethereum, Litecoin, and Cardano.
The expansion comes as Germany’s banking sector gradually changes its stance on digital assets after years of avoiding retail crypto services because of concerns over market volatility and investor protection. Instead of remaining on the sidelines, cooperative banks are now integrating crypto trading into their existing banking platforms, with each member institution deciding independently whether to make the service available.
Why are German banks expanding crypto services?
Representatives from DZ Bank told Bloomberg that interest from member institutions has been strong, with hundreds of cooperative banks expected to introduce cryptocurrency trading over time. While participation remains optional, the report said the level of demand suggests the service could become available across a large part of Germany’s cooperative banking network.
Elsewhere in the sector, DekaBank is preparing a comparable crypto trading platform for Germany’s savings banks. According to Bloomberg, the launch is scheduled for later this year and will be introduced in stages as individual savings banks choose whether to participate.
Supporters of the banking-led approach argue that customers may feel more comfortable buying digital assets through financial institutions they already use for everyday banking. Bloomberg cited survey data showing German consumers trust their primary bank more than twice as much as dedicated cryptocurrency trading platforms.
Banks also see digital assets as a way to appeal to younger customers who increasingly expect investment products to be available through digital banking applications. Offering crypto trading alongside traditional financial services could help lenders compete as cryptocurrencies become more common in mainstream finance, according to the report.
What challenges still face Germany’s crypto market?
Despite the growing availability of crypto trading through banks, critics continue to warn about the risks associated with digital assets. Bloomberg reported that academics and banking industry groups have maintained that cryptocurrencies remain highly speculative investments capable of generating substantial losses.
Germany’s savings banks association has also emphasized that crypto trading is intended only for self-directed customers who understand the risks involved and can make their own investment decisions without advisory services.
The banking expansion comes as Germany considers changes to its tax treatment of digital assets. As crypto.news reported earlier, Finance Minister Lars Klingbeil said during the presentation of Germany’s 2027 federal budget on April 29 that the government plans to “tax cryptocurrencies differently” as part of measures expected to raise an additional €2 billion, or about $2.3 billion, while strengthening efforts against financial and tax crime.
Under Germany’s current tax rules, profits from private cryptocurrency sales are generally taxed when assets are sold within one year of purchase. Crypto.news previously reported that digital assets held for more than 12 months are usually exempt from capital gains tax, a policy that has long made Germany one of Europe’s more attractive jurisdictions for long-term cryptocurrency investors.


As the world’s most powerful economy and the widely regarded leader of the free world celebrates its 250th Independence Day, various initiatives are emerging to contribute in some way, including one from Ripple.
The company behind the popular XRP altcoin announced that it has joined a nonprofit helping unemployed veterans to get high-quality jobs after their military service.
The organization, called Call of Duty Endowment, said it has already funded over 165,000 veterans, but explained that there’s still a high unemployment rate among the younger generation, which means that there’s “still more work to do.”
It wants to find jobs for 200,000 veterans by 2030, and Ripple has joined the special initiative for the 250th birthday of the US, called Giving4th.
The idea is to make Independence Day a national day of charitable giving. The company said it will match donations made to the Call of Duty Endowment of up to $10,000.
People who want to participate can use cash, stock, or cryptocurrencies, including Ripple’s two native tokens, XRP and RLUSD.
Ripple is joining #Giving4th — @America250‘s new movement to make Independence Day a national day of charitable giving.
We’re matching donations to @CODE4Vets up to $10K. CODE funds the most effective organizations helping veterans get back to work, preparing them for the job…
— Ripple (@Ripple) July 4, 2026
The Fourth of July is known as the United States’ Independence Day and serves as a federal holiday that commemorates the adoption of the Declaration of Independence on July 4, 1776.
The post Important Ripple (XRP) Announcement for July 4: Details appeared first on CryptoPotato.

Bitcoin might still enter another major bull cycle, but the amount of money needed to fuel it has grown dramatically compared to previous bull markets, according to the CEO of CryptoQuant, Ki Young Ju.
In a recent thread, he argued that the cryptocurrency’s capital efficiency has declined considerably as the asset has matured.
In 2011, he said, roughly $2.7 billion in net capital inflows was enough to drive a rally of more than 55,000%. In the current cycle, however, around $697 billion in inflows produced a return of slightly less than 700%.
The main takeaway is quite simple: Bitcoin is much larger now compared to before, and moving its price requires far more capital.
Bitcoin’s Next Parabolic Move May Need Trillions
Market cycles are interesting, and all of them, despite some similarities, are quite different.
According to Ju, in 2011, only $5 million in net inflows was enough to double BTC’s price. In this cycle, that figure increased to roughly $101 billion. He believes that the next parabolic run would likely require trillions of dollars in net capital inflows.
Of course, this doesn’t mean that upside is impossible; it just suggests that the asset may need a deeper institutional bid than in the previous cycle.
The analyst also framed the issue in terms of Bitcoin’s realized capitalization. This is a metric that values each coin based on the price at which it last moved on-chain rather than simply mutliplying the current spot price by its circulating supply.
Ju said that if Bitcoin can absorb upwards of $1 trillion in realized cap, another parabolic rally remains possible. In practical terms, though, this would require the cryptocurrency to move beyond a retail-led ETF trade and become an established macro allocation for funds, corporations, institutions, and possibly even sovereign entities.
He noted that this shift is still early and hasn’t been invalidated yet.
Gold Comparisons: The Size of the Opportunity?
The comparison with gold remains central to Bitcoin’s long-term investment thesis. The current market cap of the precious metal, according to popular estimates, is $29 trillion, although keep in mind that this figure can vary depending on the assumed above-ground supply.
By contrast, Bitcoin’s market cap is $1.25 trillion, at the time of this writing.
This gap remains the reason some analysts still see significant room for Bitcoin to grow as institutional adoption expands. Of course, it also highlights the challenge – every new cycle will likely require considerably larger pools of capital than the last.
The post How Much New Money Does Bitcoin Need to Start a Fresh Bull Run? (It’s a Lot) appeared first on CryptoPotato.
Crypto World
A massive EU regulatory crackdown is threatening the explosive boom of multibillion-dollar prediction markets


The European Securities and Markets Authority (ESMA) said some prediction-market contracts may be covered by the European Union’s binary options ban, warning firms that yes-or-no event contracts cannot be marketed, distributed or sold to retail clients when they qualify as financial instruments.
“This means that the marketing, distribution or sale to retail clients of event contracts that meet the definition of financial instruments is prohibited,” ESMA said in a statement.
The regulator targeted contracts whose payout is binary, usually a fixed amount or nothing, and depends on the outcome of a future event.
ESMA said the product label is irrelevant, as a contract sold as an “event contract” can still be a MiFID II financial instrument if its underlying falls within the derivatives categories.
Event contracts that qualify as financial instruments are derivatives, ESMA said. That puts them within the scope of national product intervention measures for binary options.
The warning comes as prediction markets expand across crypto and traditional finance. Kalshi and Polymarket have been discussed as potential M&A targets as operational lines blur between exchanges, brokerages and sportsbooks.

Key Takeaways
- ORCL shares have declined nine trading sessions in a row, shedding 24% in what marks the company’s most extended losing period since late 2021
- Shares have lost 28% in 2026 so far and are trading 57% below the September 2025 peak of $248.15
- Wall Street remains optimistic with 84% of analysts maintaining Buy recommendations and a consensus target near $263.86
- Retail traders are accumulating shares — ORCL ranked first among major tech stocks for retail purchases over the last 30 days, surpassing Nvidia, Meta, Amazon, Microsoft, and Alphabet
- Market anxiety stems from Oracle’s aggressive capital spending strategy and expanding debt obligations
Oracle delivered impressive fourth-quarter fiscal 2026 earnings on June 10, posting $19.2 billion in sales—a 21% jump from the previous year—while surpassing analyst projections for both revenue and earnings. Management also upgraded its profitability forecast. Markets responded with indifference.
From its 2026 peak of $248.15 reached on June 1, shares have declined on 18 of the following 22 trading sessions. The current nine-day consecutive decline of 24% represents the most prolonged downturn since December 2021. ORCL now trades approximately 57% beneath its all-time closing record established on September 10, 2025.
The timing adds to the puzzle. While Oracle continues sliding, the wider software industry has been rebounding. The iShares Expanded Tech-Software Sector ETF (IGV) has climbed for five straight sessions, gaining over 10% during that period. Oracle charts the opposite course.
Most market observers point to financial strategy concerns—particularly Oracle’s spending velocity and how the company funds its operations. The enterprise has accumulated substantial debt to bankroll its artificial intelligence infrastructure expansion, and shareholders seem increasingly anxious about the capital deployment pace.
Analyst Community Maintains Conviction
The recent selloff hasn’t shaken Wall Street confidence. Among analysts tracking the stock, 84% assign Buy ratings—a percentage exceeded only once during the past two decades, briefly during May 2011.
The consensus price objective hovers around $263.86, suggesting approximately 88% appreciation potential from present levels. Mizuho’s Siti Panigrahi maintains one of the Street’s most aggressive targets at $320, designating Oracle as a premier recommendation while highlighting its “end to end AI stack across database, infrastructure, and applications.” Panigrahi acknowledges financing obstacles as a material concern, observing that Oracle will probably require external capital to support its spending blueprint.
KeyBanc researchers elevated their projections recently, expressing growing confidence that operating expense expansion will remain subdued. They preserved an Overweight stance with a $300 target, emphasizing that disciplined operating costs represent “where future upside will come from.”
Individual Investors Accumulate Shares
While institutional capital observes cautiously, individual investors are taking the opposite approach. Information from TipRanks’ Crowd Wisdom platform, monitoring over 868,000 retail portfolios, reveals ORCL experienced more purchasing volume during the past 30 days than comparable technology giants.
During the previous month, 3.8% of monitored portfolios initiated or expanded ORCL positions. This exceeds the 3.6% for Microsoft, 3.5% for Nvidia, 2.9% for both Amazon and Alphabet, and 2.2% for Meta.
Among the 32 analysts providing coverage during the past quarter, 28 issued Buy recommendations with just four Hold ratings—creating a Strong Buy consensus without a single Sell rating.
Oracle hasn’t announced its next quarterly reporting date, though the Q4 results that preceded the selloff featured $19.2 billion in revenue alongside an improved profitability outlook.


Europe has done something important. With MiCA, the EU created the world’s first comprehensive regulatory framework for crypto-assets. That is a significant achievement, not only for the digital asset industry, but for Europe’s wider ambition to lead in responsible financial innovation.
MiCA’s promise was clear: a harmonised single-market framework for crypto-asset services across the EU, greater clarity for users, more certainty for firms, and a level playing field for responsible operators willing to meet high standards.
Binance has supported that objective from the beginning, and we continue to support it today. But frameworks are only as strong as their implementation.
As MiCA moves from legislation to implementation, an important question is emerging: is the harmonised framework being implemented as intended?
That question matters far beyond Binance. Europe’s digital asset market is large, sophisticated and growing. Across the continent, millions of people use digital assets, innovative Web3 businesses are being built, and institutional participation continues to expand.
This ecosystem is part of Europe’s future competitiveness. Digital assets are about far more than trading. They represent new financial infrastructure: faster settlement, lower-cost payments, programmable products, digital ownership and more transparent markets.
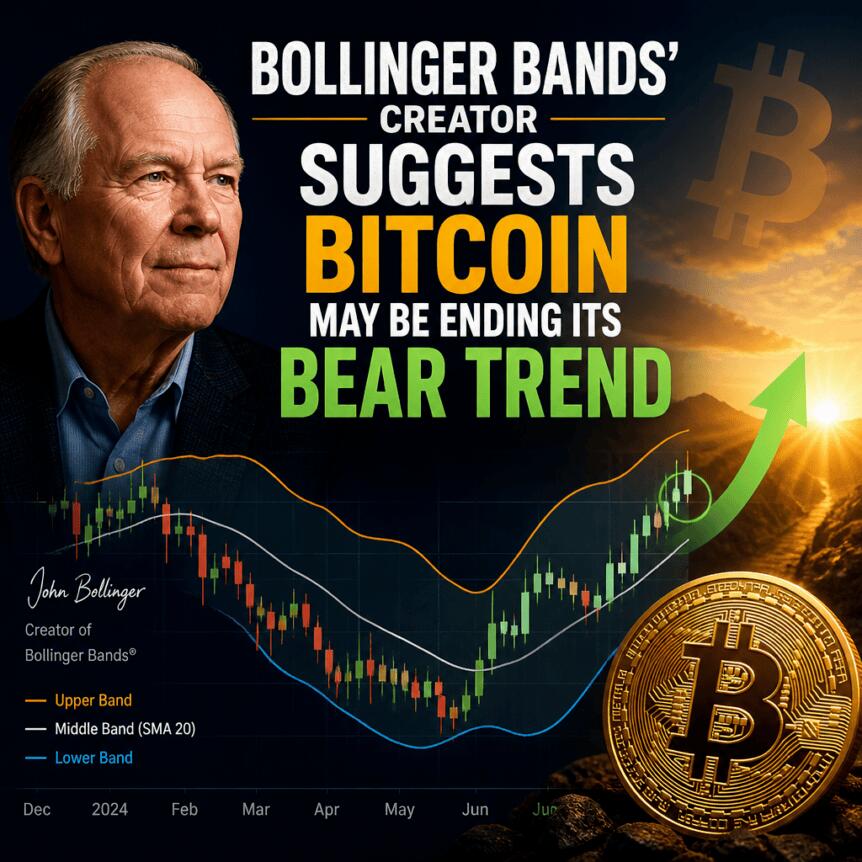
Bitcoin appears to be nearing a potential technical turning point as analyst John Bollinger points to a “W”-shaped double-bottom pattern forming on the daily chart. In a fresh set of posts on X, Bollinger argued that the setup is “perfectly fractal,” suggesting the market could be moving into the final phase of a longer bearish cycle.
The technical discussion is landing alongside evidence that institutional demand may be cautiously reappearing. Data shared by market participants indicated that US spot Bitcoin ETFs recorded their first net inflows in ten days, while traders noted that BTC’s ability to hold near the $60,000 area despite broader outflows may signal absorption of selling pressure.
Key takeaways
- John Bollinger highlighted a daily “W” double-bottom structure on BTC/USD, framing it as a candidate to break the prevailing downtrend.
- Bollinger described the pattern as “perfectly fractal,” including smaller “w” formations near prior lows and a corresponding “m” at the rebound apex.
- US spot Bitcoin ETFs saw their first net inflows in ten days, signaling easing pressure in the ETF channel.
- Traders said BTC’s stability around the ~$60,000 region—despite ETF outflows earlier—could matter if price continues holding into the next week.
Bollinger’s “perfectly fractal” double bottom
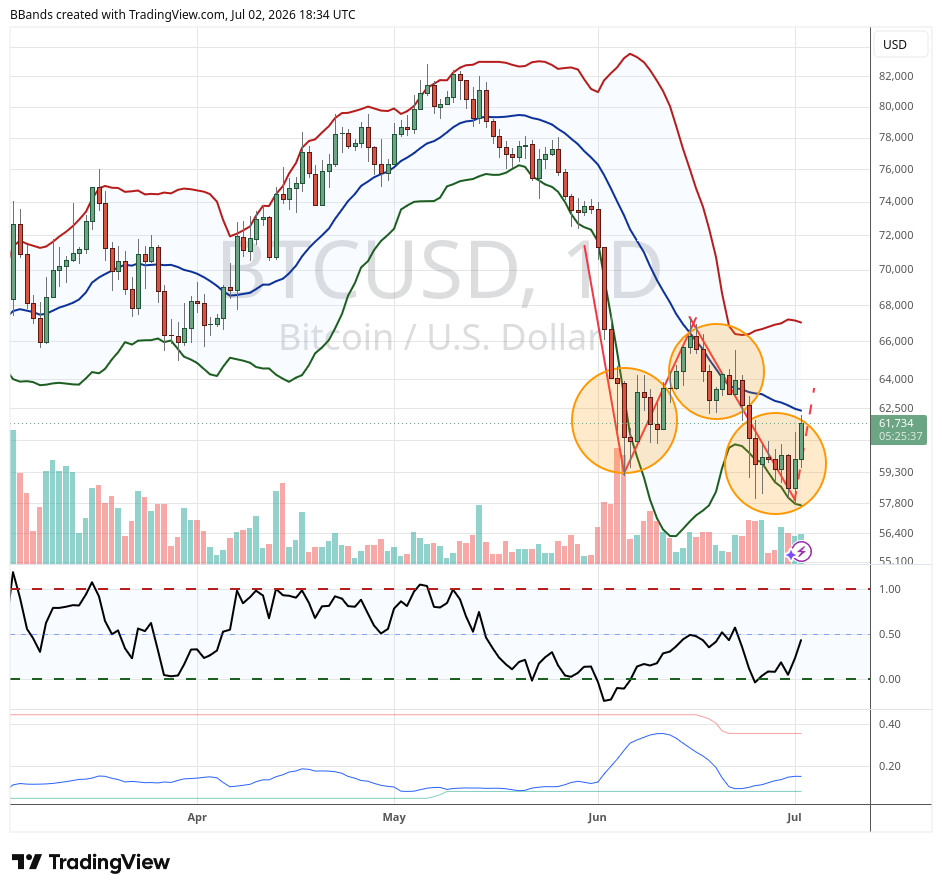
Bollinger, known for creating the Bollinger Bands volatility indicator, used X to examine the current BTC/USD structure. He pointed to a “W”-shaped reversal pattern—typically defined by two swing lows with a rebound in between—arguing that such formations become bullish once price clears the level of resistance created at the rebound.
In his posts, Bollinger noted that prior bullish patterns had been broken, reinforcing his view that the downtrend has been dominant. He then asked whether the present “W” could be the one that “breaks” the trend.
Bollinger also shared a chart aligning the setup with the lower Bollinger Band on daily time frames. He emphasized the fractal nature of the structure, stating that smaller “w” shapes appear at the nadirs and a smaller “m” forms near the apex of the bounce. He further referenced a similar “W” on the weekly chart, implying the idea is not only limited to the daily timeframe.
For traders, the practical question is what counts as confirmation. In classical pattern terms, the bullish outcome hinges on BTC pushing through the rejection level between the two lows. Until that occurs, the pattern remains a hypothesis rather than a verified reversal.
Why the ETF channel is drawing attention
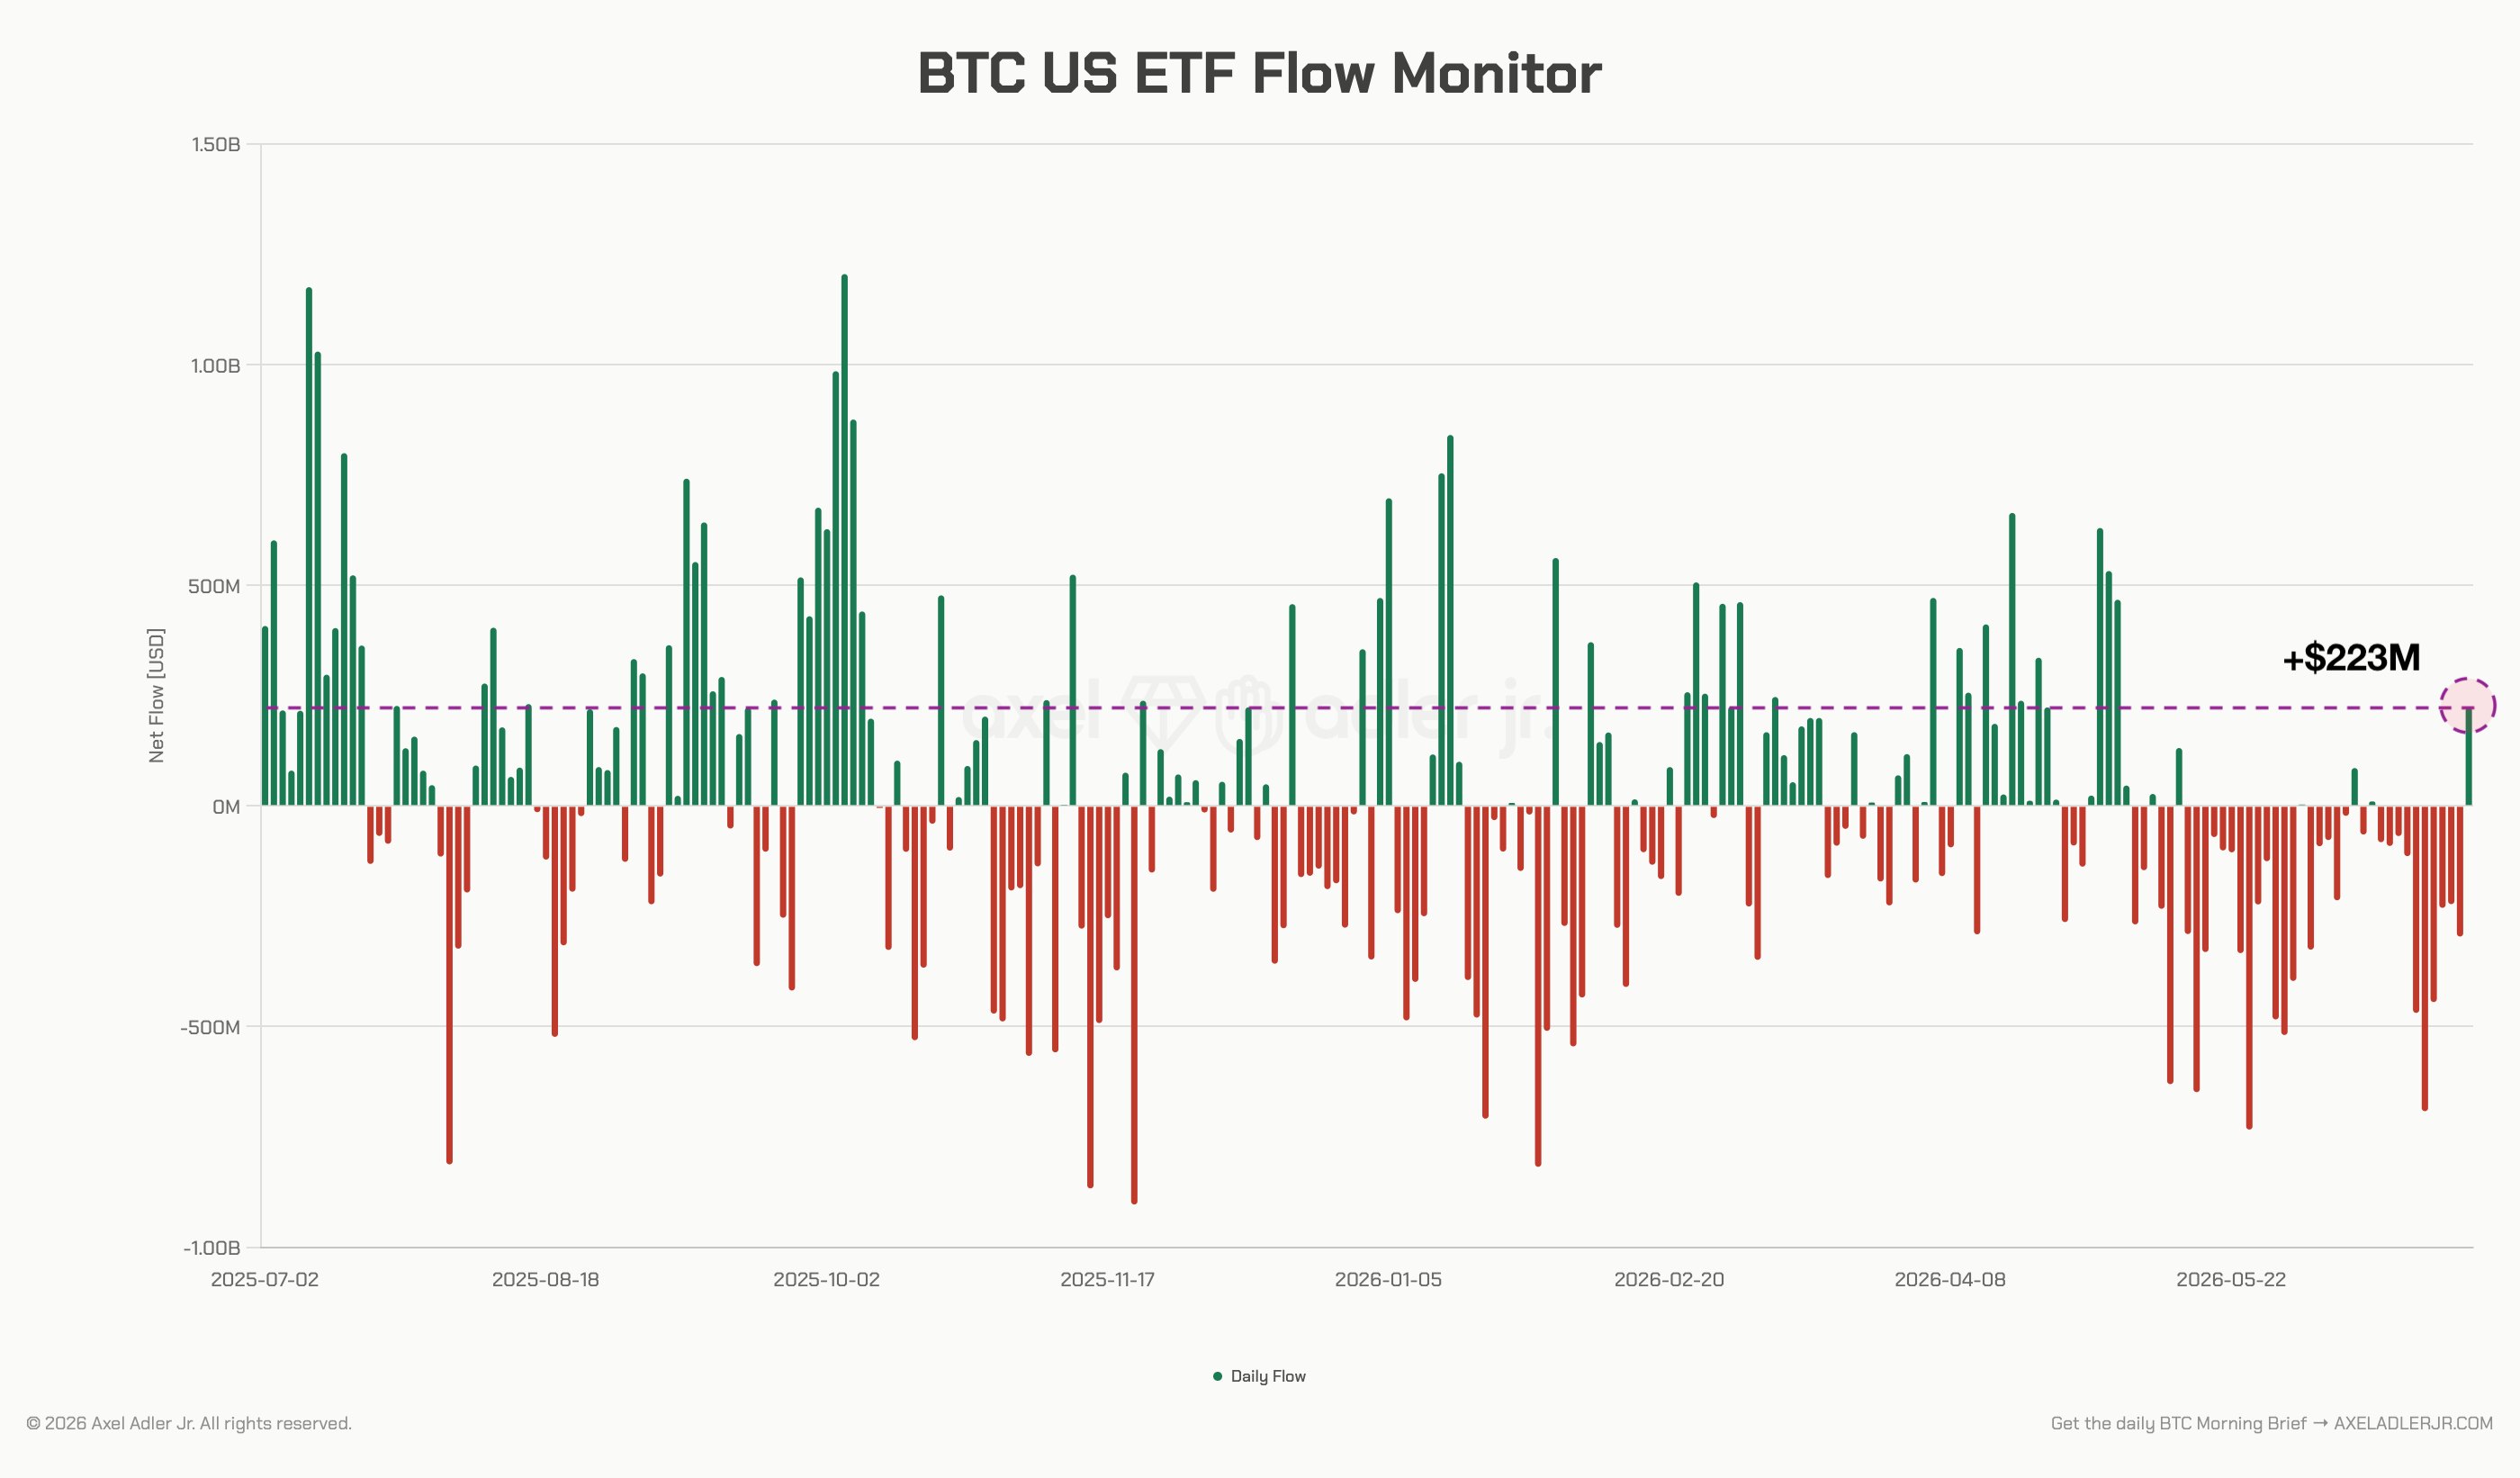
While Bollinger’s analysis is technical, the accompanying focus on ETFs reflects how institutional flows are often used as a real-time indicator of demand. According to market participants on X, US spot Bitcoin exchange-traded funds recorded their first net inflows in ten days on Friday.
Analyst Axel Adler Jr., a contributor to onchain analytics platform CryptoQuant, characterized the move as meaningful for gauging whether ETF-related pressure is easing. In his summary, Adler Jr. said that Bitcoin may be in the late stage of the bear cycle, but the ETF segment had, for the first time, signaled reduced pressure.
Another trader, Daan Crypto Trades, responded by cautioning that the inflow amount—reported as $220 million—was “not massive.” Still, he suggested the context matters: BTC had been holding roughly the $60,000 region even while there were many outflows. In his view, the area becomes more relevant if price continues to bounce further into the next week, since that would imply a larger amount of “absorption” has taken place.
This is an important distinction. In bearish phases, inflows can be sporadic and not necessarily change the broader trend. The market impact tends to be clearer when price holds and demand persists rather than appearing briefly.
Signals vs. expectations for a macro bottom
Even with renewed interest in ETF flows, the broader market narrative still points to uncertainty about when the macro bottom will arrive. Earlier coverage cited by the same discussion noted that multiple price indicators have been flashing signals not seen since the 2022 bear market. However, many participants continue to believe the next macro bottom is still ahead, with timing expectations pointing to Q3 or later.
Bollinger’s framing fits into that wider tension between “early signals” and “final bottoms.” A W-shaped reversal, if it plays out as expected, would suggest momentum could shift sooner than the macro timetable implies. But without confirmation—especially a breakout through the pattern’s rejection level—the setup could also end up failing or only triggering a temporary bounce within a longer downtrend.
From an investor perspective, that makes the coming price action particularly consequential. If BTC can hold near the reclaimed levels mentioned in the ETF discussion and then follow through on a breakout, the technical pattern could align with improving demand. If not, it may reinforce the view that market participants have not yet reached the stage where bearish pressure fully dissipates.
What to watch next
The next phase will likely depend on whether BTC can translate ETF inflows and near-$60,000 stability into sustained upside, particularly through the key resistance level implied by Bollinger’s “W” structure. Readers should watch for actual confirmation of the pattern—rather than relying only on improving signals—and track whether institutional demand remains supportive beyond this first inflow after a ten-day stretch.

Key Takeaways
- Bloom Energy shares have climbed approximately 194% in 2026 and more than 1,100% over the trailing 12 months, currently trading near $271
- First-quarter 2026 earnings per share reached $0.44, significantly exceeding the $0.12 analyst consensus; revenue totaled $751M, reflecting 130.4% year-over-year expansion
- The company and Brookfield Asset Management quintupled their AI infrastructure financing arrangement to $25 billion
- Full-year 2026 EPS outlook was upgraded to a range of $1.85–$2.25; institutional holders control 77% of shares outstanding
- Wall Street maintains a consensus “Hold” recommendation with a mean price objective of $236.14, trailing the current market price
Bloom Energy (BE) stock is hovering around $271, marking an approximate 194% gain year-to-date and a staggering 1,100%-plus advance from the same period last year. The solid oxide fuel cell manufacturer has emerged as one of 2026’s most explosive equities, propelled by accelerating demand for distributed power solutions serving AI-driven data facilities.
Shares began Friday’s session at $271.13. The 52-week trading range spans from $22.81 to $351.28, with the 50-day simple moving average positioned at $280.49 and the 200-day at $190.83. The company’s market capitalization currently stands at approximately $77 billion.
Bloom’s solid oxide technology transforms natural gas into electricity through an electrochemical process that bypasses traditional combustion. These systems can be installed and operational within a three-month window — a compelling advantage over conventional grid infrastructure, which often requires multi-year development timelines.
Hewlett Packard Enterprise CEO Antonio Neri has projected that the United States may confront a 19-gigawatt electricity supply deficit by 2028. Data centers are anticipated to drive nearly half of all incremental U.S. power demand through the end of the decade. This emerging supply-demand imbalance represents a structural growth driver for Bloom.
First Quarter Delivers Blowout Performance
Product revenue in Q1 — predominantly energy server shipments — tripled compared to the prior-year period. Consolidated revenue reached $751 million versus the Street’s $539.94 million estimate. Earnings per share landed at $0.44, crushing the consensus forecast of $0.12. Net profit margin registered at 0.25% while return on equity measured 21.05%.
On the strength of these results, Bloom management elevated full-year 2026 EPS guidance to a band of $1.85–$2.25. The current analyst consensus for the fiscal year sits at $1.34 per share.
In a move that attracted considerable attention, Bloom and Brookfield Asset Management expanded their collaborative AI power financing framework from $5 billion to $25 billion. This fivefold expansion underscores strong visibility into the fuel cell deployment pipeline at hyperscale computing facilities.
Institutional shareholders now account for 77% of outstanding shares. Leonteq Securities AG boosted its stake by 396.3% during the first quarter, acquiring an additional 89,185 shares to reach a total position of 111,687 shares valued at approximately $15.1 million.
Executive Selling and Wall Street Skepticism
Despite the rally, corporate insiders have been reducing holdings. Chief Commercial Officer Aman Joshi offloaded 8,343 shares on July 1 at a price of $300.37, generating proceeds of roughly $2.5 million. Director John T. Chambers divested 55,000 shares in late May at $297.69 per share, totaling more than $16.3 million. Across the past 90 days, insider dispositions have exceeded $59.8 million in aggregate value.
Wall Street opinion remains divided. Roth MKM maintains a “neutral” stance with a $285 price target. Barclays assigns an “equal weight” rating at $276. TD Cowen holds at $235. BMO Capital Markets offers one of the more constructive views with an “outperform” designation. Zacks Investment Research recently lowered its recommendation from “strong-buy” to “hold.”
The Street consensus settles at “Hold” with an average twelve-month target of $236.14 — approximately 13% beneath current trading levels.
Bloom carries a debt-to-equity ratio of 2.90 and a negative trailing price-to-earnings multiple, reflecting that profitability remains inconsistent despite robust top-line momentum.
BMO Capital Markets reiterated its “outperform” view on June 9, positioning itself among the minority of firms expressing bullish conviction at prevailing valuations.

Key Takeaways
- Wolfe Research raised CVX to Outperform, establishing a $210 price target based on underappreciated long-term cash generation
- Current market assumptions imply Brent crude under $60/barrel, while normalized futures suggest closer to $70/barrel
- The Uaru development in Guyana is projected to reach a critical free cash flow milestone during late 2026
- CVX surpassed Q1 expectations with $1.41 earnings per share versus $1.00 consensus, offering a 4.2% dividend
- Several major institutional holders expanded their CVX stakes throughout Q1 and Q2 2026
Chevron (CVX) advanced 1.6% Thursday following Wolfe Research’s decision to elevate the energy stock to Outperform from Peer Perform, accompanied by a $210 valuation target. Shares began Friday’s session at $169.06, remaining considerably beneath the $214.71 52-week peak.
According to Wolfe analyst Doug Leggate, fluctuating commodity prices have obscured meaningful enhancements to Chevron’s sustainable cash generation capabilities. He contends the market currently assumes long-term Brent pricing beneath $60 per barrel — significantly lower than the approximately $70 normalized forward pricing curve.
This valuation disconnect, Leggate maintains, presents a compelling entry point.
RBC Capital likewise maintained its Buy stance on CVX this week, contributing to the predominantly optimistic analyst sentiment. The equity currently carries a consensus Moderate Buy recommendation with a mean price objective of $205.71 spanning 26 analysts — comprising 19 Buy, 6 Hold, and 1 Sell ratings.
Mizuho elevated its target from $225 to $230 in late May. Goldman Sachs and UBS both maintain Buy recommendations with targets of $216 and above.
Guyana Represents the Primary Catalyst
Leggate identifies Guyana as the most significant near-term growth driver. The Uaru development is anticipated to commence operations and achieve a free cash flow turning point during the latter half of 2026, which should bolster CVX’s financial stability even if crude prices remain subdued.
Guyana is also projected to generate sufficient cash to offset the dividend obligations tied to the Hess acquisition — and eventually, Leggate anticipates it becoming Chevron’s largest single source of free cash flow.
This becomes particularly relevant approaching 2033, when the Tengiz partnership in Kazakhstan reaches its contractual conclusion.
Beyond Guyana, Chevron has obtained fresh development rights this year across Venezuela, Libya, and Iraq, with a possible ninth Guyana development phase under consideration. According to Wolfe, these initiatives could sustain production expansion well past 2030.
Institutional activity has intensified concurrent with analyst upgrades. Peregrine Asset Advisers more than doubled its CVX holdings during Q1, expanding its position by 118.7% to 20,344 shares valued at approximately $4.21 million.
Financial Results and Shareholder Returns
CVX most recently disclosed earnings on May 1st, delivering $1.41 earnings per share compared to consensus expectations of $1.00 — exceeding forecasts by $0.41. Revenue totaled $47.56 billion, representing 2.1% year-over-year growth, though modestly trailing the $51.86 billion analyst projection.
The corporation distributed a quarterly dividend of $1.78 per share in June, translating to a $7.12 annualized payout and a 4.2% yield. The current payout ratio stands at 123.4%.
CVX’s Q2 2026 earnings announcement is slated for later this month, with analysts already identifying it as the next potential stock catalyst.
The 50-day moving average rests at $183.31 while the 200-day sits at $180.40, with CVX’s present price of $169.06 positioned below both technical indicators.

TLDR;
- Bhutan Bitcoin Transfer activity moved 700 BTC worth about $43.75 million to Binance, drawing attention as Bitcoin traded above $62,000.
- Bhutan-linked wallets still reportedly hold around 1,750 BTC after the latest transfer, keeping the country among watched sovereign crypto holders.
- A Binance deposit does not always confirm a sale, as large holders may use exchanges for OTC deals, liquidity, or treasury operations.
- Bitcoin’s move above $62,000 followed renewed buyer interest near $58,000, with traders watching whether support holds again.
The Bhutan Bitcoin tansfer has drawn fresh market attention after government-linked wallets reportedly moved 700 BTC to Binance. The transfer was worth about $43.75 million, based on Bitcoin’s price near $62,500.
The move came as BTC reclaimed the $62,000 zone after defending support near $58,000. Traders often watch large exchange deposits closely, as they can signal possible selling.
Still, a transfer to Binance does not always mean immediate liquidation. Large holders may also use exchanges for OTC trading, liquidity planning, or internal treasury movements. Bitcoin traded near $62,500 on Saturday.
Bhutan Bitcoin Transfer Puts Binance Flows Under Watch
The Bhutan Bitcoin transfer involved two separate transactions to the same Binance deposit wallet. The larger transfer moved 634 BTC, valued near $39.6 million. A second transaction moved 66 BTC, worth about $4.12 million.
Together, the transfers brought the total to 700 BTC. That made the activity one of the latest major Bhutan-linked movements tracked by market watchers. Earlier transfers by Bhutan-related wallets also moved large BTC amounts this year.
The wallets are tied to the Royal Government of Bhutan through Arkham Intelligence labels. As reported previously, Bhutan’s Bitcoin holdings came from government-backed mining operations, rather than criminal seizures.
After the latest movement, the wallets reportedly still hold about 1,750 BTC. A prior report in June also showed Bhutan-linked wallets holding nearly 1,749.96 BTC after a Binance transfer. That earlier transfer moved 533 BTC, worth about $34.5 million at the time.
BTC Selloff Risk Rises as Bitcoin Reclaims $62K
Bitcoin is recovering from recent pressure trading near $62,555, with daily volume above $21 billion. The price rebound followed two defenses of the $58,000 area. That level has turned into a key short-term support zone for traders. Buyers stepped in near that range, while short liquidations helped fuel the recovery.
Meanwhile, macro data added another layer to the move. Softer U.S. labor figures supported expectations that the Federal Reserve may stay less aggressive. Risk assets often respond to that shift, especially when liquidity hopes improve.
Still, large BTC exchange deposits can unsettle traders. A government-linked transfer may raise concerns about supply hitting the market. At the same time, exchange movement alone does not prove a sale.
For now, traders are watching Binance flows, BTC volume, and the $58,000 support zone. A clean hold above $62,000 could keep buyers active. A sharp reversal may bring attention back to the latest Bhutan-linked wallet activity
Bitcoin (BTC) is completing a “perfectly fractal” reversal pattern that a well-known analyst hopes could end the bear market.
Key points:
- Bitcoin is on the final leg of what could become a major “W”-shaped reversal pattern.
- John Bollinger suggests that its success could “break” the downtrend in place since October 2025.
- Institutional interest slowly returns as newly reclaimed $60,000 holds.
John Bollinger hints BTC price “W” reversal could break bears
In X posts on Friday, John Bollinger, creator of the Bollinger Bands volatility indicator, eyed a “W”-shaped double bottom on BTC/USD.
“$BTC has seen a series of bullish patterns broken, evidence of the power of the downtrend,” he commented.
“Will this ‘W’ be the one that breaks the trend?”
“W”-shaped reversals involve two swing lows with a rejected rebound in between, with price ultimately breaking through that rejection level to form a new uptrend.
Bollinger uploaded a chart showing how neatly the current setup aligns with the lower band of the Bollinger Bands indicator on daily time frames.
“Note that it is perfectly fractal. The are small ‘w’s at the nadirs and a small ‘m’ at the apex,” he added, also pointing to a “W” on the weekly chart.

BTC/USD one-day chart with Bollinger Bands. Source: John Bollinger/X
Bollinger has been bullish on BTC for some time. In early May, he revealed a new long position via his Bitcoin investment vehicle.
As Cointelegraph reported, an increasing number of price indicators are flashing signals not seen since the last bear market in 2022. Despite this, market participants broadly believe that the next macro bottom is still to come and is due in Q3 or later.
Bitcoin ETF inflow comes amid major supply “absorption”
Continuing, analyst Axel Adler Jr., a contributor to onchain analytics platform CryptoQuant, stressed the significance of re-emerging institutional buyer interest.
Related: Bitcoin price tags $62.3K nine-day high after global stocks hit historic record
On Friday, the US spot Bitcoin exchange-traded funds (ETFs) saw their first net inflows in ten days.
“Bitcoin is in the late stage of the bear cycle, but the ETF segment has for the first time signaled that the pressure is easing,” he summarized on X.
US spot Bitcoin ETF netflows. Source: Axel Adler Jr./X
Trader Daan Crypto Trades acknowledged that while the $220 million inflows were “not massive,” they could have implications for BTC price support going forward.
“Also good to note how price has been holding this ~$60K region regardless of the many outflows. That will become meaningful if price does bounce further into next week as it means a lot of absorption has taken place,” he told X followers.
![Money isn't everything [YANNA] #Yanna #Short #Confidence #Strongwoman #Motivation #fyp](https://wordupnews.com/wp-content/uploads/2026/07/1783176729_maxresdefault-80x80.jpg)
Money isn’t everything [YANNA] #Yanna #Short #Confidence #Strongwoman #Motivation #fyp
Fiji v Wales LIVE: Josh Adams and Rhys Carre edge Welsh team in front

America’s economy still leads the world at 250 years old: Merrill strategist


-

 Fashion21 hours ago
Weekend Open Thread: High Hopes
-

 Tech7 days ago
Bluekit phishing kit adopts browser-in-the-middle for login theft
-

 Tech7 days ago
Claude Code turned every engineer into three. Now companies need more product thinkers
-

 Crypto World5 days ago
Strategy authorizes up to $1.25B in Bitcoin sales under new capital plan
-

 Politics1 day ago
The House | “Reframing the debate from a binary discussion of winners and losers”: Yuan Yang reviews ‘We Are Not Machines’
-

 News Videos6 days ago
MAJOR BITCOIN & MARKET UPDATE!!!! (MUST WATCH ASAP!!!)
-

 Tech5 days ago
Anonymous researcher drops 0-day ‘exploitarium’ repo
-

 Crypto World7 days ago
Coinbase, Circle Deepen Crypto Stock Losses Despite Resilient S&P 500
-

 Business4 days ago
Australia treasurer says alleged access of prime minister’s bank data ’incredibly concerning’
-
 Business5 days ago
The AI boom won’t burst all at once. It will pop in ‘rolling bubbles’: Macquarie
-

 Sports3 days ago
Broncos roster: OL Ben Powers (No. 74) entering final year of contract
-

 NewsBeat4 days ago
Presenter Caroline Flack’s brother Paul Flack dies aged 55
-

 Crypto World2 days ago
Binance stock trading tops $1B in first month after launch
-

 Tech7 days ago
Silicon Valley paid to kill AI regulation, now it wants the rules back
-
 NewsBeat2 days ago
New exhibition reflects five decades of movement between island of Ireland and GB
-

 News Videos4 days ago
How to Build INSANE Live Financial Dashboards With Claude
-

 Crypto World3 days ago
Alibaba-affiliate Ant Group enters the humanoid robot market with 12 deals
-

 Business3 days ago
Meta Platforms Stock Jumps 7% Today as Bloomberg Reports Company Plans to Enter the Cloud Business
-

 Business1 day ago
What a 10 Percent Drop Means for Buyers, Sellers and Renters
-

 Crypto World2 days ago
Binance Re-Enters Philippines As EU MiCA Rules Restrict Access
You must be logged in to post a comment Login