
Crypto World
ETF Inflows Drive Bitcoin (BTC) Past $80,000 New Bull Market Cycle Or Catch-Up Trade


Bitcoin (BTC) crossed $80,000 for the first time since May on Tuesday, reaching a local high of $81,265 before retreating to $80,601. The flagship cryptocurrency’s recovery has seen it gain around 38% since falling to a low of $58,000 in late June.
Market watchers and analysts are cautiously optimistic about the rally translating into a bull market, primarily because of prevailing geopolitical uncertainty and inflation concerns.
Bitcoin Reaches Multi-Month High
Bitcoin (BTC) crossed $80,000 for the first time in 15 weeks, continuing its recent rally and gaining around 28% in little over a week. The flagship cryptocurrency’s rally has added $350 billion to its market capitalization as buyer interest returned after a period of subdued activity. The rally triggered market confidence, with the Bitcoin Fear & Greed Index rising to 81 on CoinMarketCap, firmly in “Extreme Greed” territory. While BTC’s rally has erased the losses accumulated since May, it now enters a zone that has previously witnessed heavy selling.
BTC is currently testing the resistance zone between $80,000 and $82,000. A close above these levels will confirm that demand persists. However, if the price fails to hold above $80,000, it could retrace towards $76,000, the nearest support zone. Several indicators support the short-term bullish structure. The Money Flow Index is currently above 77, indicating significant buyer interest. However, it is close to its overbought level, indicating chances of a reversal.
Analysts Cautiously Optimistic
While analysts and market watchers are optimistic, they believe the current rally is a catch-up trade rather than the beginning of a new bull cycle. Min Jung, associated researcher at Presto Research, stated,
“While it’s too early to call this a full-blown bull market, the move above $80,000 and the ETF inflows look like a catch-up trade since bitcoin has been lagging other risk assets for a while now.”
Jeff Mei, COO of BTSE, also struck a cautious note, highlighting tight liquidity conditions, inflation, and geopolitical uncertainty. Mei added they would consider a bull market only if BTC holds above $100,000, and the Federal Reserve cuts interest rates.
“I’d presume a bull market only after we sustain $100,000 for a month and the Fed signals rate cuts, which are still uncertain.”
Bitcoin’s Bull Case
However, some analysts believe Bitcoin’s rally and robust spot ETF inflows present a good case for a sustainable rally and bull market. Additionally, the broader cryptocurrency market has also rallied, with Ethereum (ETH), Ripple (XRP), and Solana (SOL) recording substantial double-digit increases. Justin d’Anethan, head of research at Arctic Digital, stated,
“The strength of the move, creating a large bullish engulfing candle on the daily, weekly, and potentially soon on the monthly, seems to hint at a radical trend change, from the boring accumulation to an ‘up’ market.”
d’Anethan added that the US Treasury’s decision to double bond buybacks is a strong indicator of easing monetary and liquidity conditions, which could fuel the rally further.
“More importantly, the key driver of this move (the U.S. Treasury decision to artificially lower rates by buying back bonds) sends a powerful and solid signal that monetary conditions and thus capital are easing up. It’s easy to see why BTC, which underperformed in the first half of 2026, would be the prime beneficiary of this.”
What Does Bitcoin Need For A Sustained Rally
Dominick John, analyst at Zeus Research, highlighted the macroeconomic conditions needed to sustain the current rally. According to the analyst, softer inflation numbers, lower treasury yields, and a weaker dollar were crucial to sustain the rally.
“A softer-than-expected reading could boost risk assets, while a hotter print could pressure yields and liquidity.”
Disclaimer: This article is provided for informational purposes only. It is not offered or intended to be used as legal, tax, investment, financial, or other advice.

Crypto World
Term Finance Permanently Shuts Meta Vaults After Exploit PeckShield Estimated at $8.5 Million


Term Labs said all Term Meta Vaults have been shut down and DAO governance roles revoked after a governance exploit hit the vault product, while withdrawals remain open. In an Aug. 23 update, Term said the shutdown is irreversible and permanently prevents further deposits. The update did not… Read the full story at The Defiant
Crypto World
DOGE Whales Quietly Dumped 280M Tokens While ETF Inflows Cooled: Is Rally Losing Its Real Buyers?
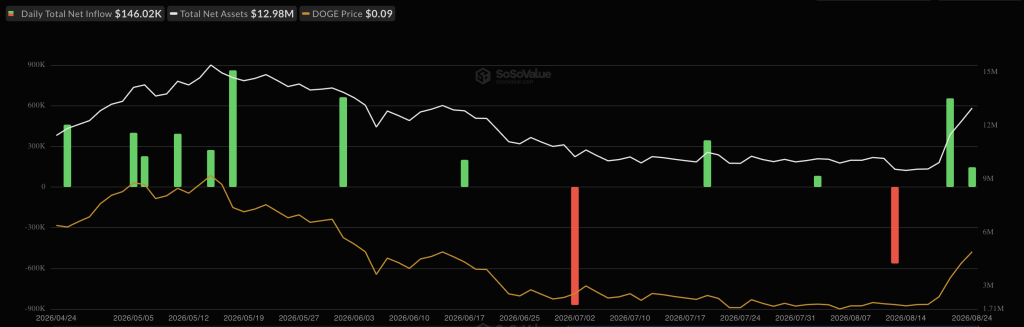
Whales are quietly stepping back right as retail gets excited again. Dogecoin (DOGE) has bounced 3.02% over the last 24 hours to $0.090, a level analysts have flagged as decisive. Can DOGE price push through, or does this stall into another leg down? The signals beneath the bounce suggest the answer might not be what the bulls want.
Spot Dogecoin ETFs pulled in a modest $146,020 inflow Monday, down sharply from the prior week’s $653,420. Institutional interest is present but cooling.

Whale behavior is even less encouraging. Wallets holding between 1 million and 100 million DOGE have shed a combined 280 million tokens since Friday. That is whales quietly de-risking into strength, not a vote of confidence after last week’s 34% rally.
Broader crypto sentiment remains choppy, with Bitcoin’s own price action still setting the tone for beta plays like DOGE. Macro liquidity conditions add another layer that traders should not ignore this week.

Discover: The Best Crypto to Diversify Your Portfolio
Can Dogecoin Price Hit $0.10 This Week?
The chart says bullish. The positioning data says caution.
DOGE at $0.090 sits above both its 50-day EMA near $0.076 and 100-day EMA near $0.081, a structurally bullish setup on paper. The reclaimed downtrend line near $0.070 now acts as support, with immediate protection sitting at the $0.088 horizontal level.
Momentum tells a different story. RSI reads near 77, deep overbought territory, while the long-to-short ratio sits at 0.93, close to a one-month low. Traders are positioning for a pullback even as the price holds up.
A clean break above $0.094, with sustained ETF inflows, could trigger a run toward $0.10 to $0.104. Consolidation between $0.088 and $0.094, as overbought conditions cool off, is the base case. A break below $0.088 exposes the 100-day EMA near $0.081, then $0.076.
Discover: The Best Token Presales
Maxi Doge Targets Early Mover Upside as Dogecoin Tests Key Levels
DOGE holders riding last week’s 34% rally have reason to feel good, but at a market cap in the billions, a repeat of that move gets harder every time.
Whale distribution and a sub-1 long-short ratio suggest the easy gains here may already be priced in. That’s pushing more traders toward earlier-stage plays where upside isn’t capped by nine-figure liquidity.
Maxi Doge (MAXI) is one of those plays, an Ethereum-based meme token built around gym-bro trading culture and “1000x leverage” energy, literally personified as a 240-lb canine mascot.
The presale has raised $4,848,993.00 so far, with tokens priced at $0.0002835 and dynamic APY staking live for holders. Standout features include holder-only trading competitions with leaderboard rewards and a Maxi Fund treasury earmarked for liquidity and partnerships.
Get Ahead of Next Meme Coin Launch Here
The post DOGE Whales Quietly Dumped 280M Tokens While ETF Inflows Cooled: Is Rally Losing Its Real Buyers? appeared first on Cryptonews.
Less than 24 hours after joining Pump Fun, the two memecoins tied most closely to Martin Shkreli are down 94%.
On Monday, Shkreli drew over 700,000 views on his announcement that he would join the Solana memecoin launchpad and start livestreaming his trades.
Elated, PumpFun’s official account welcomed him, claiming he already had a 6,263% gain and $1.6 million in his wallet within one day.
At time of writing, CITRINI, which he created, and MARTIN, a namesake coin that topped Shkreli’s trading history before his CITRINI transactions, have each crashed at least 94% since their highs yesterday.
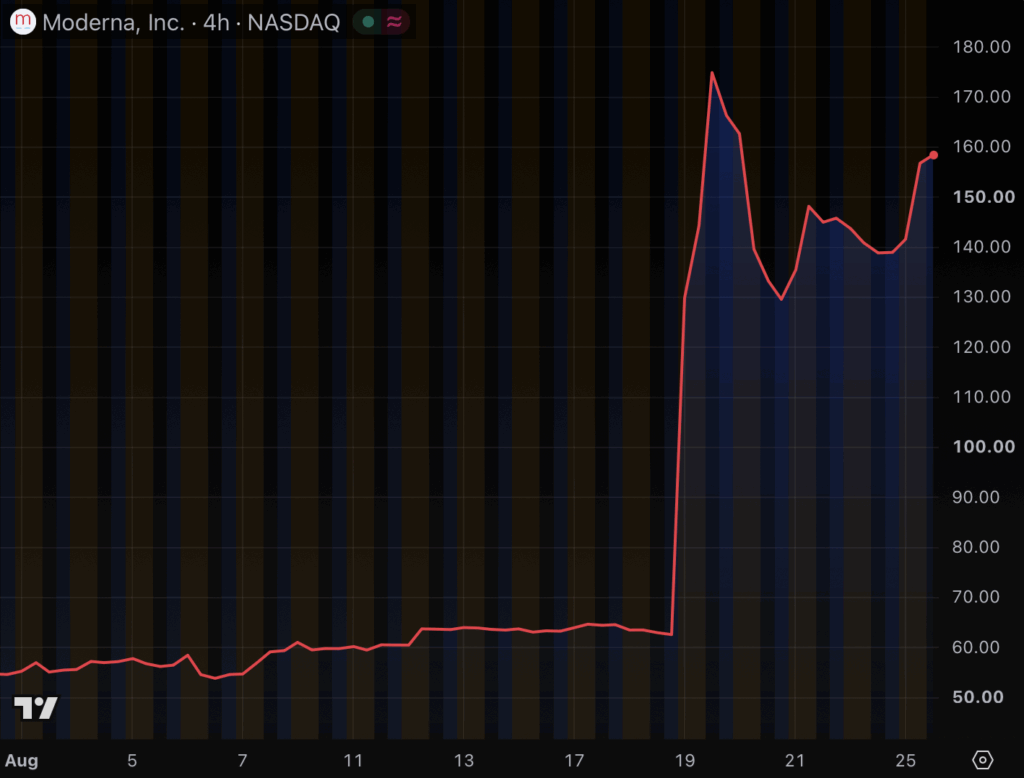
Traders have been paying particular attention to Shkreli recently after he made headlines talking about a short-sale of Moderna earlier this month.
Unfortunately, the pharmaceutical maker skyrocketed higher on positive FDA Phase 3 results shortly after he “was playing around shorting this thing at 80 bucks.”
Moderna currently trades precisely 100% higher than Shkreli’s $80 per share.
MARTIN, CITRINI, DJT, and MSI
A downward-sloping chart is a familiar shape for Shkreli.
Another Solana memecoin tied to him in 2024, DJT, also collapsed after a wallet dumped tokens on buyers.
An Ethereum token linked to him in 2022, MSI, performed even worse. His pattern of losses exceeding 90% for his followers keeps repeating.
Shkreli launched CITRINI live on air. Several viewers described it as a joke, even though it lost people real money.
Yesterday and today, he has spent hours livestreaming trades to tens of thousands of cumulative viewers via X and his PumpFun profile.
The buyers on the other side of those trades were mostly anonymous wallets trying to ride the momentary pump on his endorsements.
The MARTIN memecoin peaked at $0.0031 on Monday, the same day it launched. It then fell to $0.00016 by Tuesday morning. Its market capitalization has fallen to roughly $150,000.
CITRINI has followed the same path. It has traded from $0.0031 to $0.000087, a decline of 97%.
Martin Shkreli’s followers keep losing money
In a reply thread under Shkreli’s join announcement, a user posted a screenshot showing a 95% loss, accusing Shkreli of endorsing a scam.
Shkreli’s responses to complaints on social media follow his typical, cagey communication style, often single words, symbols, quips, or questions that admit nothing.
A follower complained about losses in his replies. With no remorse, he simply asked a rhetorical question, “How are you down 97%?”
As countless followers lose money on Shkreli-themed memecoins, almost every response from Shkreli carries an element of plausible deniability.
Read more: No one surprised as DJT token has finally rugged
A pattern of losses
CITRINI was not the first collapsed token that Shkreli created. In July 2022, he launched Martin Shkreli Inu (MSI), which hit an all-time high near $0.0000343.
On August 12 that year, a wallet linked to Shkreli dumped more than 160 billion MSI tokens in a session. The price crashed more than 90% in a day, according to Bloomberg.
In his own defense, Shkreli told Futurism that he was a hack victim, not the seller. Regardless, MSI now trades more than 95% below that peak.
Two years later, in June 2024, Shkreli surfaced as the figure behind another memecoin, DJT. That Solana memecoin surged on rumors that Barron Trump was involved, even though the son of the president never publicly joined the project.
On August 6, 2024, a wallet tied to the deployer dumped roughly $2 million in DJT. That erased the bulk of its $55 million market cap within minutes, a crash Protos covered at the time.
DJT now trades below $0.000033, down more than 98% from its all-time high.
Got a tip? Send us an email securely via Protos Leaks. For more informed news and investigations, follow us on X, Bluesky, and Google News, or subscribe to our YouTube channel.
The cryptocurrency market continues its impressive performance, with Solana (SOL) being among the biggest gainers today (August 25).
The asset finally reclaimed the $100 psychological level, and now many analysts believe the path is clear for a much more substantial surge. At the same time, certain indicators suggest that a short-term pullback may also be on the way.
Major Uptrend Incoming?
SOL has rocketed by roughly 32% over the past week and hovers around $100: something last observed in February this year. Its market capitalization has increased to nearly $60 billion, solidifying the token’s position as the seventh-largest in the crypto sector.
The most obvious catalyst for the ascent is the broader market boom following the US monetary policy changes announced by the Treasury Department. As a result, Bitcoin (BTC) briefly surpassed $81,000, while Ethereum (ETH) exceeded $2,500.
For Solana, there seems to be another factor: rising institutional interest. Spot SOL ETFs have recently attracted significant capital, signaling that conservative investors have renewed their appetite for the asset. Inflows into such products over the past 24 hours have soared past $33 million, marking the strongest day since mid-December 2025.

As expected, the green wave has sparked huge enthusiasm among traders and analysts, with optimistic forecasts flooding X. Ivan on Tech claimed that SOL has flipped bullish for the first time since Q4 and expects a rise to $300 and above. For his part, David Gokhshtein said he wouldn’t be surprised if the asset’s valuation rises to as high as $800.
Einstein is also generally positive on SOL, anticipating a short-term pump to $150 if $88 holds as support. The analyst is extremely bullish for the long run, predicting an eventual explosion to $1,000.
The Worrying Signals
Despite the positive sentiment, traders and investors should closely monitor two key factors that suggest a correction might be on the horizon.
The first is SOL’s Relative Strength Index (RSI), which has risen to 70. This means the asset has entered overbought territory, which could be a precursor to a move south. The ratio ranges from 0 to 100, where anything below 30 is considered a buying opportunity.

Next on the list is Solana’s recent exchange netflow. According to CoinGlass, inflows have far outpaced outflows over the past several days, suggesting that many investors have shifted from self-custody to centralized platforms. This, in turn, increased immediate selling pressure.

The post Solana (SOL) Climbs to a 6-Month High: The Start of a Mega Rally or a Bull Trap? appeared first on CryptoPotato.
XRP has staged a sharp recovery from the $1.00 area, breaking above its long-standing descending structures on both the USD and BTC charts. However, the rally has now reached major resistance, making the current levels critical for the next directional move.
Ripple Price Analysis: The USDT Pair
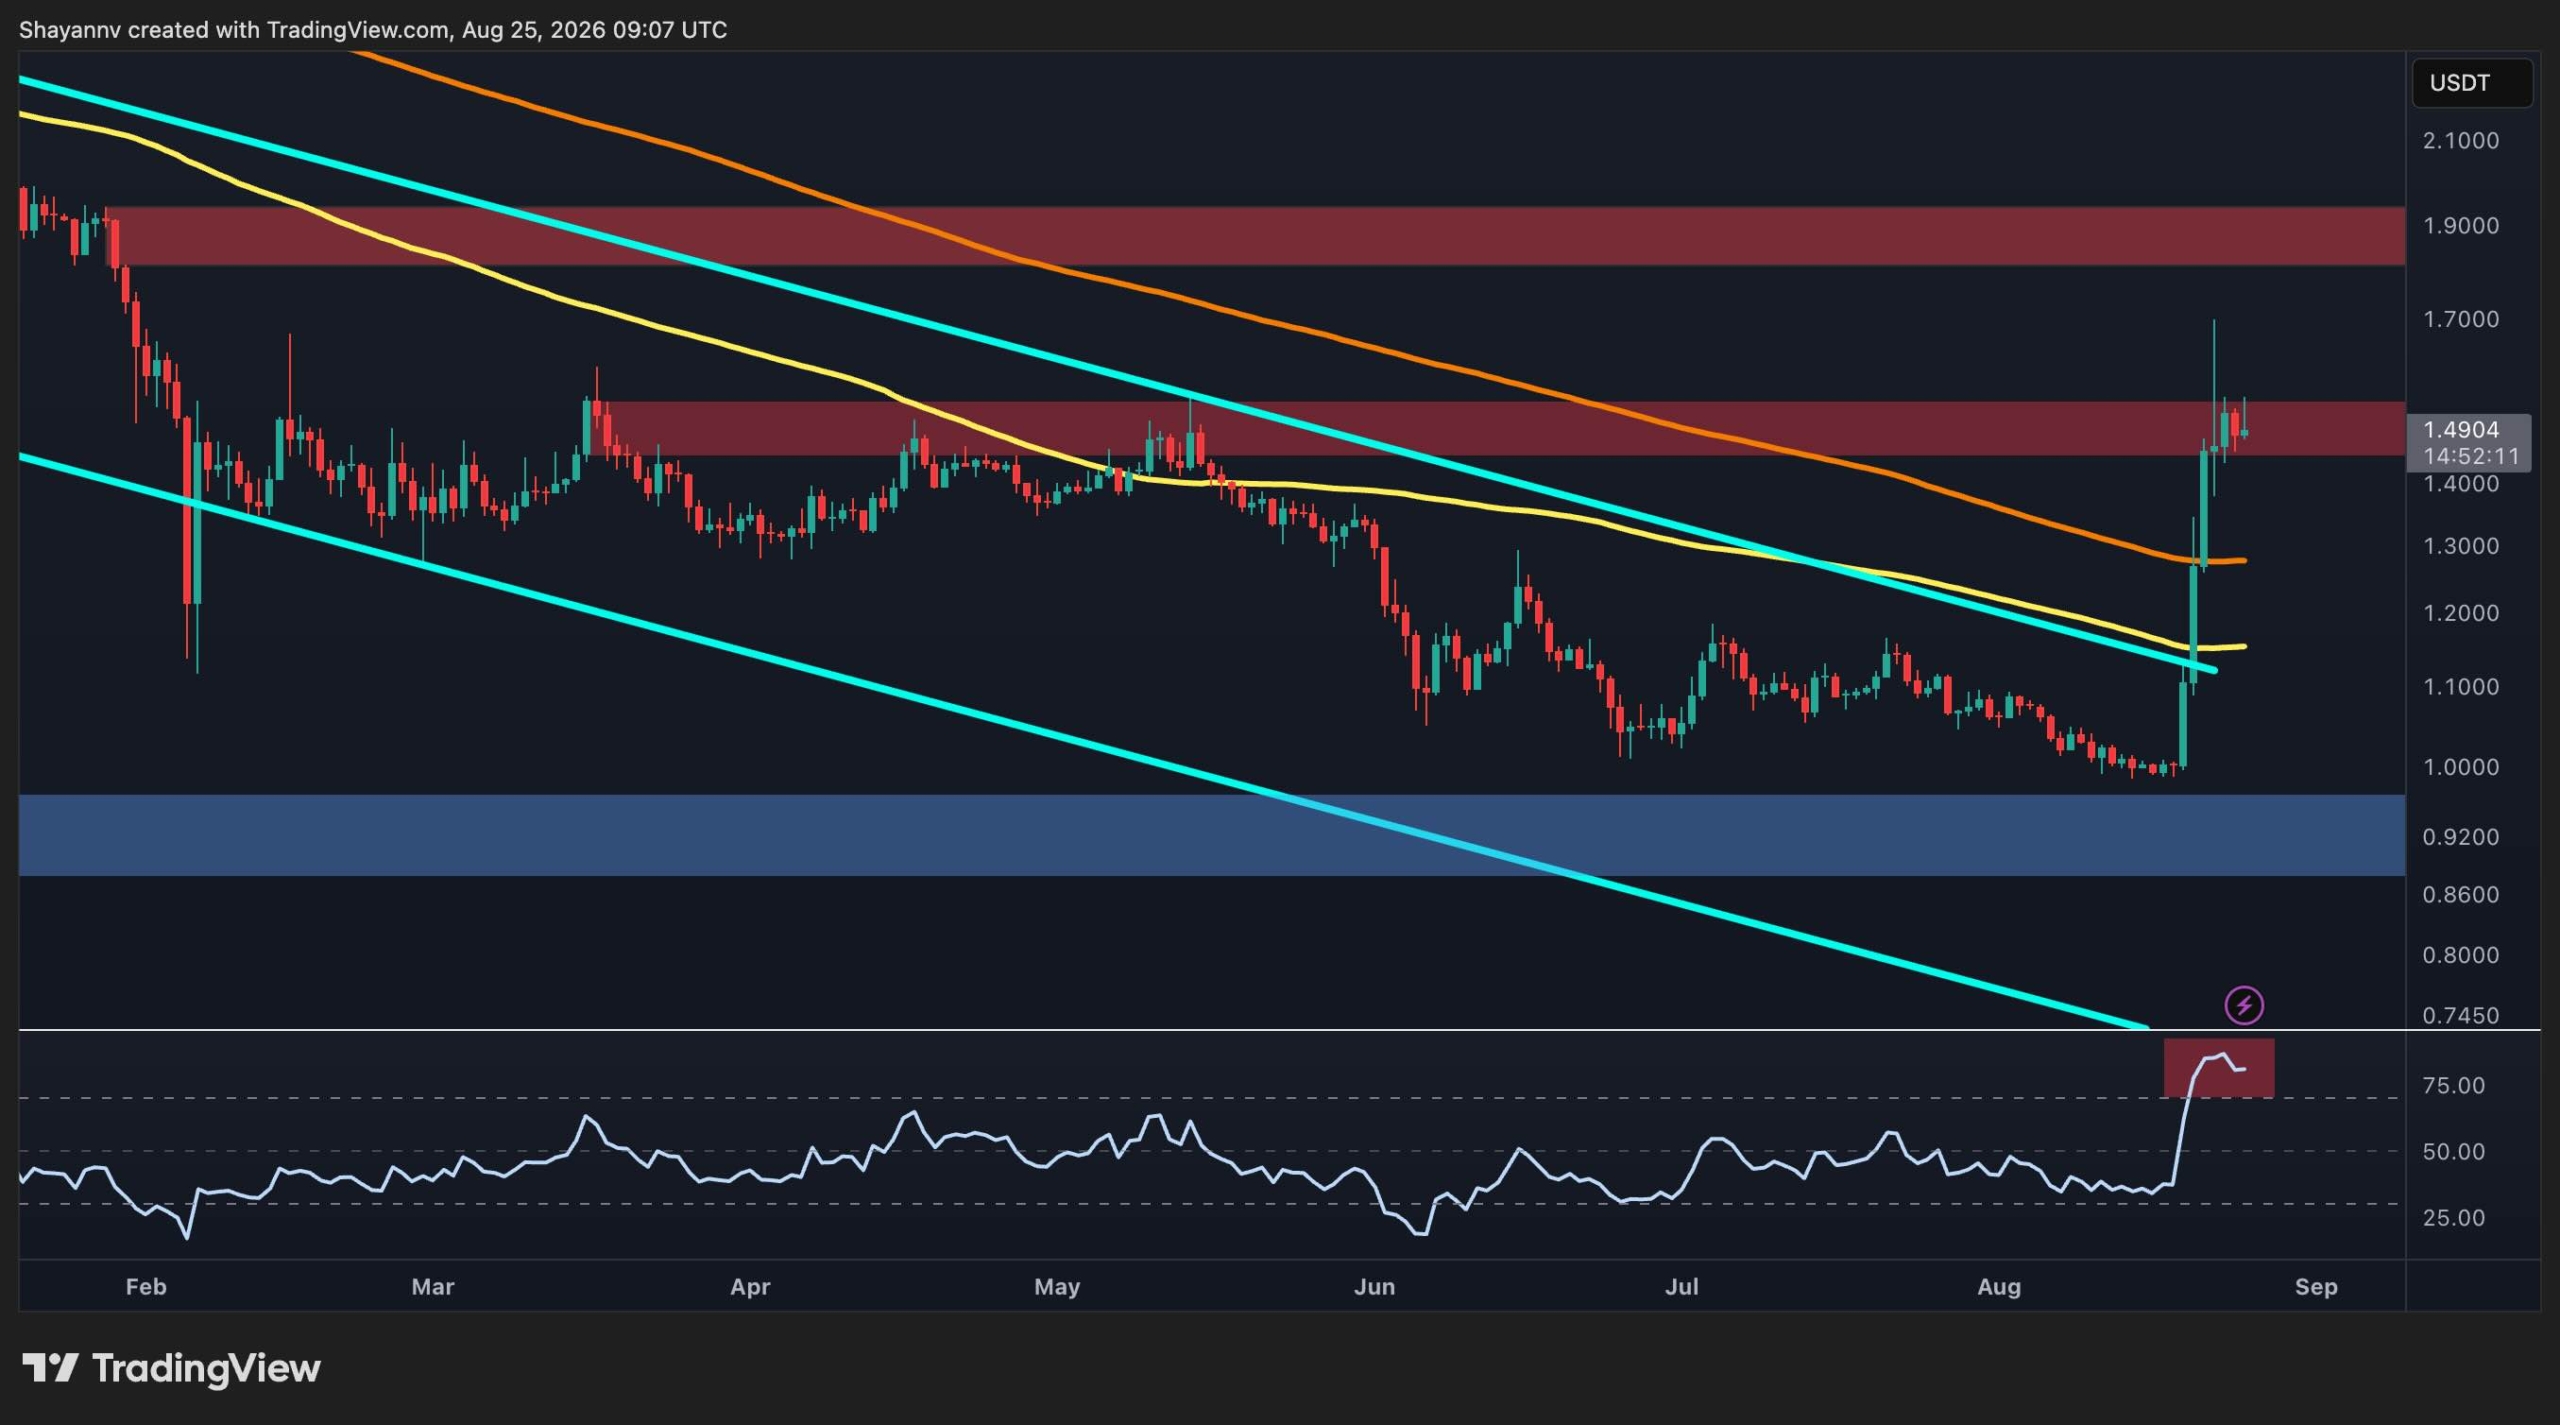
The asset broke above its broad descending channel after finding support around $1.00. It has since reclaimed the 100-day and 200-day moving averages, located around $1.2 and $1.3, respectively. The move above $1.3 has turned both of these former resistance elements into near-term support.
The rally is now testing the critical $1.50 resistance zone, where the price has started to consolidate. A daily breakout above $1.50 could open the door toward the $1.80-$1.90 area. Conversely, a rejection followed by a move below $1.30 would weaken the breakout structure and raise the risk of a deeper correction, and even potentially back toward the $1 area.
The RSI has also surged above 70 and still remains extremely elevated in the overbought region. This highlights strong momentum but also leaves room for a short-term cooldown, which could lead to a retest of the 200-day moving average.
The BTC Pair
On the XRP/BTC daily chart, it is evident that the price has attempted to break out of its broad descending channel after bottoming near 1,500 sats. However, unlike the USDT pair, the breakout has so far failed. The pair briefly pushed above the channel’s upper boundary before printing a large rejection wick, signaling that sellers remain active around this resistance.
XRP/BTC is now retracing toward the previously broken 200-day moving average, which is being tested as potential support. The reaction around this moving average could be important for the next move. If XRP/BTC manages to hold above it and establishes the former breakout area as support, another attempt at the 2,000 sats resistance zone could follow.
A successful break above 2,000 sats would strengthen the relative-strength outlook, while a decisive loss of the 200-day moving average would suggest that the recent breakout attempt was a false move and could expose the pair to further downside. The RSI has also pulled back after briefly moving above 70, reflecting the loss of momentum following the failed breakout, and indicating that a further consolidation or correction could materialize in the coming weeks.

The post Ripple Price Analysis: Has XRP Run Out of Steam After the $1.70 Rejection? appeared first on CryptoPotato.
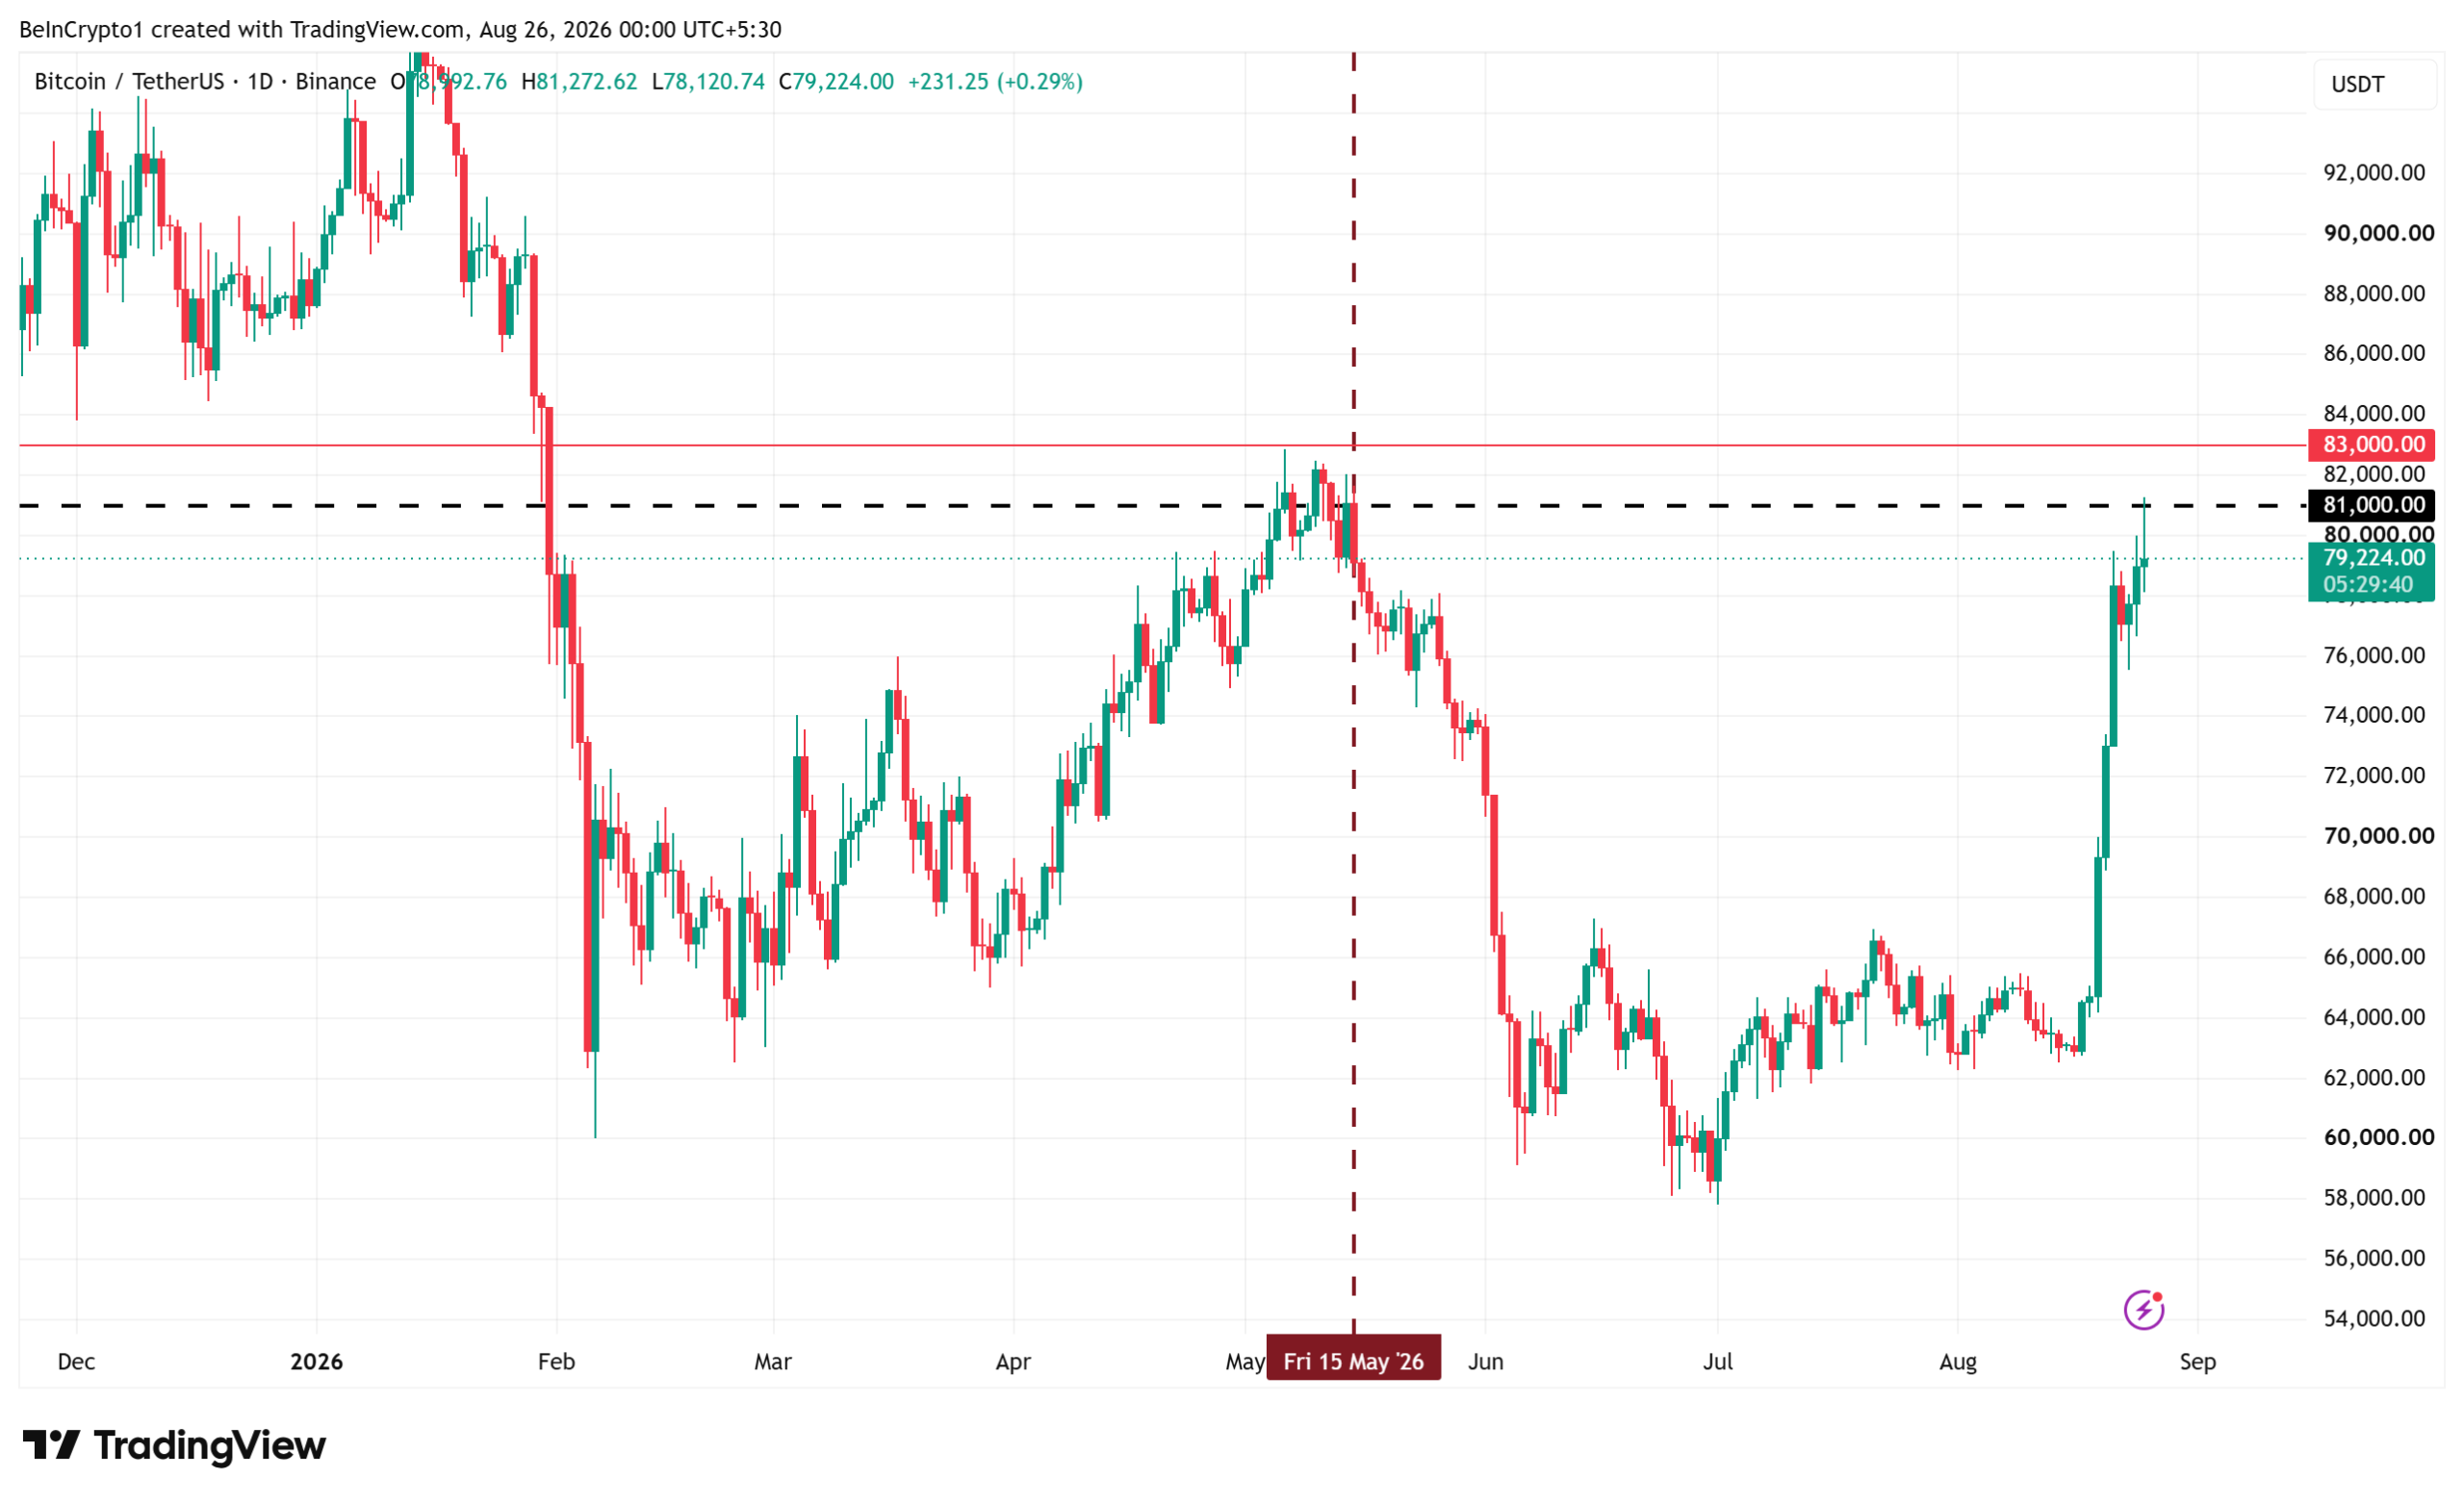
Bitcoin (BTC) has flipped into a new bull market regime, according to CryptoQuant, after its Bull Score surged from 30 to 80 in a single week. The firm calls it the fastest reversal in a year.
One hurdle remains before the shift becomes official. Bitcoin must close above its 365-day moving average, which sits near $83,000 today.
Follow us on X to get the latest news as it happens
A 24% Rally Rebuilds the Bitcoin Bull Market Case
Bitcoin has climbed 24% since Monday, August 17, touching an intraday peak of $81,272 on Binance. That marks its highest level since May 15, 2026. At press time, BTC traded near $79,224, up 1.9% over 24 hours, according to BeInCrypto market data.

Two macro catalysts drove the move. The US Treasury said it will double long-term bond buybacks to at least $4 billion per operation from September 9. Markets also rallied after Trump’s Bitcoin purchase hint suggested Washington may buy BTC directly.
CryptoQuant’s Bull Score, a composite of 10 on-chain and market metrics, now reads its most bullish since October 6, 2025, when Bitcoin traded at $124,000. Eight of the 10 inputs currently flash green.

Demand data supports the shift. Apparent spot demand is growing at its fastest monthly pace since late December. Spot and futures demand are also expanding together for the first time since early October 2025. BeInCrypto recently examined similar crypto demand signals that had yet to confirm
“Market regime has switched to Bull for Bitcoin. Basically all metrics are pointing to the initial phase of a new bull market… Bitcoin’s price still has to cross above its 365-day MA ($83K today) for the bull market to be ‘officially’ confirmed,” Julio Moreno, head of research at CryptoQuant, added, suggesting that the data looks constructive but incomplete.
Overheating Signals Cloud the $83,000 Confirmation Test
The same report warns that the market looks stretched in the short term. Trader unrealized profit margins spiked to 20.5%, the highest since June 2025.
Meanwhile, whales realized a record $614 million in profits on August 20. Exchange inflows for BTC, Ethereum (ETH), and XRP have also jumped, a pattern that often precedes selling pressure.

Broader risk appetite also leans bullish, with asset managers holding nearly $375 billion in long S&P 500 futures, close to record highs. Their emerging and developed market exposure also sits at or near records.
The rally follows Bitcoin’s strongest weekly close since 2024. Confirmation now depends on a decisive close above $83,000. The other question is whether rising exchange inflows deliver the correction Moreno flagged.
The post Fastest Bitcoin Bull Flip in a Year Has One $83,000 Problem, Analyst Says appeared first on BeInCrypto.


Tokenized real-world assets on Solana are nearing $4 billion as network activity accelerates alongside a broader recovery in crypto markets.
Crypto World
South Korea trade giant POSCO brings trade receivables to Avalanche in latest tokenization move


The $22 billion trading company worked with Olea and Intain on the transaction, following an Injective pilot with LG CNS last month.
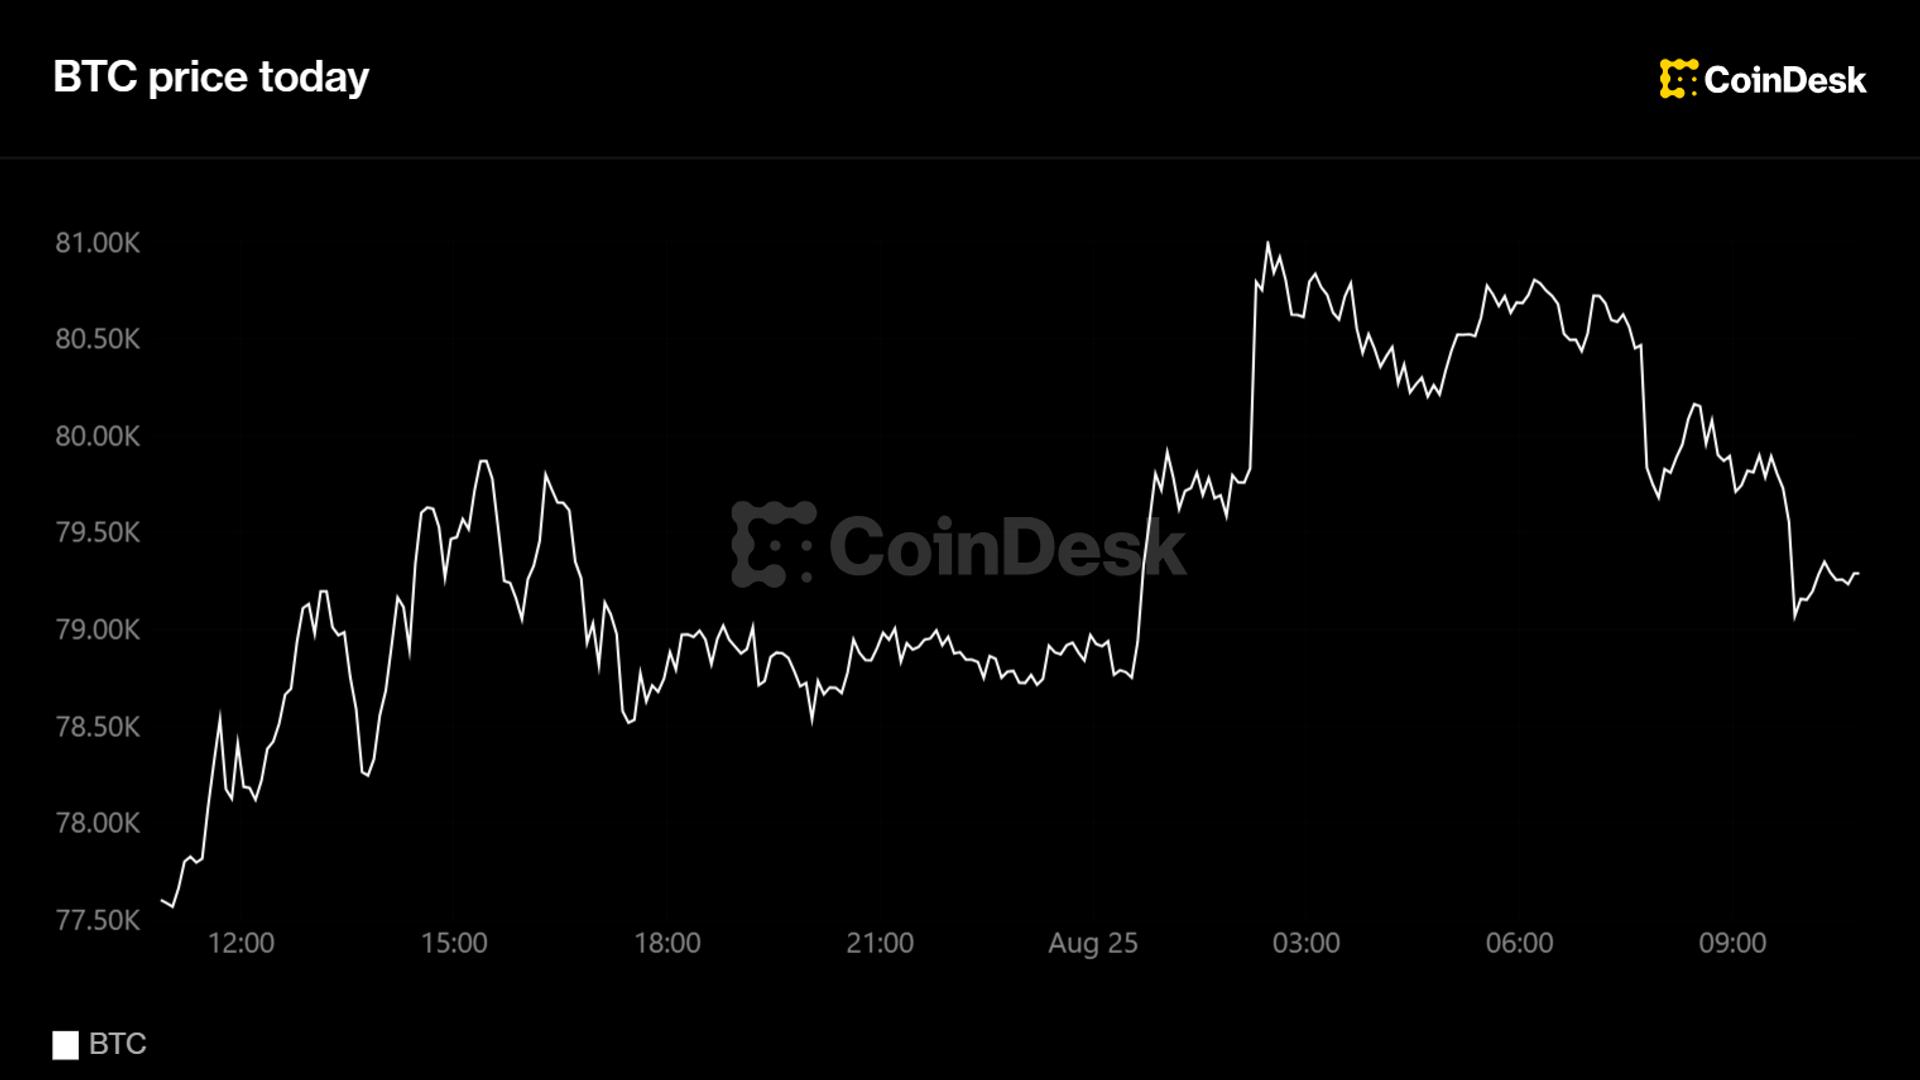
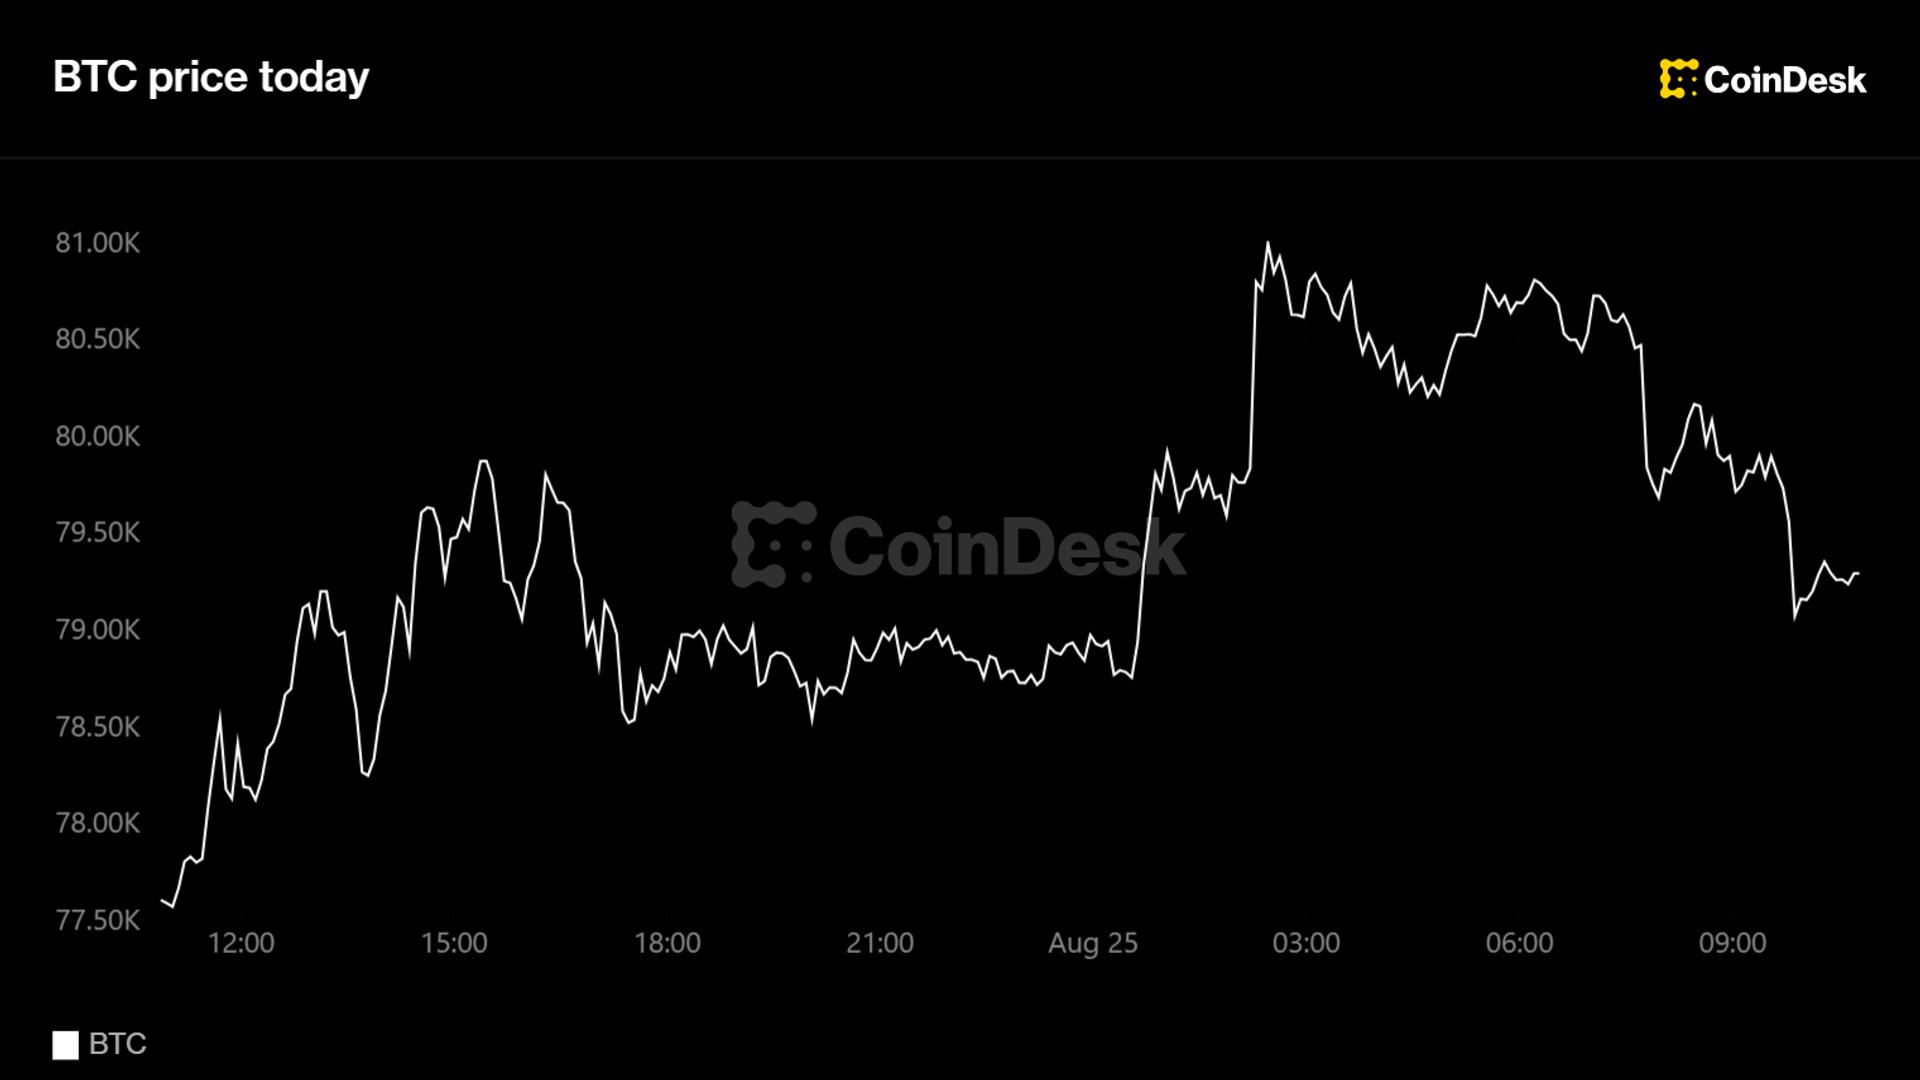
Bitcoin crossed $80,000 for the first time since May, extending its seven-day advance to roughly 25%.

“Together, there could be a possibility they’re quite lethal,” Trump said of the combined shot, which has been in use for more than 50 years and has a strong safety and efficacy record.
Doctors and vaccine scientists said Trump’s executive order and comments were unscientific and misleading. “As measles cases reach a 35-year high in the U.S. and with cold and flu season quickly approaching, [the] executive order on vaccines is not only disheartening but dangerous,” Dr. Andrew Racine, president of the American Academy of Pediatrics (AAP), said in a statement at the time.
An additional early dose of the vaccine can also be given to children aged 6 to 11 months under some circumstances, says Dr. Elizabeth Murray, a pediatric emergency medicine physician in Rochester, N.Y. “With the ongoing measles outbreak, make sure your children are immunized. If your child is under age 1, talk to your doctor. Depending on how much measles is circulating where you live, your doctor may recommend an earlier dose,” she says.

BlackRock vs RBI: Paisa Kahan Lagayein?

‘We used flour for powder’ – Dolly reflects on early life in 1979 BBC interview

Term Finance Permanently Shuts Meta Vaults After Exploit PeckShield Estimated at $8.5 Million





-

 Fashion4 days ago
Weekend Open Thread: Madewell – Corporette.com
-

 Business3 days ago
Musk’s Tesla, SpaceX Confirm $16.8 Billion ‘Terafab’ Chip Plant as World’s Largest Building in Texas
-

 Crypto World4 days ago
anatomy of crypto’s biggest liquidation event since 2021
-

 Politics3 days ago
6 months on, Irish renters crushed by effects of government housing bill
-
 NewsBeat3 days ago
The ‘Lucky Dip Gang’ causing carnage for clicks: After five thugs were killed speeding in the wrong direction on a motorway, GUY ADAMS investigates a sick new trend… and why police aren’t even allowed to pursue them
-

 Crypto World20 hours ago
A $30 Billion AI Fund Implodes, Now the SEC Is Investigating Wall Street’s Role
-

 Tech7 days ago
GLM-5.3 hits the API at $1.4/$4.4 per million tokens
-

 Business2 days ago
Mystery AI Model ‘Ox Alpha’ Draws Developers With Free Access as Chinese Lab Origins Remain Debated
-

 News Videos6 days ago
Don’t Leave Your Financial Future To Chance | August 19, 2026
-

 Business6 days ago
Marvell Shares Jump 7% as Google Chip Deal Confirms Custom AI Silicon Partnership, Analysts
-

 Business5 days ago
Five Below: Kids Discount Retailer Reaps Rich Rewards
-

 Business4 days ago
UK firms in critical financial distress rise 9% to 53,756
-

 Sports3 days ago
Deshaun Watson fires back at Browns fans after being booed: ‘It’s a disrespectful thing’
-

 Fashion6 days ago
Jimmy Choo Autumn 2026 collection
-

 Tech6 days ago
OpenAI confirms ChatGPT is down as logins and signups fail
-

 Crypto World5 days ago
Optimism-funded team's deciding vote shifts $49 million in OP tokens away from users
-
 Crypto World2 days ago
Google Gemini AI Predicts Ethereum Could Become the Trade Retail Misses in 2026
-

 Business6 days ago
PayPal and Venmo now accepted for tuition at several universities
-
 Sports6 days ago
Chaos! Daniil Medvedev loses cool, breaks two advertising boards at Cincinnati Open – Watch | Tennis News
-
 Entertainment6 days ago
10 Most Perfect Fantasy Shows of the Last 25 Years
You must be logged in to post a comment Login