
Crypto World
ETH Needs to Reclaim This Key Level to Flip the Script
Ethereum’s recent price action reflects a market transitioning from impulsive selling into a potential short-term stabilisation phase. After a sharp decline toward the $1,750 demand zone, ETH has reacted with a moderate rebound, yet is expected to continue fluctuating in the short term.
Ethereum Price Analysis: The Daily Chart
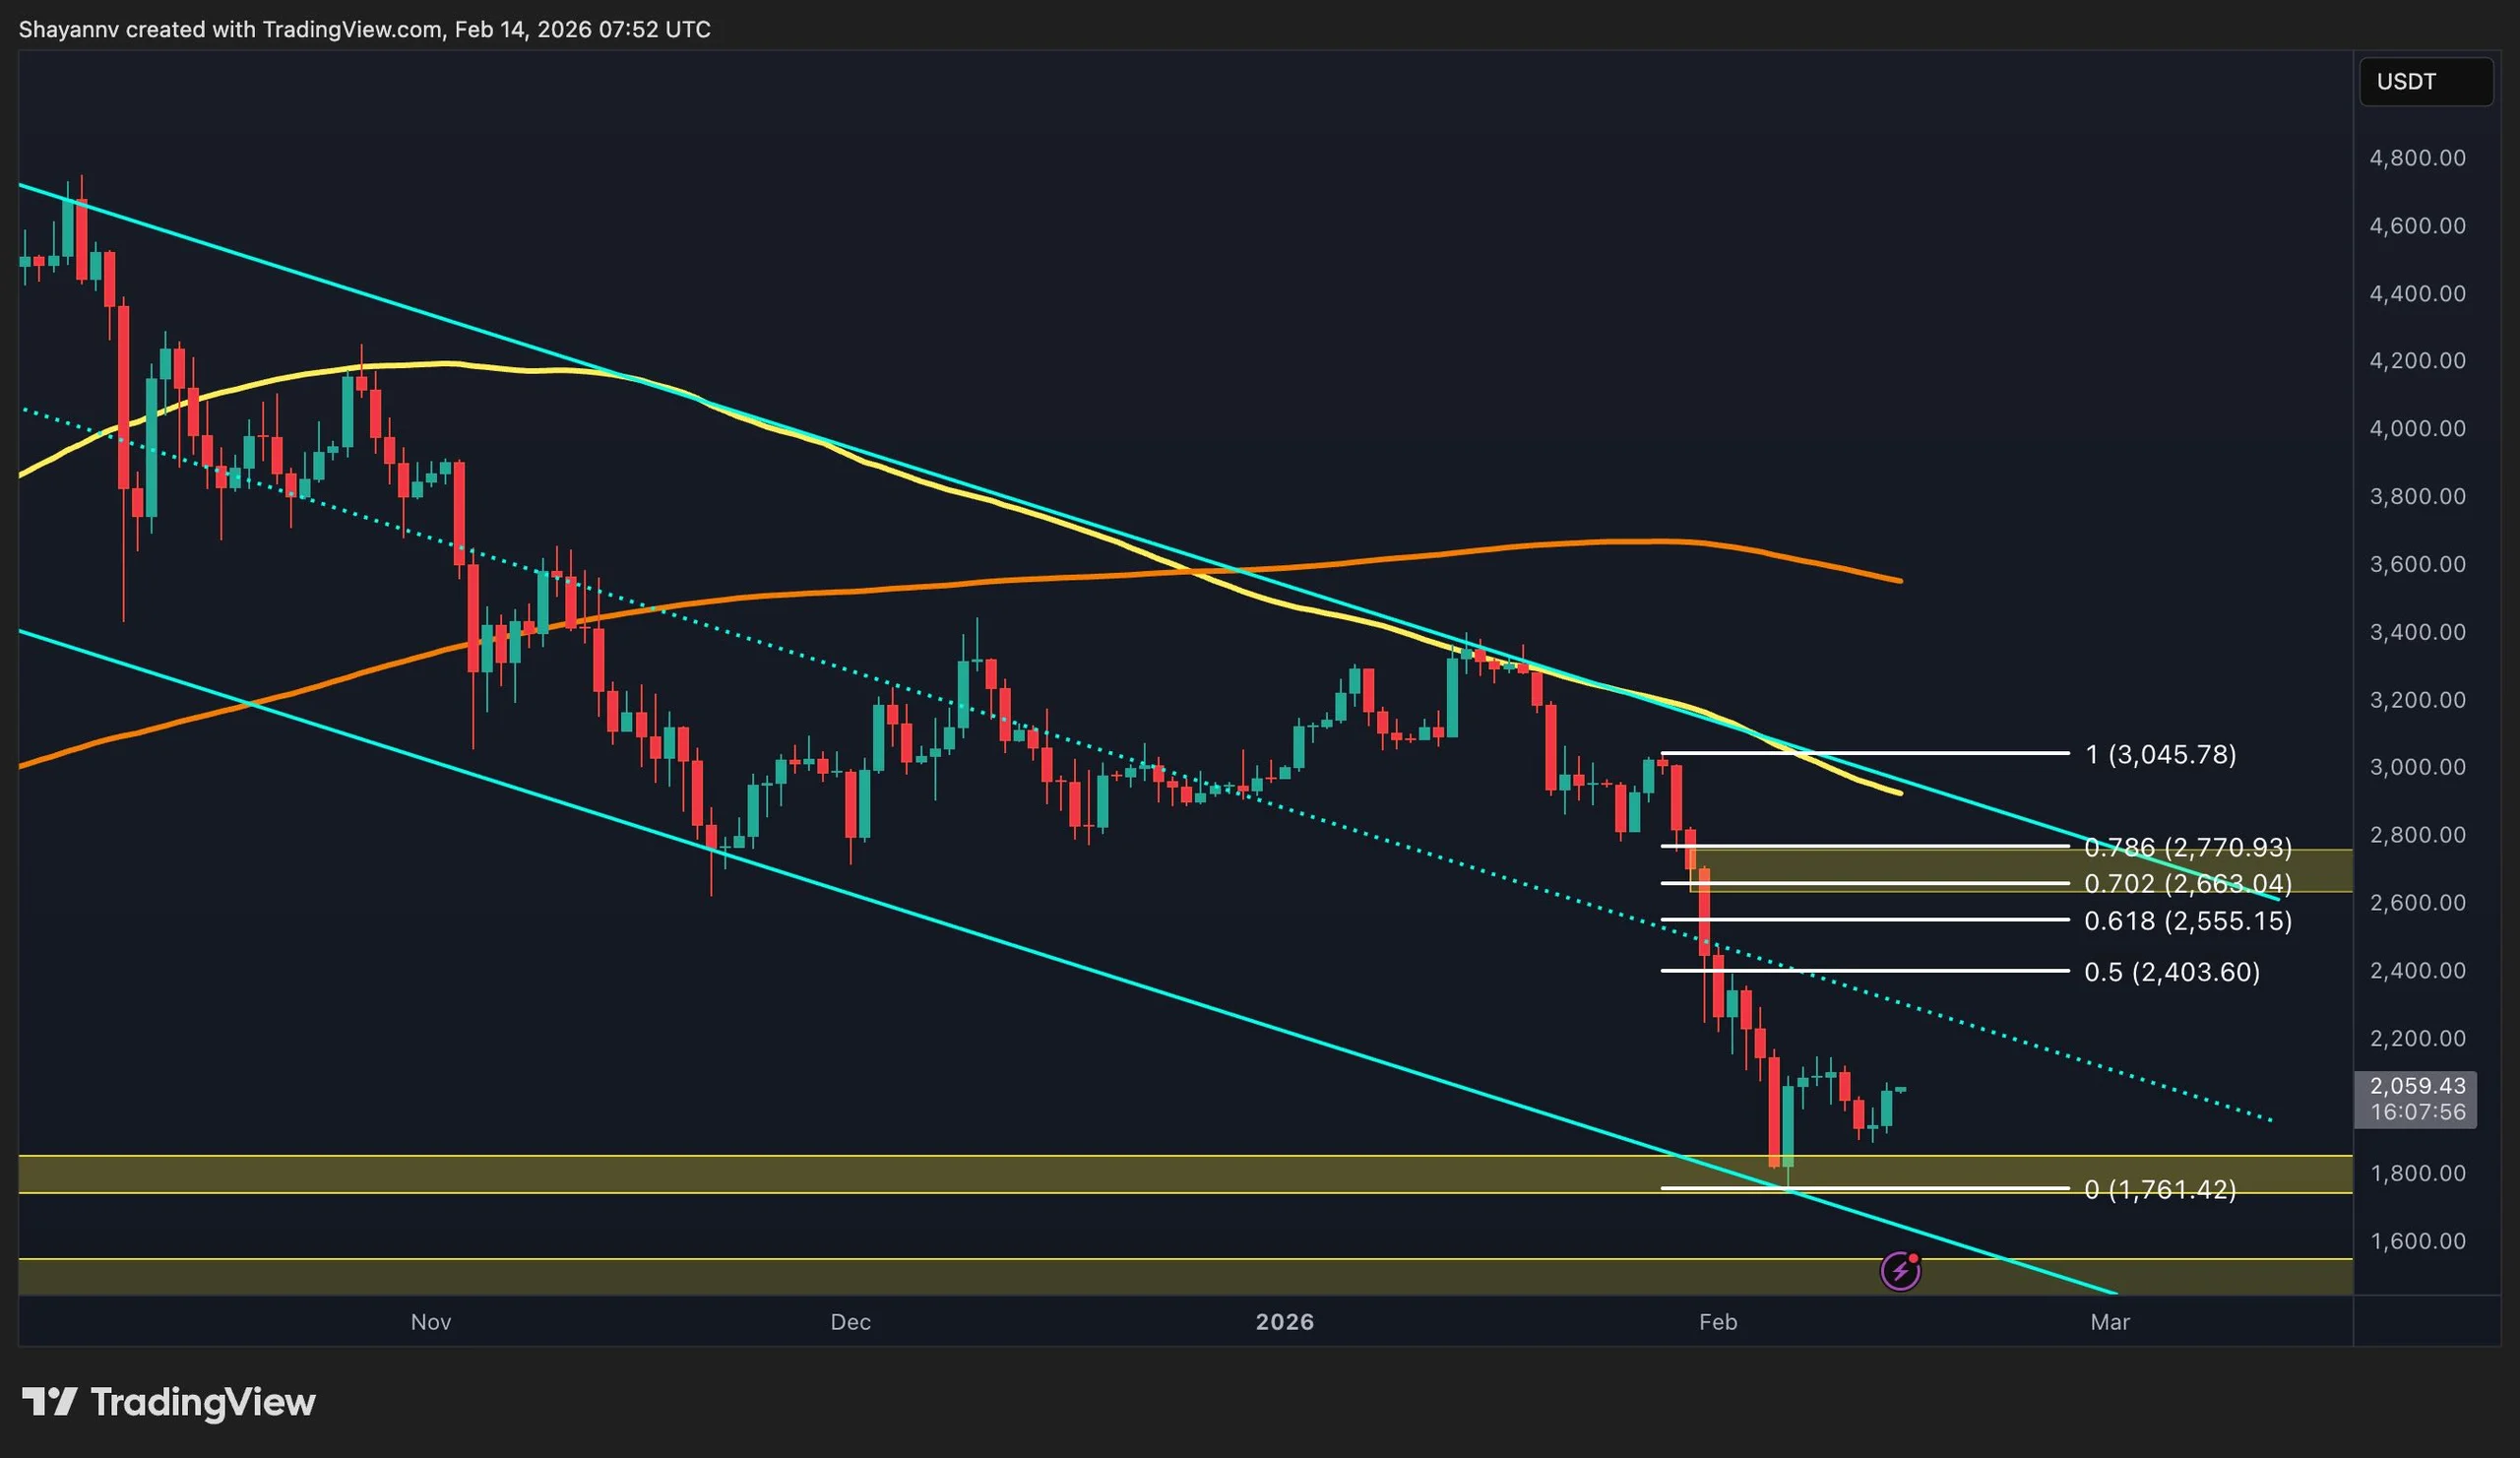
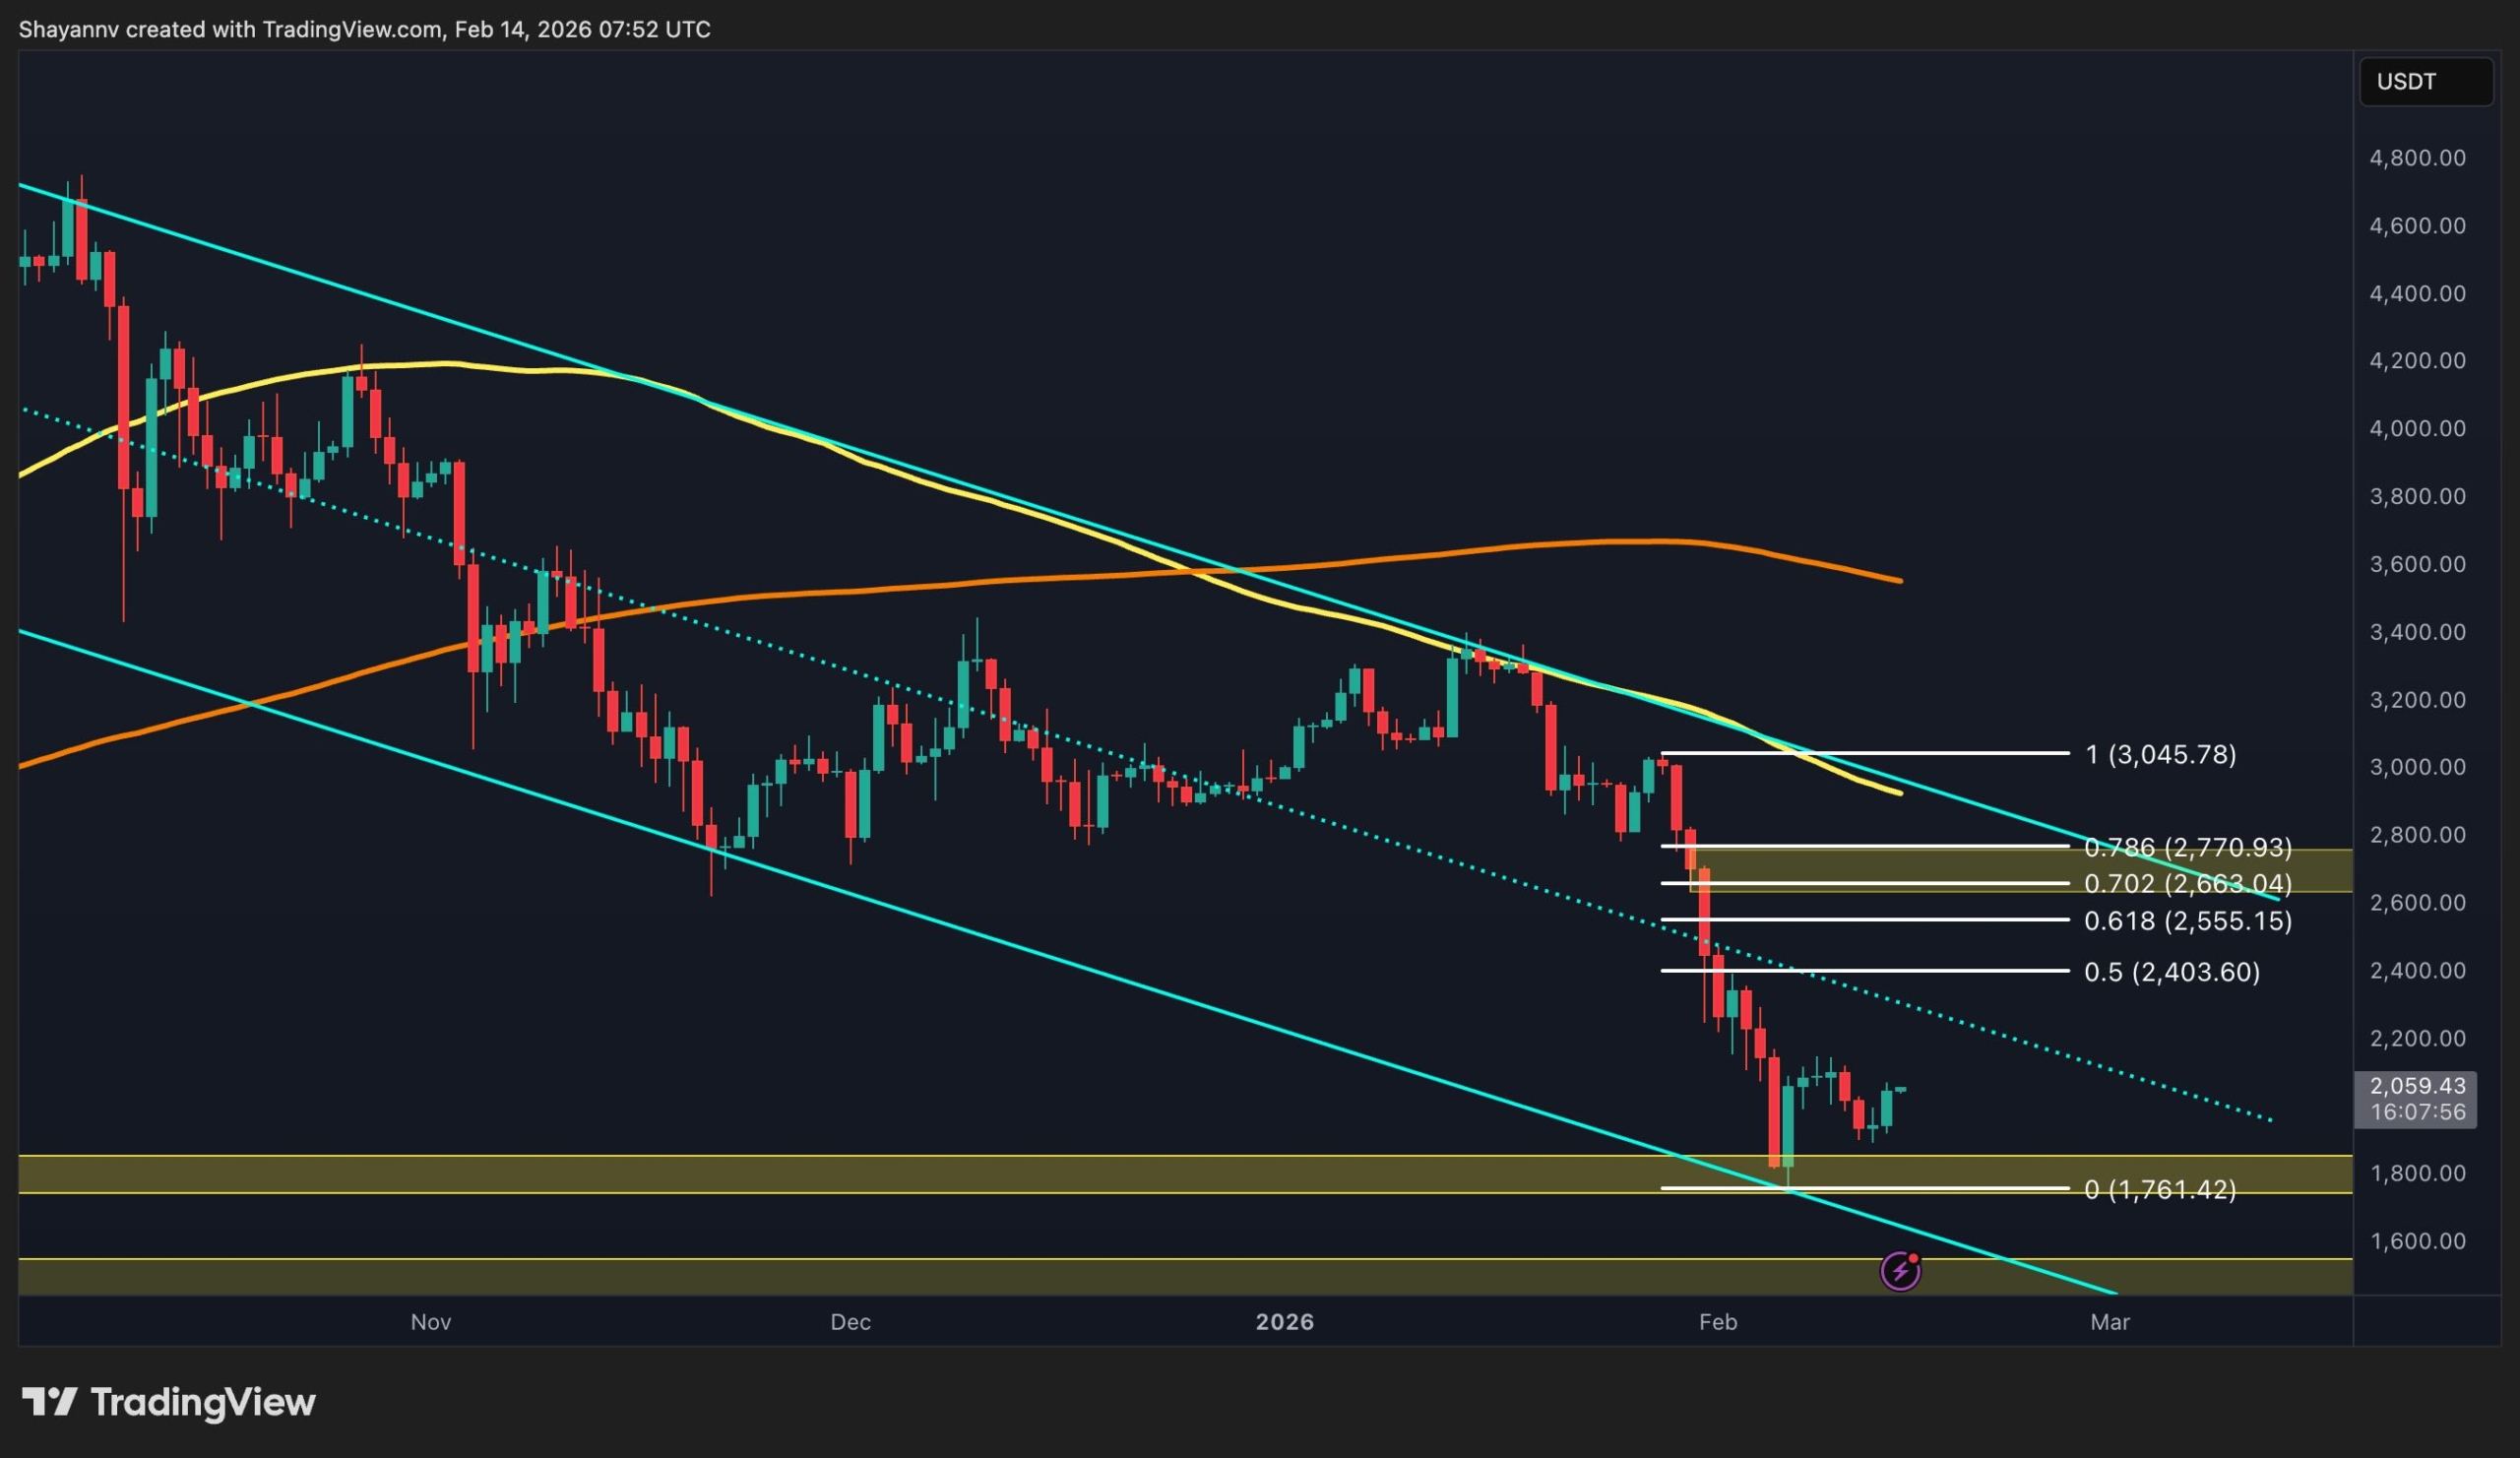
On the daily chart, ETH continues to trade inside its descending channel, with lower highs and lower lows still intact. The recent impulsive drop pushed the price sharply into the $1.8K demand area, where buyers reacted and triggered a rebound toward the $2.1K region.
However, the asset remains below the 0.5 Fibonacci level at $2.4K and well under the 0.618 level at $2.5K, confirming that the current move is corrective rather than a confirmed trend reversal.
The $2.7K range, aligned with the 0.702–0.786 retracement levels, stands as a major supply zone and would be the key resistance area if a stronger recovery unfolds. As long as ETH remains below $2.5K, the broader structure favours sellers, while the $1.7K level remains the critical support to hold.
ETH/USDT 4-Hour Chart
On the 4-hour chart, the price action has formed a short-term contracting structure after the sharp bounce from $1.7K. The market is currently fluctuating between the ascending short-term support trendline and the descending local resistance trendline, compressing near the $2.1K area. A successful break above $2.1K could open the path toward $2.5K, which is the next key resistance.
Conversely, losing the $2K intraday support would likely expose the $1.8K zone again. For now, ETH appears to be in a short-term consolidation phase between $1.8K and $2.1K following the recent volatility spike.

Sentiment Analysis
The Ethereum Spot Average Order Size chart shows a notable increase in green dots during the recent decline toward the $1.8K region. These green clusters indicate large whale-sized spot orders entering the market as prices traded at low levels. This behaviour suggests potential accumulation by bigger players during the panic-driven sell-off.
While this does not immediately signal a trend reversal, the concentration of whale activity near $1.8K strengthens this zone as a structurally important demand area. If accumulation continues and price stabilises above $2K, the probability of a broader recovery toward higher resistance levels will gradually increase.

SECRET PARTNERSHIP BONUS for CryptoPotato readers: Use this link to register and unlock $1,500 in exclusive BingX Exchange rewards (limited time offer).
Disclaimer: Information found on CryptoPotato is those of writers quoted. It does not represent the opinions of CryptoPotato on whether to buy, sell, or hold any investments. You are advised to conduct your own research before making any investment decisions. Use provided information at your own risk. See Disclaimer for more information.


Genius Group, an AI-powered Bitcoin treasury and education company, disclosed in its first-quarter 2026 results that it has sold the remainder of its Bitcoin holdings to pay down debt. The move marks a notable shift for a company that had branded itself with a “Bitcoin first” strategy just over a year earlier, and it arrives amid a broader wave of corporate liquidations in crypto treasuries.
The company said it would recommence building its Bitcoin Treasury when market conditions are more favorable, signaling a potential pivot back to crypto accumulation once the macro backdrop allows. Genius Group had been gradually reducing its holdings since mid-2025 after a period when it was temporarily barred by a U.S. court from expanding its Bitcoin budget. Although the firm had held 84 BTC as of March 2026, the latest liquidation effectively ends its current Bitcoin exposure, consistent with the phrasing that it “sold the remainder” in the first quarter.
The disclosure comes as Genius Group reported a strong start to 2026. First-quarter revenue climbed 171% year-over-year to $3.3 million, while gross profit rose 228% to $2 million. The company swung from a $500,000 operating loss in Q1 2025 to a net profit of $2.7 million in Q1 2026, underscoring improving fundamentals even as its crypto treasury strategy has shifted away from Bitcoin holding expansion.
Key takeaways
- Genius Group confirms the sale of its remaining Bitcoin holdings in Q1 2026 to reduce debt, with the implication that its Bitcoin treasury is no longer a current asset.
- The company had previously pledged a “Bitcoin first” approach in November 2024, aiming to keep 90% or more of reserves in Bitcoin; the Q1 move signals a strategic reversal in the near term.
- Other notable corporate moves reflect a broader trend: Mara.
Holdings liquidated a large chunk of its BTC to fund debt paydown, cutting its treasury to 38,689 BTC, while Bitdeer and several other firms also sold portions of their holdings in 2026.
- Despite the selloffs, Michael Saylor’s Strategy remains the standout counterpoint, with ongoing Bitcoin accumulation that has drawn significant attention from investors tracking corporate exposure to BTC.
Corporate treasuries in flux
Genius Group’s decision to liquidate its Bitcoin reserve underscores a growing divergence in how companies are approaching crypto treasuries during a bear-market environment. The Q1 2026 results show other parts of the business performing strongly even as the crypto allocation changes. Genius Group’s revenue growth and profitability improvement point to a broader trend: non-crypto operations are resonating with investors even as Bitcoin exposure is trimmed back for now.
The timing aligns with a string of high-profile sales across the corporate crypto space this year. Mara Holdings disclosed the sale of 15,133 BTC for roughly $1.1 billion in March, a move designed to repurchase convertible senior notes and allocate capital to other corporate needs. The liquidation reduced Mara’s BTC holdings to about 38,689 BTC, positioning the company among the largest corporate BTC treasuries behind Twenty One Capital. The proceeds were aimed at stabilizing the balance sheet and financing debt-related needs.
Other notable actions included Bitdeer liquidating its entire BTC stash of 943 coins and selling newly mined BTC, driving corporate holdings to zero in February. Cango Inc. also disclosed the sale of a portion of its 4,451 BTC treasury, while GD Culture Group authorized the sale of some of its 7,500 BTC reserve in February. Taken together, these moves illustrate a broader calendar in which several tech- and mining-adjacent firms have prioritized de-risking and liquidity over immediate BTC accumulation.
Two voices: the bear-market buyers and the bear-market sellers
Amid the wave of disposals, one voice remains conspicuously active in Bitcoin accumulation. Michael Saylor’s Strategy, often cited as the largest corporate Bitcoin treasury, has continued buying through 2026. Analysts and trackers note that the Strategy has purchased thousands of BTC this year, maintaining a steady rhythm of accumulation that stands in contrast to the broader corporate exodus from BTC holdings. The latest figures show a cumulative total in the vicinity of tens of thousands of BTC for the year, with the Saylor Tracker documenting ongoing purchases and the overall size of the Strategy’s treasury rising despite market volatility.
The divergence between the “buy, hold, repeat” posture of the Saylor Strategy and the liquidity-focused exits by other corporate holders highlights a central tension in the crypto ecosystem: a speculative, macro-driven bear market versus a long-horizon, treasury-focused narrative that sees bitcoin as a balance-sheet asset rather than a pure bet on price alone. Investors watching corporate behaviors should pay attention to whether these selling waves represent opportunistic balance-sheet management or a broader reallocation away from BTC as a reserve asset.
What this means for investors and builders
For investors, Genius Group’s latest move is a reminder that corporate crypto policies are fluid and highly contingent on debt levels, liquidity needs, and broader market conditions. A company that once championed Bitcoin as its primary treasury asset is now prioritizing debt reduction and operating profitability, signaling that crypto is increasingly treated as one instrument within a diversified capital-allocation framework rather than a guaranteed anchor for all reserves.
For users and builders in the crypto space, the pattern of asset reallocation among corporate treasuries could influence market liquidity and the availability of BTC on exchange networks. As sales from large holders continue, buyers at different risk tolerances may emerge, potentially affecting price dynamics. Yet, the ongoing accumulation by the Saylor Strategy serves as a counterweight, suggesting that long-term holders continue to see BTC as a strategic asset rather than a short-term liquidity sink.
Regulatory and macro developments will also color the next phase. If the operating environment supports continued debt management and profitability for technology-driven firms, we may see more measured rebalancing rather than outright liquidations. Conversely, a sustained downturn or tighter funding conditions could accelerate the retreat from BTC across more corporate treasuries.
Looking ahead, readers should watch how Genius Group communicates its Bitcoin strategy going forward and whether any new capital-raising or debt-structuring moves arise as it pivots toward a more conventional balance sheet posture. At the same time, the market will be watching Mara and others to gauge whether their liquidations were one-time debt-management steps or the start of a broader asset-reallocation cycle.
In the near term, analysts will likely assess how much of this activity reflects structural changes in corporate risk tolerance versus opportunistic balance-sheet management in response to market cycles. If market conditions improve or if macro liquidity returns, the door could reopen for new Bitcoin treasury accretions, potentially complemented by refined, risk-aware treasury strategies from other technology-focused firms.
For now, the narrative is clear: a notable tilt away from Bitcoin holdings by several high-profile corporate treasuries, counterpointed by continued, disciplined accumulation by leading long-term holders. The next few quarters will reveal whether this is a temporary season of balance-sheet retooling or a more enduring shift in how corporations view Bitcoin within their financial mix.
What to watch next: how Genius Group and its peers re-enter or defer Bitcoin treasury activity, the trajectory of their debt management needs, and the evolving appetite among investors for corporate BTC exposure as a strategic reserve.


Alabama has become the second state in the United States to grant legal status to decentralized autonomous organizations under the Decentralized Unincorporated Nonprofit Association Act.
Summary
- Alabama granted legal status to decentralized autonomous organizations under the DUNA Act, becoming the second US state after Wyoming to do so.
- The law provides DAOs with legal recognition and limited liability protections, allowing them to operate, contract, and hold assets within a defined legal framework.
The DUNA Act, introduced in February by Republican Senator Lance Bell, provides legal recognition and limited liability protections to DAOs after passing 82-7 with 16 abstentions on March 17.
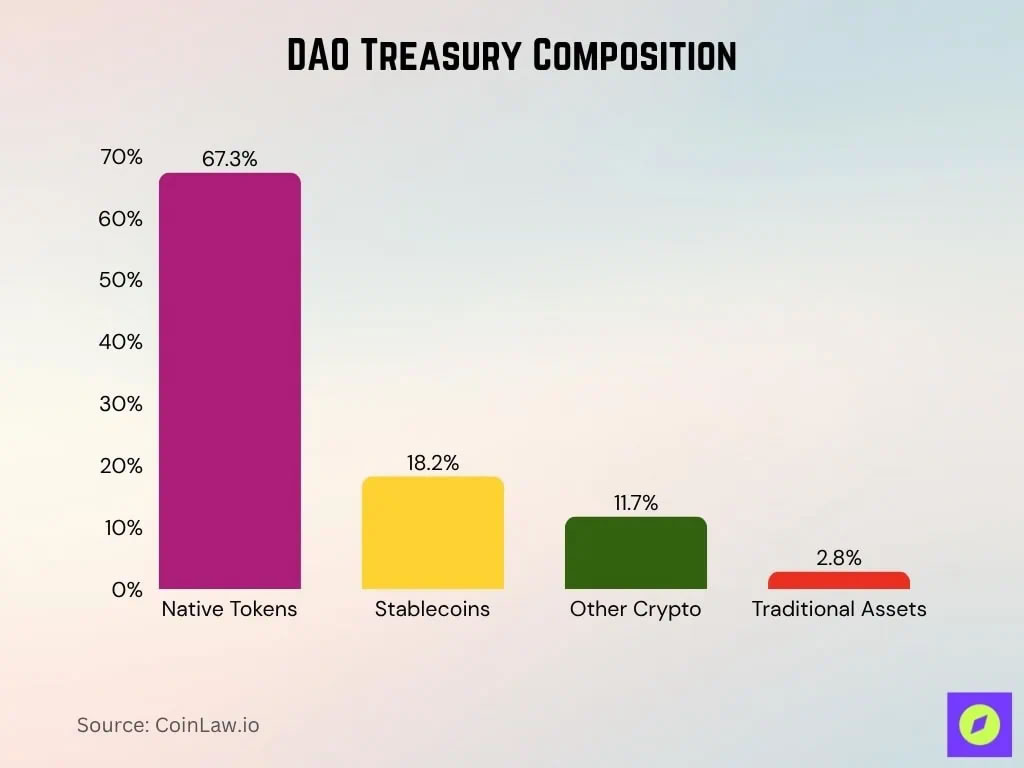
According to data from CoinLaw, there are over 13,000 DAOs across the globe, with roughly $24.5 billion worth of assets under their control. The key goal behind this framework is to offer clarity on how DAOs exist and operate within the legal system.
Alabama Governor Kay Ivey has now signed the bill into law, according to a16z Crypto’s head of policy and general counsel, Miles Jennings.
In a recent X post, Jennings said, “Decentralized governance is essential to crypto’s future—it’s one of the core constructs in market structure legislation.”
The bill will give decentralized communities “the certainty to build, govern, contract, and scale in the real world,” Jennings explained.
However, there are certain requirements that organizations must meet to qualify as a DAO. First, a DAO must have at least 100 members for a common nonprofit purpose, such as governing a blockchain network or smart contract system.
These entities can operate through blockchain technology and smart contracts, and voting, proposals, and consensus mechanisms can all be stored on-chain. Such entities will have full legal entity status, which means they can own property, enter into contracts, and sue or be sued.
This will offer individual members protection from personal liability in cases of disputes arising from DAO operations.
“As federal crypto market structure legislation moves closer to becoming law, builders need effective domestic legal structures,” Jennings said.
Back in 2024, Wyoming became the first state to grant legal status to DAOs under the DUNA Act.
Earlier this month, a similar DUNA bill was introduced in West Virginia by Representative Tristan Leavitt in February and is now awaiting the governor’s signature.

Key Takeaways
- An isolated testnet environment at Galaxy Digital was compromised by unauthorized access
- No client assets, personal information, or account data were exposed or endangered
- The financial impact was minimal, with losses under $10,000 in test-only funds
- Galaxy’s response team identified and contained the breach swiftly
- Trading operations and all client-facing services continued without disruption
Mike Novogratz’s Galaxy Digital has publicly acknowledged a recent cybersecurity incident that compromised one of its development environments. The breach targeted an isolated research and development workspace designed exclusively for testing purposes.
The firm immediately clarified that customer assets and sensitive data remained completely protected throughout the incident. Every trading platform and client service continued operating normally without any interruption.
The compromised system was a testnet infrastructure — a segregated digital environment where engineers experiment with new code and functionality away from live networks. This testing space operated entirely separate from Galaxy’s production systems and core technology infrastructure.
A source familiar with the situation revealed that the monetary damage amounted to less than $10,000. Galaxy characterized this sum as negligible, emphasizing that these funds existed solely for internal development and testing activities.
Galaxy reported that its security team identified the unauthorized entry point and acted rapidly to isolate the breach. The organization locked down the affected workspace and implemented enhanced security protocols throughout its blockchain-based infrastructure.
Understanding Testnet Environments
A testnet functions as a standalone, quarantined space where software developers validate updates and experiment with new capabilities. It replicates the framework of production systems while operating completely independently from actual user assets and information.
Despite being separated from live operations, testnets can still appeal to cybercriminals seeking to identify security vulnerabilities. While compromising such environments doesn’t directly endanger users, it may expose potential weaknesses in system architecture.
Galaxy maintains a diverse range of services including digital asset trading, investment management, lending platforms, custody solutions, cryptocurrency mining operations, staking services, and data infrastructure. The company primarily serves institutional investors while functioning as a connector between conventional financial markets and the digital asset ecosystem.
Ongoing Security Challenges in Cryptocurrency
Cybersecurity incidents and exploits remain an endemic challenge throughout the cryptocurrency space. The combination of publicly available code, substantial on-chain capital, and inconsistent security standards creates attractive opportunities for malicious actors.
According to industry analysts, annual losses from cryptocurrency-related hacks have consistently ranged between $1 billion and $2 billion in recent years. These incidents span everything from centralized exchange compromises to decentralized protocol exploits and sophisticated phishing campaigns.
Galaxy indicated that investigation into the incident continues. The company committed to sharing additional information when appropriate.
The firm has not disclosed specific details regarding the method of unauthorized entry or the particular vulnerability that was exploited during the attack.
Beyond the immediate containment measures and workspace security enhancements, Galaxy Digital has not announced any structural changes to its security personnel or broader infrastructure.
As of its official statement, Galaxy Digital confirmed that all client-facing platforms and services maintain complete security and operational integrity.


Former FTX head of engineering Nishad Singh has agreed to pay a $3.7 million fine to resolve his case with the US commodities regulator.
Summary
- Nishad Singh agreed to pay $3.7 million in disgorgement to settle CFTC charges tied to FTX’s collapse and misuse of customer funds.
- The settlement includes a five-year trading ban and an eight-year registration ban, with regulators citing his cooperation in limiting further penalties.
Singh will pay a disgorgement of $3.7 million as part of a supplemental consent order for his role in the collapse of FTX and the misappropriation of user funds, according to an April 1 statement from the U.S. Commodity Futures Trading Commission.
As part of the supplemental consent order, he has also been handed a five-year ban on trading in markets and an eight-year registration ban that blocks him from obtaining a license to operate within the sector.
CFTC enforcement director David Miller ruled out additional restitution or civil monetary penalties for now and said the current resolution reflects Singh’s cooperation with authorities.
“The defendant engaged in, and aided, significant violations of the Act and CFTC regulations as the former FTX head of engineering, and the consent orders reflect the severity of these violations,” Miller said.
A Bloomberg report noted that attorneys representing Singh said he was grateful the matter had been resolved and added that the regulator recognized his limited role in the underlying conduct.
Singh was accused of personally misappropriating millions of dollars in assets as part of FTX’s collapse. The commission charged the former executive with two counts of fraud by misappropriation and aiding and abetting fraud.
Subsequently, he entered into the consent order and agreed to cooperate with the commission’s investigators.
As previously reported by crypto.news, Singh was also spared from prison and received three years of supervised release.
In the meantime, FTX founder and former CEO Sam Bankman-Fried has filed a pro se motion seeking a new trial in his federal fraud case.
Bankman-Fried is currently serving a 25-year sentence on seven counts of fraud and conspiracy but has argued that key witness testimony was missing from his 2023 trial.
The US state of Alabama has become the second US jurisdiction after Wyoming to grant decentralized autonomous organizations (DAOs) legal status under the DUNA Act.
The Decentralized Unincorporated Nonprofit Association (DUNA) Act (Senate Bill 277) was introduced in February by Republican Senator Lance Bell. The House passed it 82-7 with 16 abstentions on March 17, and has now been signed by Alabama Governor Kay Ivey, according to a16z Crypto.
Speaking about the bill’s passage, a16z Crypto’s head of policy and general counsel, Miles Jennings, said on Wednesday that “decentralized governance is essential to crypto’s future — it’s one of the core constructs in market structure legislation.”
The bill provides legal status and limited liability protections to DAOs, solving a long-unresolved question in crypto: How DAOs exist from a legal standpoint in the real world.
It gives decentralized communities “the certainty to build, govern, contract, and scale in the real world,” added Jennings.
Full legal entity status for DAOs
To qualify, a DAO must have at least 100 members joined for a common nonprofit purpose, such as governing a blockchain network or smart contract system.
Governance can operate entirely through blockchain technology and smart contracts, and voting, proposals and consensus mechanisms can all be stored onchain.
These organizations will have full legal entity status, they can own property, sue and be sued, and enter into contracts, while individual members and administrators will be shielded from personal liability.
Related: Aave DAO backs V4 mainnet plan in near-unanimous vote
“As federal crypto market structure legislation moves closer to becoming law, builders need effective domestic legal structures,” added Jennings.
West Virginia DUNA Act awaits approval
A similar DUNA bill (HB 5060), introduced by Representative Tristan Leavitt in February, passed the House on March 4 and is awaiting the governor’s signature in West Virginia.
Wyoming’s DUNA Act was signed into law by Governor Mark Gordon in March 2024. The state approved the first legally recognized DAO in the United States in July 2021.
Over 13,000 DAOs exist worldwide with collective treasury assets under DAO control surpassing $24.5 billion as of 2025, according to CoinLaw. The average DAO treasury size is around $1.2 million, and Ethereum and its layer-2 networks host over 85% of DAOs, reported PatentPC in March.

European currencies have shown a recovery in recent trading sessions after their recent decline, displaying early signs of a reversal. The US dollar is weakening amid expectations surrounding upcoming US macroeconomic data, while market participants are reassessing their short-term positions and allowing for a deeper corrective move in the greenback. At the same time, the risk of renewed demand for the dollar remains in place should geopolitical tensions escalate further, a factor that is already being partly priced in.
Additional support for the euro and the Swiss franc has come from a reduced demand for the US dollar as a safe-haven asset. Earlier, geopolitical tensions had boosted demand for the dollar; however, recent comments from Donald Trump regarding the possibility of new strikes on Iran in the coming weeks have once again increased uncertainty and may revive interest in the dollar as a defensive asset.
Investors are also focused on upcoming US macroeconomic releases, including labour market and trade data. These figures may reveal early signs of economic cooling, potentially adding pressure on the dollar. At the same time, a combination of strong data and rising geopolitical risks could restore solid demand for the US currency and limit the current correction. Additional attention will also be given to data from Europe and Switzerland, where inflation and business activity indicators may influence expectations regarding central bank policies and reinforce the ongoing recovery in European currencies if the figures prove supportive.
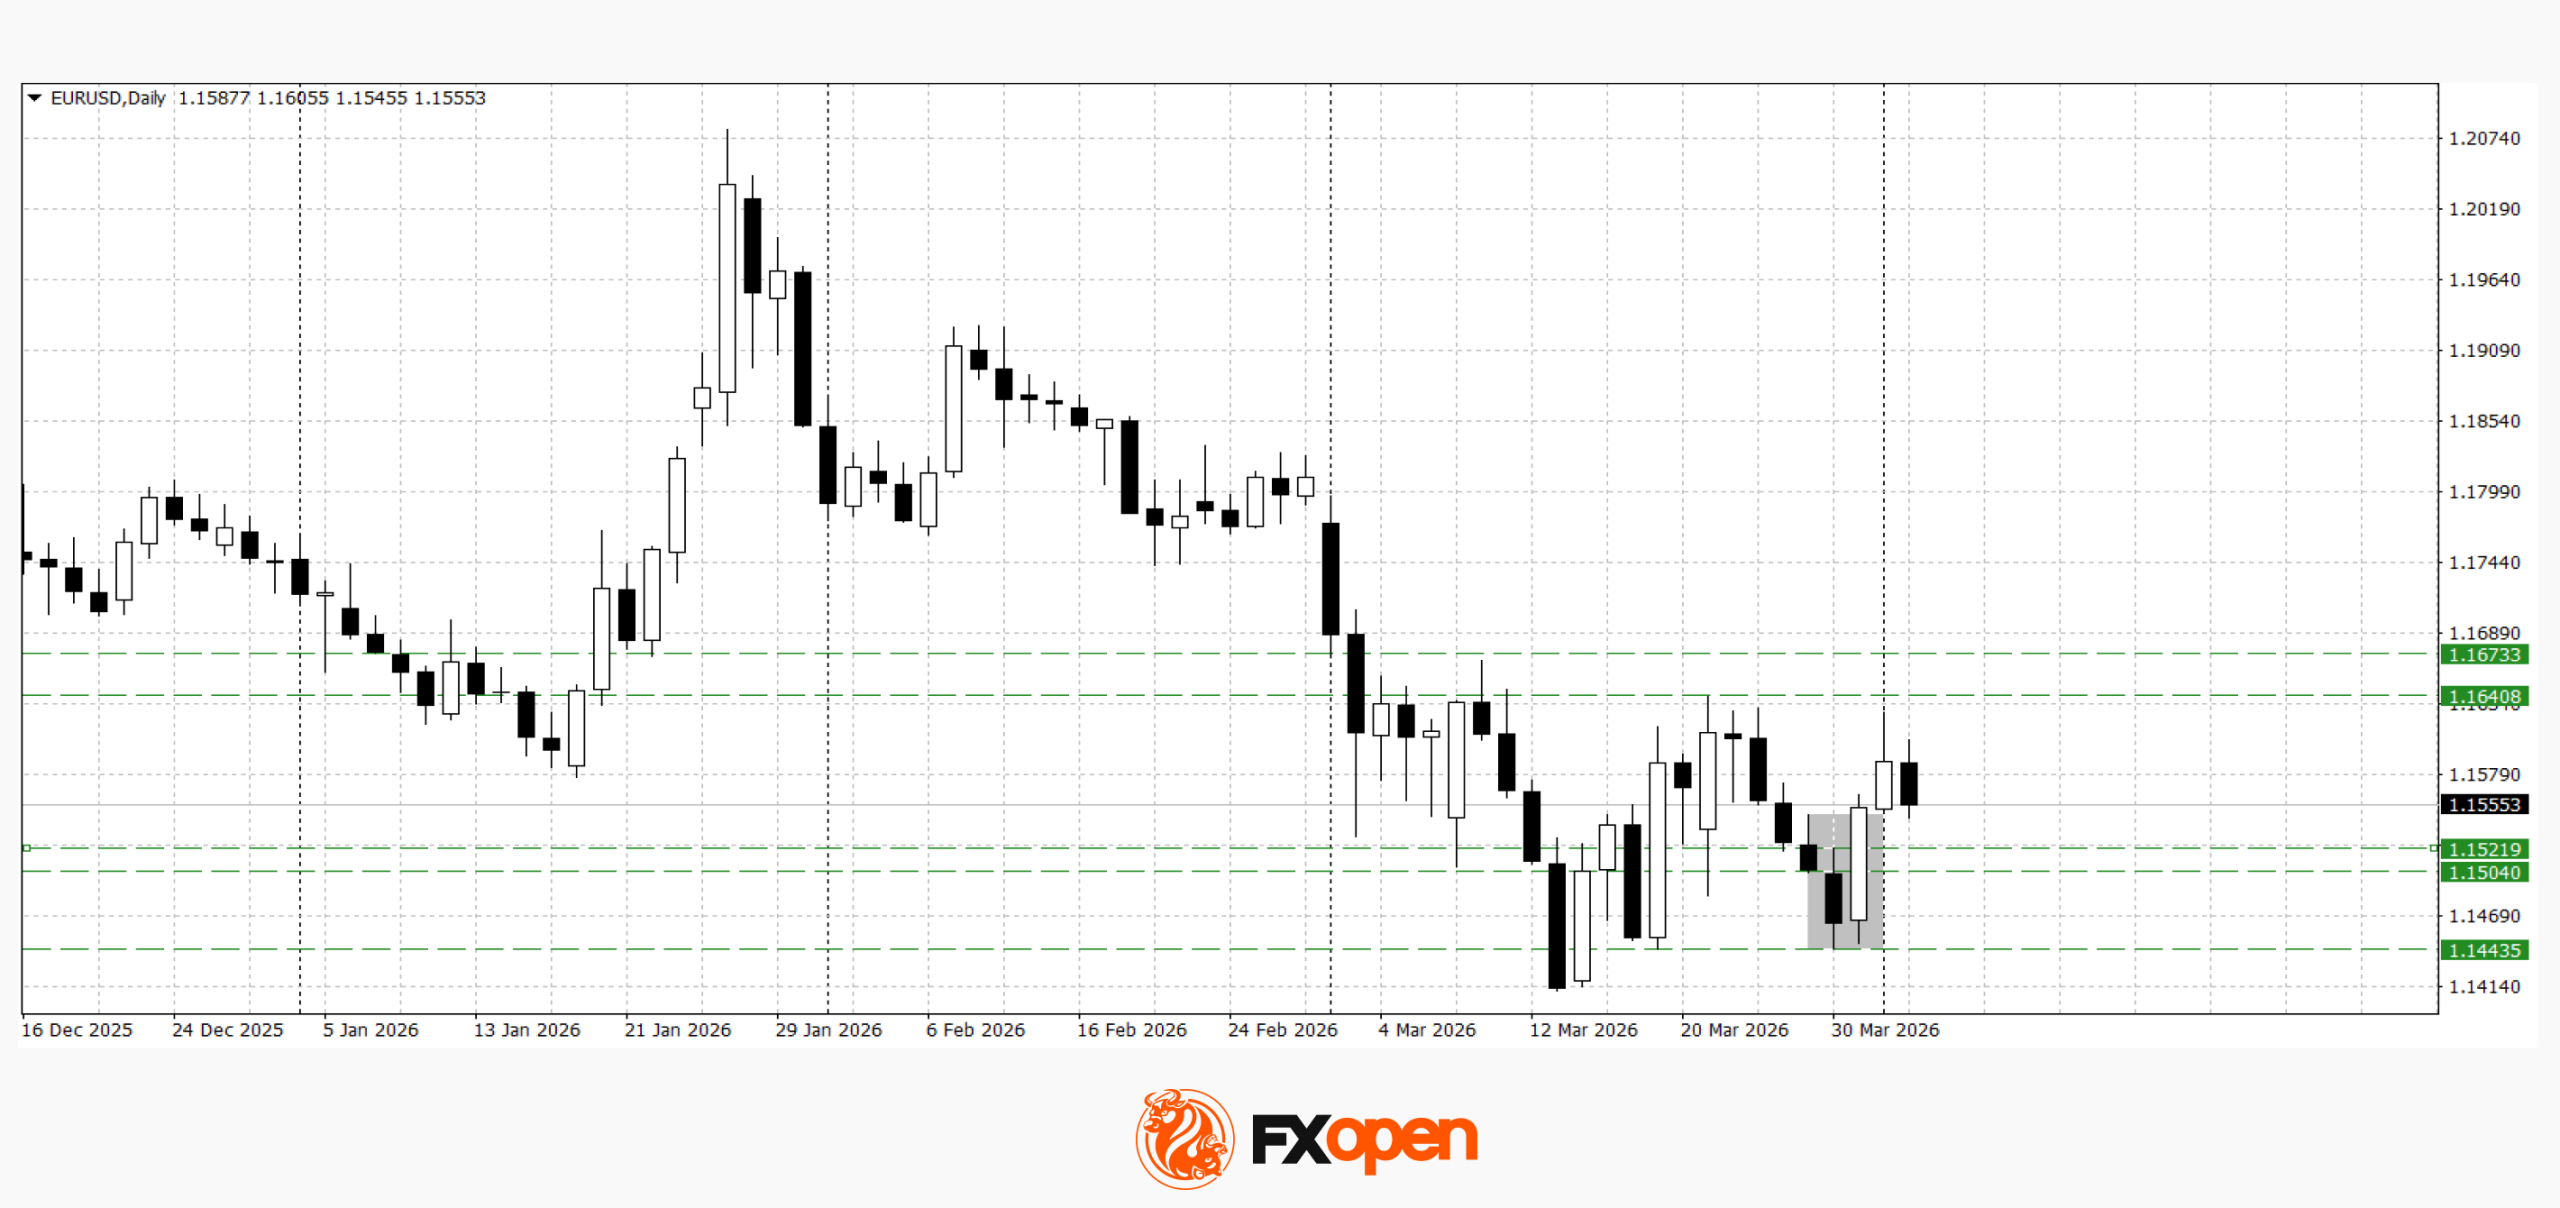
EUR/USD
The EUR/USD pair posted a solid rebound from local lows at the start of the week. Technical analysis suggests the pair may attempt another move towards 1.1640, as a “bullish engulfing” pattern has formed on the daily timeframe. However, if buyers fail to hold the price above the 1.1500–1.1520 range, a renewed downward move cannot be ruled out.
Key events for EUR/USD:
- today at 09:45 (GMT+3): France government budget balance
- today at 15:30 (GMT+3): US initial jobless claims
- today at 15:30 (GMT+3): US trade balance

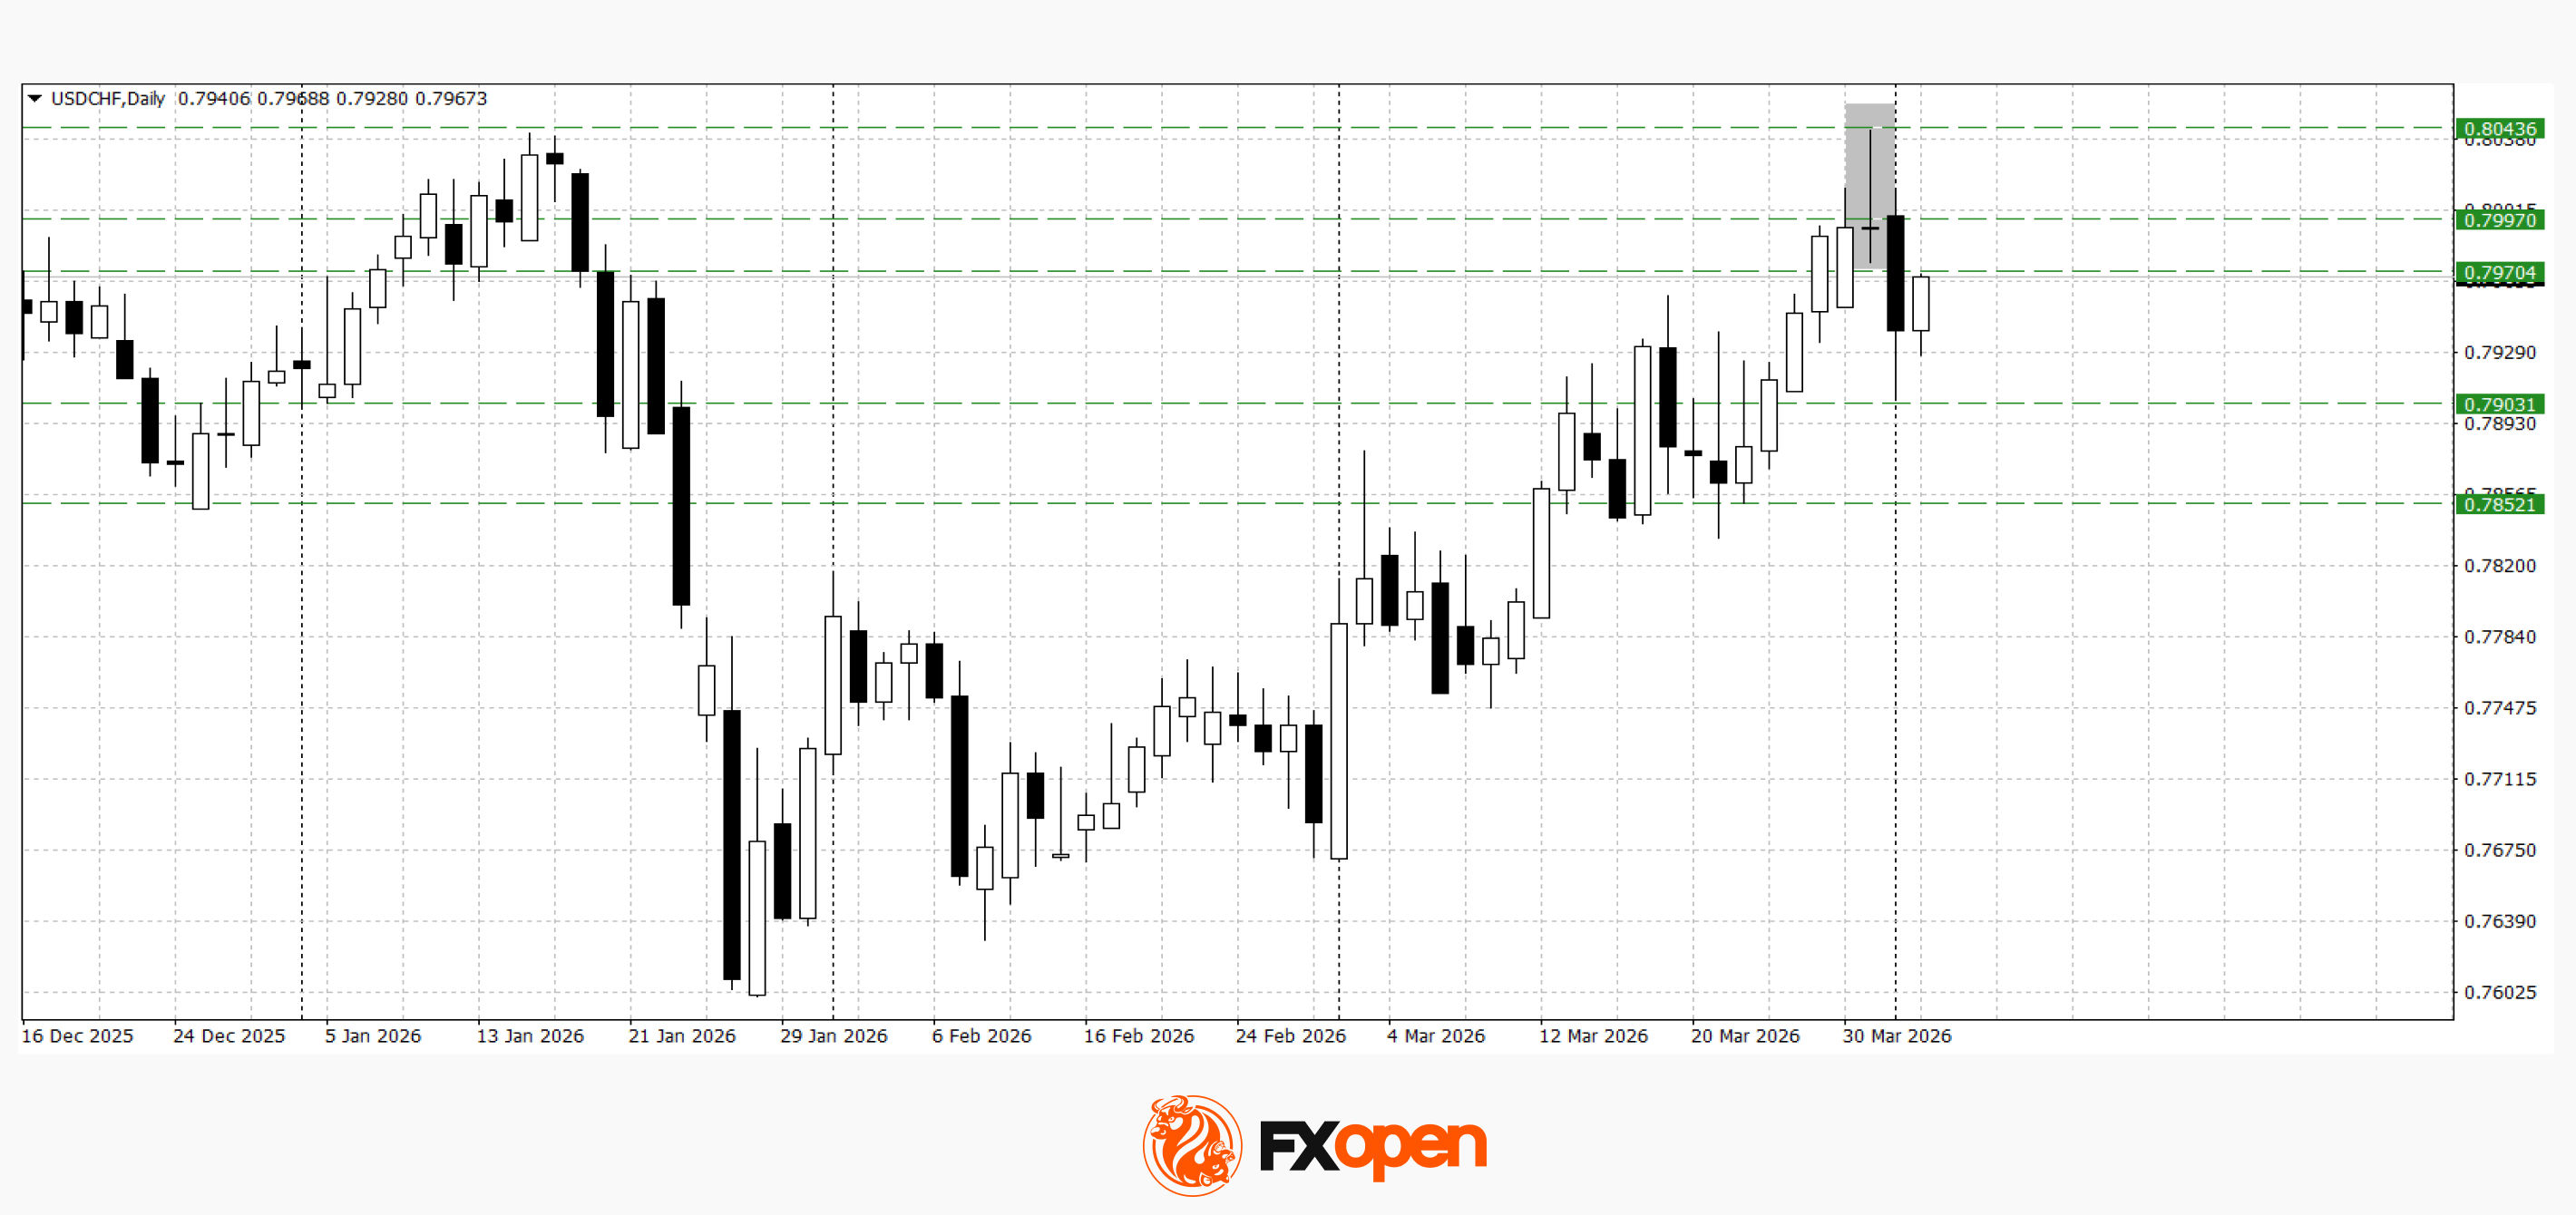
USD/CHF
The USD/CHF pair is also showing a pullback from yearly highs and attempting to develop a corrective move. On the daily timeframe, an “evening star” pattern has formed, which may point to a decline towards the 0.7850–0.7900 area. A sustained move above 0.8000 would invalidate the bearish correction scenario.
Key events for USD/CHF:
- today at 09:00 (GMT+3): Switzerland Consumer Price Index (CPI)
- today at 18:30 (GMT+3): Atlanta Fed GDPNow indicator
- today at 19:45 (GMT+3): speech by FOMC member Michelle Bowman
Overall, the market appears to be shifting from a one-sided strengthening of the US dollar towards a corrective phase. However, rising geopolitical uncertainty and upcoming macroeconomic releases continue to leave room for a renewed increase in demand for the US currency. Further direction will depend on incoming data and how investors respond to the evolving news backdrop.
Trade over 50 forex markets 24 hours a day with FXOpen. Take advantage of low commissions, deep liquidity, and spreads from 0.0 pips (additional fees may apply). Open your FXOpen account now or learn more about trading forex with FXOpen.
This article represents the opinion of the Companies operating under the FXOpen brand only. It is not to be construed as an offer, solicitation, or recommendation with respect to products and services provided by the Companies operating under the FXOpen brand, nor is it to be considered financial advice.
Crypto World
Crypto-native media lost 33% of traffic in 2025 as crypto became easier to follow without it
Disclosure: The views and opinions expressed here belong solely to the author and do not represent the views and opinions of crypto.news’ editorial.
Last year, traffic to crypto-native media fell even as activity across the crypto economy remained strong: stablecoin liquidity expanded, USDT transfer volume surged, and on-chain trading stayed active.
Rather than pointing to fading interest in crypto, the divergence suggested that people were increasingly following and using the industry through channels beyond specialist media.
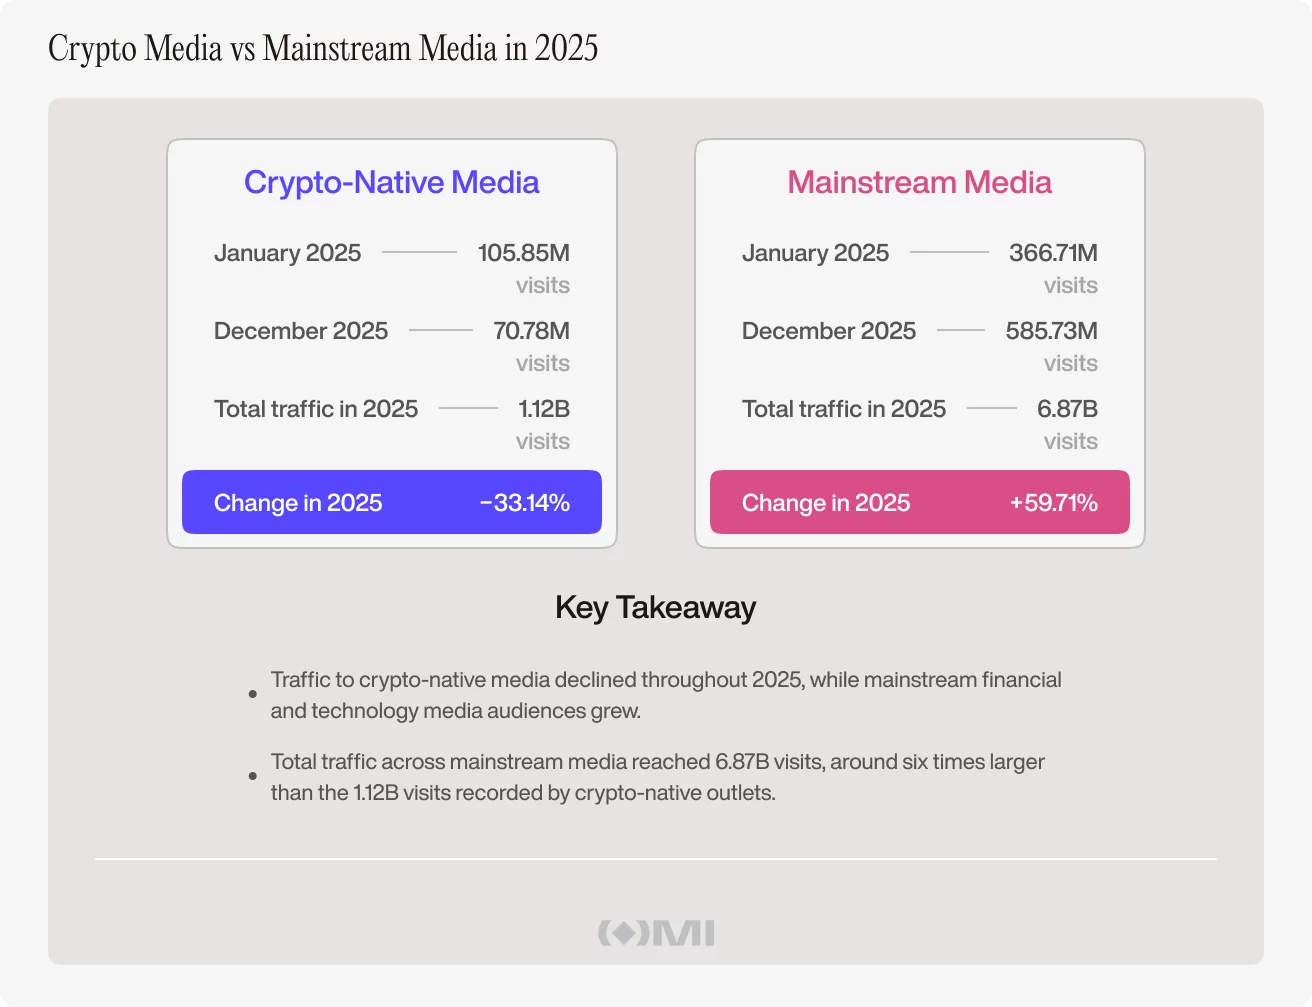
Our recent Outset Data Pulse report, built on traffic data from Outset Media Index, showed that across crypto-native outlets, global visits reached 1.12 billion in 2025, but monthly traffic moved steadily lower as the year progressed. It started at 105.85 million visits in January and ended at 70.78 million in December.
There were temporary rebounds, including a notable jump in July, but not enough to change the broader trend. By the fourth quarter, crypto-native traffic was sitting at its weakest levels of the year.
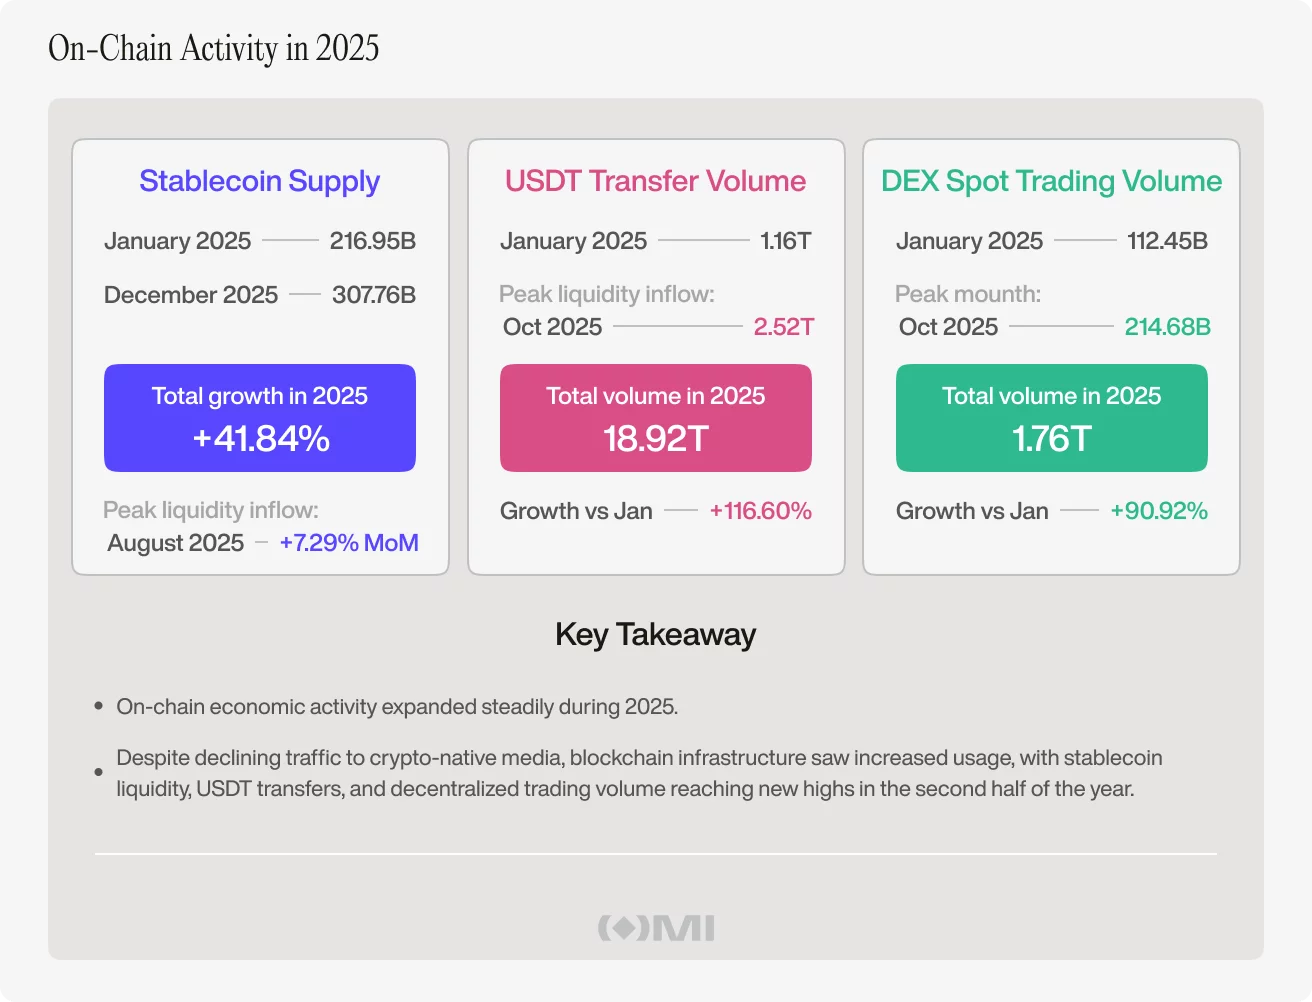
On-chain growth continued even as media traffic fell
While media traffic declined, there was an expansion of the on-chain economy. Stablecoin supply, one of the cleanest ways of tracking liquidity inside crypto, rose from $216.95 billion in January to $307.76 billion by December.
That disconnect became clearer in the underlying market data. Tether’s USDT transfer volume, a common proxy for how much value is moving across blockchain networks, soared in the second half and reached $18.92 trillion for all of 2025.

Decentralized exchange spot volume also climbed to $1.76 trillion and hit its yearly peak in October, showing that trading activity on-chain remained strong. Taken together, the data pointed to three things rising at once: more liquidity in the system, more money moving through it, and more trading happening directly on-chain.
Taken together, this was an active market, not a shrinking one. In other words, crypto-native media traffic fell when money, settlement activity, and trading continued to move through the crypto ecosystem at scale.
Crypto became easier to follow outside crypto media
Financial technology and general news outlets that include crypto in their coverage generated 6.91 billion visits in 2025. Their traffic also grew sharply during the year, rising from 366.71 million visits in January to 585.73 million in December. That alone suggests crypto lives inside a wider media environment than it once did.
Naturally, it is wrong to assume every mainstream visit was for a crypto story. But it does mean crypto no longer needs its own niche ecosystem in the same way it once did.
A few years ago, specialist crypto publications served as the default entry point into the industry. Articles explained the basics, simplified complex developments, and tracked market sentiment. They helped readers figure out what mattered most. Anyone who wanted to keep up with the sector would typically check out a crypto-native outlet first.
That competitive advantage has weakened, not because crypto got less important, but because crypto got easier to interact with elsewhere.
Today, a reader can follow crypto developments through mainstream finance coverage, follow their favourite projects and individuals on X, watch podcasts and interviews on YouTube, interact with fellow enthusiasts on Telegram, and more.
Crypto participation no longer depends on crypto media traffic
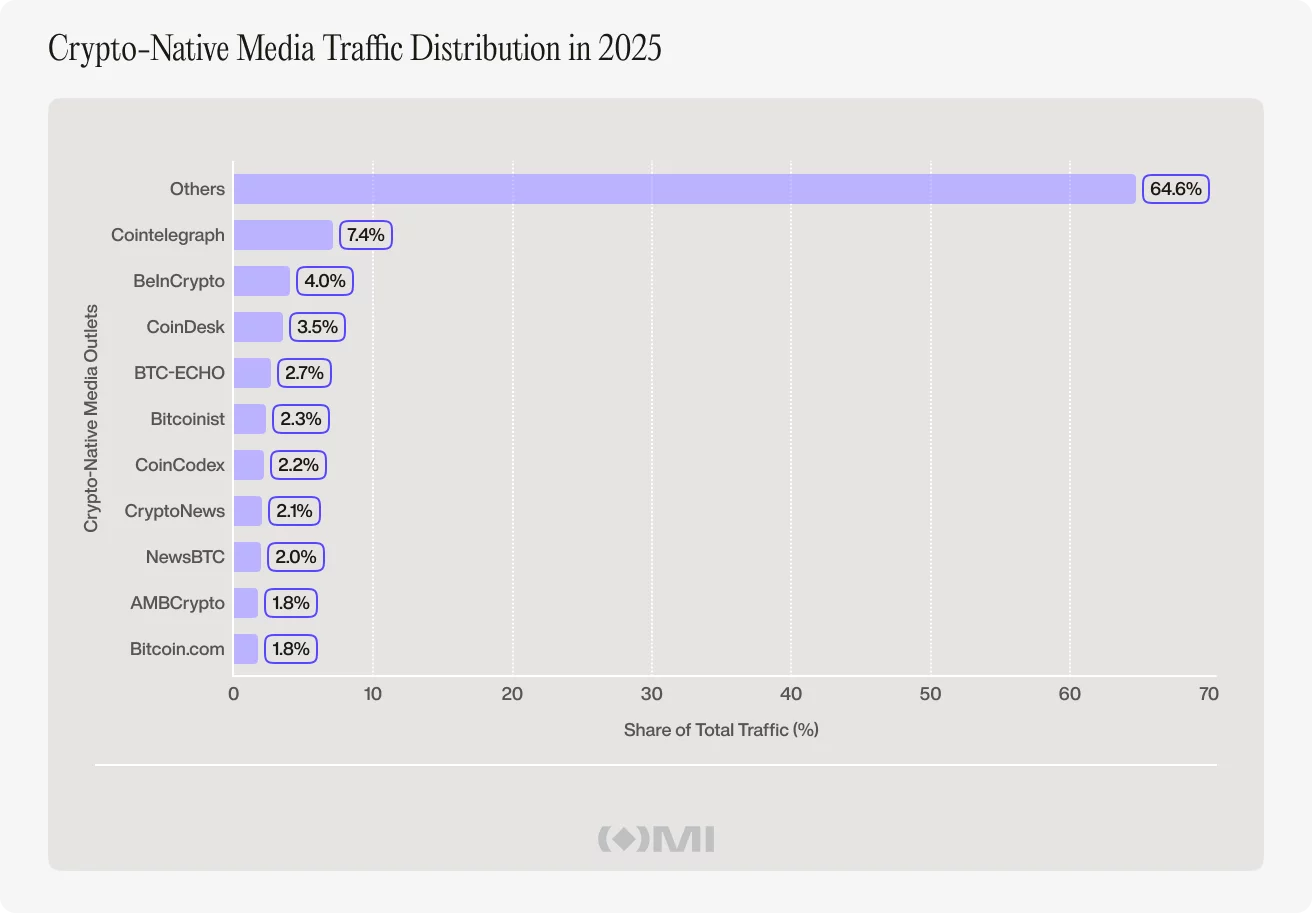
What this means is crypto-native outlets no longer have the monopoly on attention they once enjoyed. The structure of crypto media itself also matters. The top ten crypto-native outlets accounted for just a quarter of total traffic in 2025, with smaller publications making up the rest.
It is a crowded and decentralized landscape where no single player dominates and attention is dispersed across a large number of brands. That fragmentation made sense when crypto media was the centre of the industry’s information flow.
But now it exists alongside far more competition than just other crypto sites. It competes with finance media, tech media, creators, aggregators, trading interfaces, and the networks themselves.
Just as importantly, crypto-native media traffic and blockchain activity did not move together in any clean way. The analysis did not find a consistent one-month lead or lag relationship between the two. Rising on-chain activity did not reliably follow rising media traffic. Nor did rising media traffic reliably predict stronger blockchain usage in the following month.
That suggests crypto media traffic is not a proxy for crypto participation. Traffic is an important metric. But mainstream outlets cover many subjects beyond digital currencies and assets. Their overall audiences are not the same thing as crypto readership.
Monthly data can also miss shorter attention surges that happen over hours or days. But even with that, the divergence is hard to ignore. Crypto-native traffic fell while the broader crypto economy grew.
Crypto-native media still matters, but its role is changing
Crypto-native media has not lost its value but its place in the ecosystem is definitely becoming different. As crypto gets easier to discover, talk about, and use through mainstream platforms, social media, and on-chain apps, specialist outlets matter less as the first stop and more as the place people go when they want to understand what is actually going on.
That change says something bigger about crypto too. If the industry can keep growing while specialist media traffic falls, then attention is no longer the main thing holding it up. Crypto-native media still matters – just in a different way now. Less as the centre of the market, and more as the place that helps make sense of it once the noise settles.
Disclosure: This content is provided by a third party. Neither crypto.news nor the author of this article endorses any product mentioned on this page. Users should conduct their own research before taking any action related to the company.


Ripple on Thursday introduced native digital asset capabilities inside its enterprise treasury management system, letting corporate finance teams hold, view and manage XRP and RLUSD alongside traditional fiat balances for the first time within a single platform.
The two features, called Digital Asset Accounts and Unified Treasury, are built on GTreasury, which Ripple acquired in 2025. That system processed $13 trillion in payments volume last year for clients ranging from small businesses to Fortune 500 companies. The digital asset layer adds to that existing infrastructure rather than replacing it.
Digital Asset Accounts let treasury teams create a Ripple-native digital asset account inside the platform. Balances in XRP, RLUSD, and other supported tokens appear alongside cash positions with real-time fiat valuations using live exchange rates.
Transactions are recorded automatically with native notional amounts, fiat equivalents, and market price at the time of each event, creating an audit trail without manual entry. The system captures balances at 15-decimal precision to match on-chain accuracy and eliminate rounding discrepancies that cause reconciliation problems.
Unified Treasury connects digital asset holdings from multiple external custodians through the same API connectivity layer Ripple Treasury already uses for bank integrations.
“Digital assets have arrived at the CFO’s desk, and the question has shifted from whether to engage to how to do so without disrupting existing operations,” said Renaat Ver Eecke, SVP at Ripple Treasury.
The launch positions Ripple Treasury ahead of competing TMS providers, none of which currently offer native digital asset management.
Ripple said the two features are the first in a broader digital asset framework that will expand to cross-border settlement, intercompany payments, and overnight yield on idle cash through repo markets, all powered by stablecoins.


A key figure allegedly behind the Huione network has been extradited to China, where he will face fraud and money laundering charges.
Summary
- Li Xiong, linked to the Huione network, has been extradited from Cambodia to China to face fraud and money laundering charges.
- Authorities have tied Huione Group to a vast illicit marketplace that processed over $89 billion in crypto tied to scam operations across Asia.
- Despite U.S. enforcement actions, including FinCEN restrictions, the network has continued operating through new domains and active Telegram channels.
A report from Hong Kong-based news outlet Ta Kung Wen Wei noted that Li Xiong, who was part of a group that helped scam rings in Asia launder illicit funds, was escorted back to China from Phnom Penh, Cambodia, citing a statement from China’s Ministry of Public Security on WeChat.
Xiong was a core member of the Chen Zhi criminal syndicate, according to the report, and had previously served as chairman of Huione Group, a network that supported scam centers carrying out “pig butchering” schemes and other investment frauds to extract funds from victims across the globe.
For those unfamiliar, the Huione network has been linked to one of the largest illicit online marketplaces in operation, processing more than $89 billion in cryptoassets.
Xiong’s arrest and extradition come just months after the detention of Chen Zhi, the head of Prince Group, which operated Huione Group. The U.S. Department of Justice had earlier seized over 127,000 Bitcoin tied to Zhi’s operations.
The report added that several other members of Zhi’s criminal syndicate have also been apprehended, according to statements from Chinese public officials.
Efforts to cut off Huione’s financial network have been underway in the U.S. over the past few years.
Last year, the U.S. Department of the Treasury’s Financial Crimes Enforcement Network labelled the group a primary money laundering concern and subsequently directed financial institutions to cut off access linked to its operations.
However, third-party reports suggest that the network has resurfaced under new domains and continues to operate across platforms such as Telegram, maintaining activity despite enforcement pressure.


The crypto market has started tanking once again, dropping 2.6% to 2.37 trillion as US President Donald Trump announced that the U.S. campaign against Iran would be entering a final phase over the coming weeks to end the conflict once and for all.
Summary
- Crypto market fell 2.6% to $2.37 trillion as escalating U.S.–Iran tensions triggered risk-off sentiment across global markets.
- Rising oil prices above $100 fueled inflation fears, reducing expectations of Fed rate cuts and adding pressure on risk assets.
Bitcoin (BTC), the world’s largest crypto asset, fell over 4% to $66,250 amid souring market sentiment over a potential drop to $65,000, which many consider the last line of defense for a potential recovery.
Ethereum (ETH) was down 3.4%, approaching the $2,000 support, while other major crypto assets such as XRP (XRP), BNB (BNB), Solana (SOL), and Dogecoin (DOGE) posted losses between 2% and 6%. The majority of the top 100 crypto assets also shared the downward trend in the red.
As crypto prices fell, they triggered over $420 million in liquidations across leveraged markets as traders unwind their positions. The majority of this tally came from long liquidations, which saw $255 million wiped out, with Bitcoin and Ethereum accounting for around $64 million in long liquidations each, which accelerated the selloff.
The Crypto Fear and Greed Index, which shows market psychology, fell by 5 points to 27, showing increasing fear and anxiety in the market as investors expect more volatility.
Crypto prices began slipping downwards shortly after Trump said in an address to the nation on Wednesday that the U.S. military is going to hit Iran extremely hard over the coming 2 to 3 weeks to try to secure a decisive win in the ongoing war in the Middle East.
Trump warned that the U.S. would target Iranian energy infrastructures if no deal is reached. He also urged Gulf countries like Saudi Arabia, the UAE, and his allies in the region to pressure Tehran to relinquish control over the Strait of Hormuz.
Despite the rhetoric, Trump mentioned that discussions are ongoing for a ceasefire between both sides. Iran, for its part, has demanded a permanent end to the war, compensation for damages during the war, and the full withdrawal of U.S. military presence from the region.
The fresh threat of escalation pushed crude oil prices back above $100, leading to a broad selloff through crypto, stocks, and traditional safe-haven assets such as gold. Gold prices fell 4% to $4,590 today, while silver fell 7.5%. Asian stocks such as Japan’s Nikkei 225 were down 2.5% as investors moved to cash.
Surging oil prices are triggering fears of runaway inflation over the coming months. As such, the market expects the Federal Reserve to continue to hold interest rates steady or even hike them as they combat the inflation spike caused by oil prices.
Lower expectations for Fed rate cuts typically weigh heavily on risk assets like cryptocurrency.
Disclosure: This article does not represent investment advice. The content and materials featured on this page are for educational purposes only.

XRP CLARITY ACT WHAT NOW !!!? RIPPLE TO AQUIRE CIRCLE NOW !!!? XRP CRYPTO TAXONOMY !!!!
‘Manchester United need the training’ Armagh star dismisses training camp row

Soaring Fuel Prices Threaten Livelihoods of Thailand’s Rice Farmers


-

 Business7 days ago
Instagram, YouTube Found Responsible for Teen’s Mental Health Struggle in Historic Ruling
-

 NewsBeat5 days ago
The Story hosts event on Durham’s historic registers
-
 Tech7 days ago
Intercom’s new post-trained Fin Apex 1.0 beats GPT-5.4 and Claude Sonnet 4.6 at customer service resolutions
-

 Sports5 days ago
Sweet Sixteen Game Thread: Tide vs Michigan
-
Entertainment3 days ago
Fans slam 'heartbreaking' Barbie Dream Fest convention debacle with 'cardboard cutout' experience
-
 Entertainment4 days ago
Lana Del Rey Celebrates Her Husband’s 51st Birthday In New Post
-
Crypto World2 days ago
Dems press CFTC, ethics board on prediction-market insider trades
-

 Crypto World11 hours ago
Gold Price Prediction: Worst Month in 17 Years fo Save Haven Rock
-

 Tech3 days ago
The Pixel 10a doesn’t have a camera bump, and it’s great
-

 Sports2 days ago
Tallest college basketball player ever, standing at 7-foot-9, entering transfer portal
-

 Tech2 days ago
EE TV is using AI to help you find something to watch
-

 Tech3 days ago
Apple will hide your email address from apps and websites, but not cops
-

 Tech2 days ago
Flipsnack and the shift toward motion-first business content with living visuals
-

 Tech2 days ago
How to back up your iPhone & iPad to your Mac before something goes wrong
-

 Fashion7 days ago
En Vogue in Brown Leather and Tailored Neutrals by Atelier Savoir, Styled by J Bolin
-

 Politics3 days ago
Should Trump Be Scared Strait?
-

 Crypto World2 days ago
U.S. rule change may open trillions in 401(k) funds to crypto
-

 Fashion7 days ago
What Are Your Favorite T-Shirts for the Weekend?
-

 Fashion6 days ago
Weekly News Update, 3.27.26 – Corporette.com
-
Crypto World3 days ago
Bitcoin’s Six-Month Losing Streak: What On-Chain Data Says About the Market’s Next Move
You must be logged in to post a comment Login