
Crypto World
Ethereum Price Bottom In? $18 Billion Whale Buying Reveals More
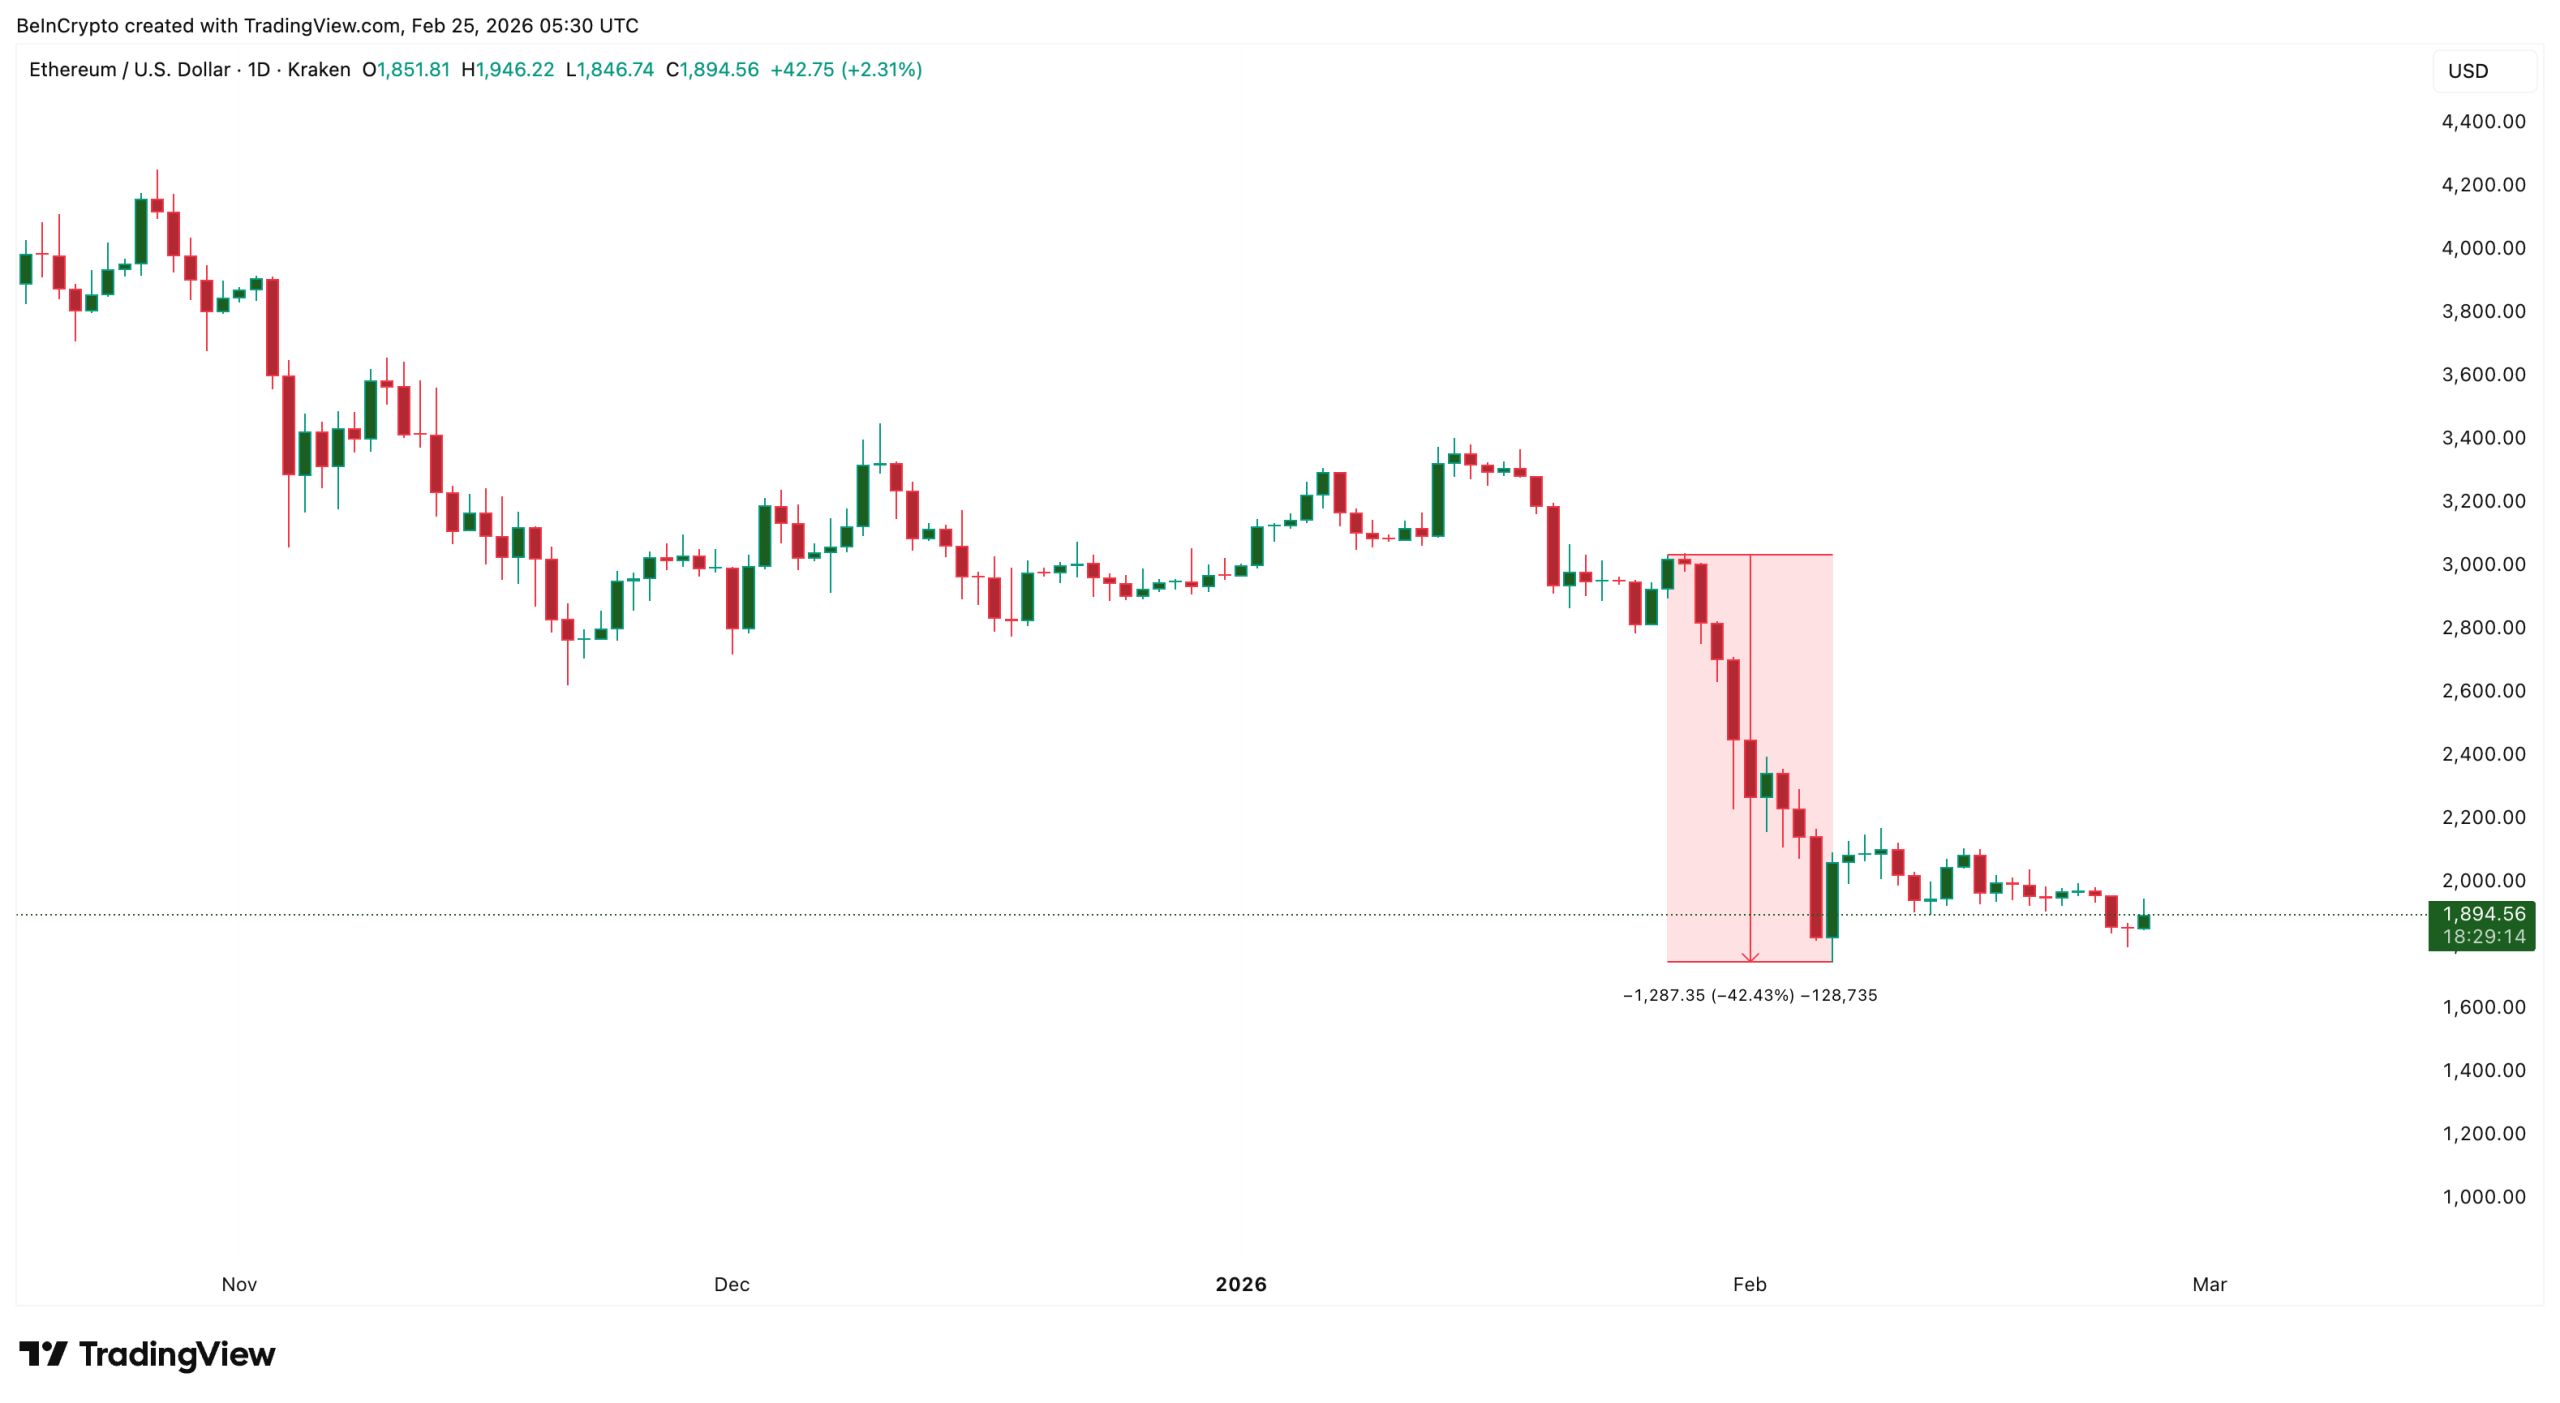
Ethereum price is up about 3.4% in the past 24 hours, continuing a rebound signal that first appeared on technical charts yesterday.
But this recovery may be more than a simple bounce. A deeper look shows a quiet positioning shift that many traders might have missed. Ethereum whales have been aggressively accumulating during the recent crash, even as leverage collapsed and fear dominated the market.
Ethereum Whales Added 9 Million ETH Even as Price Crashed and Leverage Collapsed
Ethereum’s recent crash wiped out both price and leverage. Between January 27 and February 6, the Ethereum price fell about 43%. During the same period, total open interest fell from $15.9 billion and is currently holding around $8.73 billion. Open interest measures total leveraged futures positions, so this $7.17 billion drop confirms a massive leverage flush.

Want more token insights like this? Sign up for Editor Harsh Notariya’s Daily Crypto Newsletter here.
A leverage flush happens when leveraged traders are forced out of positions, usually during sharp price drops. This removes speculative pressure from the market.
But while traders were force exiting, whales were doing the opposite.
Large Ethereum holders increased their holdings from 104.48 million ETH on January 27 to 113.39 million ETH now, barring a few smaller dumps in between. This means whales net added 8.91 million ETH during the crash. At an estimated average price near $2,100 during this period, that equals roughly $18.7 billion worth of accumulation.
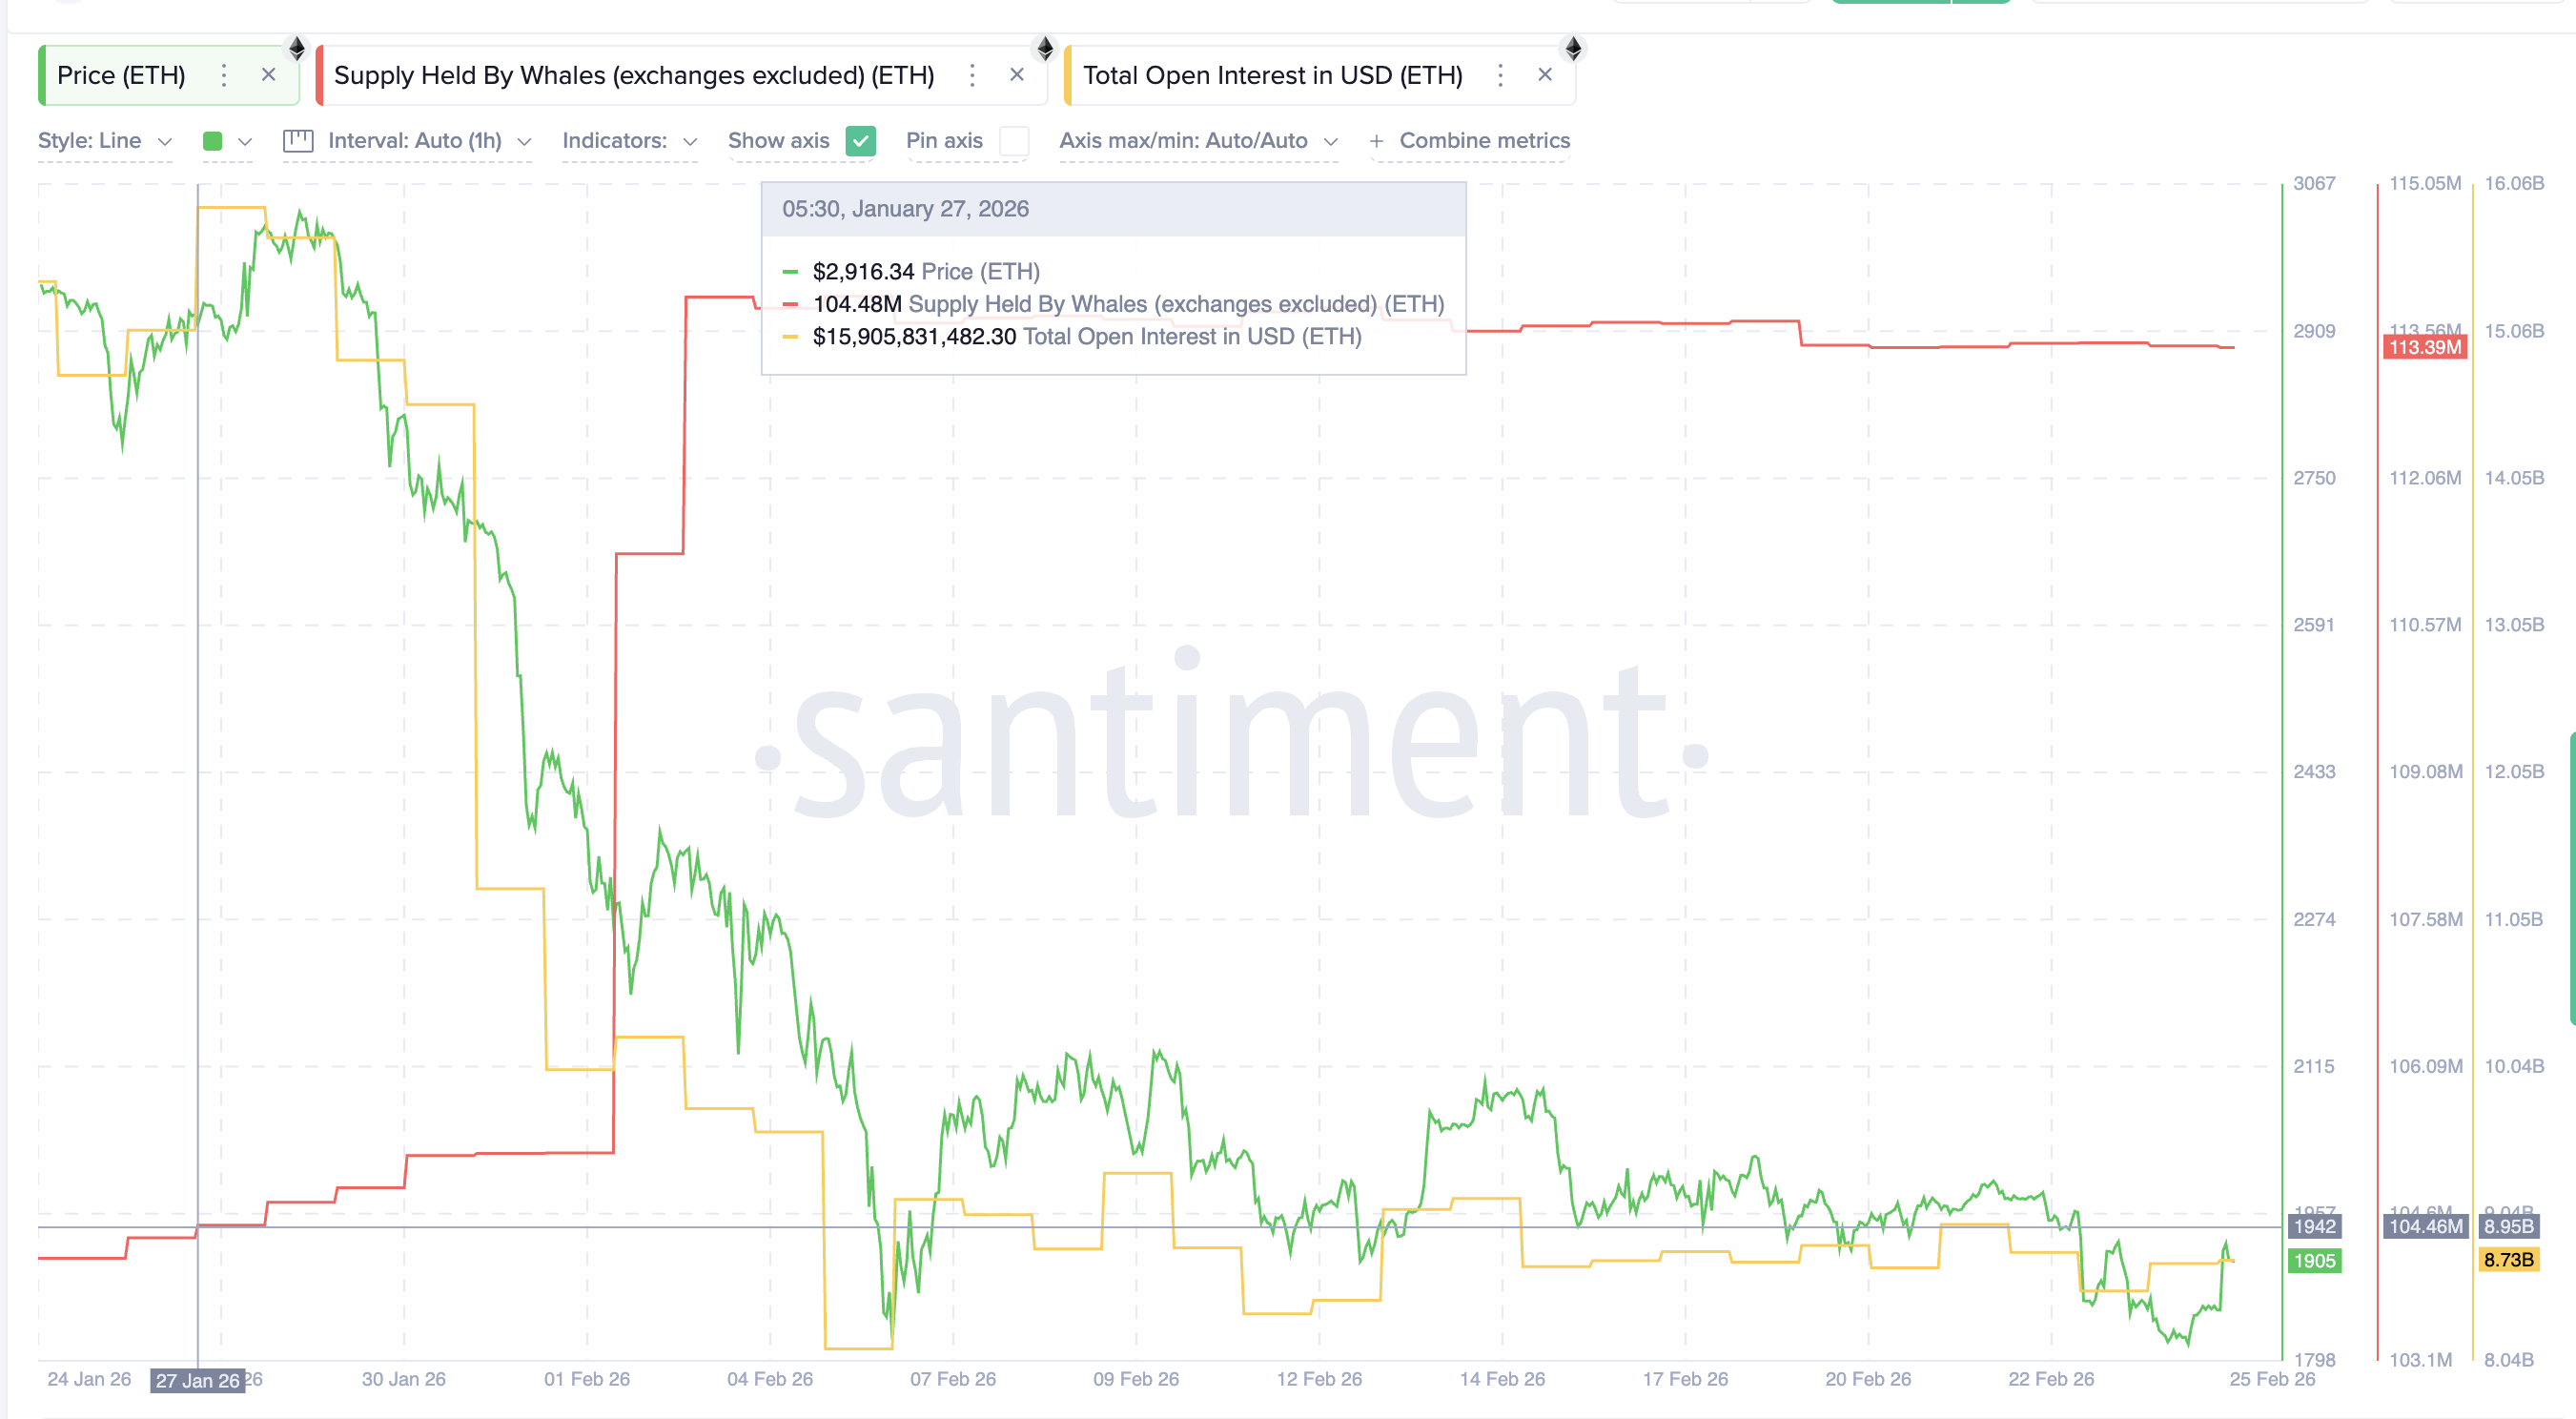
This shows whales were not panic-selling. Instead, they were absorbing supply during forced liquidations. This type of behavior usually signals long-term positioning rather than short-term trading.
Long-Term Holders and Exchange Flows Now Align With Whale Accumulation
Whales alone do not confirm a structural shift. Long-term ETH holders must also show conviction.
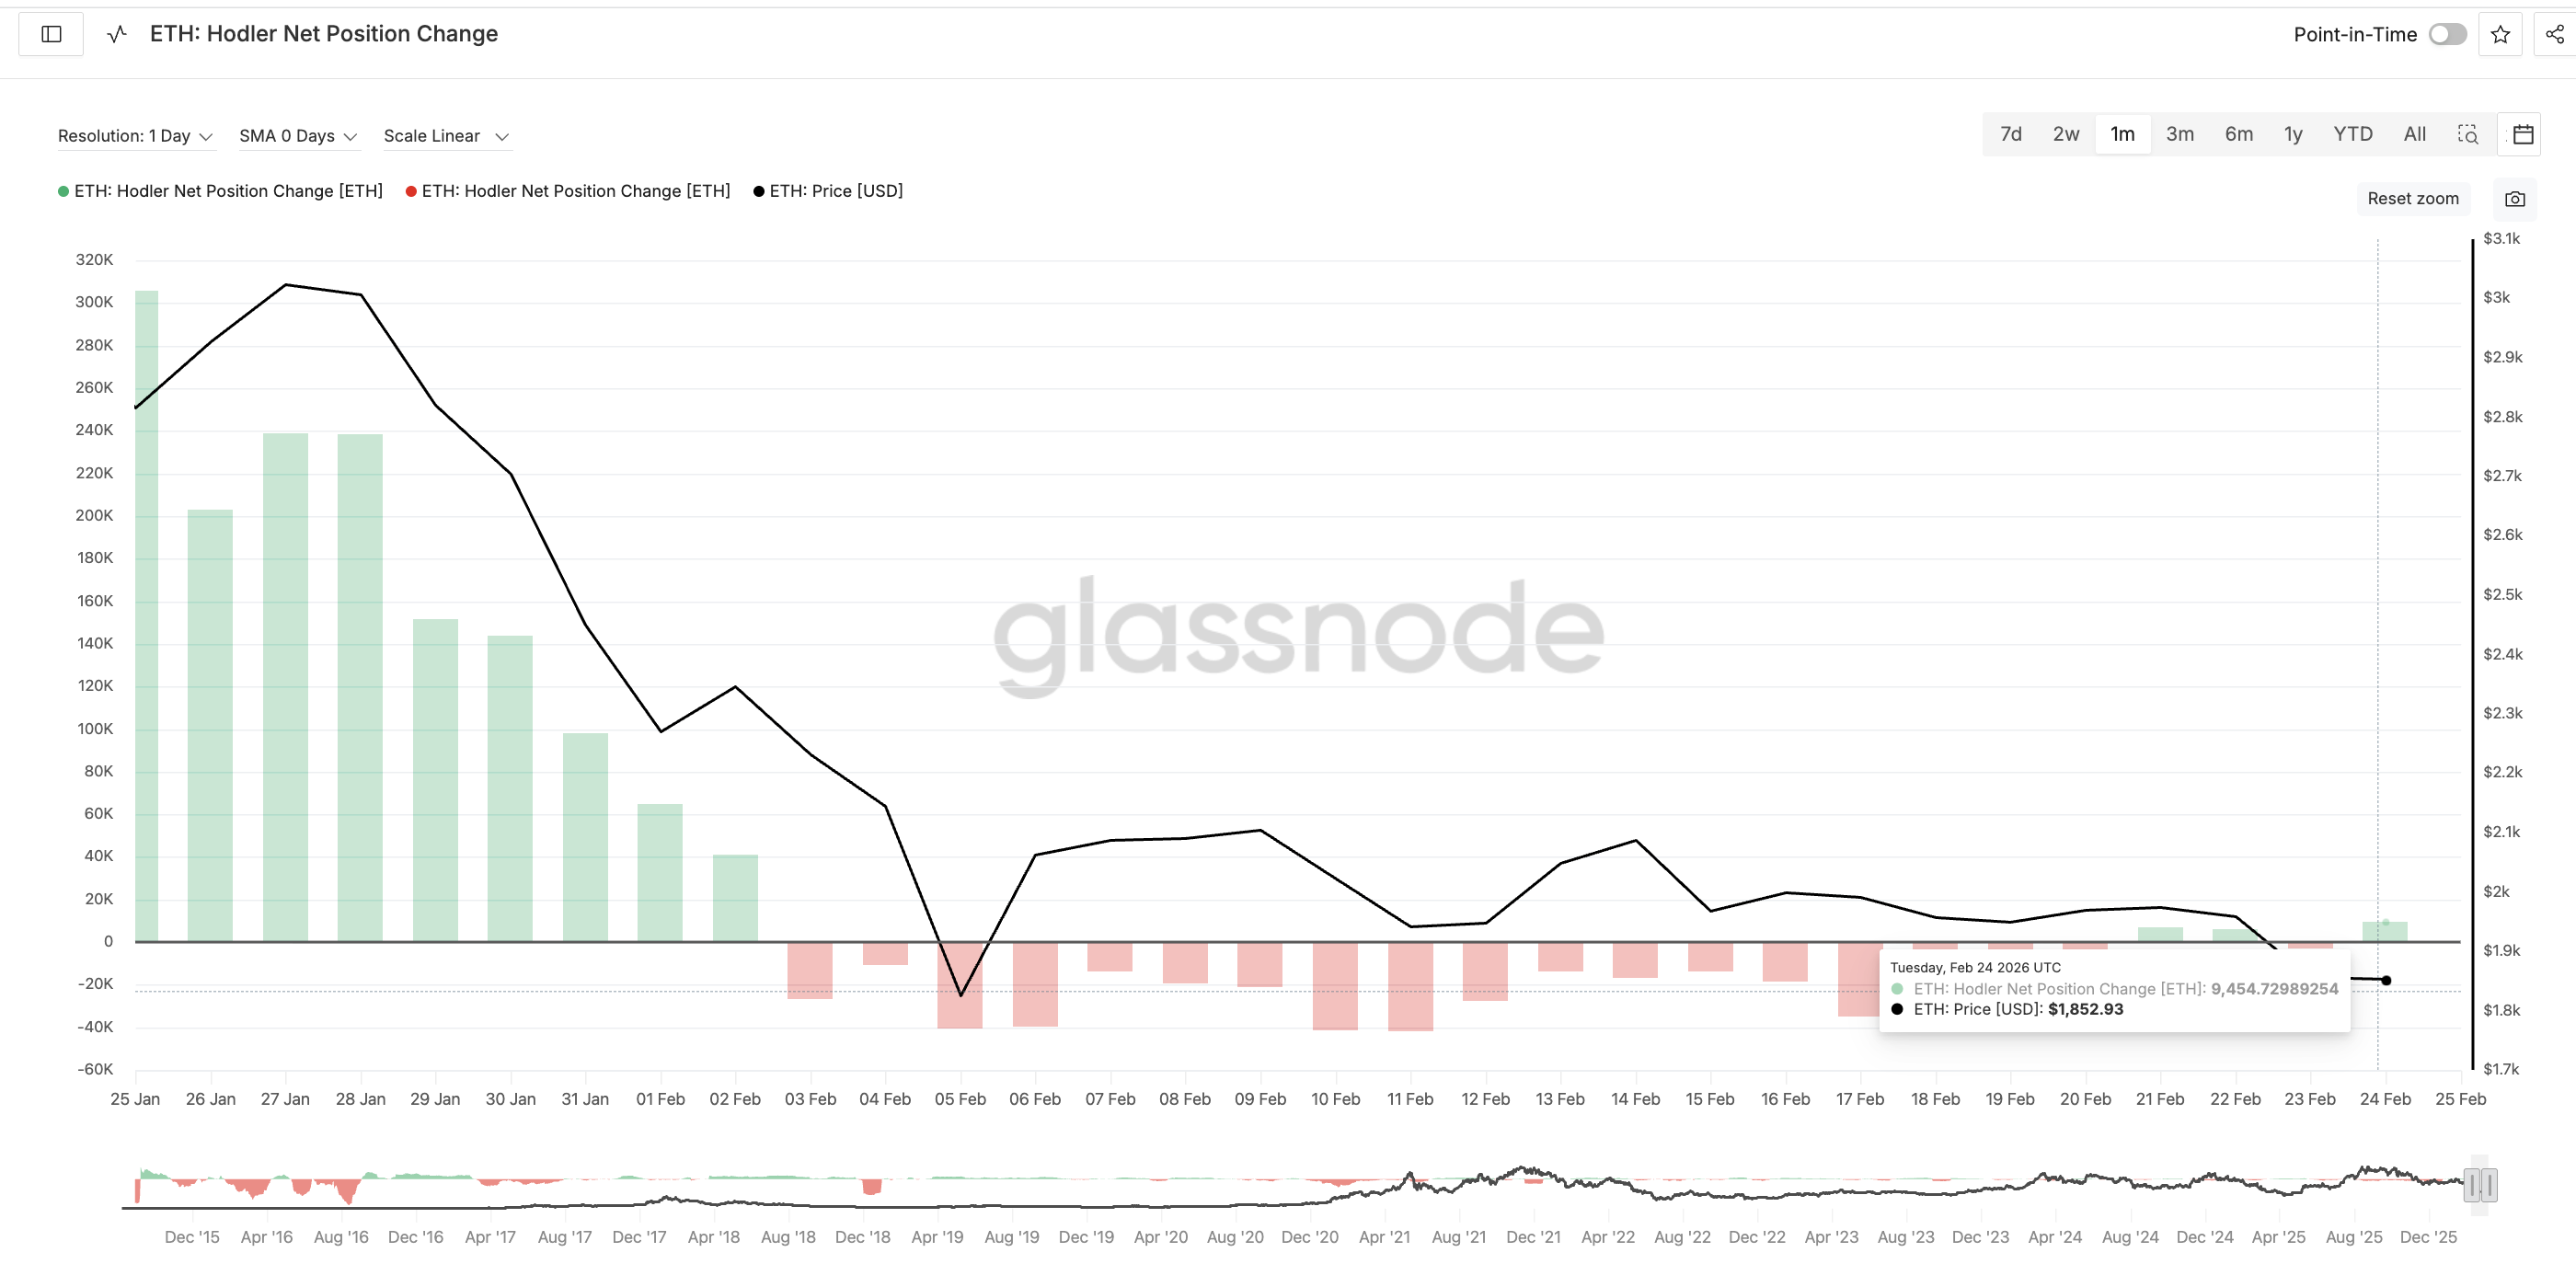
Initially, long-term holders showed uncertainty. The HODLer Net Position Change metric stayed negative through most of early February, showing selling pressure even among experienced investors. The price dip seems to have scared them off eventually,
But this behavior has recently changed.
On February 21, long-term holders began accumulating again. By February 24, they added 9,454 ETH in a single day. This shift suggests long-term investors are starting to align with whale accumulation after weeks of hesitation. Exchange flow data adds another important layer.
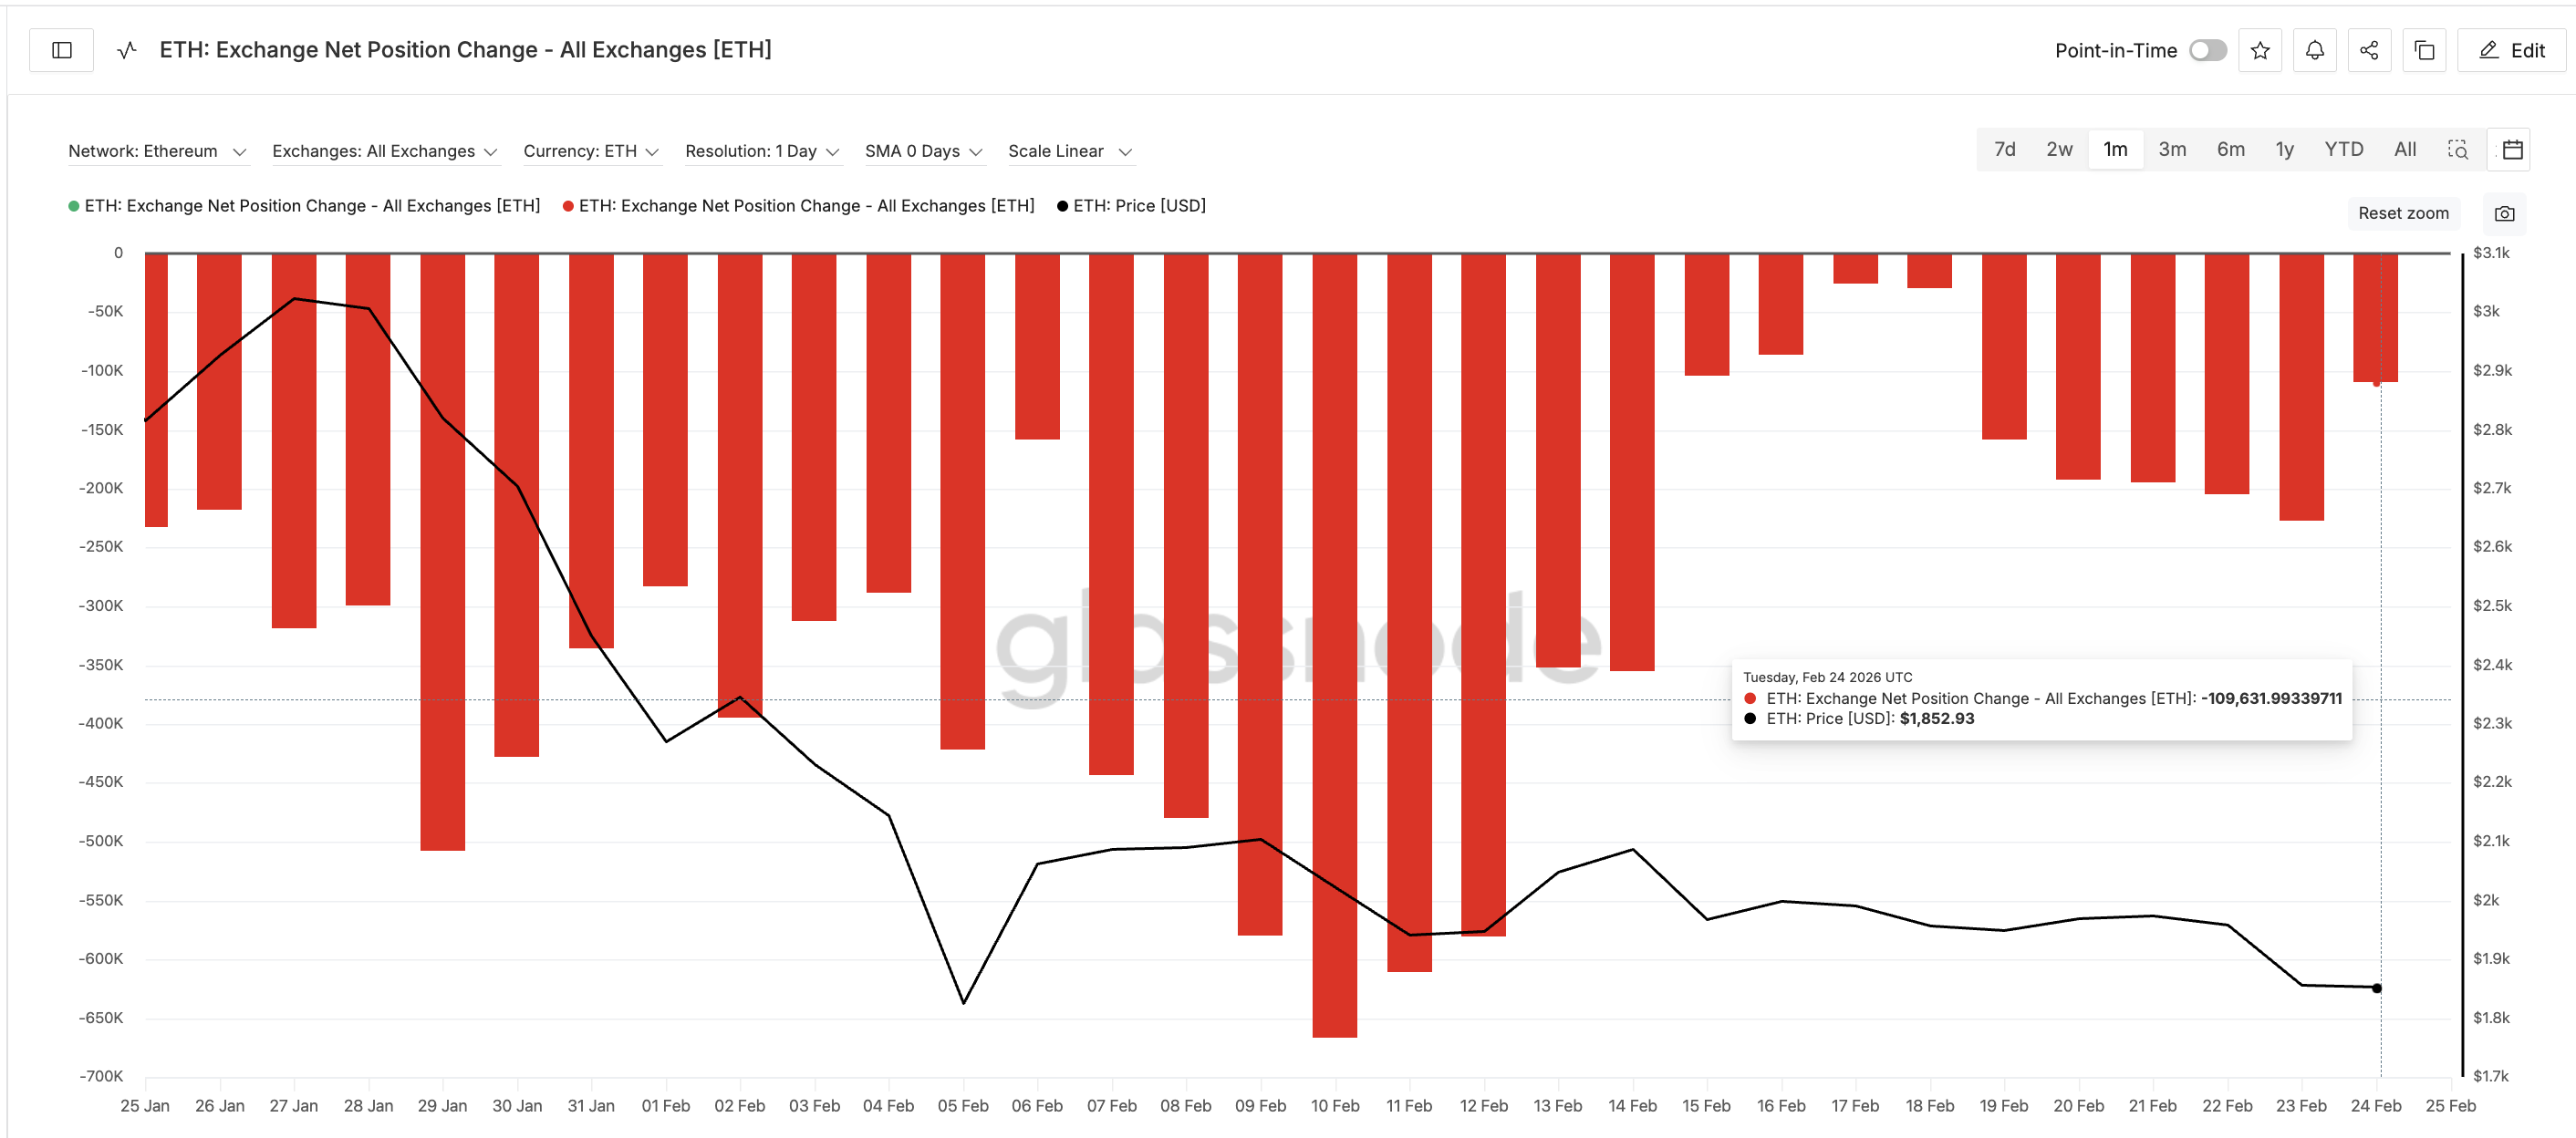
Exchange Net Position Change remained negative throughout the crash. Negative values mean coins are leaving exchanges rather than entering them. This shows investors were moving ETH into private wallets instead of preparing to sell.
For example, exchange outflows reached 227,300 ETH on February 23. Although outflows have slowed to 109,631 ETH on the next day, the trend still shows net accumulation rather than panic selling.
And also, the reduced outflows can be good news. Here is how:
Short-term holders also appear to be exiting.
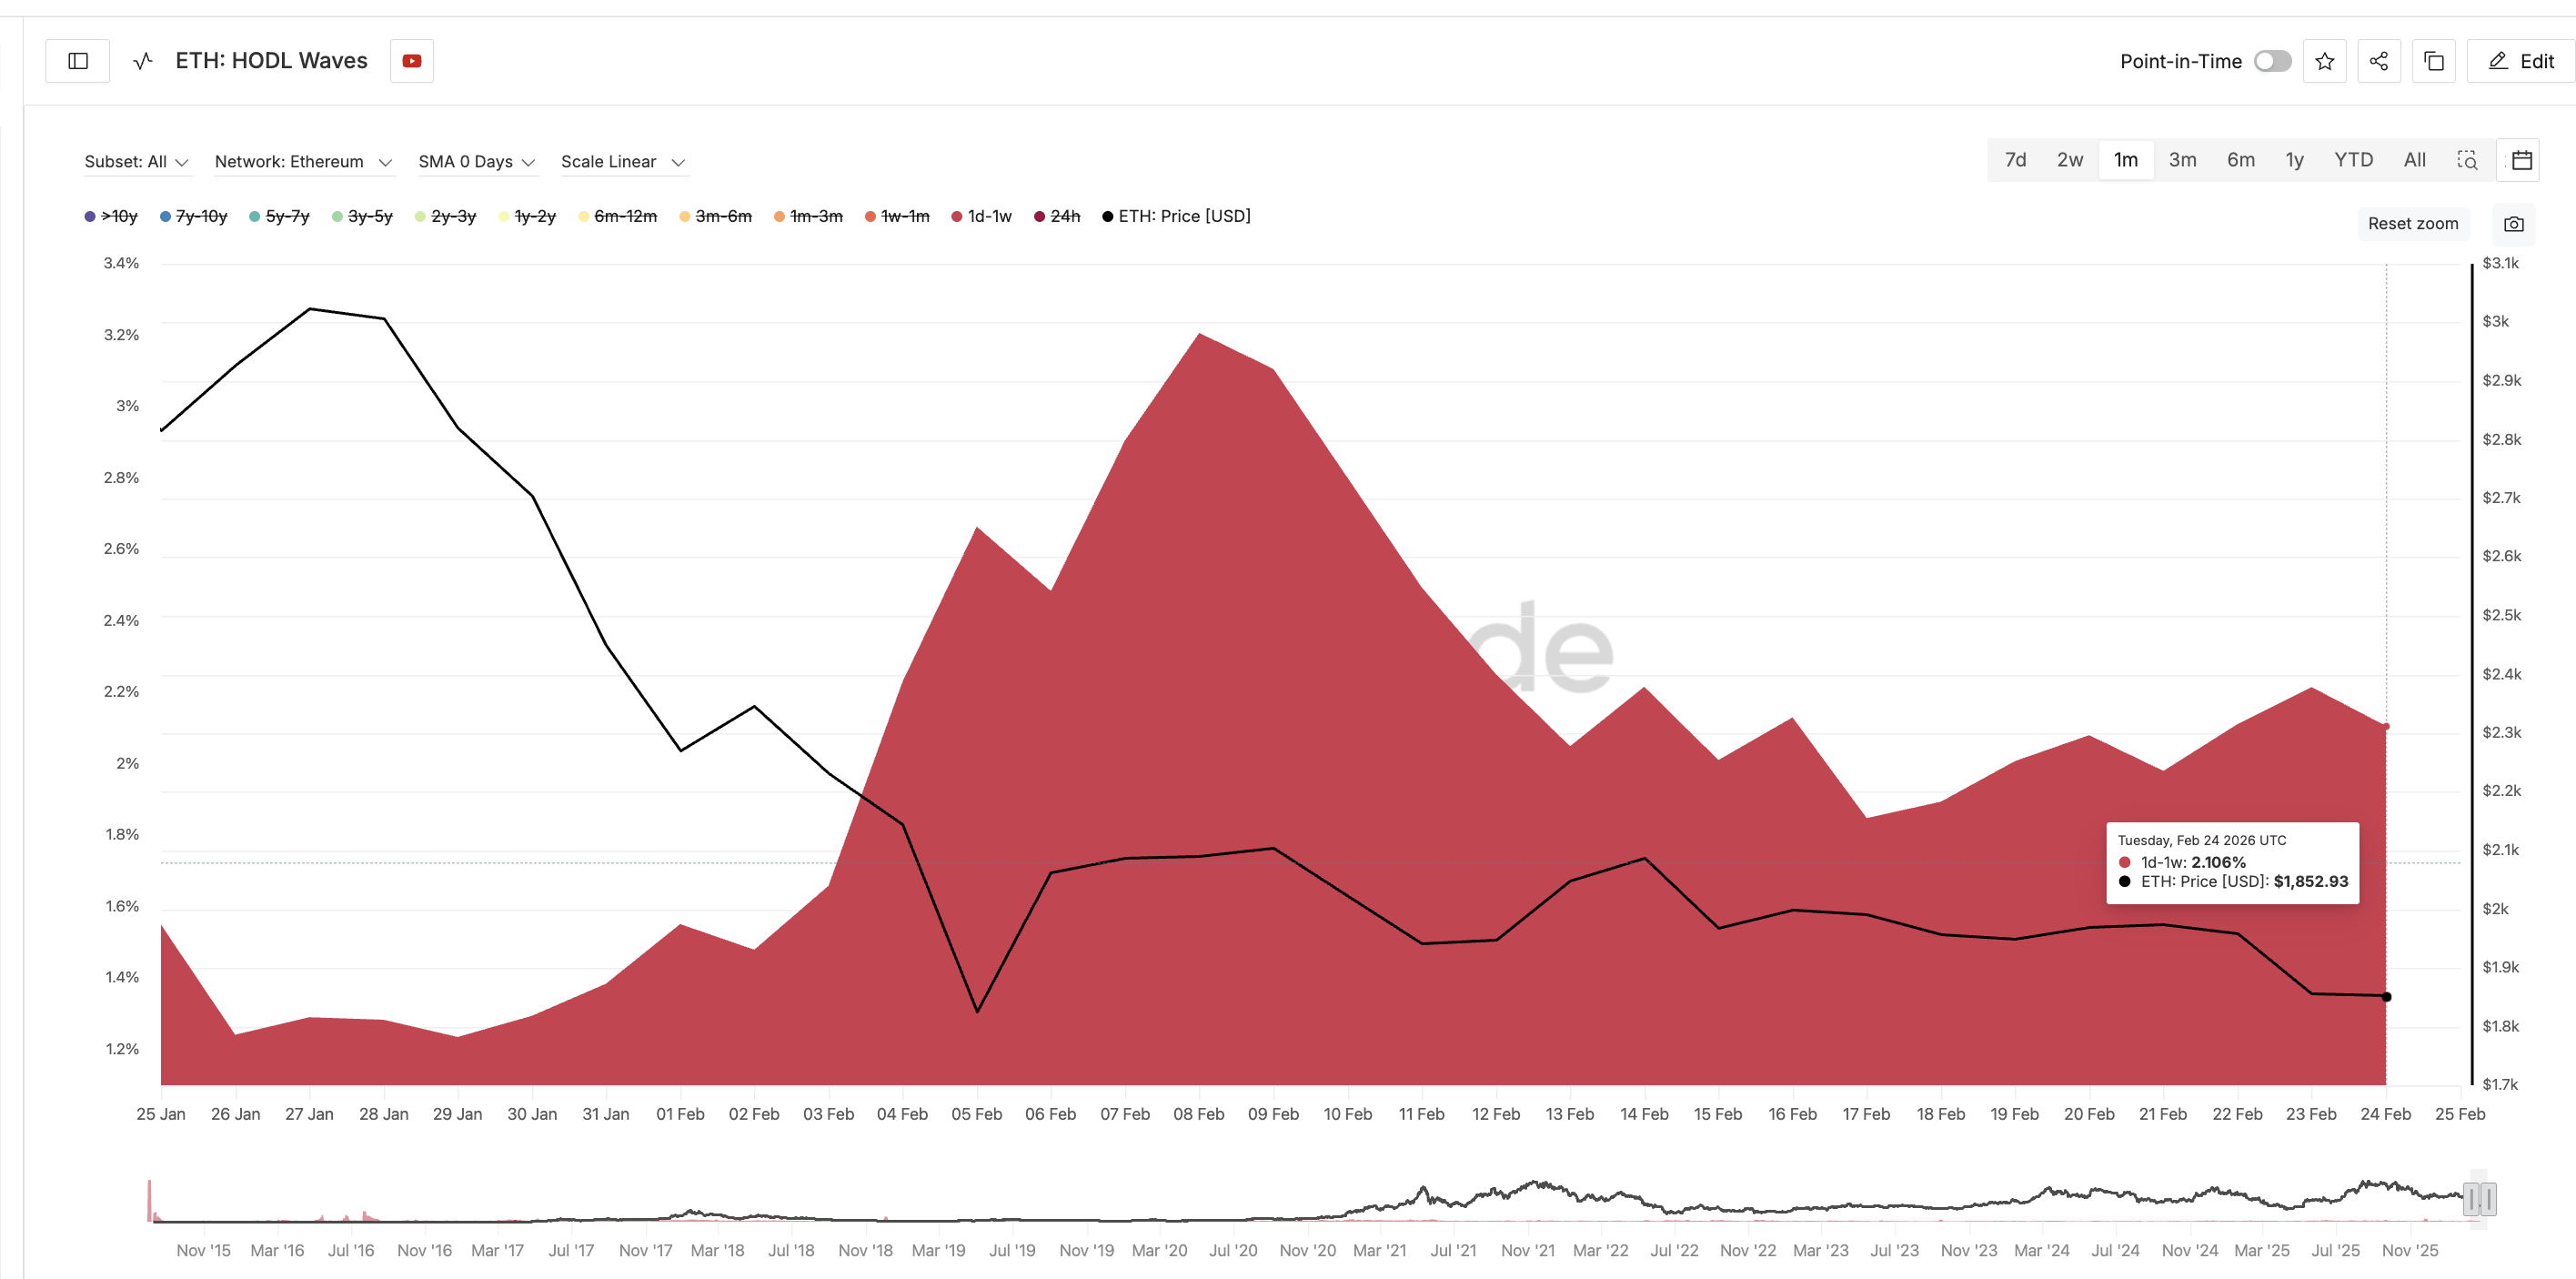
The share of Ethereum supply held by short-term holders, defined as those holding for less than one week, dropped from 3.2% in early February to 2.1% now. This trend was revealed using the HODL Waves metric, which segregates cohorts by time held.
This confirms speculative traders have been flushed out of the market. That could also explain the lower outflow number.
When weak hands exit and strong hands accumulate, markets often move toward structural bottoms. This supports the bullish market shift thesis discussed earlier.
Ethereum Price Now Tests Structural Reversal Zone After Whale Accumulation
Ethereum’s price structure is now beginning to reflect these accumulation signals. The Relative Strength Index (RSI), which measures momentum, is showing a bullish divergence. Between November 21 and February 24, the Ethereum price formed a lower low, but the RSI formed a higher low.
This signals that selling pressure is weakening even though the price has not fully recovered, a technical bullish sign we mentioned earlier in the intro.
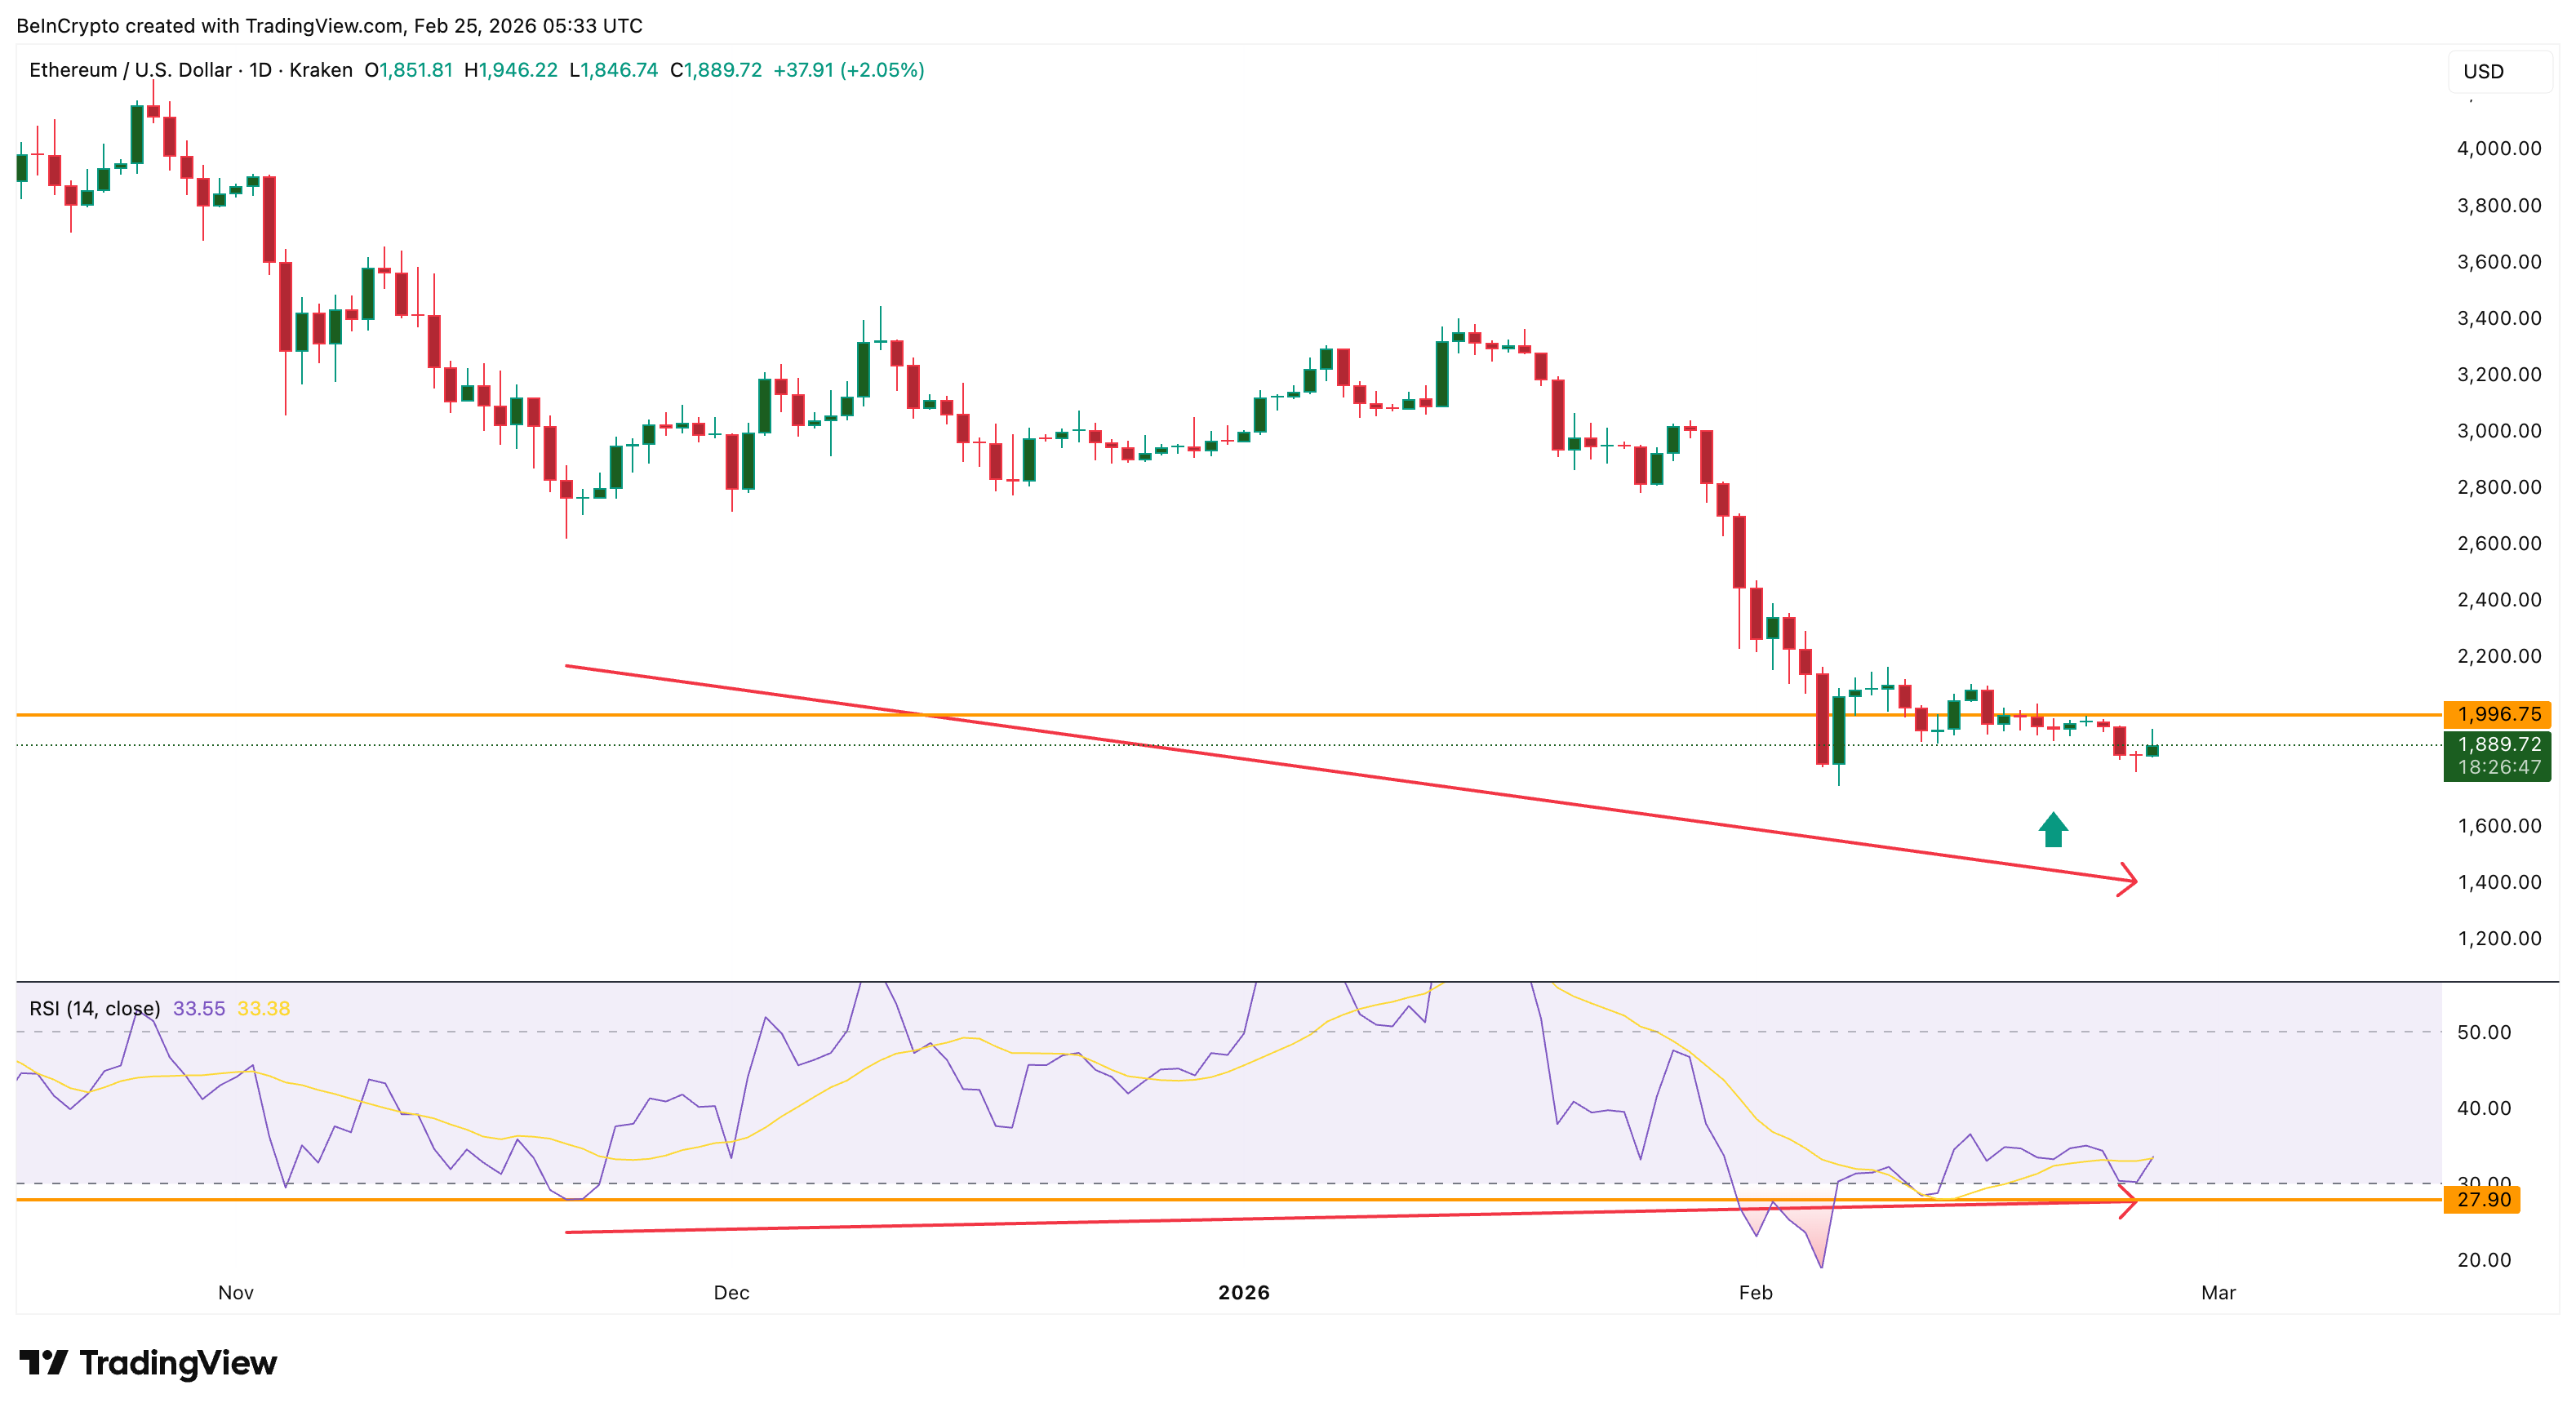
A similar divergence appeared on February 19, but it probably failed because long-term holder support was weaker at that time. The current setup differs because accumulation is now occurring across whales, long-term holders, and exchange flows. This increases the probability of a stronger rebound attempt, if not a theoretical reversal.
Ethereum is now testing a critical recovery zone.
The first resistance sits at $1,990. If Ethereum breaks above this level, the next target becomes $2,050. A move above $2,240 would confirm a larger recovery and signal that the structural bottom may already be in place. This would represent about a 20% move from current levels. However, downside risks remain.
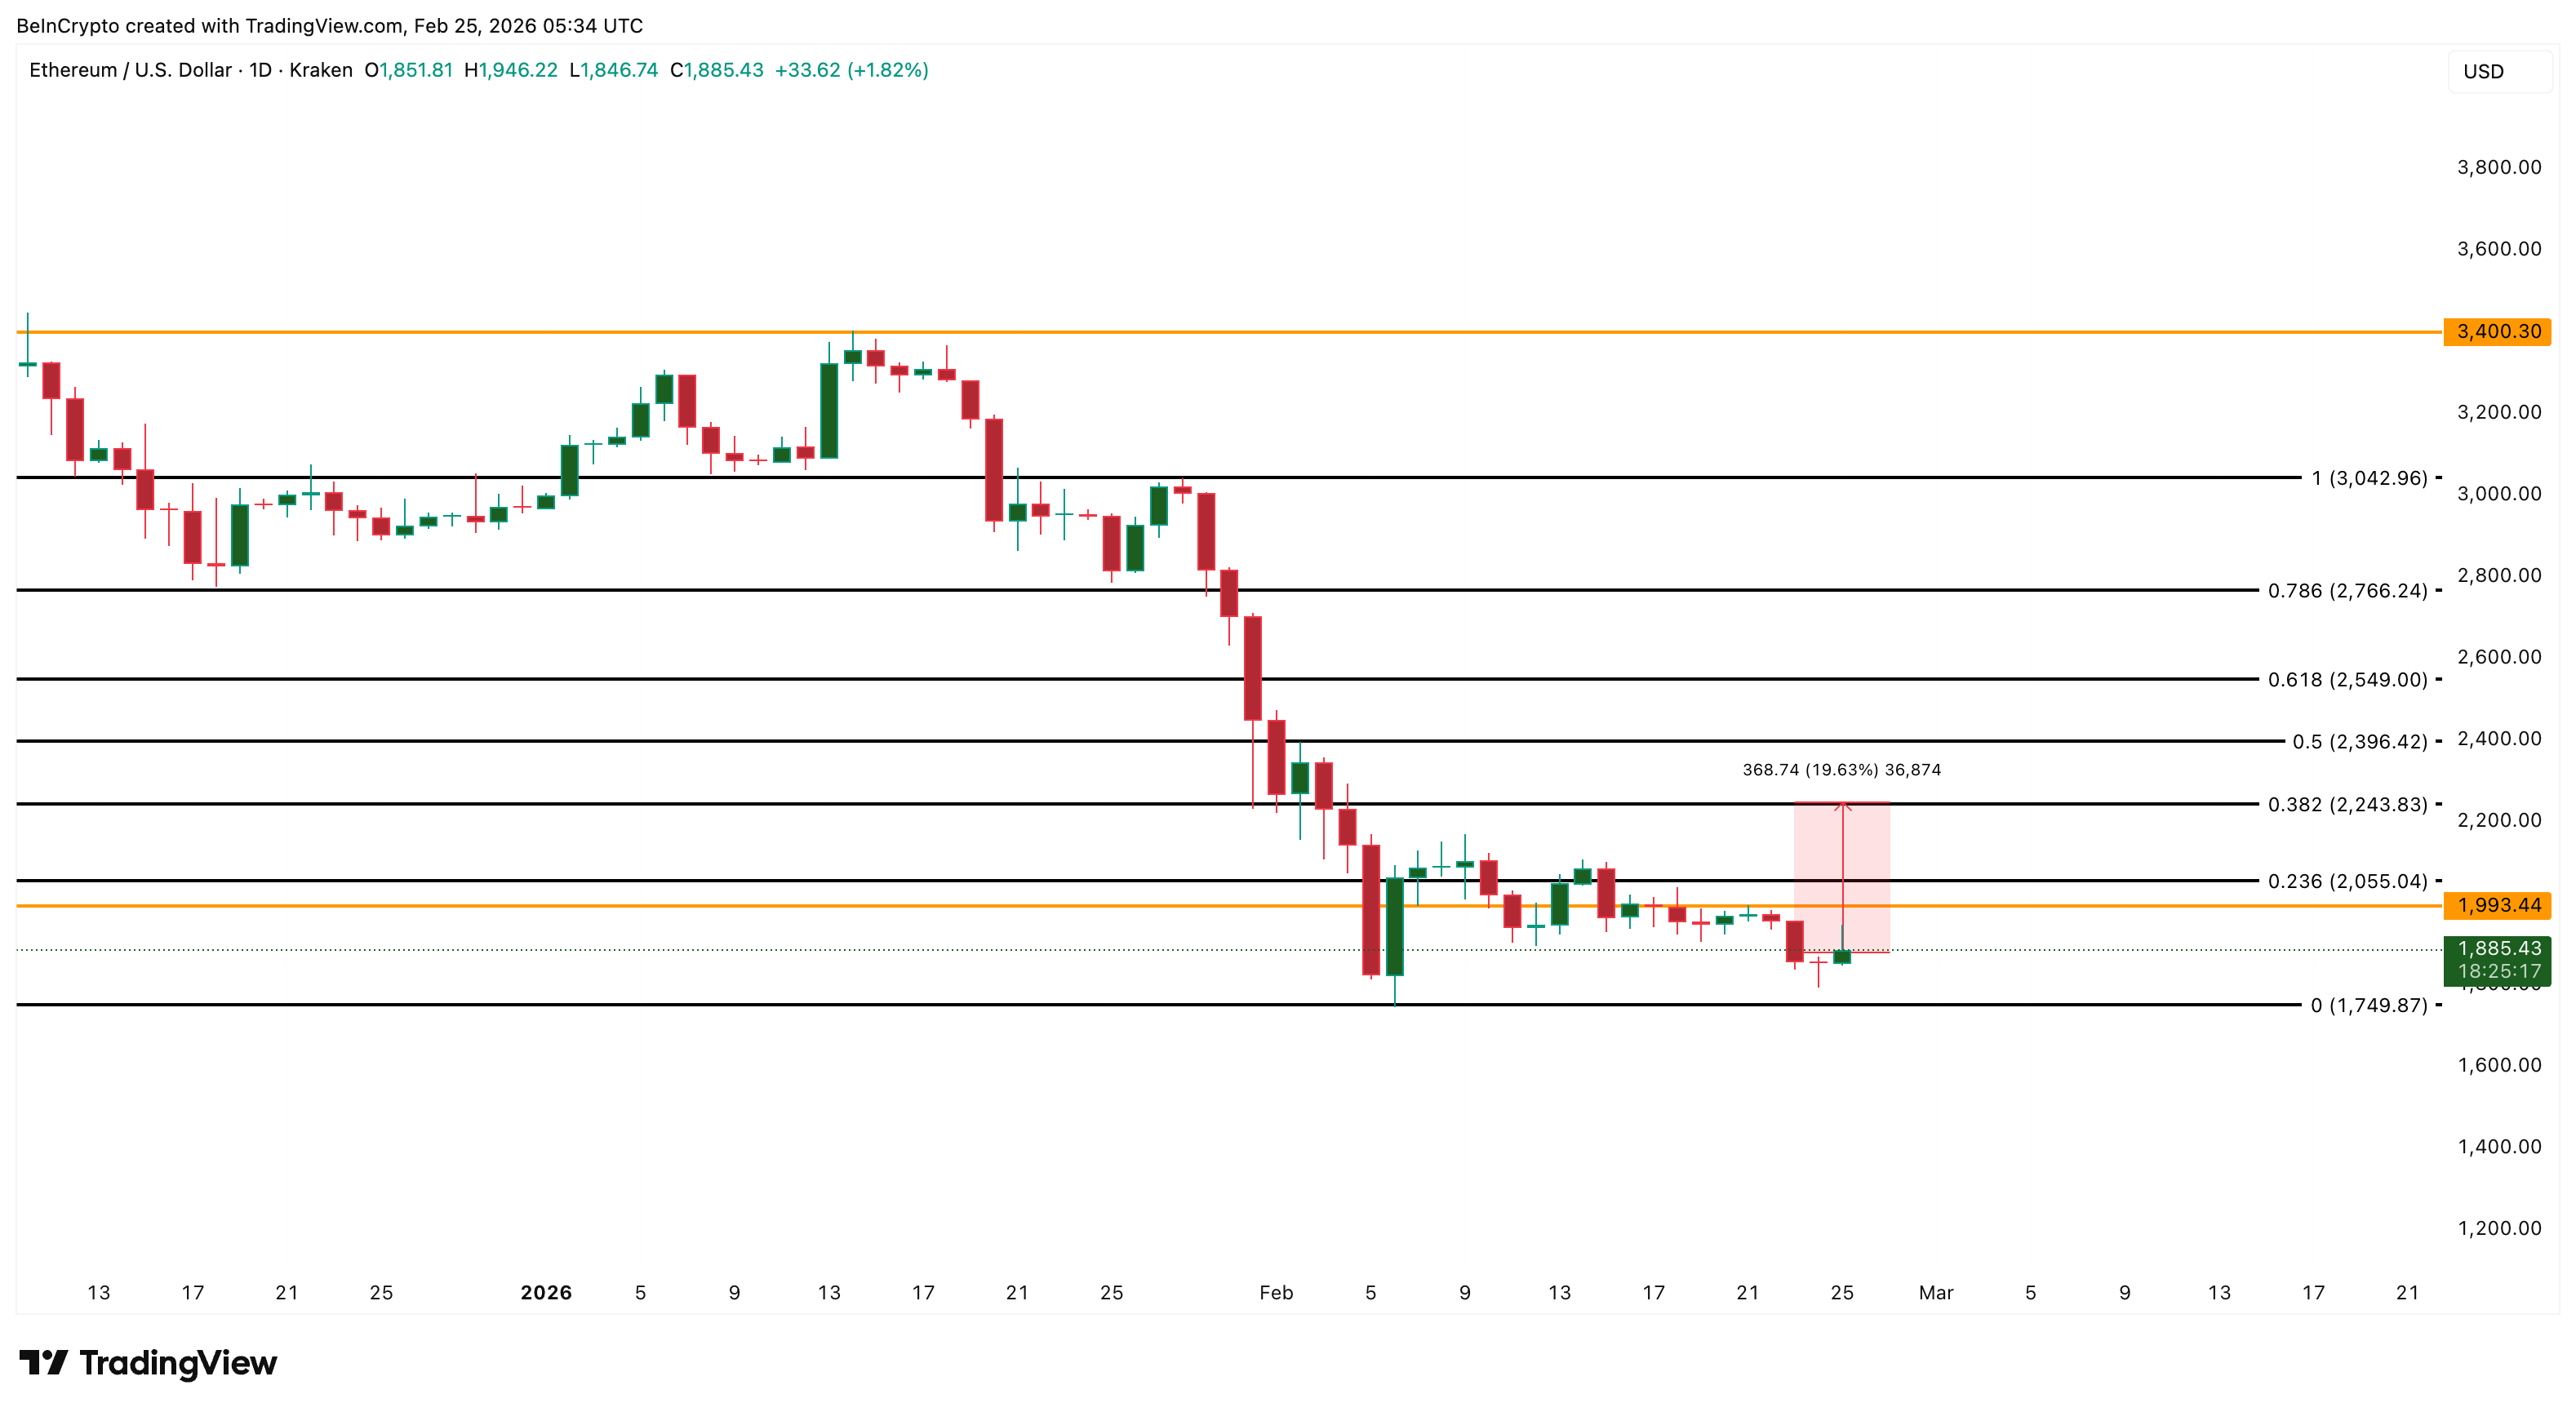
If Ethereum falls below $1,740 before rebounding higher, the structural bottom thesis would fail. This would signal that whales may have accumulated at a local bottom, while the broader downtrend remains active.
For now, the data shows a rare alignment. Whales added nearly 9 million ETH during a $7 billion leverage collapse. Long-term holders have resumed accumulation. Exchange outflows remain dominant, and weak hands are exiting. Ethereum’s next move will now decide whether this accumulation marks the beginning of a true structural bottom or just another temporary pause in a larger downtrend.


TLDR:
- Circle plans phased quantum resistance across Arc, starting with opt-in post-quantum signatures at mainnet launch
- Arc design allows users and developers to adopt quantum-safe features gradually without disrupting existing systems
- Roadmap addresses risks of future decryption threats by enabling early protection against quantum computing advances
- Infrastructure layers, including validators, will integrate quantum resistance over time for full network security
Circle has outlined a phased roadmap for its Arc blockchain, focusing on long-term security against quantum computing risks.
The plan introduces post-quantum cryptography at launch, while maintaining flexibility through opt-in adoption across wallets, validators, and core infrastructure layers.
Phased rollout targets quantum-resistant infrastructure
A recent update shared by Wu Blockchain on X detailed Circle’s approach to building Arc with quantum resilience in mind.
The roadmap shows a structured path toward securing every layer of the network, starting from wallets to deeper infrastructural components.
The mainnet launch will introduce post-quantum signature support as an optional feature. This allows users to create wallets secured against future quantum threats without forcing immediate system-wide changes. At the same time, existing cryptographic standards remain usable during the transition period.
This phased design reduces disruption across the ecosystem. Developers can continue building without rewriting applications, while users retain control over when to upgrade their security settings. As a result, the network maintains stability during gradual adoption.
Circle’s roadmap also addresses concerns tied to “harvest now, decrypt later” scenarios. In such cases, encrypted data collected today could become vulnerable once quantum computing advances. By enabling early adoption of quantum-resistant tools, Arc aims to reduce that exposure over time.
The update further notes that quantum computing could challenge public-key cryptography by 2030 or earlier. This timeline has shaped the decision to embed quantum resistance directly into the network’s foundation rather than relying on future upgrades.
Mainnet launch introduces opt-in post-quantum signatures
The roadmap places strong focus on the mainnet phase, where post-quantum signatures will be introduced. This step marks the first practical implementation of Arc’s long-term security strategy within a live environment.
Users will have the option to create wallets secured by post-quantum cryptographic schemes at launch. This approach avoids forcing migrations while still offering advanced protection for those who choose it early. Over time, adoption can expand based on user preference and ecosystem readiness.
The design also ensures forward compatibility. As new cryptographic standards evolve, the network can integrate updates without requiring disruptive resets. This supports continuity for both developers and institutions operating on the platform.
Validators and infrastructure layers are also included in later phases of the roadmap. These components will gradually adopt quantum-resistant mechanisms, aligning the entire system under a unified security framework.
Circle’s approach reflects a shift toward building infrastructure prepared for future risks. Instead of reacting to emerging threats, Arc’s roadmap introduces security measures during early development stages. This method reduces the need for urgent fixes later.
The structured rollout ensures that each layer of the network evolves without breaking existing functionality. At the same time, it allows stakeholders to adapt at their own pace while maintaining network integrity.


Georgia’s legislature adjourns today, April 6, having sent three AI-related bills to Governor Brian Kemp’s desk, the most notable being a Georgia AI chatbot bill that mandates disclosure, child protections, and crisis response protocols for self-harm.
Summary
- Georgia’s SB 540, a chatbot disclosure and child safety bill, requires operators to notify users they are interacting with AI, limit certain actions by minors, offer privacy tools, and follow protocols when users express suicidal ideation or intent to self-harm
- Two additional bills also await the governor: SB 444, which bans AI-only health insurance coverage decisions, and SR 789, a resolution creating a study committee on AI’s broader societal impact
- Georgia’s SB 540 stands out nationally because it contains no carve-out for chatbots embedded within larger platforms, meaning major tech companies including Meta and Google would need to comply
Georgia’s 2026 legislative session is closing today with three AI bills awaiting Governor Brian Kemp’s signature, including a Georgia AI chatbot bill that is drawing national attention for its breadth and lack of industry exemptions, according to the Transparency Coalition AI’s legislative tracker. The package arrives as more than 27 states advance chatbot safety legislation in 2026, creating a fast-moving patchwork of AI regulations that the White House has publicly warned against.
Georgia’s SB 540 passed the Senate on March 6, cleared the House on March 25, and received Senate agreement on the reconciliation version on March 27. The bill requires chatbot operators to notify users that they are interacting with AI, implement steps that limit certain interactions with minors, provide privacy tools, and establish response protocols when users express suicidal ideation or self-harm intent.
What makes the bill unusual nationally is that it does not include a carve-out for chatbots embedded within a broader service, an exemption that most similar bills include and that would otherwise shield platforms like Meta and Google from having to comply. As crypto.news reported, the global push for chatbot child safety regulation gained momentum earlier this year when UK Prime Minister Keir Starmer signalled plans to bring AI chatbots under stricter online safety rules, citing identical concerns around emotional dependency and unregulated AI-generated advice to minors.
The Other Two Bills on Kemp’s Desk
SB 444 prohibits health insurance coverage decisions from being based solely on AI systems or software tools, requiring human involvement in coverage determinations. It addresses a growing concern that automated denial systems are replacing clinical judgment without appropriate oversight.
SR 789 is a Senate resolution creating a Senate Study Committee on the Impact of Artificial Intelligence, a recognition that Georgia’s legislature intends to keep engaging on the issue after adjournment.
A State-Level Wave the White House Is Watching
As crypto.news has noted, the acceleration of AI safety regulation without clear standards risks creating a compliance landscape where enforcement is inconsistent and under-resourced. The Trump administration has explicitly warned states against “onerous” AI laws and is pushing for a national standard to preempt state-level patchworks. A 10-year moratorium on state AI laws was proposed in the One Big Beautiful Bill Act last summer but was removed from the final legislation in a 99-to-1 Senate vote.
Tennessee’s Governor Bill Lee recently signed an AI therapy bot ban into law. Idaho approved four AI bills before session end. With Georgia now adjourning, the 2026 state AI legislative wave has not peaked.
“SB 540 is a chatbot disclosure and child safety bill, requiring notification of AI nature, steps to limit certain actions by minors, provide privacy tools, and protocols for response to suicidal ideation or self-harm,” the Transparency Coalition AI wrote in its April 3 legislative update. Whether Governor Kemp signs or vetoes the bills will be one of the first signals of how Republican-led states will navigate Washington’s pressure to stand down on AI regulation.


error code: 502
This article was originally published as Bitcoin Eyes $110K as Strategy Absorbs Nearly 3x New BTC Supply on Crypto Breaking News – your trusted source for crypto news, Bitcoin news, and blockchain updates.
Key Takeaways
-
April deadline set for Senate Banking Committee vote on comprehensive crypto framework
-
Legislators work to clarify jurisdictional boundaries between SEC and CFTC
-
Election cycle considerations accelerate timeline for digital asset legislation
-
Policy disputes over stablecoins and token classification near resolution
-
Committee markup process represents critical milestone for regulatory clarity
The United States Senate is positioning itself for a significant advancement in digital asset policy as April emerges as the critical month for legislative action. With the Senate Banking Committee preparing to restart formal proceedings, a comprehensive regulatory framework may finally transition from prolonged discussions to concrete legislative measures.
Committee Leadership Confirms April Restart for Digital Asset Legislation
Senator Bill Hagerty has publicly confirmed that the Senate Banking Committee intends to reconvene discussions on cryptocurrency policy during April. Committee leadership has expressed determination to advance the proposed legislation through formal markup procedures in the coming weeks. This commitment reflects a significant shift in momentum following extended periods of legislative inactivity.
Lawmakers temporarily suspended earlier initiatives following political challenges and persistent disagreements over fundamental policy elements. Nevertheless, committee participants now demonstrate greater consensus regarding the necessity of moving forward with structured legislative action. Consequently, the upcoming month represents a potentially transformative period for federal cryptocurrency policy development.
Before any consideration reaches the full Senate chamber, the Banking Committee must complete its comprehensive review and formal approval procedures. Additionally, collaboration with the agriculture committee remains essential given the overlapping supervisory responsibilities for commodity-related digital assets. Therefore, successful advancement requires sustained cooperation across multiple legislative bodies.
Regulatory Authority Division Remains Central to Legislative Framework
The proposed legislative structure focuses extensively on establishing clear jurisdictional boundaries between the Securities and Exchange Commission and the Commodity Futures Trading Commission. Presently, both regulatory agencies maintain competing claims over various categories of digital assets. This ambiguity has created an environment where enforcement actions substitute for comprehensive regulatory guidance.
The SEC’s approach typically classifies numerous digital tokens as securities requiring registration and disclosure compliance, whereas the CFTC designates prominent cryptocurrencies as commodities subject to futures market oversight. Such divergent interpretations have resulted in fragmented enforcement rather than coherent industry standards. Accordingly, the pending legislation attempts to establish definitive jurisdictional parameters and eliminate regulatory overlap.
Draft provisions include mandatory licensing frameworks for cryptocurrency exchanges and custodial service providers. Additional requirements would establish standardized disclosure obligations for entities issuing new tokens. These measures collectively aim to create predictable compliance pathways throughout the digital asset ecosystem.
Electoral Considerations and Stakeholder Engagement Shape Legislative Schedule
The accelerated timeline for cryptocurrency legislation reflects increasing awareness of digital asset policy as an electoral consideration ahead of 2026 congressional elections. Legislative leaders acknowledge the expanding political influence exercised by cryptocurrency advocacy organizations and industry coalitions. This recognition has elevated regulatory clarity to a matter of strategic political importance.
Coinbase representatives and allied industry participants have reported meaningful progress in resolving previously contentious policy matters. Outstanding concerns regarding stablecoin interest-bearing functionality and ethical questions surrounding asset tokenization appear closer to compromise. These developments suggest that major obstacles to bipartisan support may be diminishing.
Political action committees focused on cryptocurrency issues have substantially increased their financial participation and campaign engagement throughout recent election cycles. This expanding political footprint continues to influence legislative agenda-setting within Congress. Subsequently, digital asset regulation has become intertwined with broader electoral strategy considerations.
Lawmakers recognize the strategic value of securing committee approval before campaign activities intensify later in the year. However, several technical specifications and jurisdictional details require additional negotiation and refinement. Accordingly, while legislative momentum has clearly increased, final passage remains contingent on resolving these remaining complexities.
Achieving a positive committee vote would establish the first comprehensive legislative framework for digital assets at the federal level. Such progress would significantly reduce the regulatory uncertainty that has constrained domestic innovation and market development. Ultimately, this legislative initiative could fundamentally alter the United States’ approach to digital financial infrastructure and establish a model for coordinated regulatory oversight.
Key takeaways:
-
President Trump’s Tuesday deadline to Iran creates a pivotal moment for Bitcoin as it continues to decouple from gold.
-
While a ceasefire could boost equities, Bitcoin’s $75,000 path depends on its role as a hedge against fiscal instability.
BTC may benefit from (no) US-Iran ceasefire
There is a high probability that US President Donald Trump’s Tuesday deadline to Iran could be the catalyst needed for a Bitcoin (BTC) rally above $75,000.
Should a deal fail to materialize, Bitcoin’s risk perception could strengthen due to its unique decentralized properties. Conversely, a positive outcome in negotiations would likely propel risk assets, including Bitcoin.
President Trump issued an ultimatum to Iran on Sunday, warning the nation would be “living in Hell” if the Strait of Hormuz is not reopened by Tuesday at 8:00 pm ET. However, CNBC reports that Trump has been “vacillating” between productive dialogue and the intensification of military action.
Senior Iranian officials reportedly stated the strait will remain blocked until Iran receives compensation for war damages.

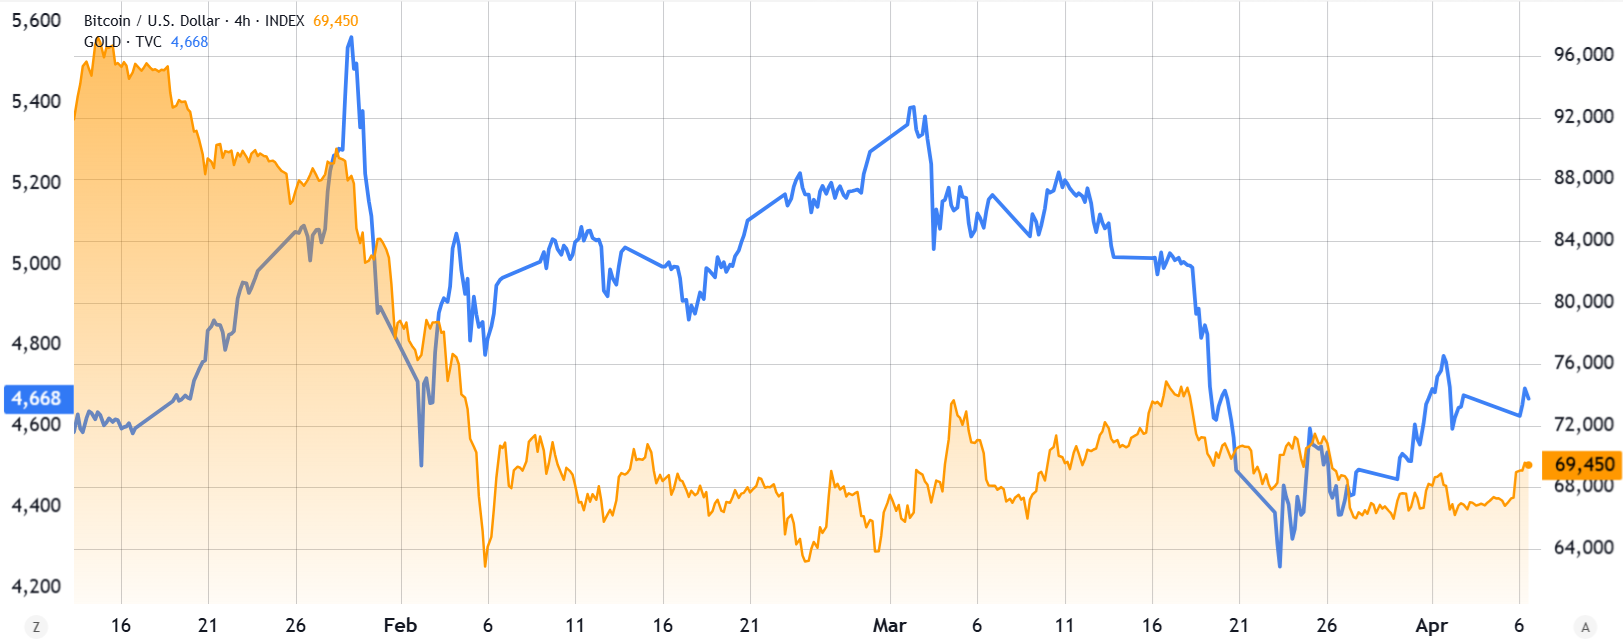
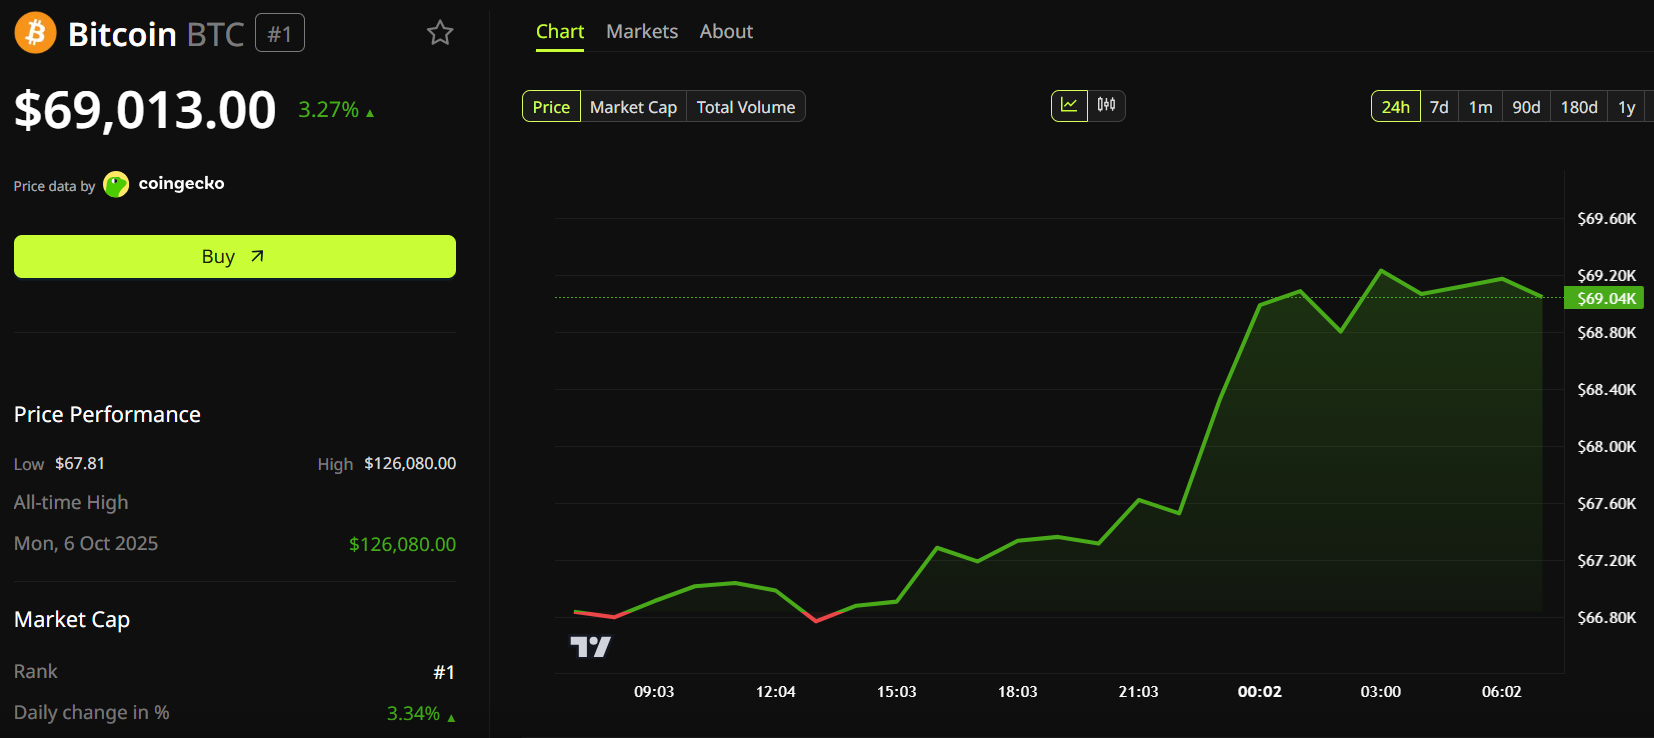
These mixed signals failed to convince market participants on Monday, as US stock markets traded mostly flat. In contrast, Bitcoin jumped above $69,000 for the first time in over 10 days—a trend made more notable by gold prices holding near $4,650, down 17% from a $5,600 all-time high.
Bitcoin slowly catching up to gold
Traders are increasingly concerned that central banks will be forced to liquidate their gold reserves. The Turkish Central Bank reported sales of 50 tonnes of gold for the week ending March 20, the sharpest decline in over seven years.
According to Reuters, Turkey has also sold $26 billion in foreign currencies to stabilize markets since the US and Israel-Iran war broke out in late February. Similarly, Russian gold reserves measured in tons have dropped to their lowest levels in four years.
A ceasefire in Iran, even if temporary, would almost certainly bolster risk markets, though the implications for Bitcoin are less certain.
Traditional corporations remain heavily dependent on energy costs and global logistics. Therefore, any reduction in geopolitical risk is immediately reflected in equity prices.
However, a deal between the US and Iran would likely have a less direct impact on Bitcoin, as a resolution would likely strengthen the demand for US Treasuries.

Yields on the US 5-year Treasury note surged to 4% from 3.55% in late February, signaling that investors are demanding higher returns to hold those bonds. While part of this selling pressure stems from fears of sticky inflation driven by high oil prices, there is also the added burden on the US fiscal debt due to increased spending on military operations.
An eventual ceasefire and renewed confidence in the US Treasury reduces the necessity for alternative hedges and independent financial systems such as Bitcoin.
However, even if the Strait of Hormuz is reopened, Mohit Mirpuri, an equity fund manager at SGMC Capital, warned that “the damage to confidence and supply chains is already done — things don’t just snap back to normal.”
Related: Iran war bets turn prediction markets into real-time macro radar—Sygnum
Predicting that the Bitcoin price will rally 8% by Tuesday based solely on a potential resolution to the US and Israel-Iran war seems far-fetched. Investors are gradually adjusting to President Trump’s characteristic back-and-forth, especially when negotiations involve unreliable third parties.
Traders are unlikely to provide the benefit of the doubt in this instance, so sustainable bullish momentum for risk markets could take longer to materialize. Nevertheless, the case for a $75,000 Bitcoin rally remains possible in the event of a positive outcome by Tuesday.
This article is produced in accordance with Cointelegraph’s Editorial Policy and is intended for informational purposes only. It does not constitute investment advice or recommendations. All investments and trades carry risk; readers are encouraged to conduct independent research before making any decisions. Cointelegraph makes no guarantees regarding the accuracy or completeness of the information presented, including forward-looking statements, and will not be liable for any loss or damage arising from reliance on this content.
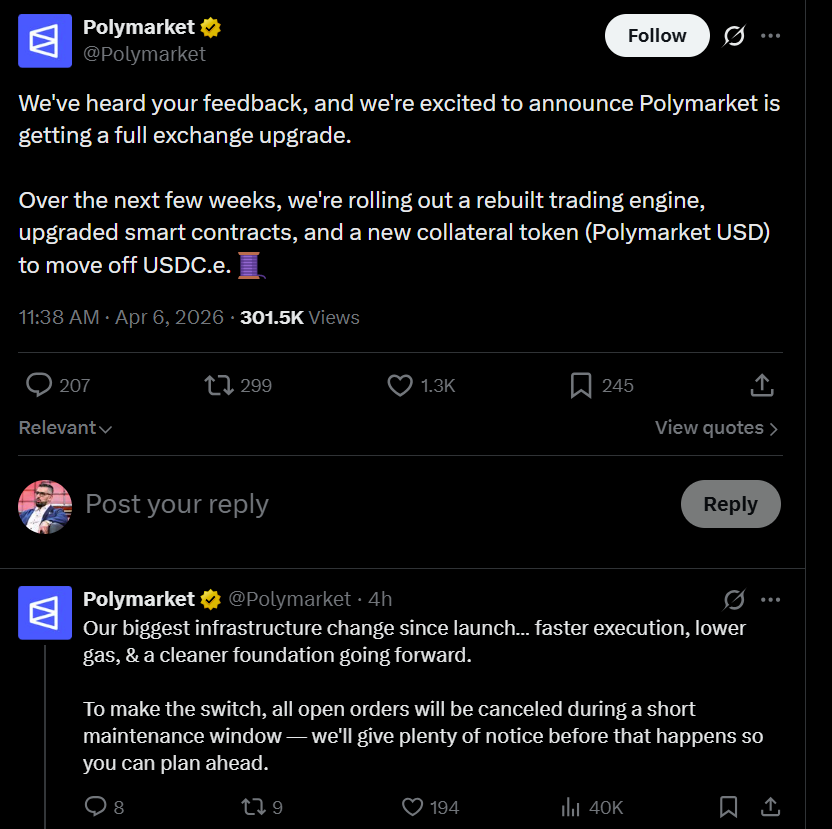
Prediction platform Polymarket is overhauling its exchange infrastructure in the coming weeks, introducing a new collateral token and upgraded trading system that give the platform greater control over settlement and risk as it moves toward closer alignment with US regulatory expectations.
In an announcement on Monday, Polymarket said it will deploy new exchange contracts — dubbed version 2 — designed to simplify how orders are structured and matched. The upgrade is intended to make trading more efficient and to make it easier for developers to connect apps and trading bots to the platform.
The new system will also support EIP-1271, an Ethereum standard that allows smart contract-based wallets, such as multisigs and automated trading systems, to sign transactions, expanding compatibility beyond traditional wallets.
A central component of the upgrade is the introduction of Polymarket USD, a new collateral token that will replace USDC.e, the bridged version of USDC (USDC) previously used on the platform. The new token is fully backed 1:1 by USDC, giving Polymarket more direct control over its settlement layer while reducing reliance on bridged assets.
For most users, the transition will be handled automatically through the platform’s interface, requiring only a one-time approval.
The upgrade is expected to roll out over the next few weeks, though the company has not provided a specific timeline.

Related: NYSE parent ICE completes new $600M investment in Polymarket
US regulatory approval shapes Polymarket expansion
The move follows Polymarket’s broader efforts to curb manipulation and insider-trading risks, as it seeks to strengthen market integrity and align more closely with US regulatory standards.
In November, Polymarket received approval from the Commodity Futures Trading Commission to operate an intermediated trading platform in the United States, clearing the way for its return after previously exiting the market.
Following that approval, Polymarket said it plans to onboard brokers and customers directly and facilitate trading through regulated US venues.
Interest in prediction markets has continued to grow, with users increasingly turning to these platforms to trade on real-world outcomes tied to politics, markets and policy. Industry data shows Polymarket’s fee revenue increasing in recent weeks after the platform expanded trading fees.

Magazine: Are DeFi devs liable for the illegal activity of others on their platforms?
JPMorgan CEO Jamie Dimon said “new technologies” are intensifying competition across the financial sector, with blockchain-based players emerging alongside traditional rivals.
In his annual shareholder letter on Monday, Dimon identified artificial intelligence, data and advanced technology as “key to the future,” signaling a shift toward more automated, data-driven financial services.
While blockchain and digital assets were not a central focus, Dimon acknowledged that “a whole new set of competitors is emerging based on blockchain, which includes stablecoins, smart contracts and other forms of tokenization.”
The comments come as JPMorgan continues to focus on its own blockchain initiatives, even as Dimon emphasized that the bank’s long-term success will depend largely on its ability to deploy AI across its operations.

JPMorgan has been expanding its in-house blockchain infrastructure, now known as Kinexys, which enables near-instant fund transfers without relying on traditional intermediaries.
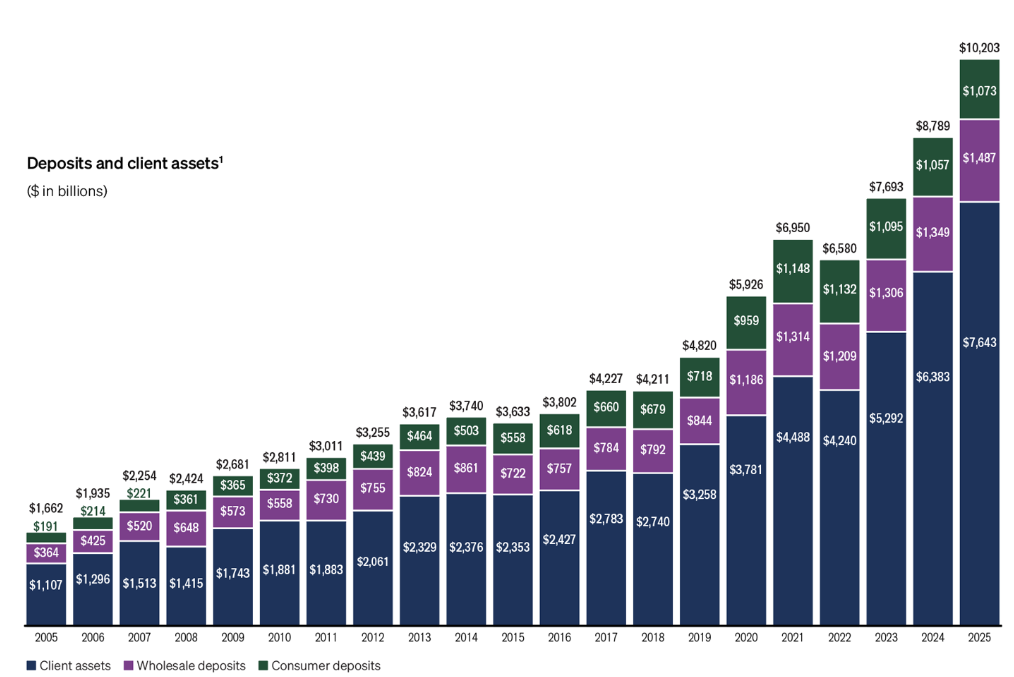
The platform is targeting up to $10 billion in daily transaction volume and recently moved toward that goal by onboarding Japan’s Mitsubishi Corporation. Other clients include Qatar National Bank and major institutional players such as Siemens and BlackRock.
Kinexys is also being positioned as a broader tokenization platform, with JPMorgan aiming to expand into markets such as private credit and real estate.
Related: SoFi expands into institutional finance with integrated crypto services
Dimon comments come as stablecoin battle heats up in Washington
Dimon’s mention of blockchain and stablecoins comes at a contentious moment for the banking industry, as US lawmakers continue to debate digital asset legislation.
The passage of the GENIUS Act last year, which established a regulatory framework for stablecoins, is widely expected to accelerate adoption by providing clearer rules for issuers and institutions.
However, broader market structure legislation remains stalled in Congress. A key point of friction is yield-bearing stablecoins, which banking groups argue could undermine financial stability by allowing issuers to offer interest-like returns without adhering to the same regulatory requirements as banks.

Tensions have also spilled into the public sphere. Dimon and Coinbase CEO Brian Armstrong have traded criticisms over the direction of crypto regulation, with Dimon pushing back against claims that banks are attempting to derail legislative efforts.
Industry lobbying groups, including the American Bankers Association, have made opposition to yield-bearing stablecoins a key policy priority this year.
Related: Stablecoin supply reaches $315B in Q1 as USDC rises, USDT declines


President Trump’s DHS pay order has directed all Department of Homeland Security employees to be paid using redirected federal funds, but legal and budget experts say the administration may be violating a 150-year-old law that gives Congress sole control over federal spending.
Summary
- Trump signed two executive directives — one on March 27 for TSA workers and an expanded memo on April 4 for all DHS employees — directing pay using funds from the One Big Beautiful Bill Act, sidestepping the ongoing partial shutdown
- Legal experts warn the move may conflict with the Antideficiency Act, which bars the executive branch from spending money that Congress has not appropriated for a specific purpose
- The administration has provided no detailed public justification for how it is legally connecting TSA operations to the bill’s DHS border enforcement funds, drawing criticism from budget analysts on both sides
President Trump’s DHS pay order, which directs the Department of Homeland Security to pay all its employees using funds redirected from last year’s One Big Beautiful Bill Act, has put paychecks back in workers’ accounts but opened a serious constitutional question that legal experts say the administration has yet to answer. Trump initially signed a directive on March 27 covering TSA workers, then expanded it on April 4 to include all DHS employees, citing “an emergency situation compromising the Nation’s security.”
The Antideficiency Act, a 150-year-old federal statute, bars the executive branch from spending money that has not been expressly appropriated by Congress for the specific purpose being funded. Trump’s order directed the DHS secretary to use funds with “a reasonable and logical nexus to TSA operations” from the One Big Beautiful Bill Act — a law that allocated $10 billion to DHS for border-related functions, with no specific mention of TSA.
Budget analysts flagged the ambiguity immediately. “The administration’s provided no real clarity about what they’re doing publicly that would allow someone to even figure out whether what they’re doing is legal or not legal,” Devin O’Connor, a senior fellow at the Center on Budget and Policy Priorities, told CNBC. “They haven’t made the case for it in any kind of public way.”
Where the Money Is Coming From — and Why That Matters
Administration officials confirmed the payments are being drawn from the One Big Beautiful Bill’s DHS fund, which gave the secretary discretion to deploy resources supporting DHS’s border mission. Bobby Kogan of the Center for American Progress estimated the cost of funding TSA runs approximately $140 million per week, suggesting the administration could sustain payments for nearly a year before that pool runs dry. But critics note that the bill’s language does not cover TSA, which handles airport security rather than border enforcement, making the legal nexus tenuous.
Senate Majority Leader Thune acknowledged the order as a “short-term solution” that “takes the immediate pressure off,” while noting it does nothing to resolve the underlying standoff between the two chambers.
The Constitutional Fault Line
As crypto.news reported, government shutdowns carry consequences beyond the immediate departments affected — including delays to economic data releases, stalled regulatory activity, and heightened uncertainty across financial markets. The constitutional issue here runs deeper than a funding dispute. Article I of the US Constitution vests the power of the purse exclusively in Congress. Trump’s move to unilaterally pay workers without an active appropriation mirrors actions that have historically invited legal challenge under the Antideficiency Act.
A second broader executive memo on April 4 extended the same approach to every DHS employee, not just TSA, including furloughed workers and those in agencies not obviously connected to the One Big Beautiful Bill’s border funding mandate. As crypto.news noted in its coverage of the DHS shutdown’s earlier market impact, prolonged fiscal uncertainty of this kind tends to weigh on investor sentiment and delay forward guidance from the Federal Reserve.
“America’s air travel system has reached its breaking point,” Trump said in his original March 27 memo. What remains unresolved is whether his chosen remedy is within his legal authority to execute.
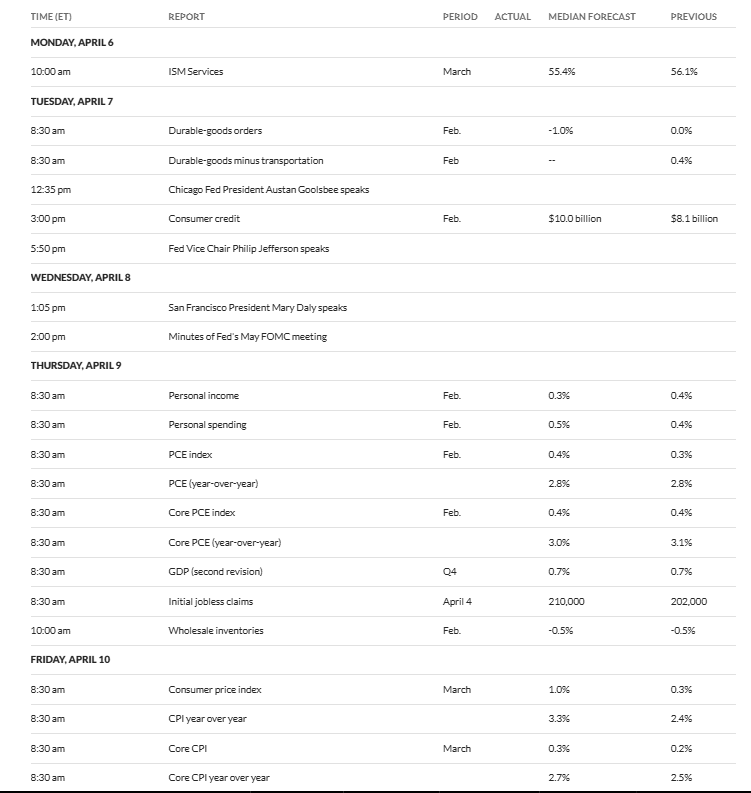
Four U.S. economic releases between Wednesday and Friday will test whether Bitcoin (BTC) can hold above $67,000 or breaks lower into a deeper correction.
The sequence begins with the Federal Open Market Committee (FOMC) minutes on Wednesday, followed by February Personal Consumption Expenditures (PCE) inflation and Q4 Gross Domestic Product (GDP) data on Thursday, and ends with March Consumer Price Index (CPI) on Friday.
Why This Week’s Data Matters for Bitcoin
BTC entered April trading around $69,000, down roughly 23% year-to-date after the worst opening quarter for digital assets since 2018.
The Crypto Fear and Greed Index has hovered between 8 and 14 for over a month, registering deep extreme fear territory.
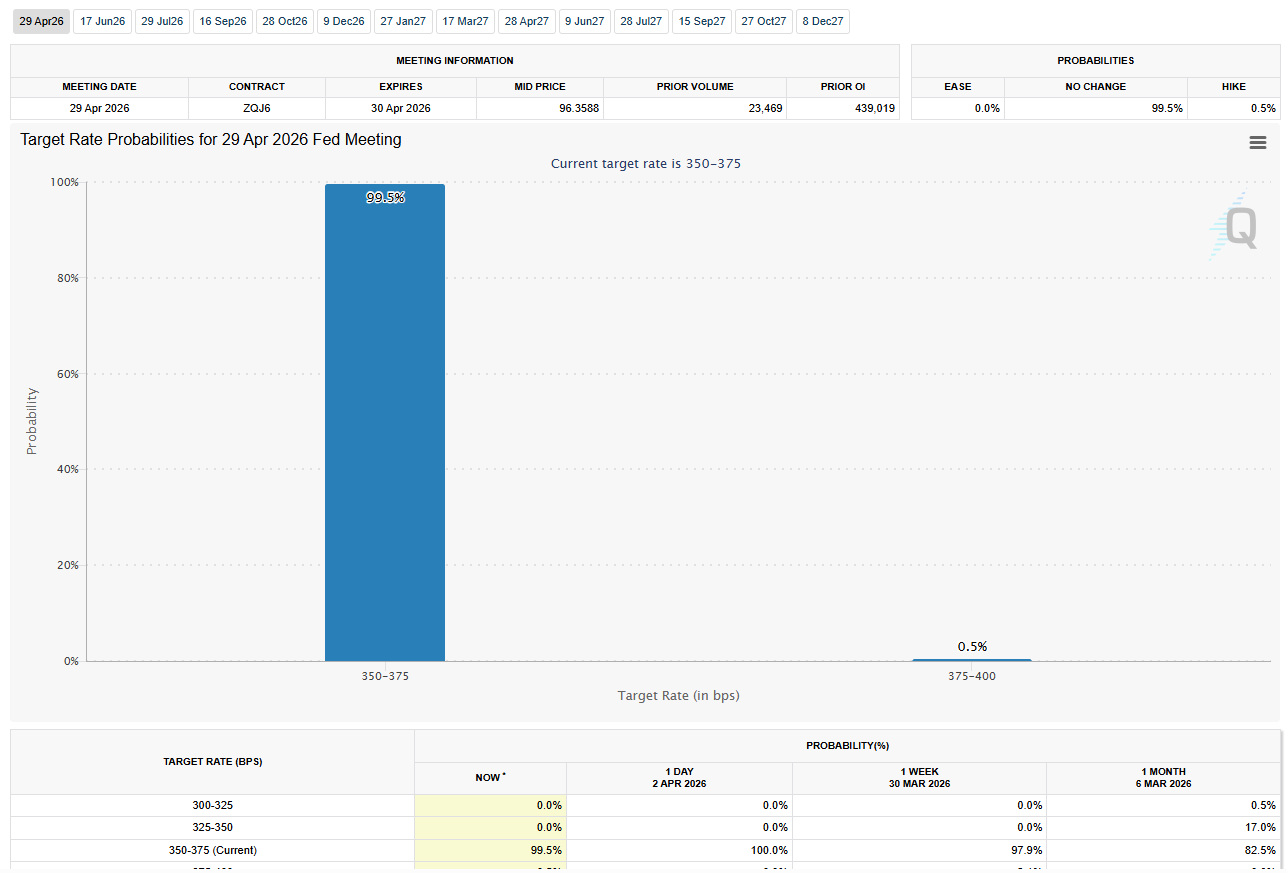
The Federal Reserve held rates steady at 3.50-3.75% at its March 18 meeting, while the updated dot plot projected just one cut before year-end 2026. PCE inflation expectations for 2026 were revised upward to 2.7%.
Meanwhile, the Middle East conflict and closure of the Strait of Hormuz have sent oil prices surging roughly 50% since late February.
The Energy Information Administration revised its 2026 WTI forecast upward by $20 per barrel. That energy shock now feeds directly into this week’s inflation prints.
How Each Release Could Affect BTC
Bitcoin’s 24-hour correlation with the S&P 500 recently hit 0.94, confirming its behavior as a high-beta macro asset. That linkage means every inflation surprise or policy signal this week flows directly into crypto pricing.
FOMC Minutes, Wednesday 2 PM ET
The minutes from the March 17-18 meeting will reveal how officials debated tariff inflation, oil prices, and a weakening labor market.
Traders will scan for hawkish language around persistent inflation versus dovish acknowledgment of growth risks.
Historically, BTC has shown a consistent sell-the-news pattern around FOMC events. The pioneer crypto dropped after eight of nine FOMC events in 2025, with post-event declines of 5-10% common as positioning unwound.
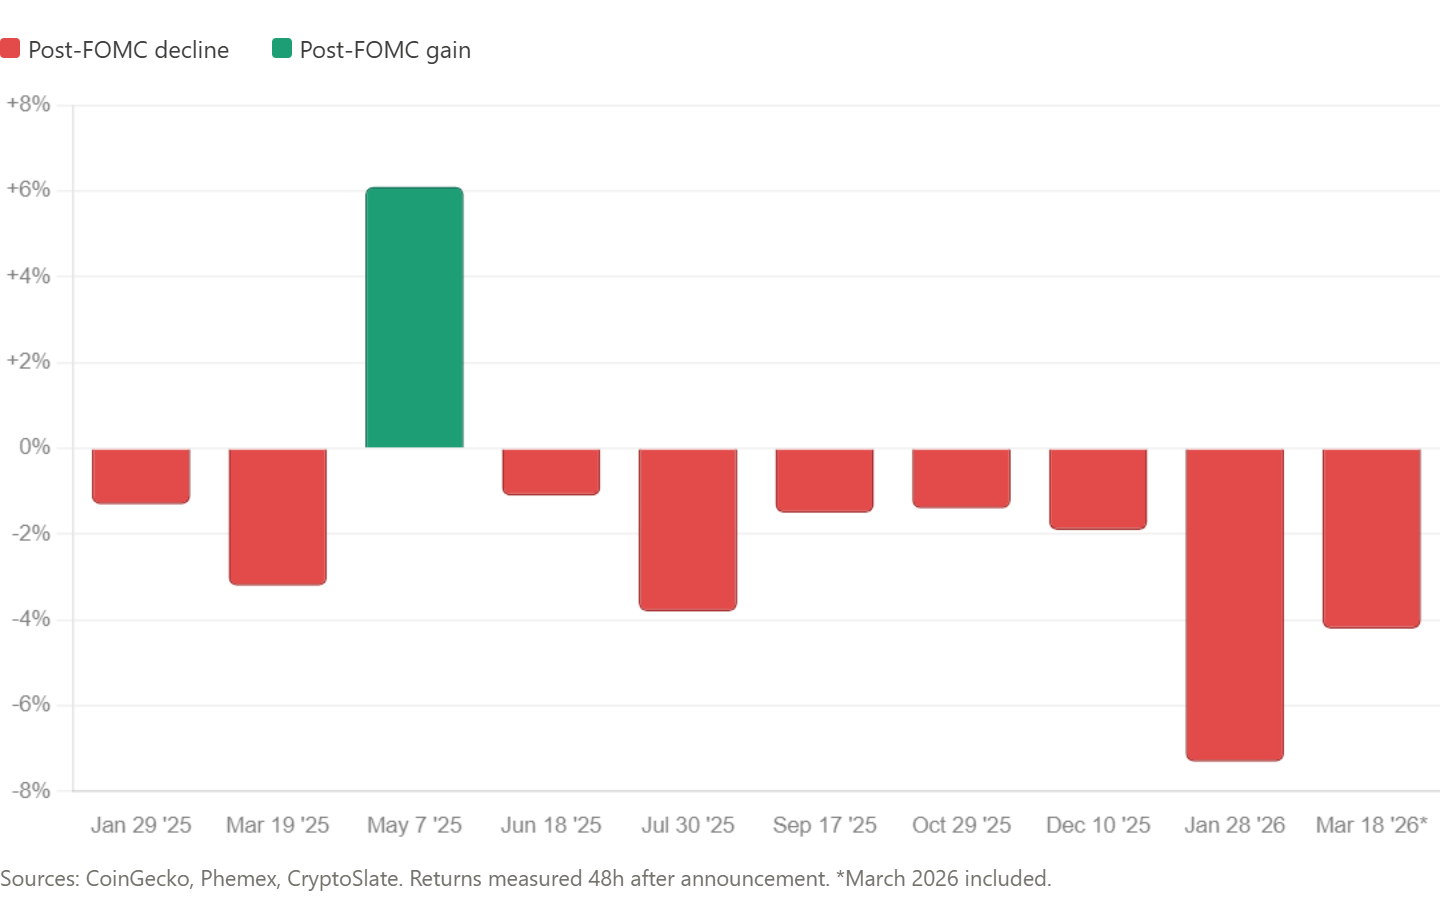
After the January 2026 minutes were released in February, BTC underperformed, while the dollar and bonds rallied.
A hawkish tilt this time would reinforce delayed cuts, pushing real yields higher and strengthening the USD.
A dovish surprise acknowledging transitory shocks could briefly lift BTC, with the pioneer crypto potentially going above $70,000.
February PCE Inflation, Thursday 8:30 AM ET
The Fed’s preferred inflation gauge carries consensus forecasts of 0.4% month-over-month and 3.0% year-over-year for core PCE.
Returning to a 3-handle on core PCE is both symbolically and practically significant for rate expectations.
A hotter print above 3.0-3.1% year-over-year would reinforce the higher-for-longer narrative, tightening financial conditions further.
A cooler reading below consensus would boost rate-cut odds and could push BTC 2-5% higher, similar to the February 2026 soft print that lifted BTC roughly 2.75%.
Q4 2025 GDP Final Estimate, Thursday 8:30 AM ET
The third estimate carries a consensus of 0.7% annualized, already sharply revised down from the advance reading of 1.4% and Q3’s strong 4.4%.
Further weakness would signal an economy losing momentum, which paradoxically supports crypto by raising expectations for Fed easing.
GDP surprises typically drive smaller BTC reactions than inflation data, in the range of 1-3%. However, they amplify when they shift policy expectations alongside other releases on the same day.
March CPI, Friday 8:30 AM ET
This is the week’s most anticipated print. Consensus forecasts a headline jump to 3.3% year-over-year and 1.0% month-over-month, up sharply from February’s 2.4%.
That would represent the largest single-month acceleration since the 2022 energy crisis, driven almost entirely by gasoline and energy prices.
Core CPI consensus sits at 0.3% monthly and 2.7% annually. The market reaction hinges on that core figure. If core holds at or below 0.3%, traders will likely treat the headline spike as a transitory energy event.
If core prints 0.4% or higher, the transitory narrative collapses, and rate cuts could get repriced out of 2026 entirely.
Hot CPI prints have consistently pressured BTC short-term through higher rate expectations. Misses spark relief rallies. With expectations already elevated, any deviation in either direction becomes highly market-moving.
What Comes Next
The sequencing matters. Wednesday’s FOMC tone sets up Thursday’s PCE and GDP reaction, which then frames Friday’s CPI interpretation.
A dovish week with soft PCE, weak GDP, and contained core CPI would favor upside for crypto amid renewed liquidity hopes. A hawkish sweep with hot inflation prints risks a leg down toward the $65,000 support that BTC tested earlier in 2026.
Spot Bitcoin ETF flows offer one stabilizing factor. ETFs absorbed approximately 50,000 BTC in March, the highest monthly pace since October 2025.
That institutional bid provides a floor, but overall 30-day apparent demand remains deeply negative as large holders distribute aggressively.
CME shifts and the DXY-BTC correlation will serve as real-time gauges of how each data point reprices rate expectations.
With BTC trapped between institutional accumulation and macro headwinds, this week’s four numbers will likely determine whether April lives up to its historically bullish seasonality or extends Q1’s pain.
The post The Fed’s Next Move Hangs on Four Numbers This Week. What Crypto Traders Must Watch appeared first on BeInCrypto.

Today, the Third Circuit Court ruled in favor of KalshiEX LLC, after the platform sued New Jersey regulators for trying to restrict its federally regulated prediction market operations.
The decision, handed down on April 6, 2026, reinforces the legitimacy of prediction markets and delivers a major boost to the industry.
The Kalshi Case Explained
Back in September 2025, Kalshi brought the case against Mary Jo Flaherty, a New Jersey state regulator, after facing restrictions on its operations at the state level.
Kalshi argued that it is already regulated at the federal level by the Commodity Futures Trading Commission (CFTC).
As a result, it claimed individual states should not have the authority to block or limit its services.
In response, state regulators maintained that prediction markets — particularly those tied to elections — could fall under state laws, including gambling-related restrictions.
This legal clash set up a broader question: whether federally regulated prediction markets can operate freely across the US, or if states can impose their own rules.
Today, the Third Circuit’s decision ultimately sided with Kalshi. It strengthens the argument that federal oversight takes priority in this space.
Fun Fact: Prediction markets have historically outperformed polls in forecasting election outcomes. Studies show they aggregate information more efficiently than traditional polling methods!
Why Prediction Markets Matter
Prediction markets allow users to trade contracts based on the outcome of future events, from elections to economic indicators. Unlike traditional betting, these markets are designed to aggregate information and reward accurate forecasting.
Proponents argue that prediction markets offer several advantages over conventional information sources:
- Transparency: Prices reflect real-time collective expectations, visible to everyone.
- Accuracy: Participants have financial incentives to be correct, not just persuasive.
- Fairness: Anyone can participate and benefit from accurate predictions.
Critics, however, have raised concerns about potential manipulation and the blurring of lines between financial markets and gambling. Regulatory agencies have taken different positions on where prediction markets should fit within existing legal frameworks.
What the Kalshi Ruling Means
The Third Circuit’s decision reinforces that prediction markets can operate within constitutional boundaries. For Kalshi, this means continued legal footing to expand its platform and offerings.
For the broader industry, the ruling sends a signal that courts are willing to recognize prediction markets as legitimate financial instruments rather than gambling operations.
Millions of users who rely on prediction markets for information and hedging now have greater certainty about the legal status of these platforms. As a result, the decision could accelerate institutional adoption and innovation in the space.
The prediction market industry just got its strongest legal endorsement yet.
The post Kalshi Wins: Third Circuit Delivers Prediction Market Victory appeared first on BeInCrypto.
Plymouth family’s heartbreaking warning after mum, 37, told mole was ‘nothing to worry about’

Is Claude Down Now? Claude AI Hit by Login and Elevated Error Issues as Users Report Problems on Busy Monday
Circle Unveils Arc Roadmap With Phased Quantum-Resistant Blockchain Security Plan

Smart energy pays enters the US market, targeting scalable financial infrastructure

Why Israel is blocking foreign journalists from entering

Bitcoin: We’re Entering The Most Dangerous Phase

‘THIS NEVER MADE SENSE TO ME’: Ripple CEO BLASTS Biden admin’s war on crypto

#shorts+@dreamreelspsk. Mr. Boss Cat Meme 7 . Elevate Personal Financial Literacy Story Visuals

How to start crypto trading sinhala – Binance trading sinhala for beginners – cryptocurrency sinhala
-

 NewsBeat4 days ago
Steven Gerrard disagrees with Gary Neville over ‘shock’ Chelsea and Arsenal claim | Football
-

 Business4 days ago
No Jackpot Winner and $194 Million Prize Rolls Over
-

 Fashion3 days ago
Weekend Open Thread: Spanx – Corporette.com
-

 Crypto World5 days ago
Gold Price Prediction: Worst Month in 17 Years fo Save Haven Rock
-

 Business23 hours ago
Three Gulf funds agree to back Paramount’s $81 billion takeover of Warner, WSJ reports
-
Crypto World6 days ago
Dems press CFTC, ethics board on prediction-market insider trades
-

 Sports2 days ago
India men’s 4x400m and mixed 4x100m relay teams register big progress | Other Sports News
-

 Business5 days ago
Login and Checkout Issues Spark Merchant Frustration
-

 Tech7 days ago
EE TV is using AI to help you find something to watch
-

 Sports6 days ago
Tallest college basketball player ever, standing at 7-foot-9, entering transfer portal
-
Tech7 days ago
Daily Deal: StackSkills Premium Annual Pass
-

 Tech7 days ago
Flipsnack and the shift toward motion-first business content with living visuals
-

 Sports7 days ago
Women’s hockey camp eyes fitness boost, tactics ahead of WC 2026 campaign | Other Sports News
-

 Crypto World7 days ago
U.S. rule change may open trillions in 401(k) funds to crypto
-

 Tech7 days ago
How to back up your iPhone & iPad to your Mac before something goes wrong
-

 Politics7 days ago
Usha Vance: Disney Hats Over MAGA Caps?
-
Crypto World7 days ago
Valinor raises $25m to put private credit on-chain
-

 Business7 days ago
Functional benefits brewing in coffee innovation
-

 Tech7 days ago
What Are The Biggest Limitations Of Supercomputers?
-

 Crypto World6 days ago
Bitcoin enters the public bond market as Moody’s gives a first-of-its-kind crypto deal a rating
You must be logged in to post a comment Login