
Crypto World
Ethereum price breakout risks pullback with RSI at 86

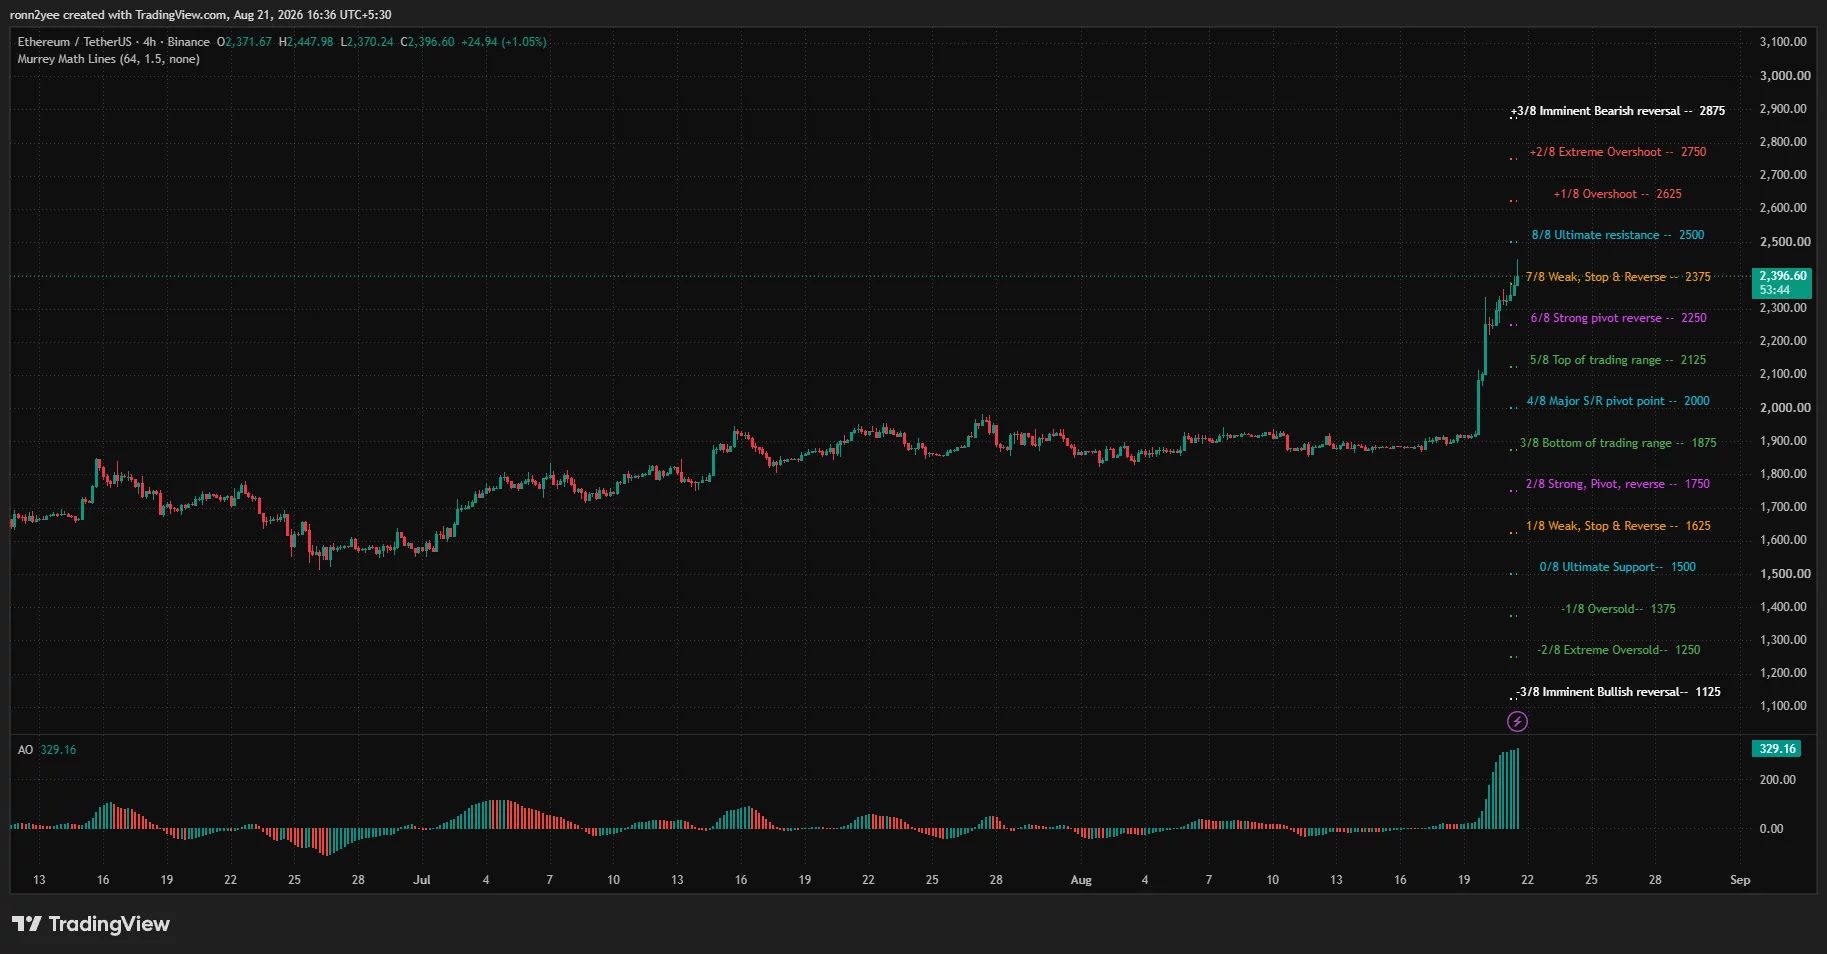
Ethereum price climbed 3% to about $2,397 on Aug. 21 after reaching an intraday high near $2,448, extending a breakout driven by ETF inflows, short liquidations and stronger risk appetite.
Summary
- Ethereum price reached $2,448 after gaining more than 20% over the past week.
- US spot Ether ETFs attracted $189 million on Aug. 19, their largest inflow since October.
- The daily RSI reached 86, placing ETH deep inside overbought territory.
- A weekly close above $2,450 could expose the $2,500 and $3,000 levels.
Ethereum price action today
According to data from crypto.news, Ethereum (ETH) price opened at $2,327 on Aug. 21 before climbing to $2,448 and settling near $2,397 at the time of writing. The 3% daily increase followed a much larger move that carried ETH from below $2,000 to more than $2,300 within two sessions.
The rally pushed Ethereum through several levels that had limited gains since April, including the $2,000 psychological barrier and the $2,250 resistance area. ETH also cleared the $2,375 Murrey Math level on the 4-hour chart, although the price was struggling to hold above it after its rejection near $2,450.
Momentum remained strong on the shorter timeframe. The 4-hour Awesome Oscillator rose to 329.16 and printed an expanding series of green bars, indicating that upward momentum had not yet weakened meaningfully.
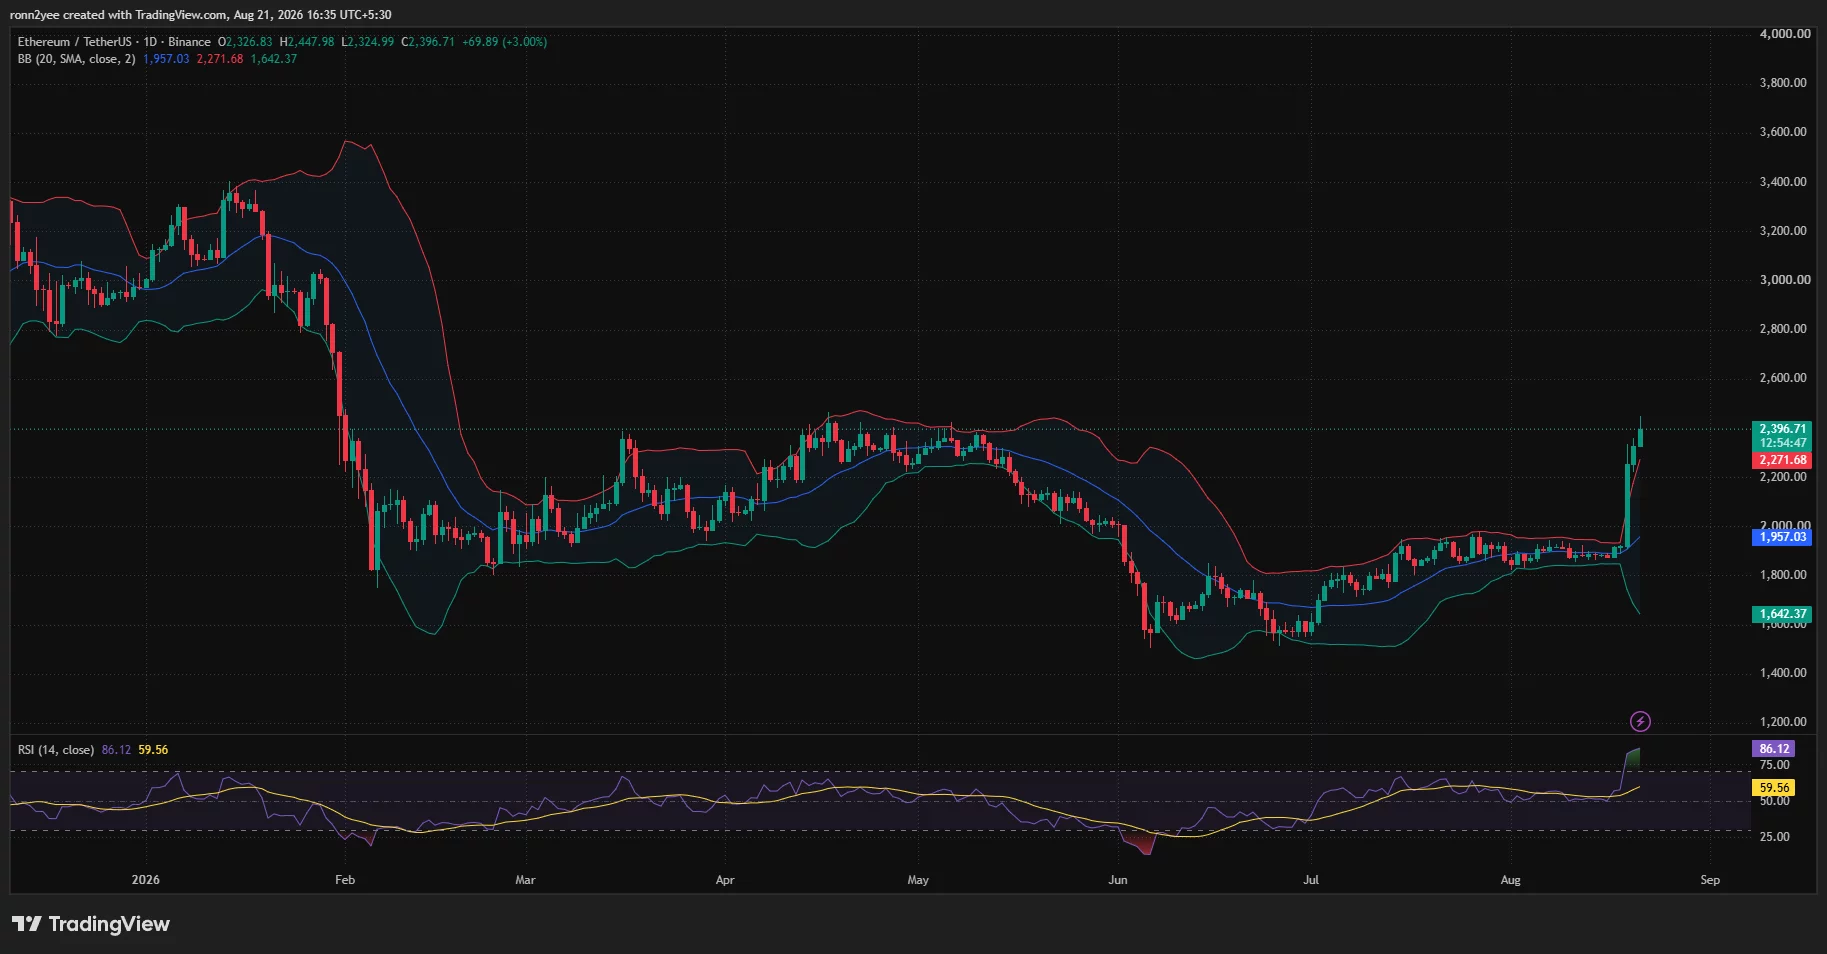
However, the daily chart showed that ETH had moved far outside its previous trading range. The price was trading about 5.5% above the upper Bollinger Band at $2,272, while the indicator’s middle band remained near $1,957.
What is driving the Ethereum rally?
US spot Ether ETFs recorded $189 million in net inflows on Aug. 19, their strongest daily intake since October 2025, according to SoSoValue data. BlackRock’s ETHA accounted for about $122 million of that total.
The ETF purchases arrived as Ethereum broke above $2,000, forcing traders with leveraged short positions to close their bets. CoinGlass data cited by Invezz showed that more than $1 billion in Ether shorts were liquidated during the initial breakout, contributing to a wider crypto liquidation event that exceeded $3 billion.
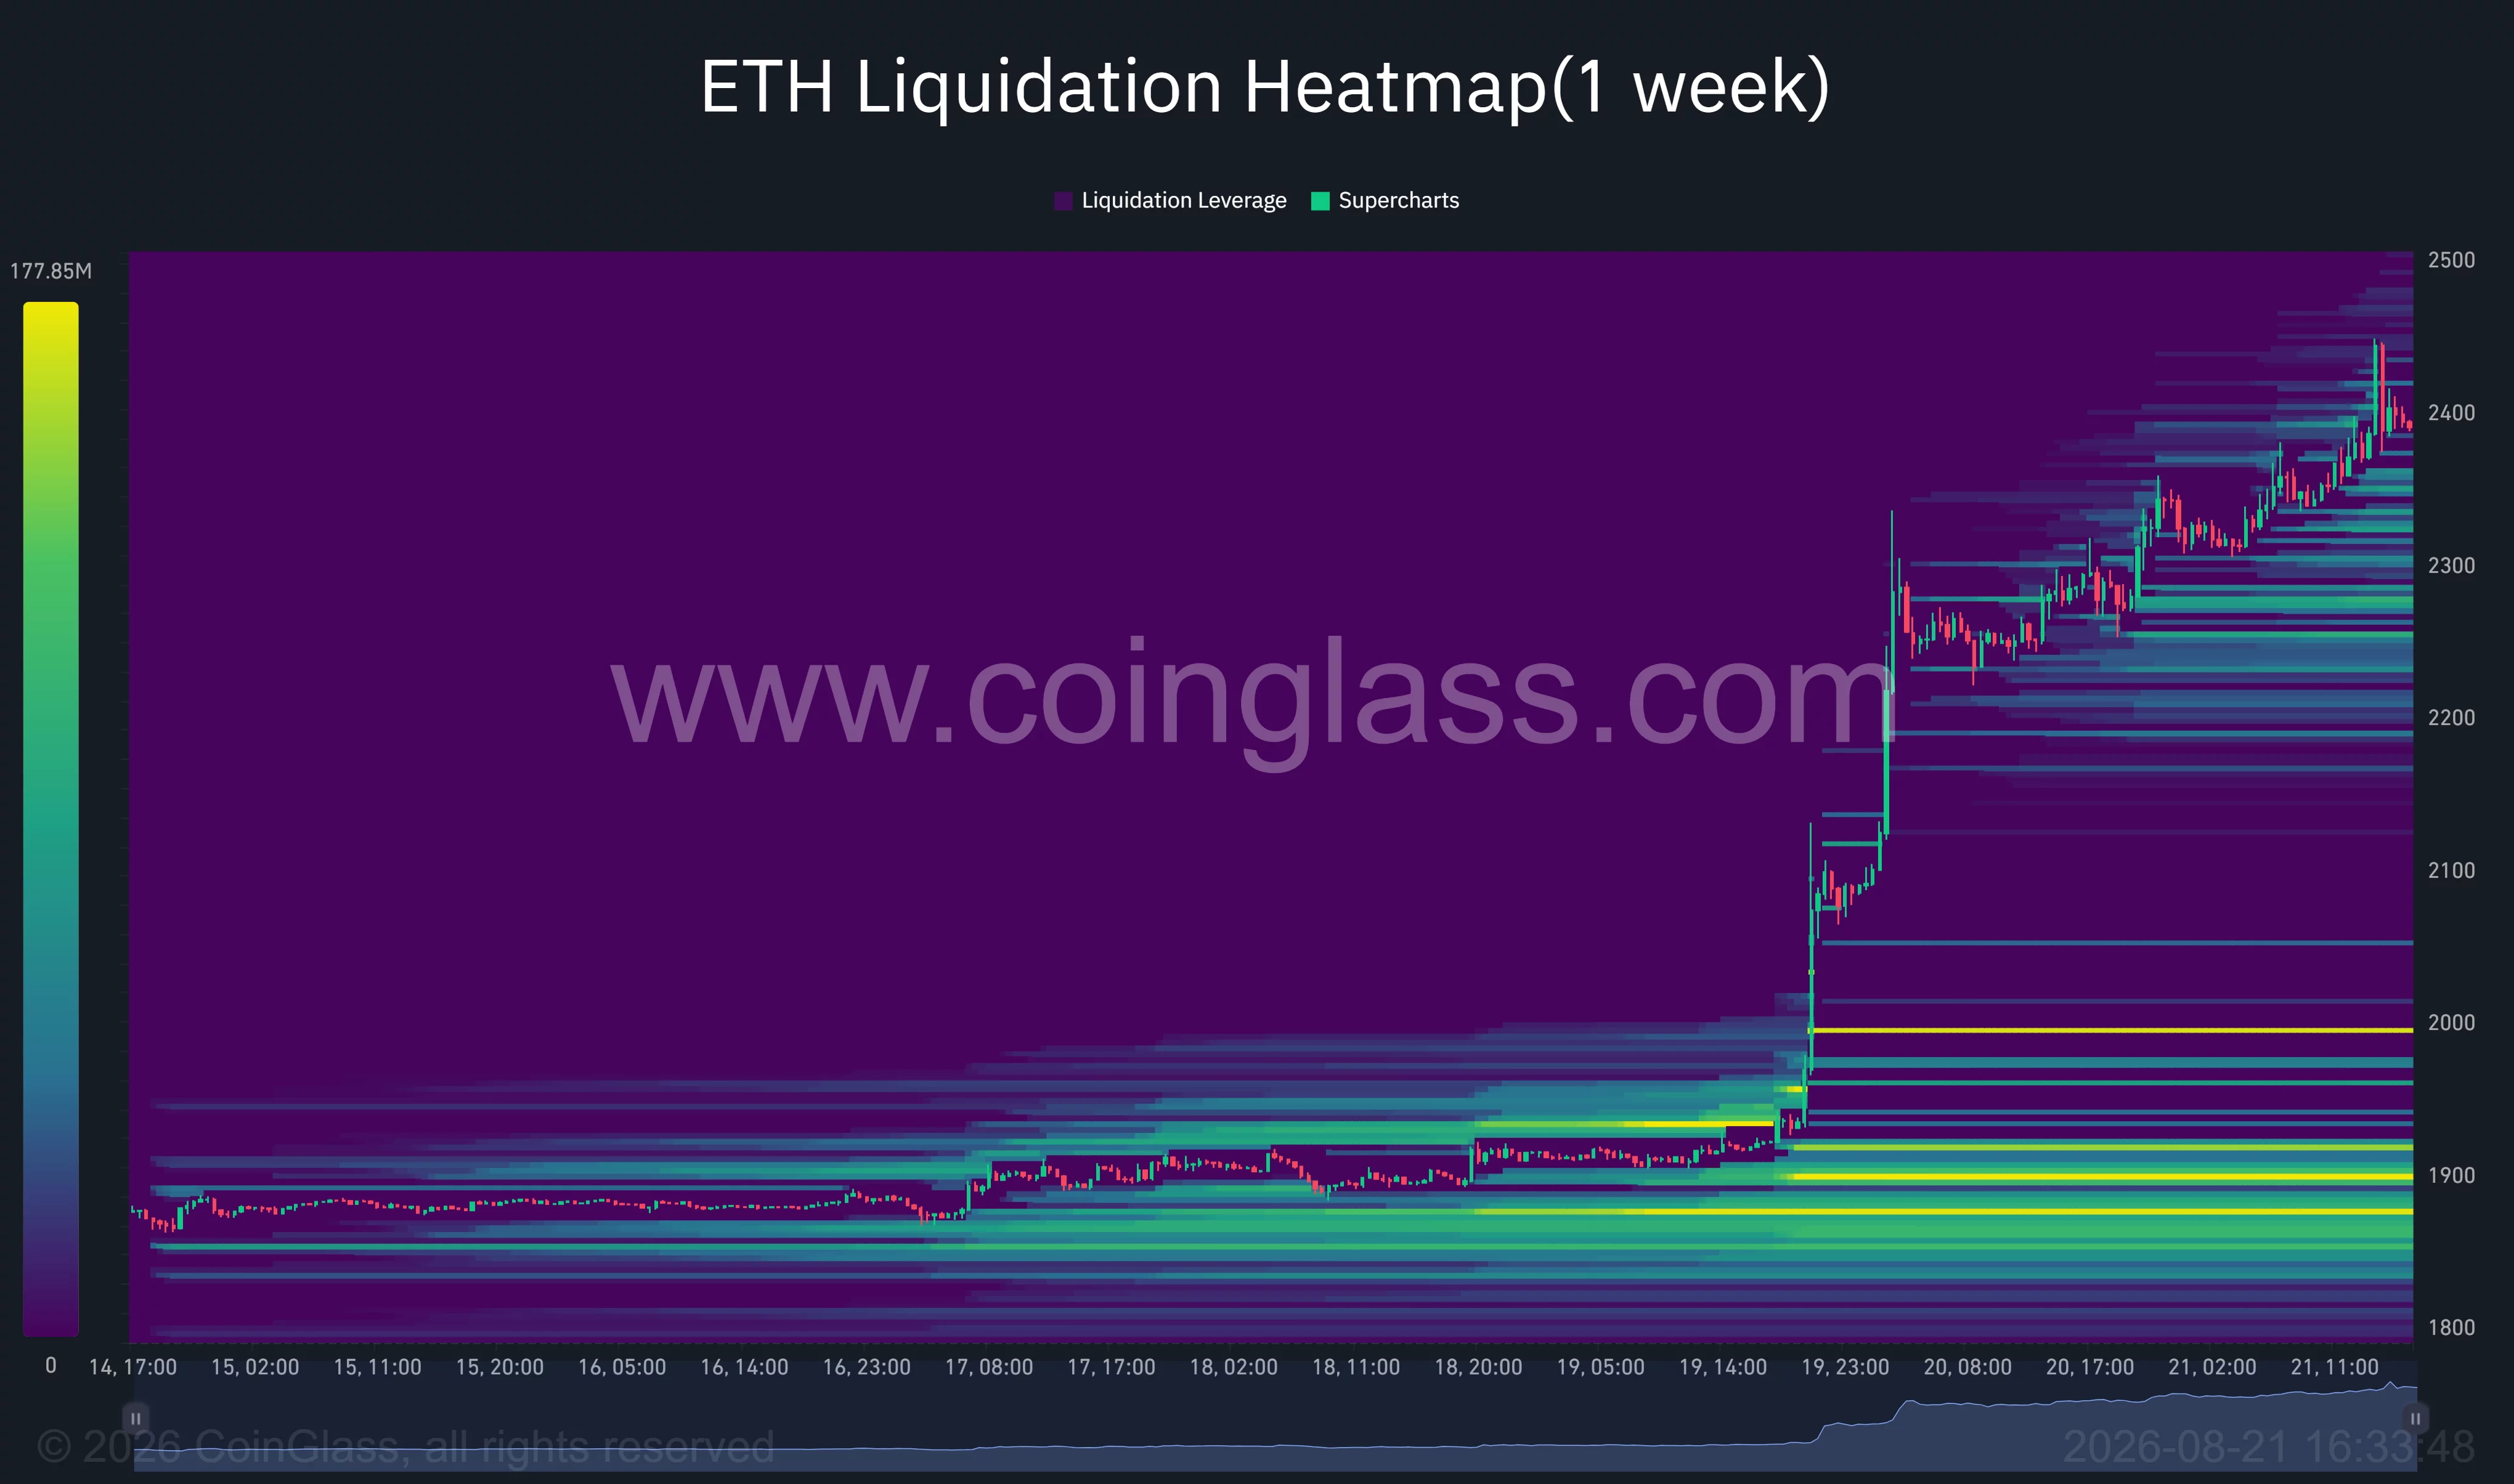
The supplied one-week CoinGlass heatmap shows how ETH moved rapidly through liquidation clusters between $1,900 and $2,300. Forced purchases associated with short liquidations likely added to the speed of the advance, although the breakout also coincided with new spot demand from US-listed funds.
Macro conditions provided another catalyst after the US Treasury announced that it would at least double the maximum size of buybacks for longer-dated nominal securities from $2 billion to $4 billion per operation. The change will begin on Sept. 9 and remain in place through Nov. 4.
Investors interpreted the announcement as support for bond-market liquidity. Treasury yields and the US dollar subsequently weakened, helping Bitcoin, Ethereum, and other risk assets extend their gains.
Ethereum faces overbought signals below $2,500
Ethereum’s immediate resistance sits between $2,448 and $2,500. The lower boundary marked the Aug. 21 intraday high, while the Murrey Math chart identifies $2,500 as the next major resistance level.
A sustained break above $2,500 could expose $2,625, followed by $2,750. The chart places stronger reversal risk near $2,875, although ETH would need additional demand to reach those levels after such a steep move.
Daily momentum presents the main short-term risk. Ethereum’s 14-day relative strength index jumped to 86.12, well above the 70 level commonly associated with overbought conditions. The reading does not guarantee a reversal, but it shows that prices have advanced much faster than their recent trend.
The CoinGlass heatmap identifies nearby liquidation concentrations between approximately $2,270 and $2,350. A failure to clear $2,450 could therefore send ETH back toward $2,375, followed by the $2,300–$2,250 area.
The $2,000 level remains the larger breakout support. The daily Bollinger Band midpoint near $1,957 and a dense heatmap cluster around $1,990 strengthen that zone, although a decline that deep would erase much of the latest advance.
Analysts watch the $2,450 weekly close
Crypto analyst Ted Pillows identified $2,450 as Ethereum’s next resistance zone. He said a weekly close above that area could open a move toward $3,000, making the upcoming close important for confirming whether the breakout can continue.
Market analyst Rain said ETH gained 17.1% during the initial daily surge and pushed its weekly advance beyond 20% after clearing resistance between $1,980 and $2,000. Rain also reported that 30-day realized volatility rose from 39.6 to 62.6 in one day, showing how quickly the earlier compression ended.
Rain said Ethereum must now prove that $2,000 can function as support. Holding well above that level would preserve the new market structure, while a deeper reversal would suggest that liquidations contributed more to the move than sustained spot demand.
US regulation adds to Ethereum’s market catalyst
The rally also followed the SEC’s Regulation Crypto Assets proposal, published on Aug. 18. The proposed framework would introduce tailored registration exemptions for certain investment contracts involving crypto assets, including fundraising exemptions of up to $75 million annually.
The proposal has not become law and does not change Ethereum’s regulatory status immediately. However, the SEC said it aims to give crypto issuers clearer pathways under federal securities laws, adding to the improved regulatory backdrop for US investors.
Ethereum’s next move now depends on whether ETF demand and spot buying can absorb profit-taking near $2,450. A confirmed breakout would bring $2,500 into focus, while rejection could produce a cooling period toward $2,375 or $2,300 as the overbought daily RSI resets.
Disclosure: This article does not represent investment advice. The content and materials featured on this page are for educational purposes only.

XRP is up 20% in the past 24 hours, and it gives no signs of stopping!
Ripple (XRP) Price Predictions: Analysis
Key support levels: $1, $1.3
Key resistance levels: $1.6, $2
Bulls Return with a Vengeance
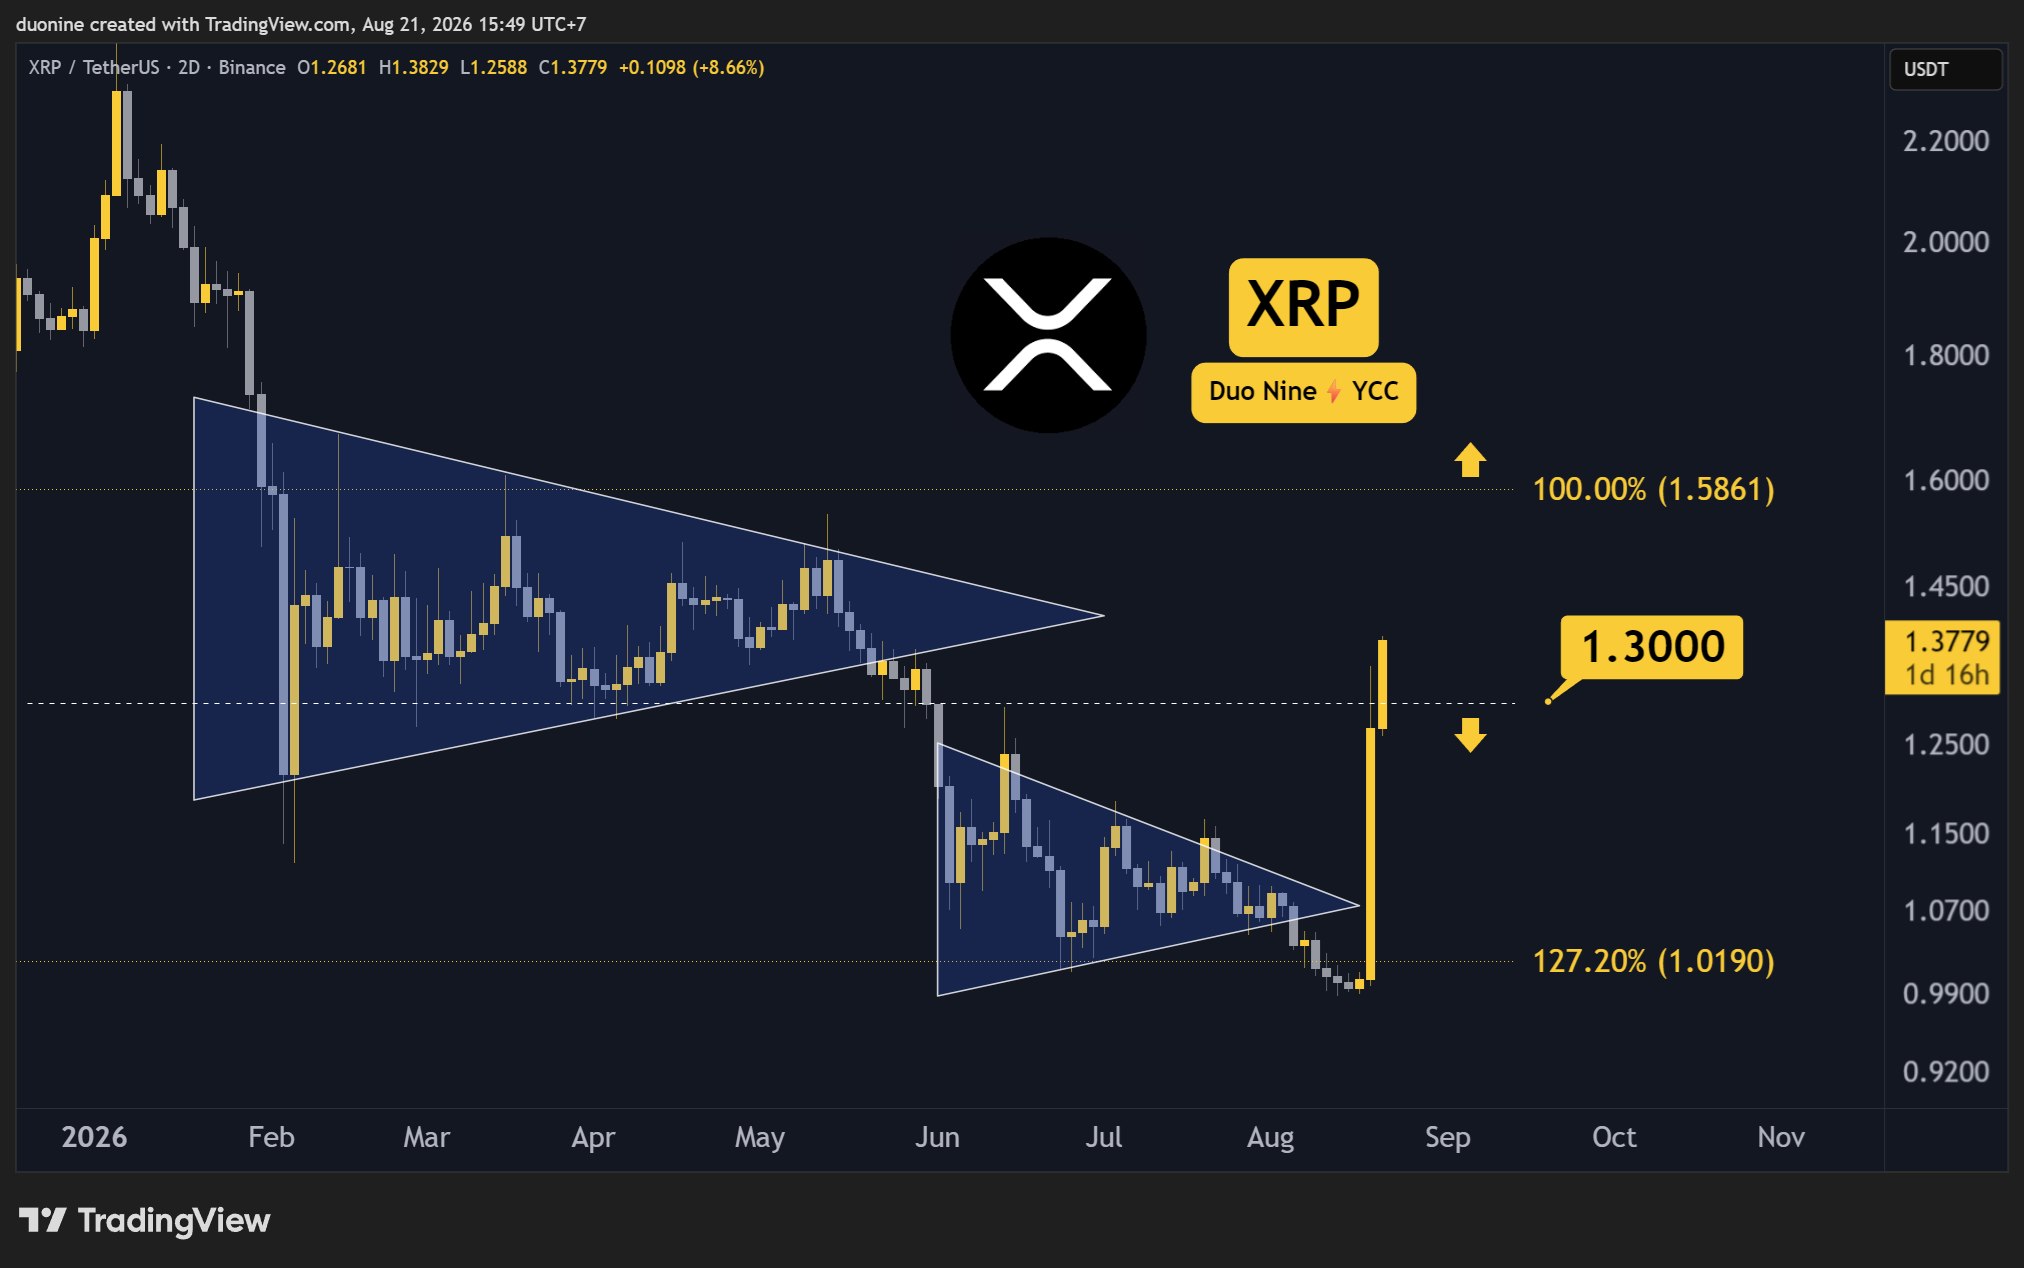
In an unexpected move, XRP has rallied by over 20% in the past 24 hours. This comes after the price nearly lost its support at $1. The ongoing rally is market-wide, and XRP has made the best of this opportunity.
At the time of this post, the price has just moved past the resistance at $1.3, which is likely to act as key support. If the rally is sustained, then the next major target is found at $1.6.
Buy Volume Explodes
After months of consolidation just above $1, buyers are finally back, and the volume has spiked to levels not seen since the February crash. The difference now is that buyers are dominating instead of sellers.
This rally is very strong and has erased most of the losses since the start of the year. If it can manage to claim $1.6 as well, then XRP will make a higher high and officially end its downtrend.

Daily RSI Enters Overbought Zone
This very aggressive buying has pushed the daily RSI above 80. That places it in the overbought area and signals caution for late buyers. Most of the move could be behind us even if XRP does eventually hit $1.6.
Whatever happens going forward, XRP has already made a big statement that could turn the price action bullish for the remainder of the year. Ideally, this cryptocurrency will consolidate and confirm the recent gains before going higher.

The post Important Ripple (XRP) Price Update: August 21st appeared first on CryptoPotato.

XRP price is changing hands at $1.3, up 18% on the day, extending a violent 22% rally that carried the token to $1.26 in a single 24-hour window days earlier, shrugging off bearish prediction. But what’s driving it, and more importantly, where does the smart money rotate once the easy gains are booked?
The rally wasn’t XRP-specific. It traces back to two August 19 announcements: the U.S. Treasury doubling its longer-term bond buyback program to inject market liquidity, and President Trump reiterating his push to make the U.S. a Bitcoin superpower while pressing Congress to pass the CLARITY Act.
Following all the catalysts, the total crypto market cap responded with an 8% jump to $2.5 trillion in 24 hours. XRP simply rode the wave harder than most large-caps.
That macro tailwind explains the spike, but it doesn’t answer whether XRP holds these levels or gives them back. The technical picture underneath the headline number tells a more complicated story.
Discover: The Best Crypto to Diversify Your Portfolio
XRP Price Prediction: Hit $1.50 This Week?
XRP printed an intraday high of $1.32 in the 24-hour session that shook out short leveraged positions. Recent rally analysis points to resistance clustering near $1.30–$1.34, the exact zone price is testing now, while support has shifted up to $1.10–$1.00 after repeated tests of the psychological $1 level earlier this month.
Momentum data, however, shows downside risk toward $0.62 if momentum fails, while Standard Chartered maintains a longer-term $2.8 target, a split that underscores how unsettled sentiment remains even mid-rally.

- Bull case: a clean break and hold above $1.34 opens room toward $1.60–$1.80.
- Base case: consolidation between $1.10 and $1.30 while the market digests the move.
- Bear case: a fade back below $1.10 invalidates the breakout thesis and re-tests $1.00.
Wave-count analysis suggests the reclaimed $1 level needs to hold as a floor for any of the bullish targets to stay credible.
Trade XRP Market on Kalshi and Get a $25 Signing-up Bonus
Bitcoin Hyper Targets Early Mover Upside as XRP Tests Key Levels
A 22% pop validates anyone who bought the dip below $1. But XRP is a multi-billion-dollar asset now, and a repeat of that percentage gain from here requires enormous capital inflow, not just sentiment.
That math is exactly why traders chasing outsized returns increasingly look toward earlier-stage infrastructure plays where the market cap ceiling hasn’t been tested yet. Some of that rotation lands on Ripple’s broader valuation story; some of it lands on presales building the next layer of crypto infrastructure entirely.
Bitcoin Hyper ($HYPER) is positioning itself as the first Bitcoin Layer 2 with native SVM integration, smart contract execution at speeds it claims outpace Solana itself, while settling back to Bitcoin’s base layer for security.
The presale is priced at $0.013685 and has raised $33 million so far, with staking rewards on offer for early participants. The pitch: solve Bitcoin’s slow, expensive, non-programmable core through a decentralized canonical bridge and low-latency execution layer.
Traders can research Bitcoin Hyper directly before the round progresses further.
Discover: The Best Token Presales
The post XRP Price Prediction: 22% Rally, But Ripple Still is Undervalued appeared first on Cryptonews.


Cointelegraph is committed to providing independent, high-quality journalism across the crypto, blockchain, AI, and fintech industries.
All news, reviews, and analyses are produced with full journalistic independence and integrity. For more details on our standards and processes, please read our Editorial Policy.
Ethereum has staged a sharp breakout from its multi-week consolidation, with ETH now trading around $2.4K after reclaiming the descending trendline that had capped the broader recovery. The move is supported by a strong acceleration in momentum and a noticeable rise in short liquidations, although the sharp increase in RSI readings suggests the rally could become vulnerable to a near-term pullback.
Ethereum Price Analysis: The Daily Chart
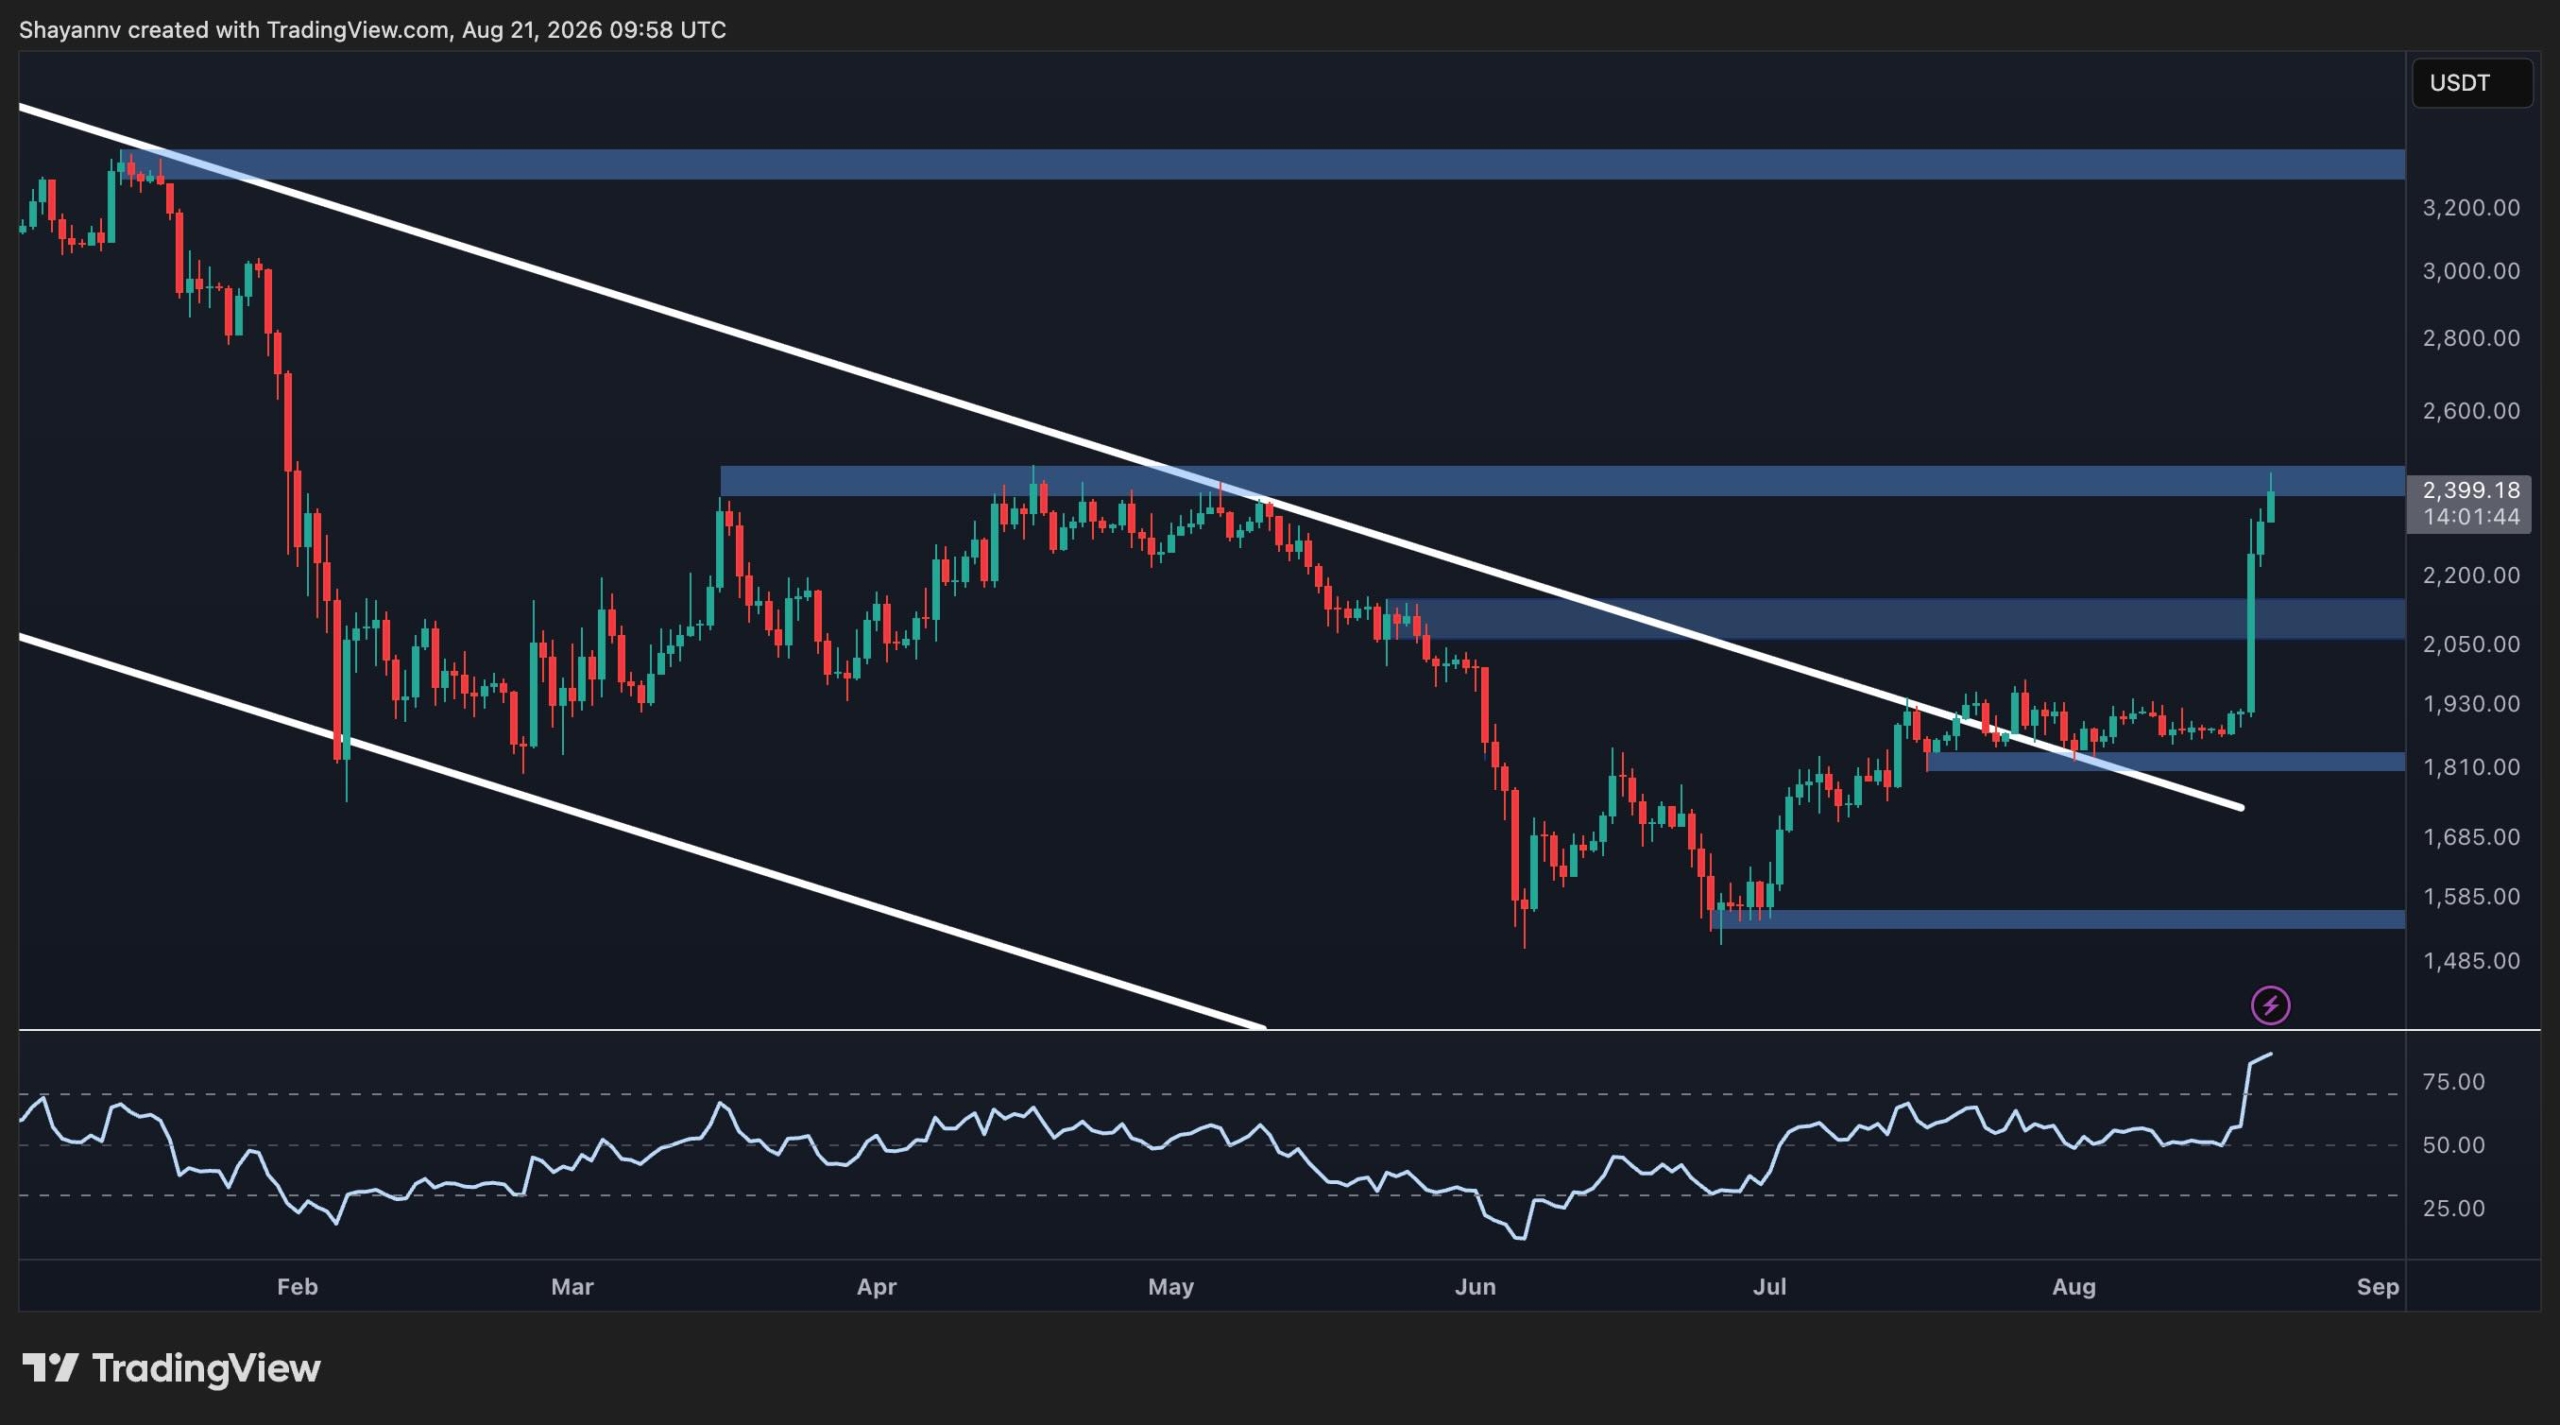
On the daily chart, ETH has decisively broken above the descending trendline that had been in place for months. The breakout is particularly significant because the price had spent several months consolidating below that resistance while forming higher lows from the June bottom near $1.5K.
The latest surge has carried ETH directly into the $2.1k resistance level, with the price currently testing the $2.4K supply zone. This area represents the immediate test for the breakout. A sustained daily close above the zone would strengthen the bullish structure and could open the way toward $3K and potentially higher.
On the downside, the former breakout area around $2.1K is now the first major support zone. Holding above it would keep the recent breakout structure intact. Below that, the $1.8K region represents another important support area, while the $1.5K zone remains the deeper structural floor.
Momentum has also shifted sharply in favor of the buyers. The daily RSI has jumped above 75, running deep into the overbought area. This does not necessarily invalidate the breakout, particularly during a strong expansion move, but it does increase the probability of consolidation or a retest before another sustained leg higher.
ETH/USDT 4-Hour Chart
The 4-hour chart provides an even clearer picture of the breakout. ETH spent much of the last few months moving sideways before suddenly breaking above the short-term mildly ascending channel and the $2.1K resistance zone.
The breakout was followed by an almost vertical advance toward $2.4K, indicating strong short-term momentum. The $2.1K zone is therefore the key area to watch if the rally starts to retrace. A successful retest of this region as support would provide a healthier confirmation of the breakout.
As observed on the daily chart, the next major resistance sits around $2.4K, where ETH is currently trading. A decisive move above this zone could extend the advance toward higher levels in the upcoming weeks. At the same time, the 4-hour RSI has surged far above 80 and is moving sideways in this region.
That reading highlights just how stretched the immediate move has become. A pullback toward $2.1K would therefore not necessarily be bearish and would likely be necessary for the market to cool down, provided ETH maintains the breakout zone.

Sentiment Analysis
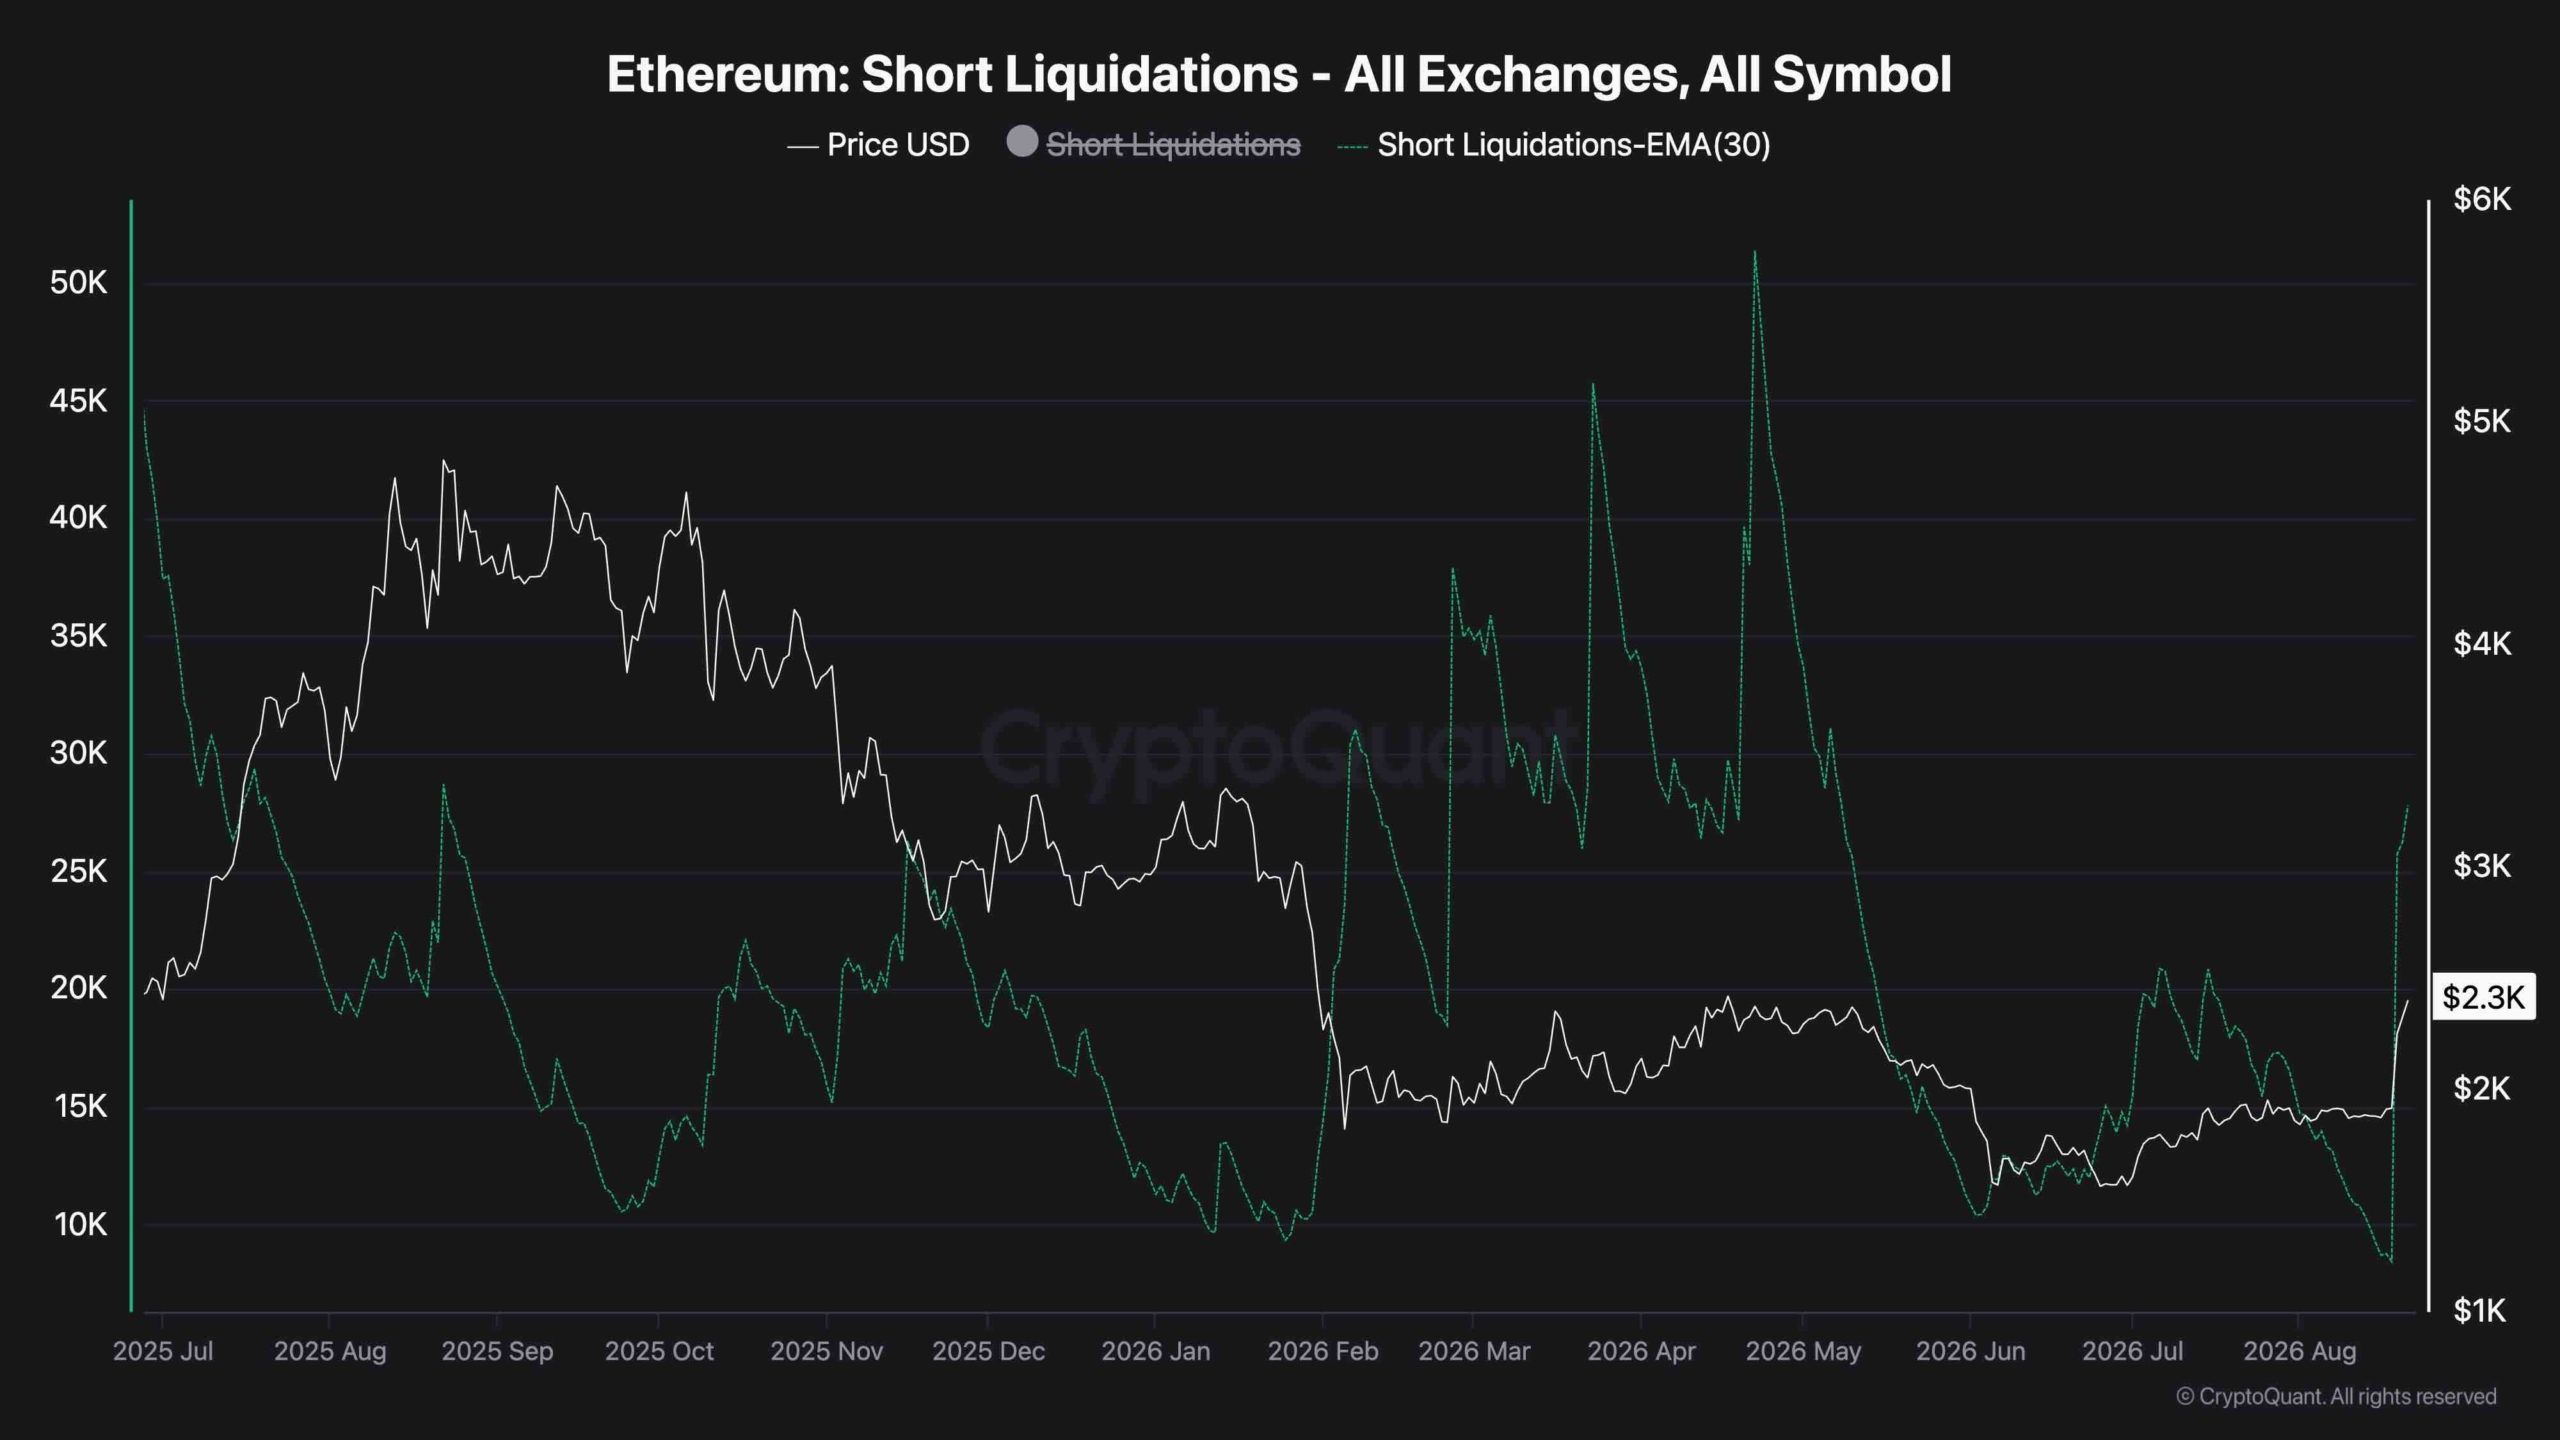
The liquidation chart shows a clear increase in Ethereum short liquidations alongside the latest price surge. Short liquidations have risen sharply toward roughly 28K on the latest spike, following a period in which the metric had remained comparatively subdued.
This suggests that the move above $2K has forced a growing number of bearish positions to close, adding forced buying pressure to the rally. In other words, the breakout appears to have developed a short-squeeze component.
However, the latest liquidation spike is still below several of the much larger liquidation events visible earlier in the chart, including episodes above 40K and 50K. That indicates the current squeeze has been significant but has not yet reached the most extreme levels seen during previous Ethereum rallies.
Overall, the charts favor a bullish interpretation as long as ETH holds the newly reclaimed $2K-$2.1K area. The immediate challenge is whether buyers can sustain momentum above the $2.4J resistance zone. With both the daily and 4-hour RSI heavily overbought and short liquidations accelerating, a temporary cooldown would be unsurprising, but the breakout structure remains constructive unless ETH loses its key support zones.
The post Ethereum Price Prediction: Has ETH Opened the Door to $3K After the Latest Breakout? appeared first on CryptoPotato.


- Flowra launches an open auction for Solana blockspace and MEV.
- Early tests showed a 20.6% increase in compute units per block.
- Programmable policies give Solana validators more control over blocks.
Flowra has launched an Open Orderflow Auction (OOA), a new block-building framework for Solana designed to introduce greater competition into the network’s maximal extractable value (MEV) market and potentially increase validator revenue.
The Seoul-based blockchain infrastructure company said the system allows registered searchers to compete for transaction inclusion through a transparent auction instead of relying on closed orderflow channels.
Flowra said the approach could improve price discovery while allowing validators to capture more of the value generated by MEV.
Flowra opens Solana block building to competition
The Open Orderflow Auction is intended to create an open marketplace for Solana blockspace, allowing searchers to compete through bids for transaction inclusion.
Flowra’s approach is inspired by competitive block-building models that have emerged on Ethereum.
The company said open bidding on Ethereum has contributed to higher proposer revenue and believes Solana’s high throughput and low-latency architecture could support a similar model.
In early testing on a single validator, a Flowra-enabled setup increased compute units per block by 20.6%.
The validator moved from 84% of the network average to 101%, according to the company.
Flowra also reported higher block fees than comparable validator software, alongside 100% block production and 99.999% block engine uptime during the test.
The results are based on early testing rather than a broader network-wide deployment.
Programmable policies give validators more control
Alongside the auction system, Flowra is introducing Programmable Block Policy, which allows validators to establish their own transaction inclusion policies at the block-building layer.
The company said the feature is designed to provide validators with greater operational flexibility, including the ability to meet regulatory and institutional compliance requirements without modifying the underlying Solana protocol.
Flowra recently announced a collaboration with compliance infrastructure provider Honeypot to bring sanctions and risk screening to this layer.
According to Flowra CEO Harry Hwang, Solana’s technical performance has helped make it a leading blockchain network, but its MEV market remains concentrated.
“By opening block building to transparent competition, we’re creating a more efficient market for blockspace,” Hwang said. He added that the system would give validators greater control over block construction while providing verifiability and auditability.
The company’s architecture separates these block-building policies from changes to the underlying network protocol, according to the announcement.
Flowra targets institutional validators
Flowra is currently onboarding institutional-grade validators to its Open Orderflow Auction, with a broader rollout planned as participation in the Solana ecosystem expands.
The OOA is now available to validators and searchers participating in the Solana ecosystem, although the company did not provide details on the number of participants currently using the system.
Flowra describes itself as a blockchain infrastructure company focused on validator and orderflow solutions for Solana. Its products include validator infrastructure, delegation programs and MEV-related technologies.
The company said its broader objective is to improve transaction transparency, value distribution and incentive alignment among validators, users and builders.
The launch comes as Flowra seeks to apply a more market-based approach to Solana’s block-building process.
Its initial testing suggests potential improvements in block utilization and validator fees, while the Programmable Block Policy adds a mechanism for validators to customize transaction inclusion.
The broader impact of the system will depend on adoption among validators and searchers as Flowra expands its rollout across the Solana ecosystem.
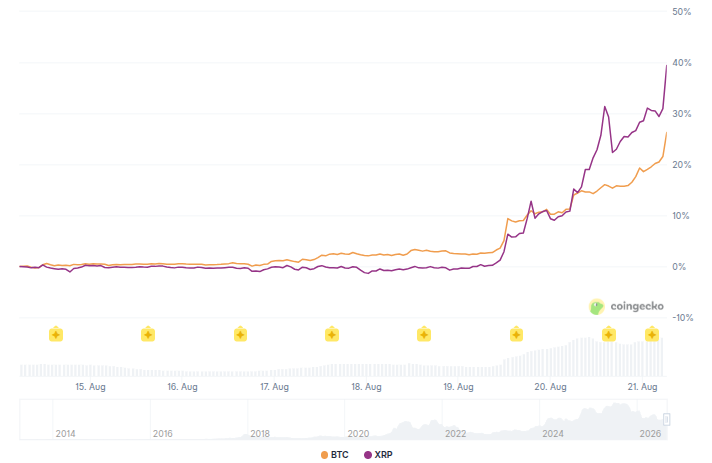
Bitcoin and XRP are surging toward their strongest weekly closes since 2024, powered by a historic short squeeze and a wave of supportive policy signals from Washington.
On-chain data now adds another layer, hinting this rally could mark more than a temporary bounce.

Bitcoin and XRP Surge as On-Chain Data Flashes a Rare Bottom Signal
The MVRV ratio compares Bitcoin’s current market value to its realized value, the average price at which coins last moved. Sharp vertical rises in this metric have historically preceded major cycle bottoms.
Bitcoin trades above $79,000, up roughly 25% over the past seven days and more than 13% in the last 24 hours, according to BeInCrypto data. Analysts called this the biggest weekly gain since February 2024, adding approximately $280 billion to market capitalization in under five days.
CryptoQuant analyst Crypto Dan flagged the MVRV signal as notable. He described the rebound as the first powerful signal in this bear cycle, echoing patterns seen at the end of previous downcycles.
“Bitcoin’s recent rebound is a signal that has emerged for the first time in this Bear cycle. The MVRV indicator, which measures Bitcoin’s present valuation, is showing a vertical rise. This signal is the very movement that appeared as the bottom range came to an end in every past downcycle. suggesting that the possibility of the market turning from decline to ascent is growing,” Crypto Dan said. Bitcoin (BTC).
Follow us on X to get the latest news as it happens.

XRP outperformed even more dramatically. The token changed hands near $1.40, up about 31% on the week and more than 18% for the day, after hovering near or below $1 just days earlier. Analysts called this XRP’s strongest week since November 2024.
A historic short squeeze drove most of the move. Billions in leveraged bearish positions were liquidated as prices broke higher, forcing sellers to buy back coins and accelerating the rally.
The US Treasury doubled long-term bond buybacks, while President Trump voiced support for the CLARITY Act at a White House meeting.

What Comes Next for Bitcoin and XRP?
Technical analysts are watching key levels closely. Trader Ted pointed to Bitcoin’s powerful weekly candle, which has smashed through multiple resistance zones.
The next major test lies between $78,000 and $80,000, and a successful reclaim could signal the end of the bearish structure that has dominated since late 2025.
For XRP, analyst ChartNerdTA emphasizes the weekly 20 and 50 EMAs, which are currently trading between roughly $1.20 and $1.50.
A sustained reclaim of those moving averages would mark a genuine macro bullish shift, while failure to hold above them could trigger consolidation or a deeper pullback toward longer-term support.
The short-term momentum looks undeniable, though the market remains volatile. Traders will watch whether the rally transitions from squeeze-driven gains into sustained organic demand, particularly through ETF flows and continued on-chain activity.
A healthy consolidation after such a sharp move would not be unusual and could set the stage for the next leg higher.
Both assets have reminded the market how quickly sentiment can reverse when catalysts align. The coming days will reveal whether this breakout marks the start of a durable recovery or a temporary relief rally.
Subscribe to our YouTube channel to watch leaders and journalists provide expert insights.
The post Bitcoin and XRP Head for Strongest Weekly Close Since 2024: What’s Next? appeared first on BeInCrypto.
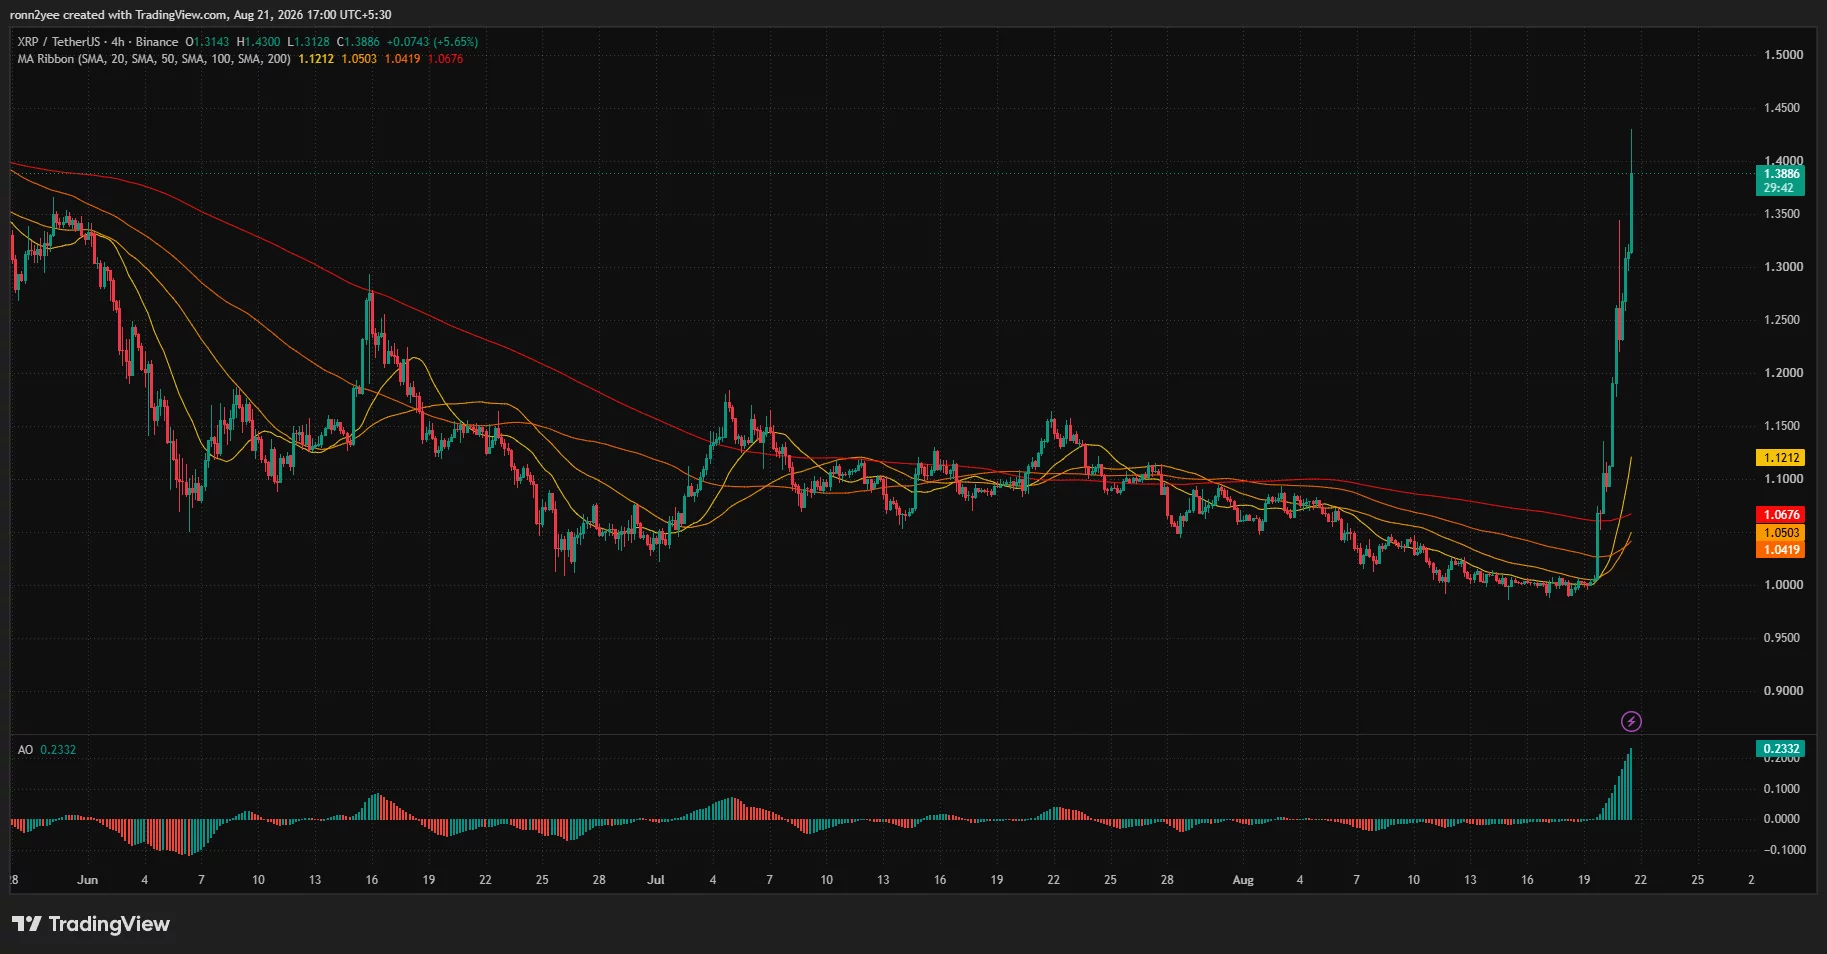
XRP price extended its breakout above $1.40 on Aug. 21 as regulatory optimism, whale accumulation and forced short covering lifted the token from its recent $1.00 floor.
Summary
- XRP price climbed roughly 20% in 24 hours and reached an intraday high of $1.43.
- Whales accumulated more than 300 million XRP over 96 hours, according to Ali Charts.
- The daily Supertrend turned bullish at $1.14 as Chaikin Money Flow rose to 0.17.
- Liquidation data places the next major pocket of leveraged positions between $1.43 and $1.48.
XRP price action today
According to data from crypto.news, XRP (XRP) price was trading near $1.39 at the time of writing after reaching $1.43. The token gained about 20% over the previous 24 hours, with its daily candle up 9.5% from an opening price of $1.27.
The move marked a sharp reversal from the decline that pushed XRP to approximately $0.99 earlier this week. Buyers first reclaimed $1.10 before driving the price through resistance between $1.18 and $1.26.
Breaking that band accelerated the rally because XRP had traded below it since its June sell-off. The token also cleared its May and July swing highs, ending a sequence of lower highs visible on the daily chart.
The 4-hour chart shows that XRP reached $1.43 before pulling back toward $1.31 and then recovering. Buyers defended the dip, allowing the token to return to the upper $1.30 range.
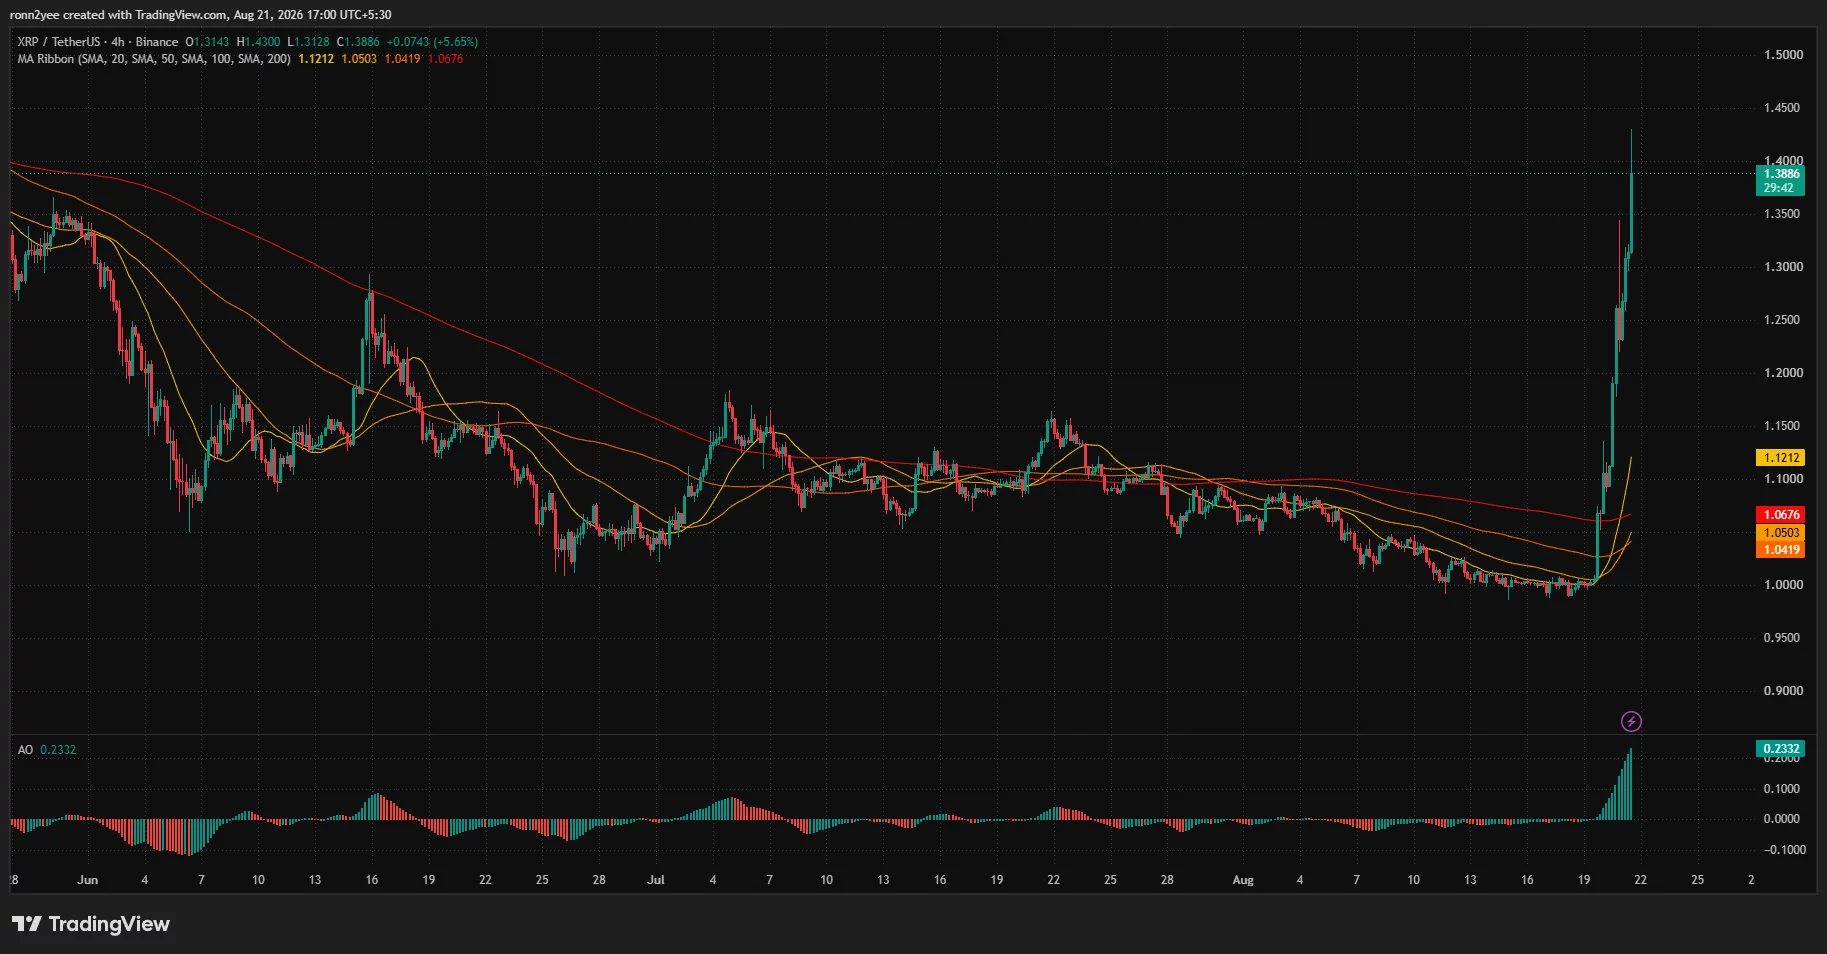
Momentum has expanded with the rally. The 4-hour Awesome Oscillator rose to 0.2332, its highest reading on the displayed chart, showing that short-term buying pressure remains stronger than the recent price trend.
What is driving the XRP rally?
The recovery followed President Donald Trump’s Aug. 19 meeting with crypto executives, including Ripple CEO Brad Garlinghouse. Trump called on Congress to pass what he described as a “fair version” of the Digital Asset Market Clarity Act.
The proposed legislation would establish a federal framework for digital assets and divide oversight between the Securities and Exchange Commission and the Commodity Futures Trading Commission. Its passage remains uncertain because Senate Republicans would need Democratic support to reach the required 60 votes.
XRP may be particularly sensitive to the debate because Ripple spent years contesting the SEC’s claims over its token sales. A clearer statutory framework could reduce the policy uncertainty facing US exchanges and companies using digital assets, although Trump’s comments do not guarantee that Congress will pass the bill.
Broader liquidity conditions also supported the cryptocurrency market. The US Treasury raised the maximum size of planned buybacks for certain longer-dated government bonds from $2 billion to at least $4 billion per operation. The announcement initially weighed on long-term yields and the dollar, helping high-risk assets attract demand, though Treasury yields later recovered.
XRP-specific buying added to the move. Crypto analyst Ali Martinez, known as Ali Charts, said wallets tracked as whales acquired more than 300 million XRP in 96 hours. His Santiment-based chart showed their combined holdings rising from about 16 billion to nearly 16.3 billion tokens.
Ripple, Clearpool, and Cicada Partners also announced plans to build an institutional lending market on the XRP Ledger. The proposed system would use the RLUSD stablecoin and XRPL’s planned lending and single-asset vault features.
The credit platform is still under development and depends on the relevant XRPL amendments. It should therefore be treated as a future network catalyst rather than active lending volume.
XRP technical indicators turn bullish
The daily chart recorded a bullish Supertrend reversal as XRP crossed $1.14. The indicator had remained bearish throughout most of the token’s decline from above $2.00 in January.
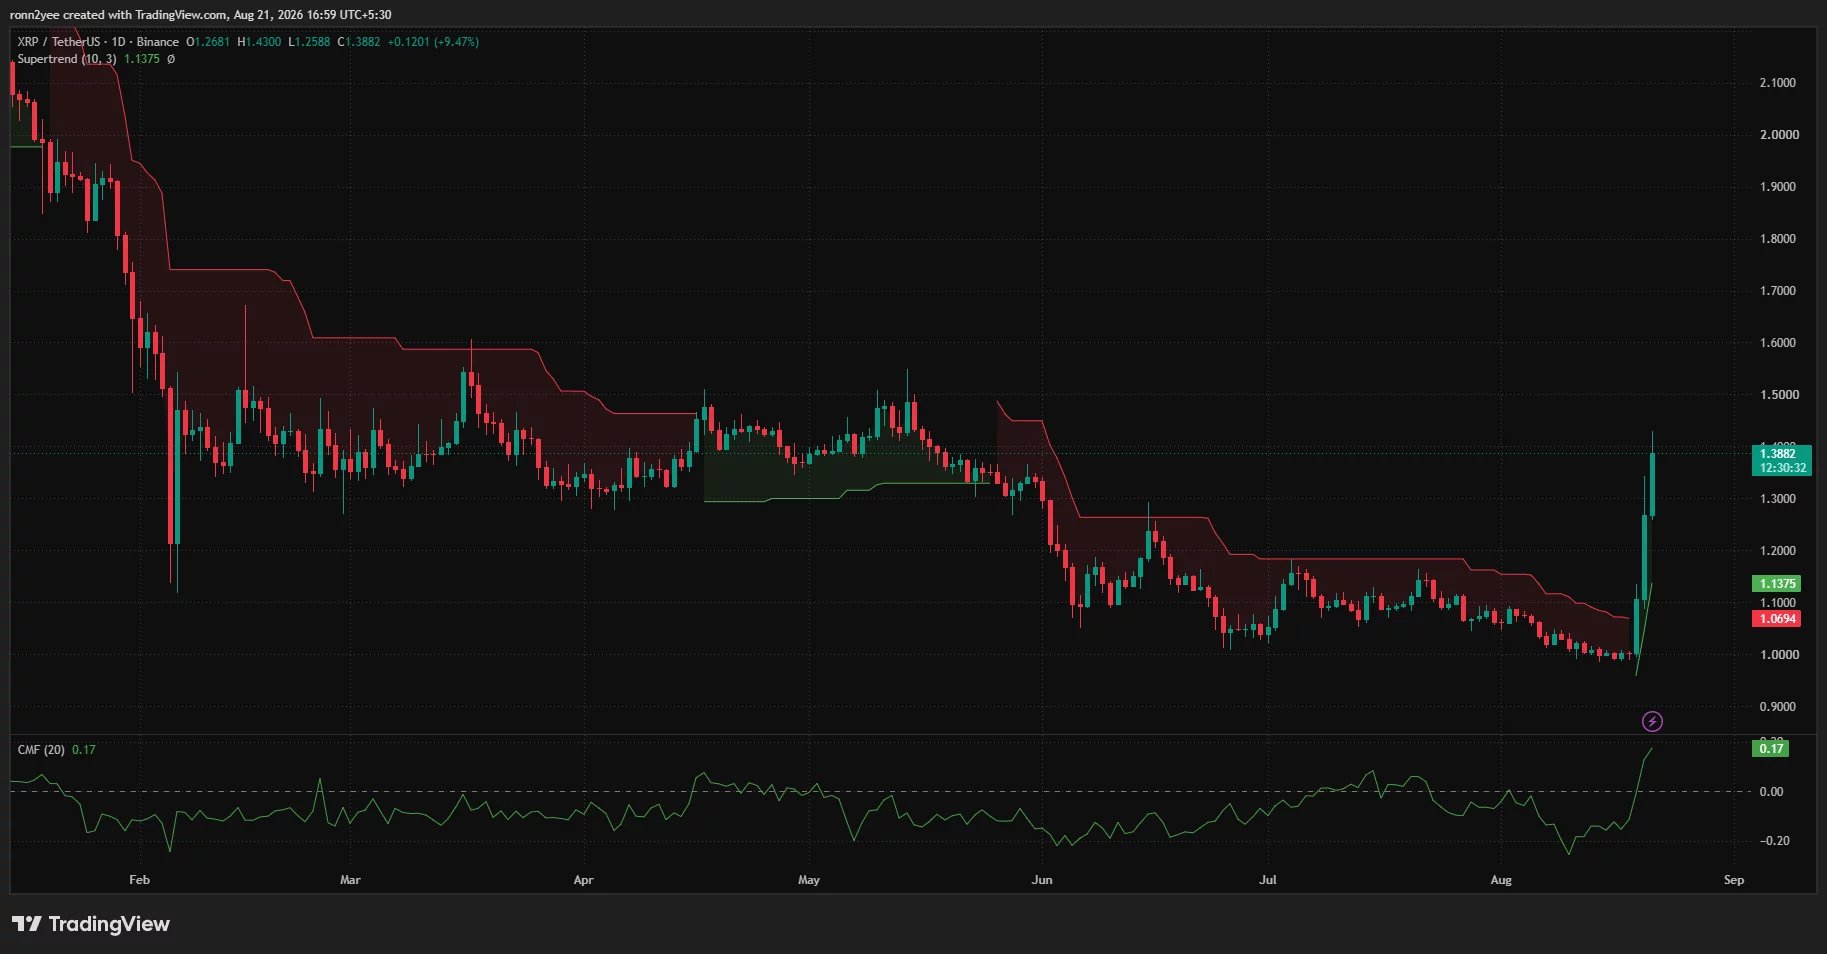
XRP’s daily Chaikin Money Flow also jumped to 0.17. A reading above zero indicates that buying volume is outweighing selling volume, supporting the price breakout with stronger capital inflows.
On the 4-hour chart, XRP trades well above its major moving averages. The 20-period simple moving average has risen to $1.12, while the 50-, 100-, and 200-period averages sit between $1.04 and $1.07.
The wide distance between the market price and those averages confirms the strength of the breakout but also raises the likelihood of short-term volatility. A rapid rally can leave limited support immediately below the price if buyers begin taking profits.
The first support area sits between $1.34 and $1.35, where XRP consolidated after its initial spike. A deeper pullback could test $1.26, the upper boundary of the former resistance range.
The daily Supertrend level near $1.14 represents the broader bullish invalidation zone. Losing that level would place XRP back below its breakout structure and raise the risk of a decline toward the clustered moving averages around $1.04–$1.07.
Liquidation map points to $1.48
CoinGlass’s three-day XRP liquidation heatmap shows that price advanced through several clusters of short liquidation leverage between $1.10 and $1.40. Those forced closures likely added buying pressure as bearish traders repurchased XRP to cover their positions.
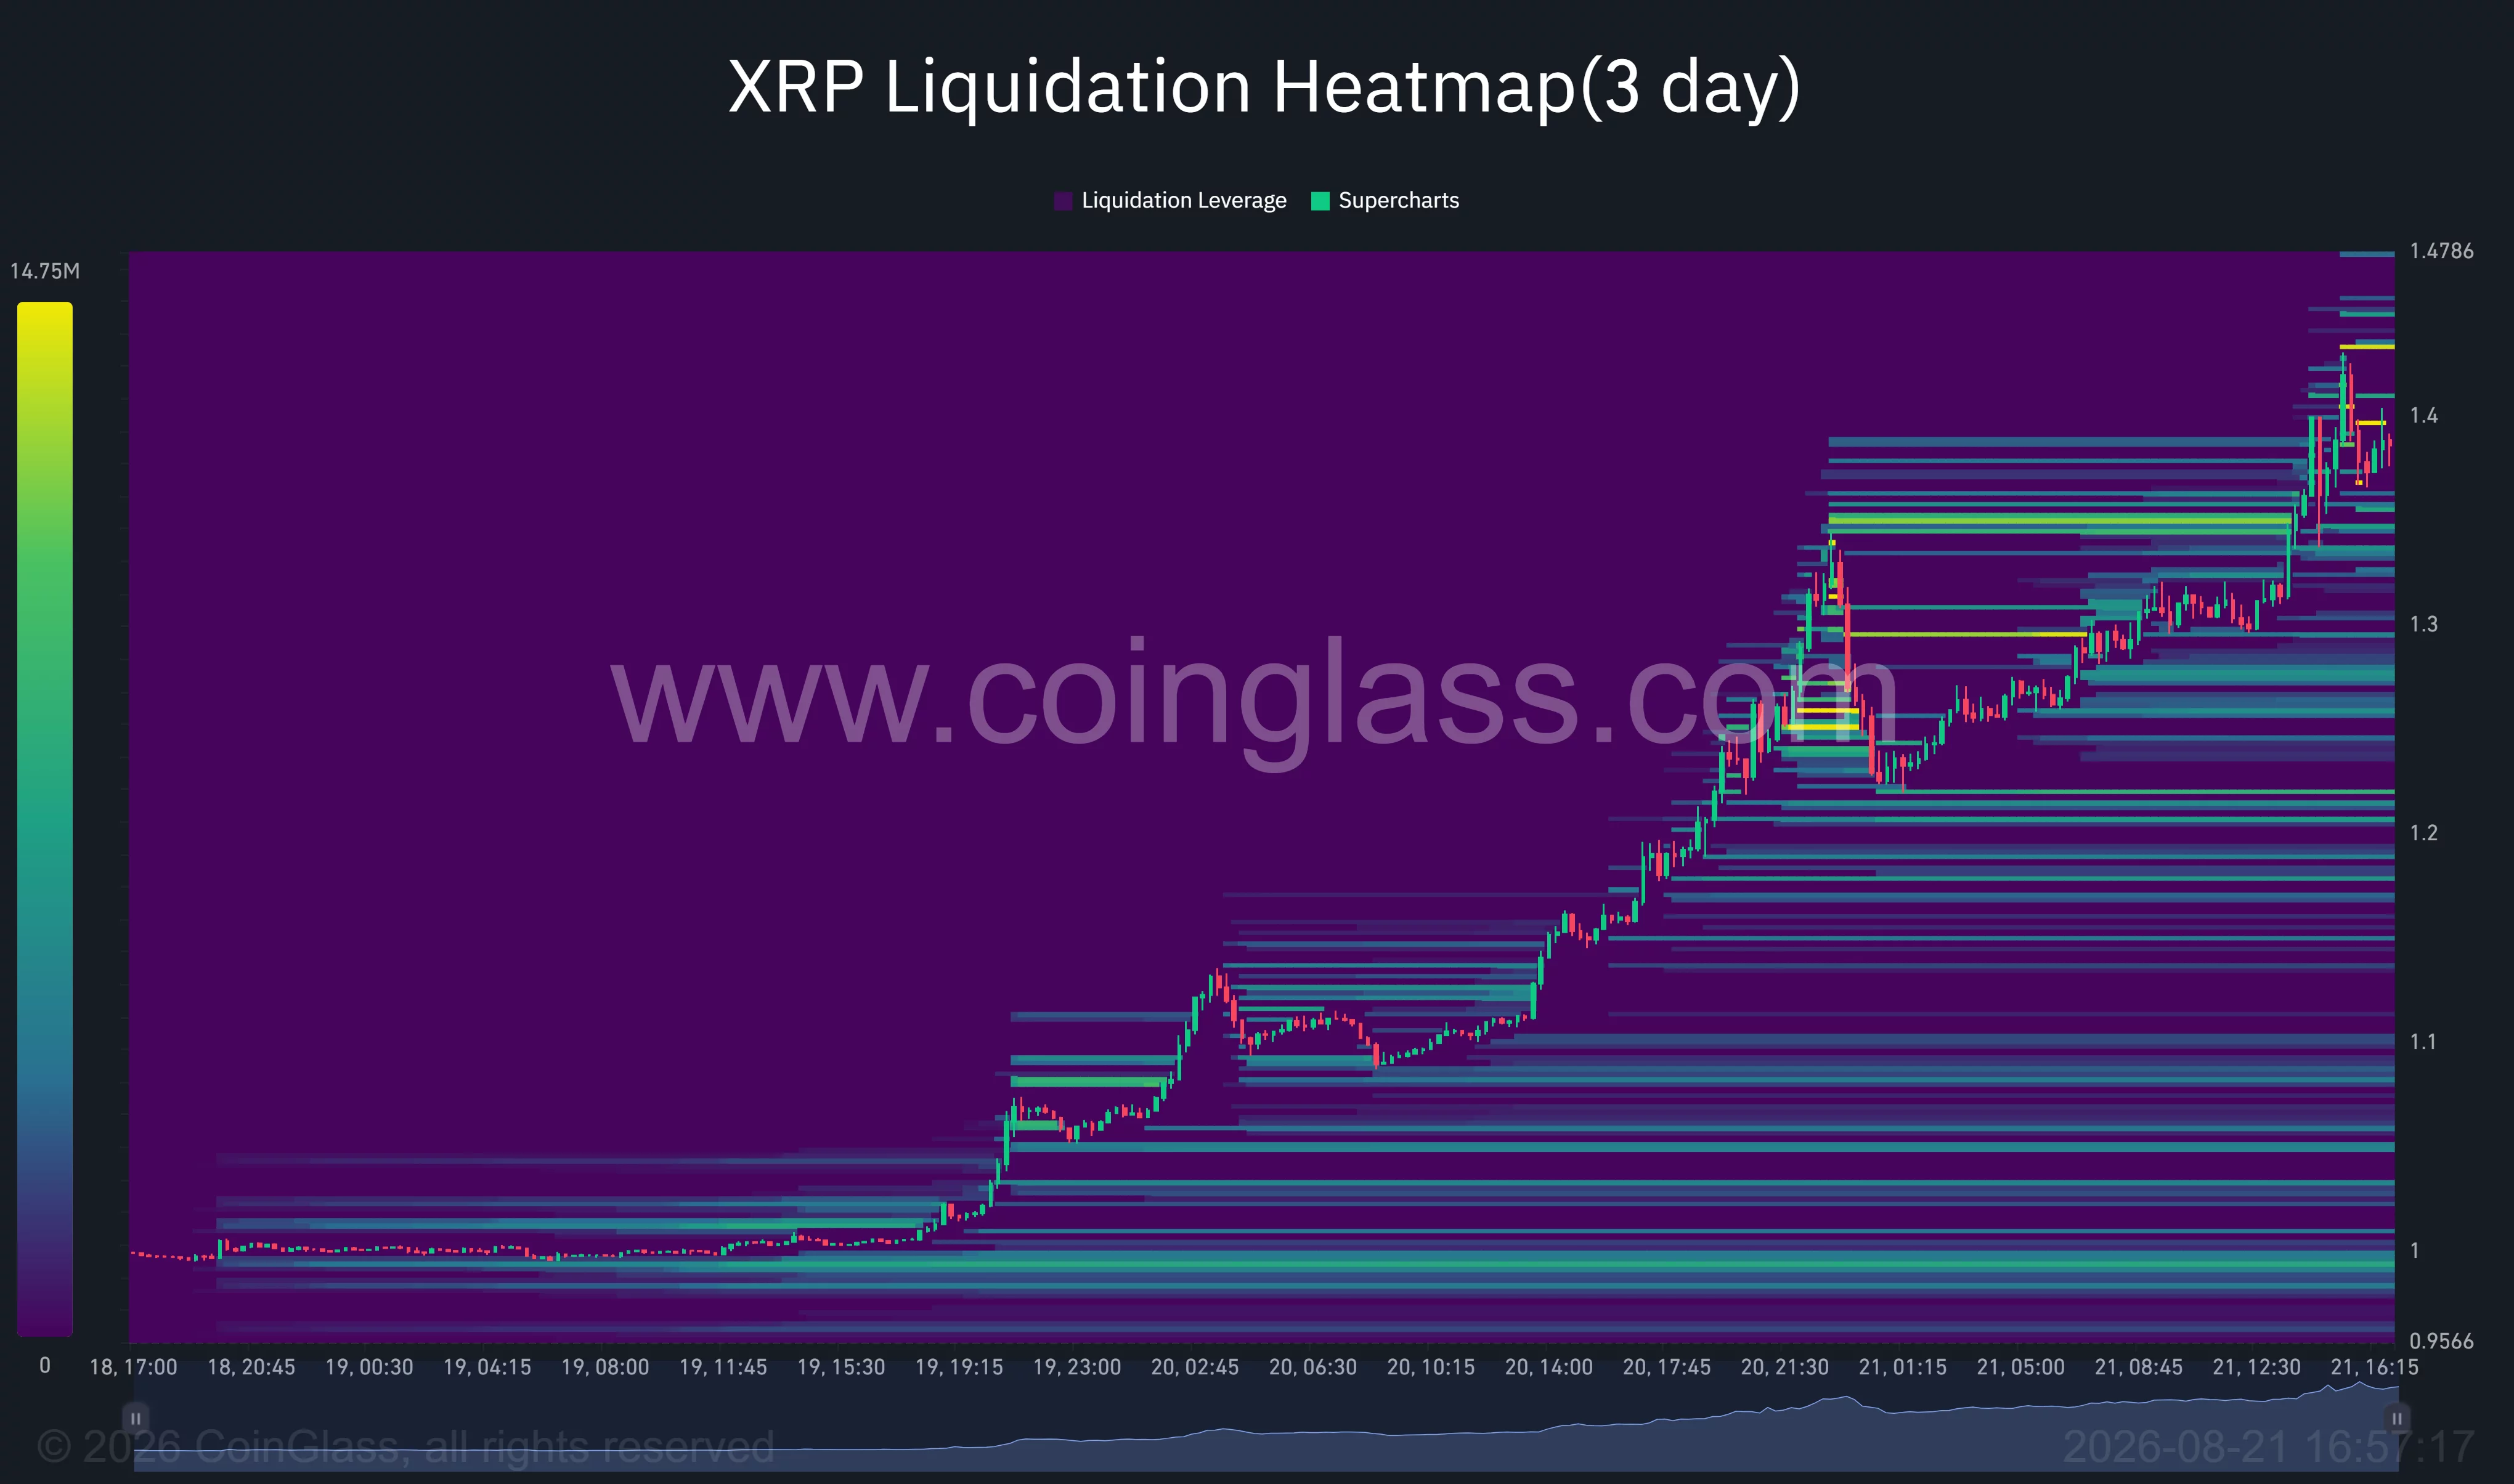
Remaining liquidity is concentrated above the market around $1.43–$1.45, followed by another band near $1.47–$1.48. A clean move above the intraday high could draw XRP toward those levels as exchanges close additional leveraged shorts.
The heatmap also shows large liquidity bands below the price. The closest clusters sit near $1.34, $1.29, and $1.26, while a heavier concentration appears between $1.20 and $1.22.
Markets often move toward areas containing dense leveraged positions, but a liquidation map does not determine direction. If XRP fails to break $1.43, long positions opened during the rally could instead face pressure on a retreat toward the lower clusters.
Can XRP hold the breakout?
A daily close above $1.40 would strengthen the bullish case and leave $1.48 as the next technical and liquidity target. Clearing that zone could open a move toward $1.50, a psychological level that also contained several price reversals earlier in 2026.
The rally still carries downside risks. XRP has moved more than 35% from its weekly low in a short period, while the White House catalyst depends on a bill that remains subject to difficult Senate negotiations.
Continued whale accumulation, positive money flow, and support above $1.26 would provide stronger evidence that the advance is more than a short squeeze. Failure to hold that former resistance zone would expose $1.20 and, eventually, the daily Supertrend level near $1.14.
Disclosure: This article does not represent investment advice. The content and materials featured on this page are for educational purposes only.


After years of stalled bills, misguided enforcement, and catastrophic collapses, almost any comprehensive crypto legislation began to look like progress. But Clarity is turning that hunger for progress into a political trap, argues Berkeley Law lecturer Hermine Wong.
Crypto World
Coldcard ships firmware after $114 million bitcoin theft; says AI helped catch more bugs
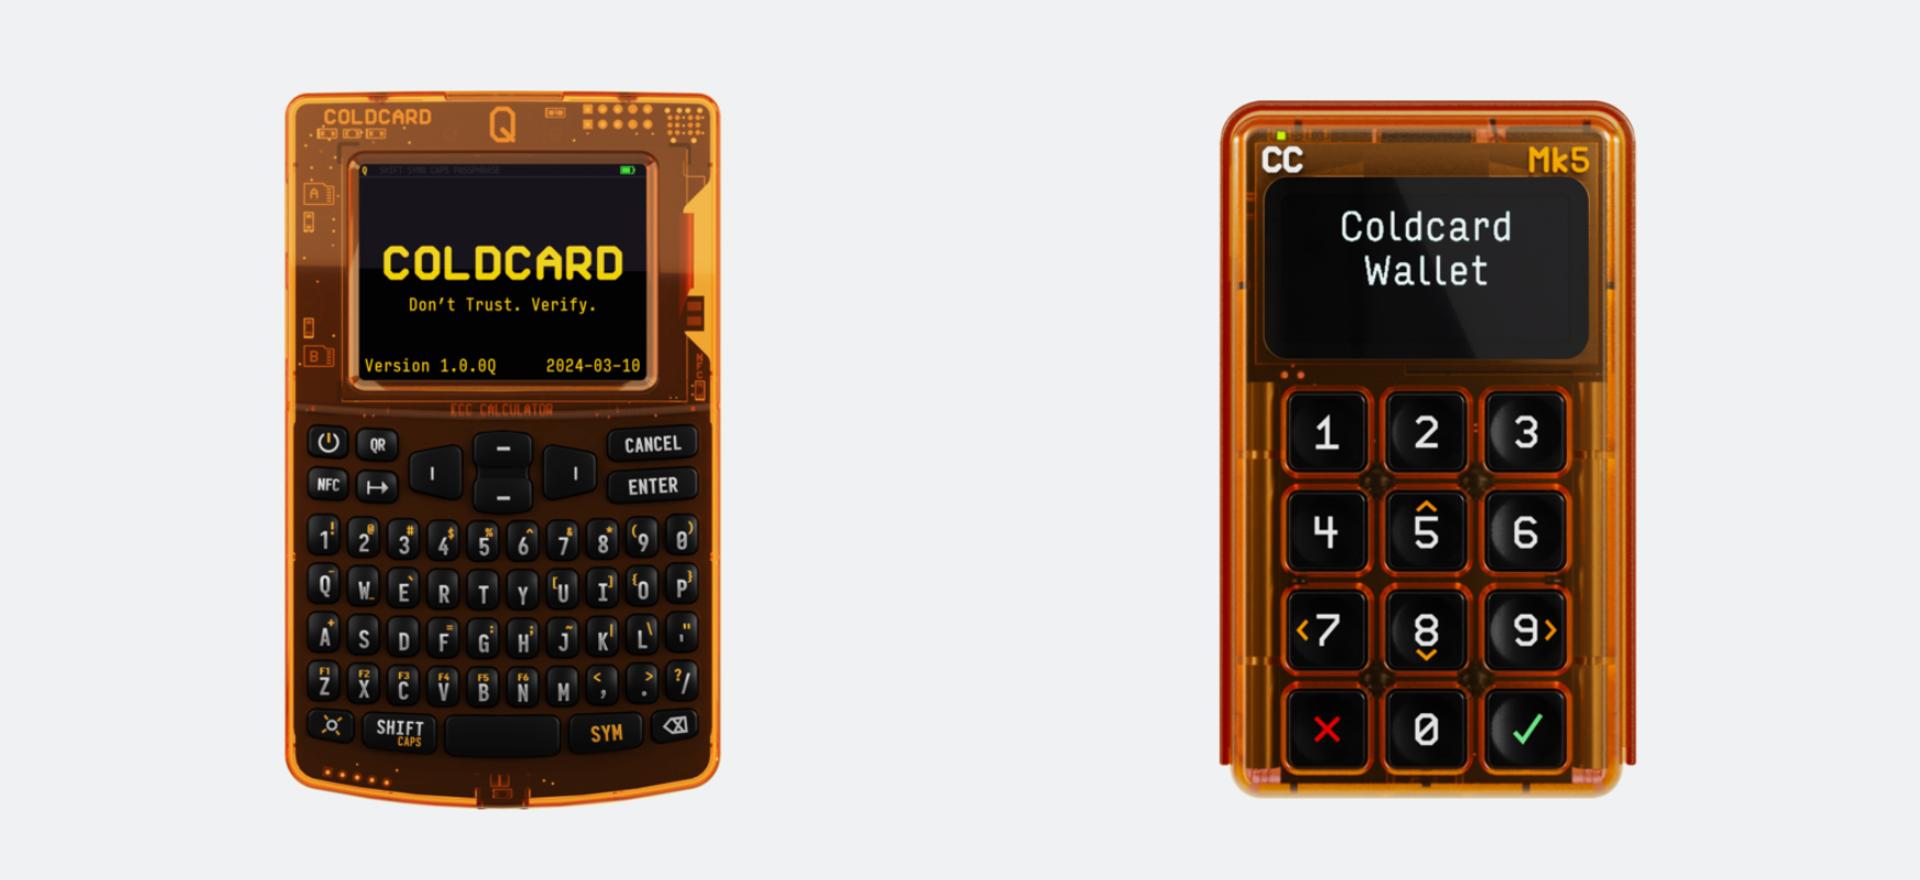
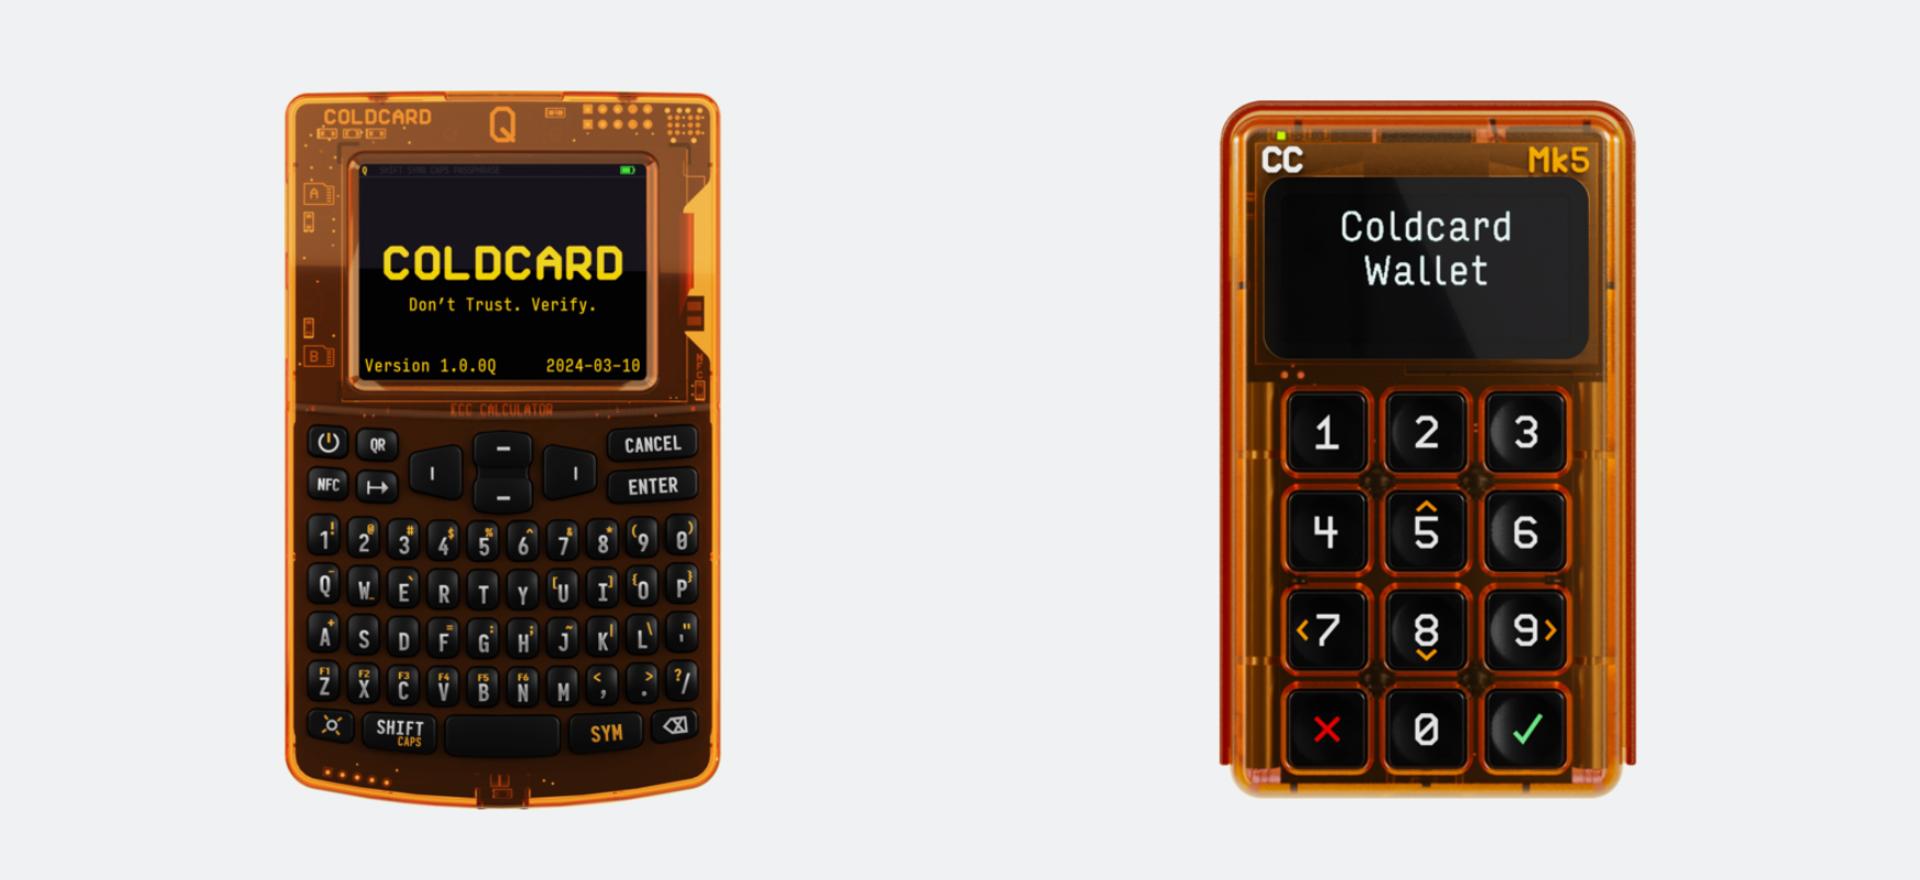
Three weeks of review turned up problems unrelated to the flaw that cost users $114 million, but updating still does not make a compromised wallet safe.


Yesterday’s arbitration motion hearing between Justin Sun and World Liberty Financial (WLFI) is being hotly contested by both the Tron billionaire and WLFI’s CEO Zach Witkoff.
The federal court hearing in California stems from Sun’s April lawsuit that accuses WLFI of fraud and breach of contract when it froze his tokens with alleged undisclosed blacklisting powers.
Sun says hearing was a ‘significant win’
Sun claimed on X that a judge ruled his case and “individual claims” would go to court, calling the apparent development a “major victory.”
He said that the judge “rejected World Liberty’s argument that all of the company-related claims should be arbitrated, and has ordered the parties to meet and confer about which of those claims should remain in court and which should go to arbitration.”
All this, Sun said, was despite WLFI’s efforts to force “secret arbitration proceedings.”
Witkoff says Sun is lying
Hours later, Witkoff said WLFI never wanted Sun’s “individual claims” to go to arbitration and that they wanted them dismissed entirely.
He said that the court is yet to rule on the outcome of these claims, completely contradicting Sun’s description of the hearing, which Witkoff described as “riddled with falsehoods.”
Read more: WLFI token falls 18% as governance vote branded a ‘scam’
Additionally, Witkoff claims the court sided with WLFI and agreed that many of Sun’s other claims must go to arbitration. He said, “Even Sun’s lawyers had to concede in the courtroom that these claims do not belong in court.”
Justin Sun is allegedly avoiding other lawsuit proceedings
To top it off, Witkoff alleges that Sun is “actively avoiding” legal proceedings regarding the separate lawsuit WLFI filed against him in Florida.
Court documents on the outcome of yesterday’s hearing are yet to be published online. It’s unclear when the parties will meet next to discuss the arbitration motion.
Sun says WLFI can’t afford to lose lawsuit
Sun also alleged that WLFI likely can’t afford the hundreds of millions of dollars in damages if they lose the lawsuit.
Read more: Trump’s World Liberty Financial sues its advisor Justin Sun
He highlighted that WLFI’s deposit of almost 5 billion WLFI tokens with Dolomite, and legal proceedings regarding Dough Finance litigation, raise doubts about whether WLFI has “enough money to satisfy a judgment, repay their debts, or make investors whole if there is a run on the bank.”
Got a tip? Send us an email securely via Protos Leaks. For more informed news and investigations, follow us on X, Bluesky, and Google News, or subscribe to our YouTube channel.
Important Ripple (XRP) Price Update: August 21st

The Witcher Officially Returns With New Release in 4 Months

V $ X V PRiNCE – MONEY (KNCNTRT 2020 ALBUM)





-

 Fashion7 days ago
Weekend Open Thread: Ann Taylor
-

 Sports6 days ago
Birmingham 2026: Day 6 Timetable for Irish Athletes
-
 NewsBeat6 days ago
Myanmar says over 300,000 Rohingya refugees verified for repatriation as exodus enters ninth year
-

 Business3 days ago
SMA Solar Technology AG (SMTGY) Q2 2026 Earnings Call Transcript
-

 Politics6 days ago
SEQ Code: The Three Letter Boarding Pass Code That Could Give You The Worst Seat
-

 Crypto World6 days ago
Pi Network Protocol 27 endgame: last upgrade before what?
-

 Tech3 days ago
Qwen3.8-27B runs frontier-class coding agents and reasoning locally, no cloud API required
-

 Crypto World4 days ago
OCC Greenlights Trump Family Crypto Firm for Trust Charter
-
 Tech6 days ago
Every fusion startup that has raised over $100M
-
 Entertainment6 days ago
Marvel Studios Reveals New X-Men Cast Including Adam Driver and Sadie Sink
-
 Business6 days ago
Monarch Mutual Fund set to enter MF space with maiden overnight fund; files draft with Sebi
-

 Fashion7 days ago
Weekly News Update, 8.14.26 – Corporette.com
-

 Fashion7 days ago
Silver bangles for women – Newbridge Silverware
-

 Business6 days ago
Facebook Down Now? Users Report Login And Loading Problems As Outage Trackers Monitor Ongoing Issues
-

 Business6 days ago
Cristiano Ronaldo’s Secret Wedding Deepens As Presenter Claims Family Learned ’30 Seconds’ Before
-

 News Videos1 day ago
Don’t Leave Your Financial Future To Chance | August 19, 2026
-

 Fashion7 days ago
Cart Confidential Vol. 44 – Julia Berolzheimer
-

 Crypto World4 days ago
NAVI Prime launches institutional lending framework on Sui
-

 Crypto World5 days ago
Data of 54K Wallet Users Leaked, Clarity Odds Just 10%: Hodler’s Digest, Aug. 16
-
 Fashion7 days ago
knitwear for women sale – up to 50% off
You must be logged in to post a comment Login