
Crypto World
Ethereum price loses $2,500 as MACD turns bearish

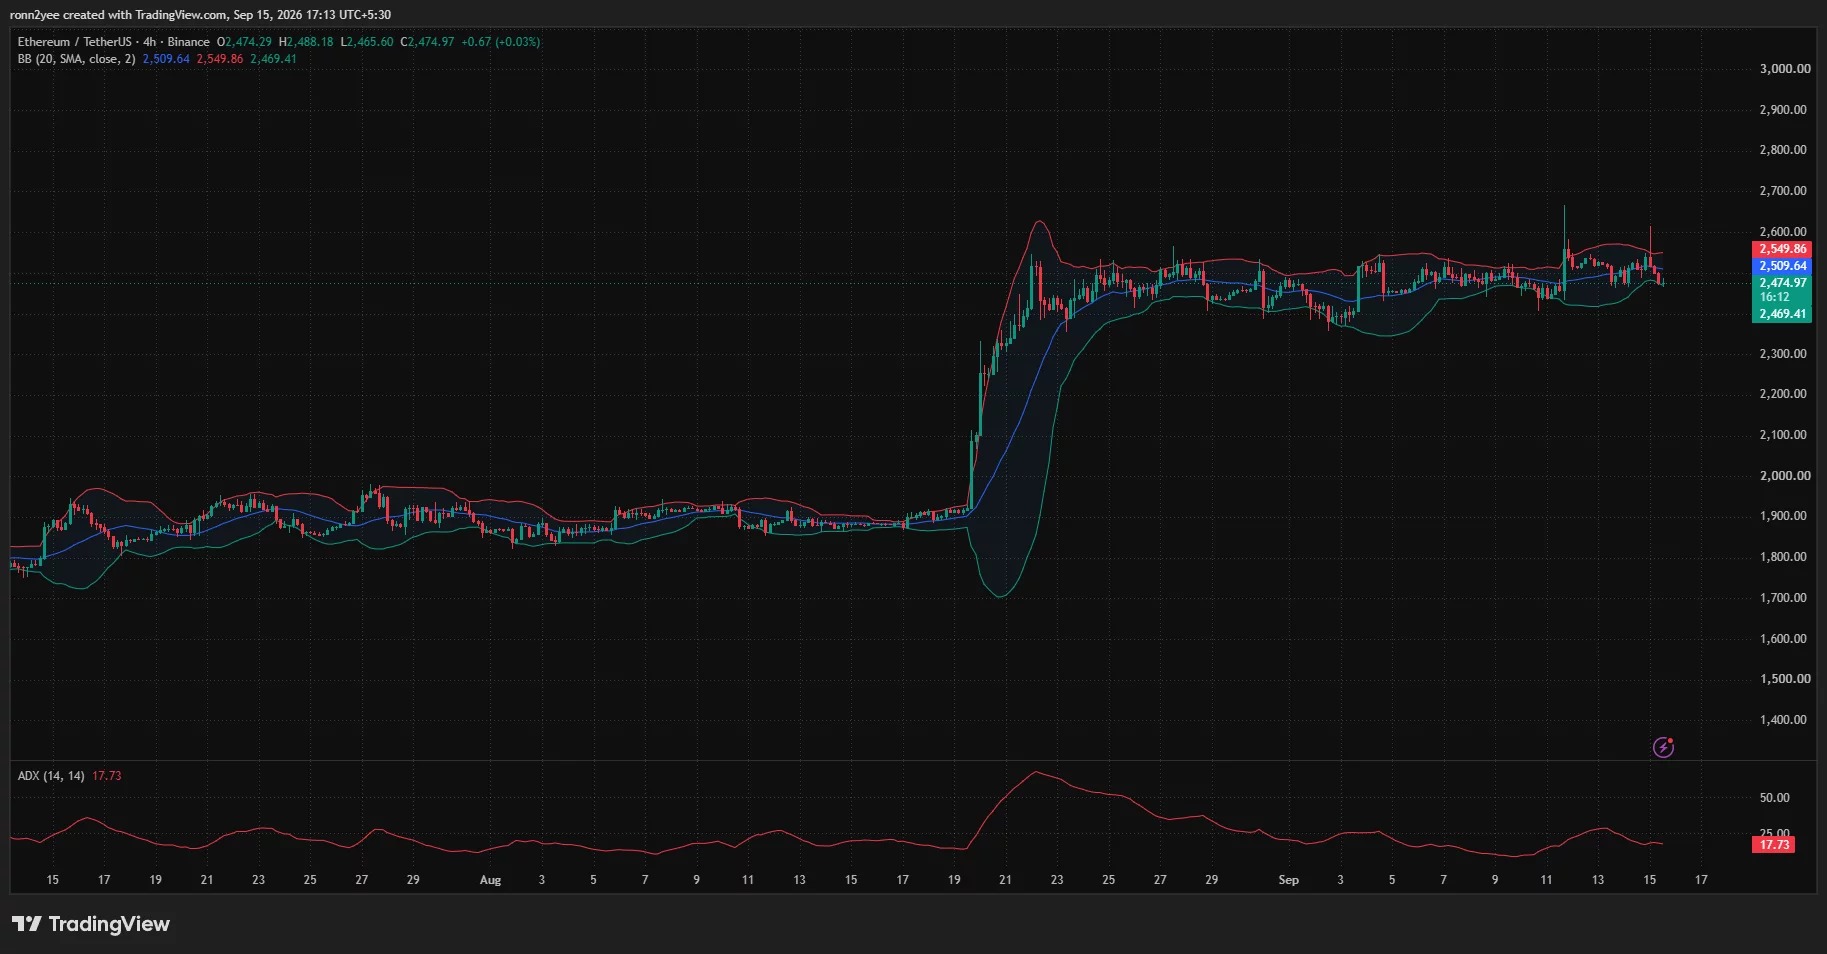
Ethereum price fell toward $2,475 after a brief move above $2,600 failed, leaving ETH exposed to weaker momentum and leveraged volatility ahead of two major U.S. events.
Summary
- Ethereum price reversed from above $2,600 and fell about 2% toward $2,475.
- 4-hour Bollinger Bands place immediate support near $2,469 and resistance near $2,550.
- Daily MACD has turned bearish, while an ADX reading of 17.73 signals weak trend strength.
- The Federal Reserve decision and CLARITY Act vote could keep volatility elevated.
Ethereum price falls back below $2,500
According to data from crypto.news, Ethereum (ETH) price traded near $2,475 on Sept. 15 after dropping approximately 2% over the previous 24 hours. The decline followed a sharp rejection above $2,600, where buyers failed to sustain a breakout.
The daily chart shows ETH opening at $2,515.72 before trading between $2,465.60 and $2,520 during the latest session. The token was down 1.65% at the time of writing.
Price action remains volatile after ETH climbed above $2,600 during the prior session and quickly surrendered the entire move. The reversal pushed the token below the $2,500 psychological level and back into the consolidation range that has controlled trading since late August.
Crypto trader Daan Crypto Trades described the move as pre-positioning ahead of the U.S. Senate’s CLARITY Act vote and the Federal Open Market Committee meeting. According to the analyst, the initial rally removed leveraged short positions before the decline forced out traders positioned long.
The pattern shows traders reducing risk before events that could affect both monetary policy and U.S. digital-asset regulation. Failure to advance the bill could produce another move lower before attention shifts to the Fed decision, Daan added.
Weak momentum leaves Ethereum near 4-hour support
On the 4-hour chart, ETH has moved below the Bollinger Band midpoint at $2,509.64. The lower band stands at $2,469.41, placing the current price close to its first immediate volatility support.
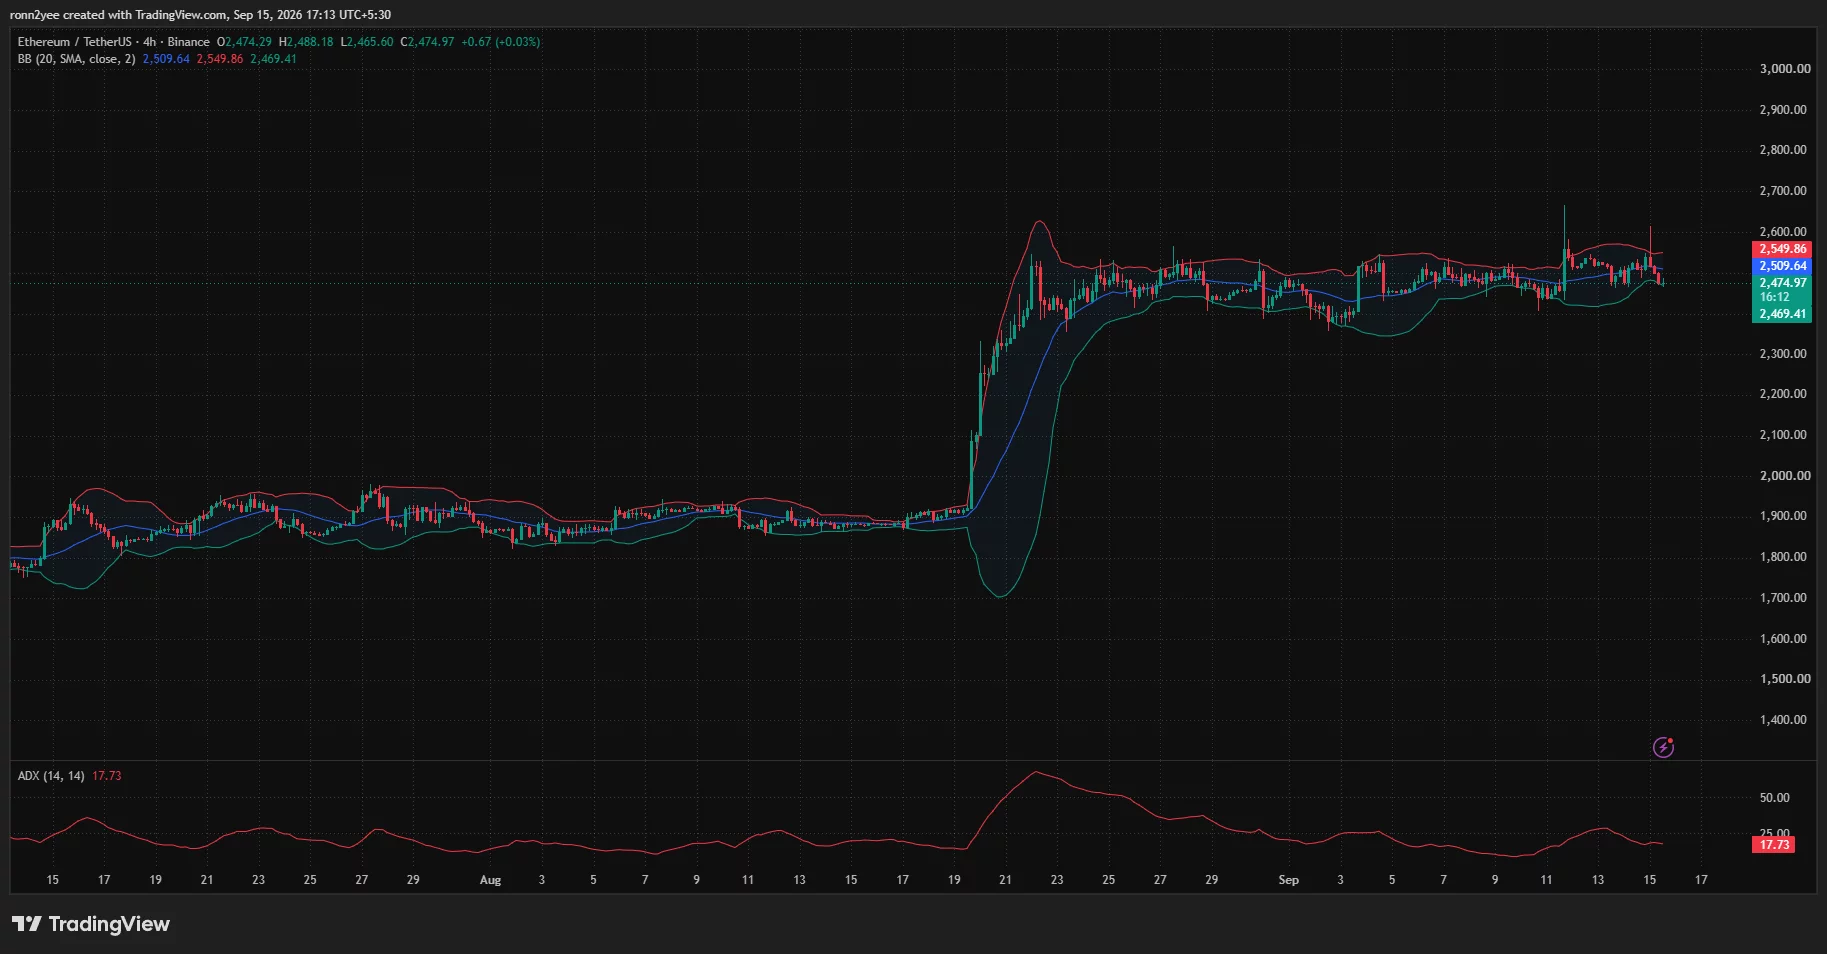
A break below that band would expose the recent intraday lows and the $2,450 area. Buyers would need to recover the midpoint before attempting another move toward the upper Bollinger Band at $2,549.86.
The Average Directional Index is at 17.73. Readings below 20 normally indicate that the prevailing trend lacks strength, meaning ETH could remain range-bound even as short-term swings become sharper.
Daily indicators also show fading momentum. The relative strength index has dropped to 56.89 from its recent highs and sits below its moving average of 62.14. ETH is not oversold, leaving room for further downside if sellers retain control.
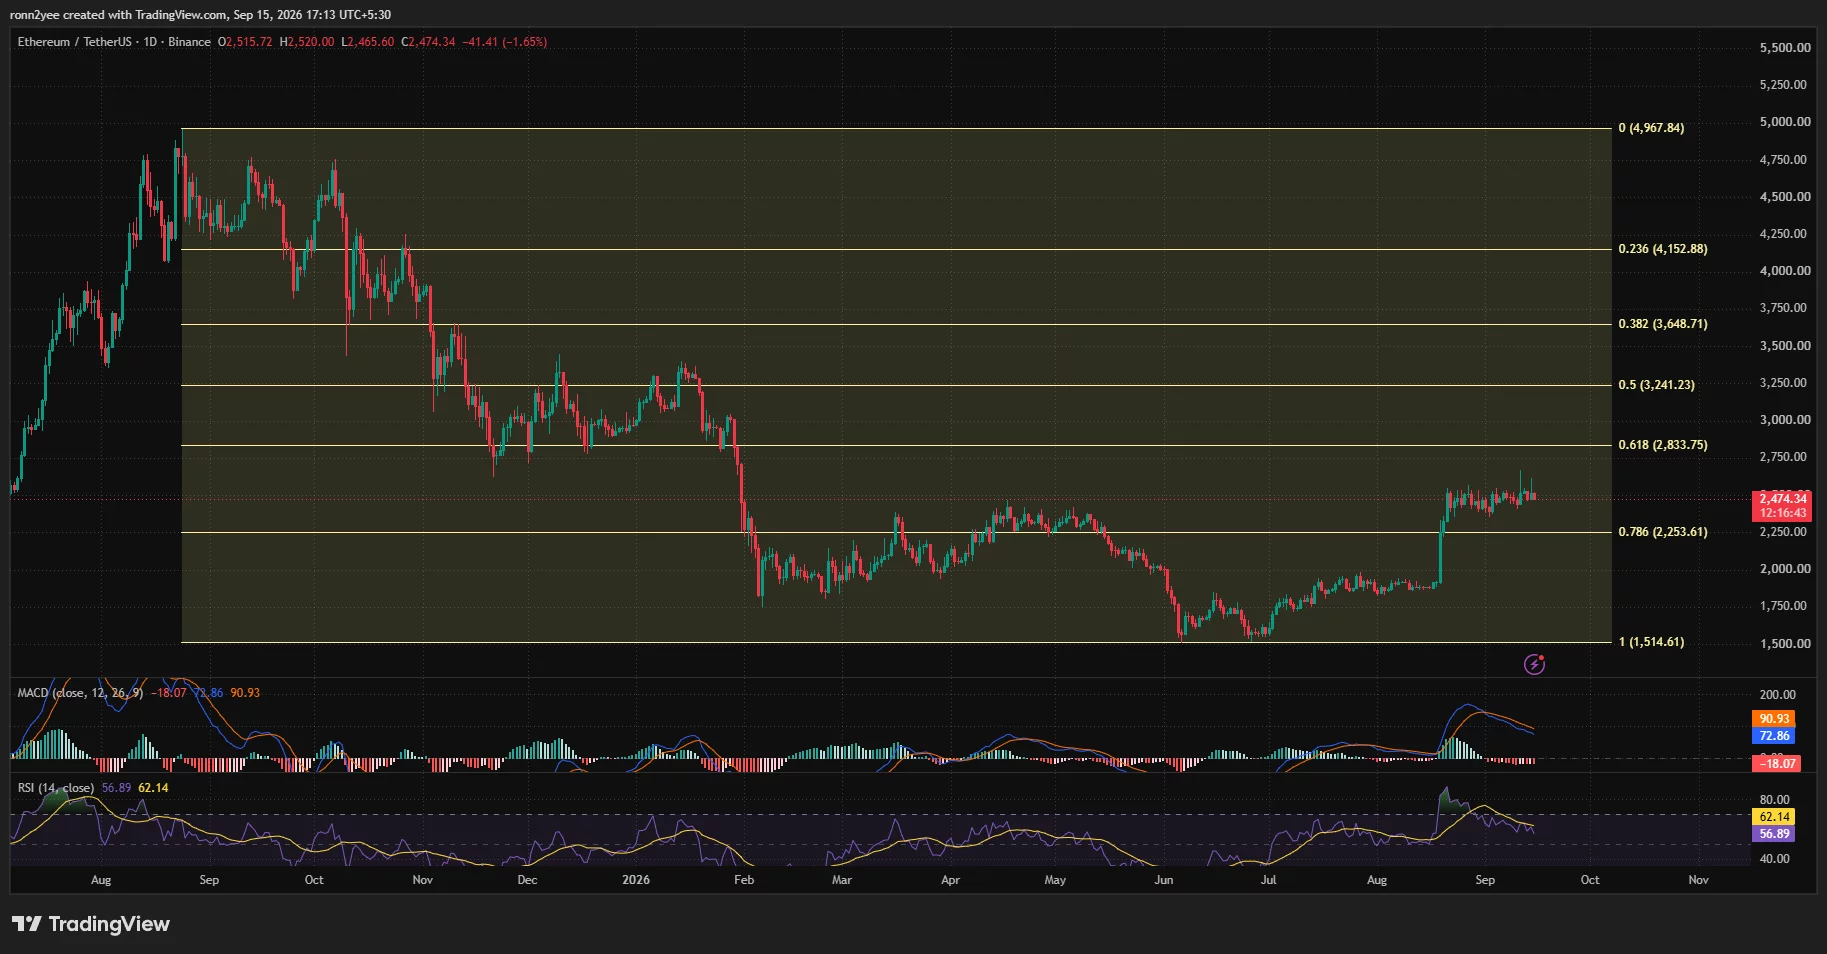
The daily MACD line remains positive at 72.86 but has fallen below the signal line at 90.93. The histogram has turned negative at -18.07, showing that the momentum behind the August rally is weakening.
Liquidation clusters frame the next ETH move
CoinGlass’s one-week liquidation heatmap shows a concentration of leveraged positions immediately below the market around $2,450–$2,470. ETH’s decline toward that area increases the chance of further volatility if the price moves through the cluster.
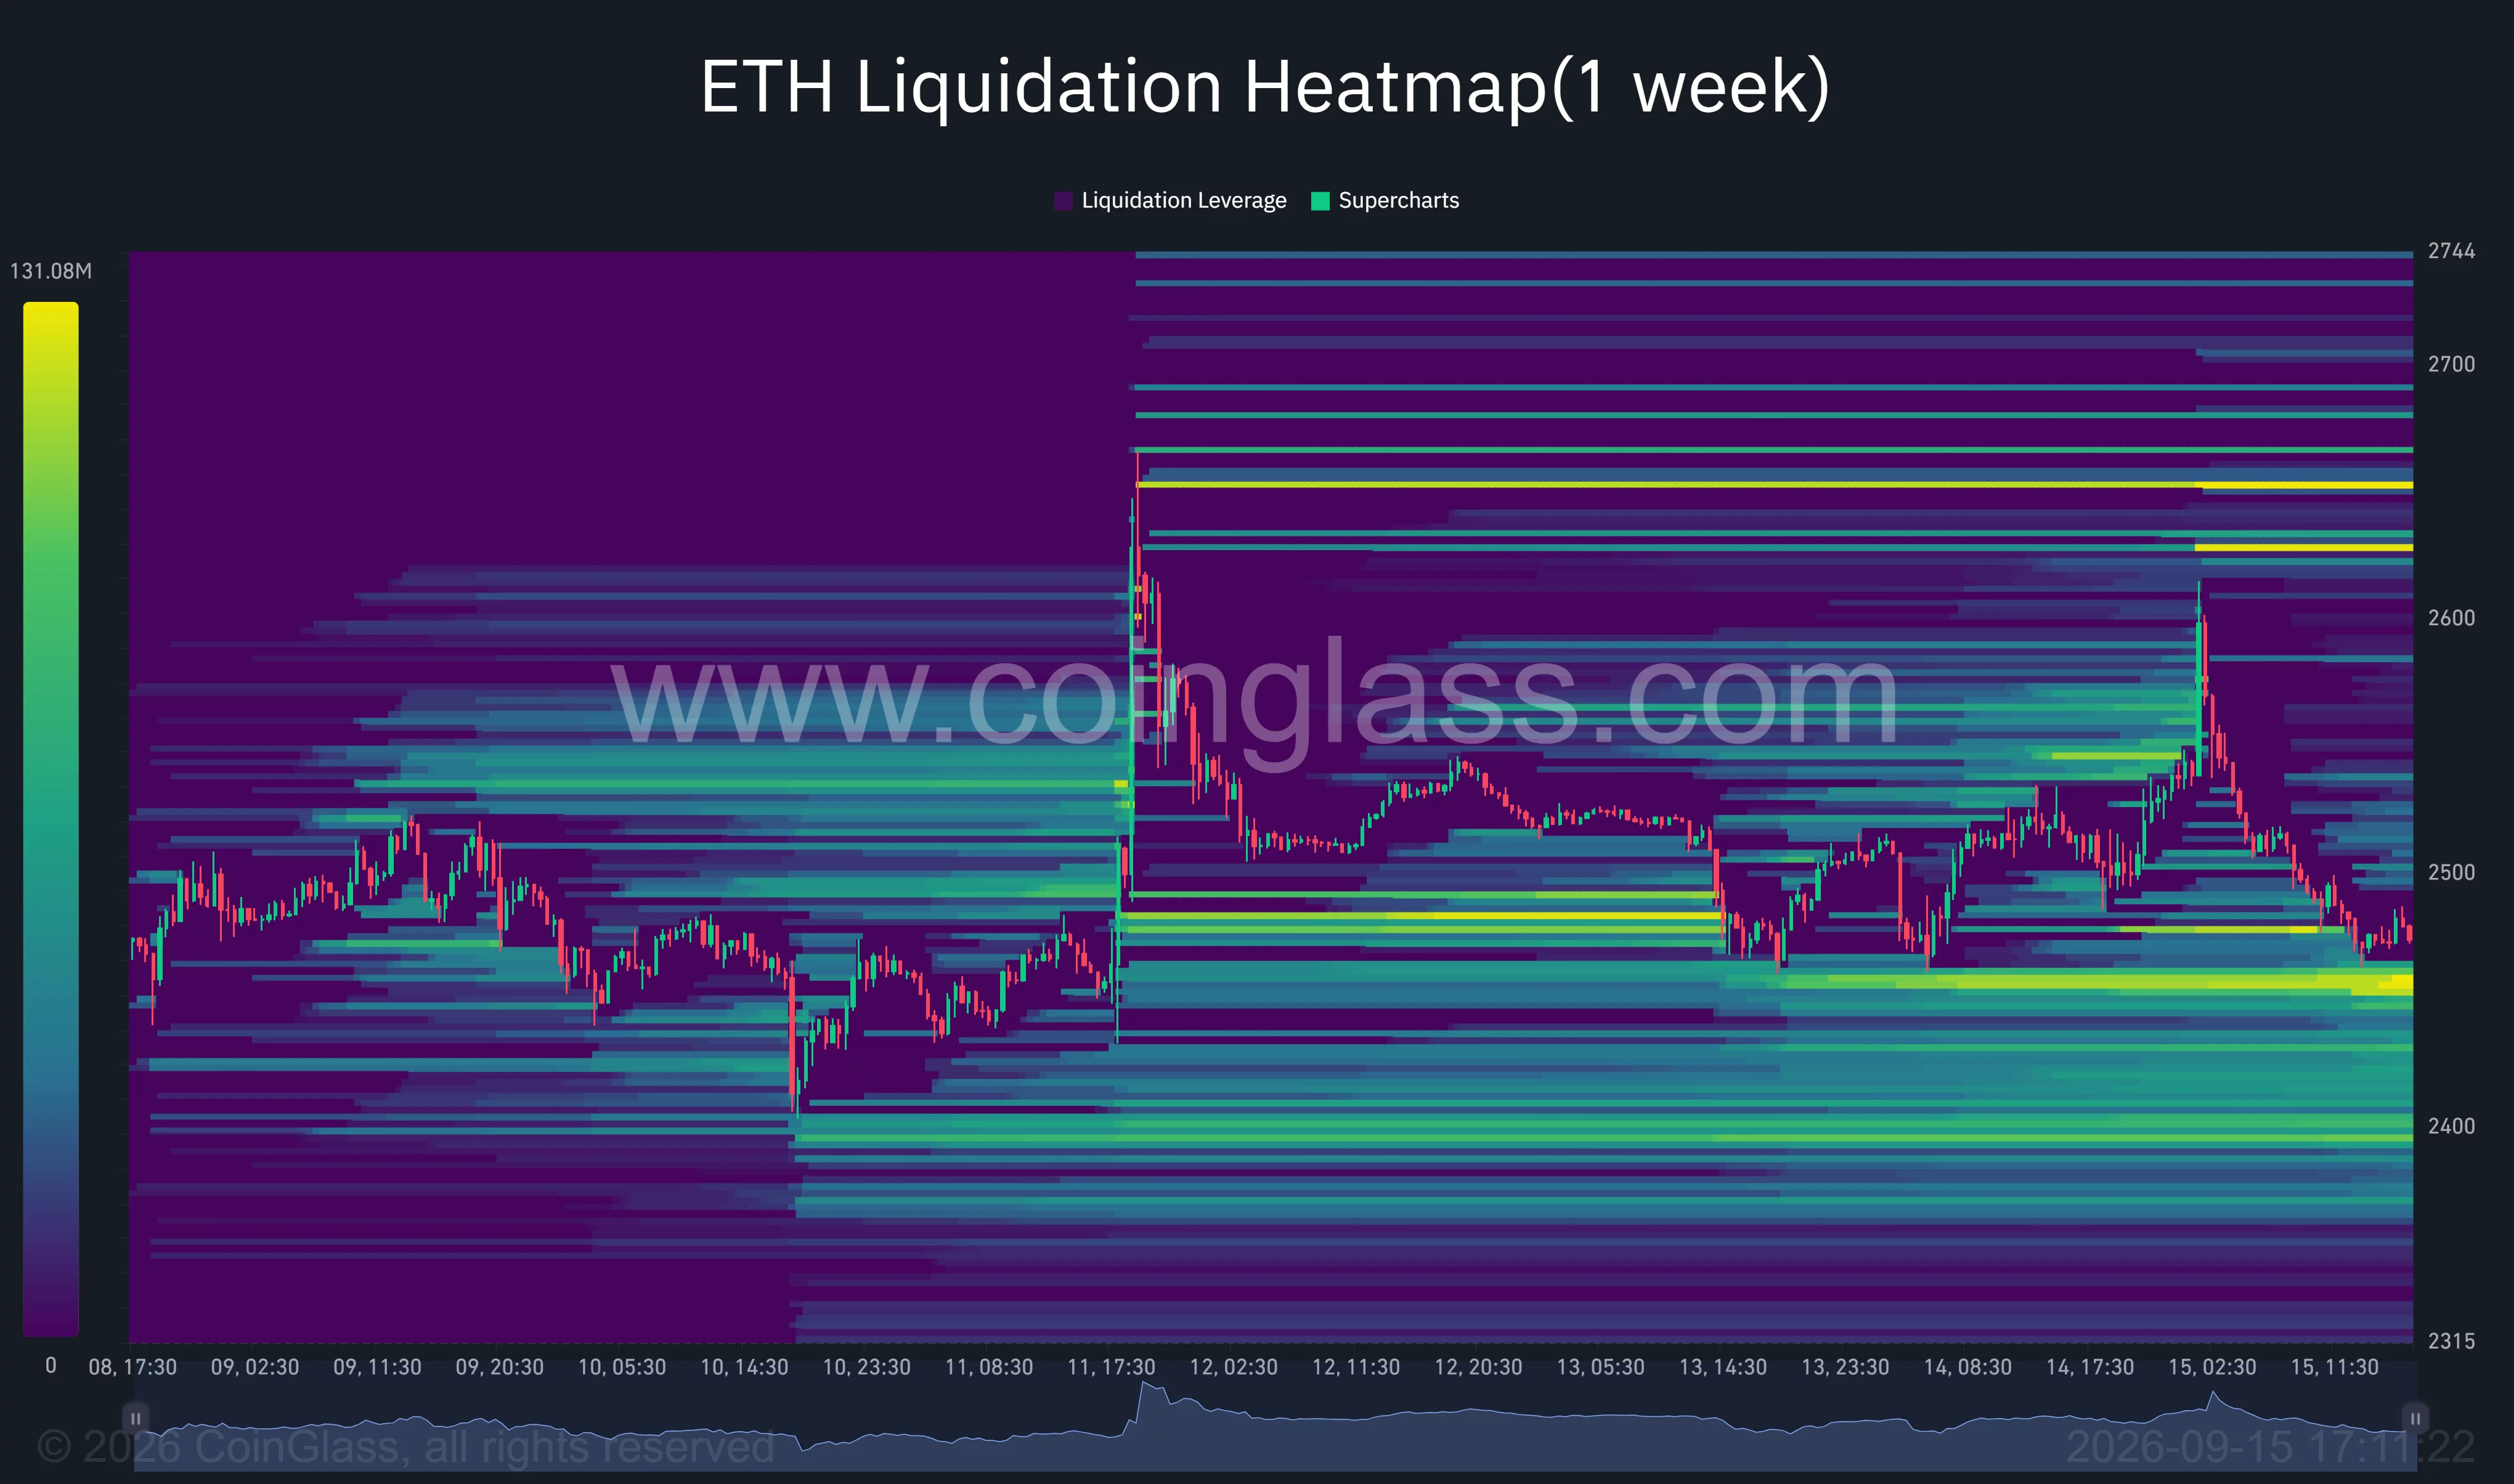
A stronger pocket of downside liquidity appears around $2,390–$2,410. Failure to hold the current range could draw price toward that zone, particularly if leveraged long positions are forced to close.
Liquidity also sits above ETH around $2,535–$2,580, followed by brighter concentrations near $2,630 and $2,650. A recovery above $2,550 could therefore trigger short liquidations and support another attempt at $2,600.
The heatmap does not establish the direction of the next move. It identifies areas where forced position closures could accelerate volatility after ETH reaches those levels.
On the broader daily chart, the 0.786 Fibonacci retracement at $2,253.61 remains the main structural support. The next major upside Fibonacci level stands at $2,833.75, but ETH must first overcome the nearer resistance between $2,550 and $2,600.
Analysts identify $2,550 as the key resistance
Crypto analyst Ted Pillows said ETH’s upside would remain capped until the asset reclaims $2,550 on the weekly timeframe. His chart places the first major support near $2,175 and the next resistance around $2,860 if buyers establish a weekly close above the current ceiling.
The immediate structure provides closer levels for short-term traders. A move above $2,510 would return ETH to the middle of its 4-hour Bollinger range, while a break through $2,550 would weaken the current bearish setup.
A close below $2,465 would place the $2,450 liquidity area at risk. If sellers clear that zone, $2,400 becomes the next visible target before the larger daily support at $2,254.
Fed and CLARITY Act keep US traders cautious
U.S. macro conditions could determine whether ETH holds its current support. Oil prices climbed above $107 per barrel while the 10-year Treasury yield moved above 5%, increasing concerns that higher energy costs could keep inflation elevated.
CME FedWatch data showed markets assigning a probability above 90% to a 25-basis-point rate increase at the Fed’s Sept. 16 meeting, according to Reuters. Higher Treasury yields can reduce demand for risk assets by giving U.S. investors access to stronger returns in traditional fixed-income markets.
The Senate’s procedural vote on the CLARITY Act adds a separate regulatory catalyst. Until both events are resolved, ETH may remain vulnerable to sharp moves through nearby liquidation zones.
Disclosure: This article does not represent investment advice. The content and materials featured on this page are for educational purposes only.

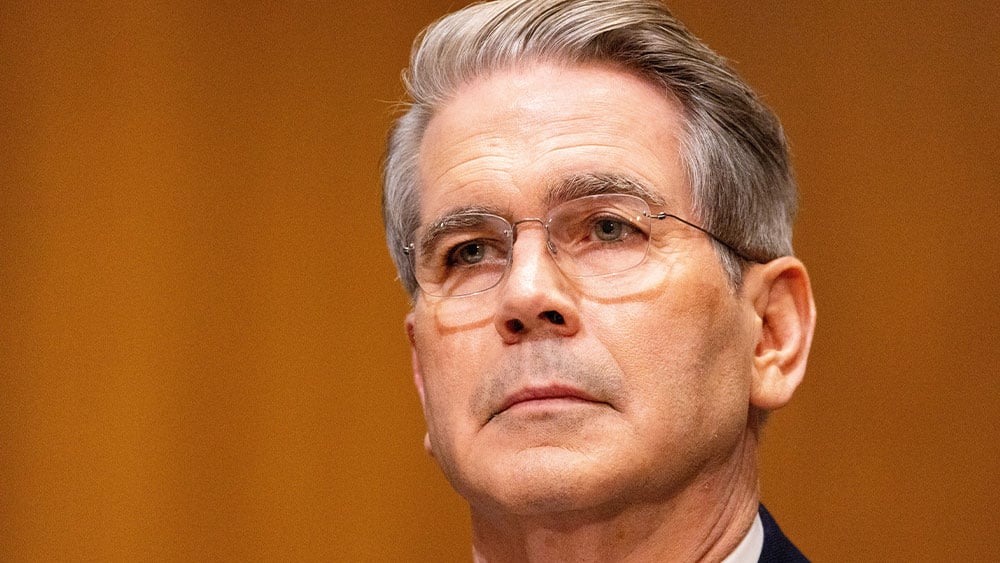
Federal Reserve Chairman Kevin Warsh and Treasury Secretary Scott Bessent both face credibility tests this week in their respective roles of fighting inflation and serving as the nation’s top bond salesman. With the 10-year Treasury yield holding near 5% on Tuesday, only one appears to have a good chance of success. A hawkish outcome of Wednesday’s Fed meeting, including a…
Copyright ©2026 Investor’s Business Daily, LLC. All rights reserved. 87990cbe856818d5eddac44c7b1cdeb8
XRP’s post-rally cooldown continues to take shape, with the asset struggling to convert its August surge into a renewed impulsive advance. The price remains trapped within a corrective structure, leaving the next breakout as the key signal for determining whether buyers can regain control.
Ripple Price Analysis: The Daily Chart
On the daily timeframe, XRP is trading around $1.40 after the explosive move from roughly $1.00 toward $1.55. Since that rally, however, the market has transitioned into a descending channel, producing a sequence of lower highs while volatility gradually contracts.
The latest rebound from the $1.32-$1.35 support area was rejected near $1.48, where the price also encountered the channel’s upper boundary. This rejection reinforces the descending trendline as the main technical obstacle. At present, that resistance is approaching the $1.43-$1.45 area.
Therefore, a confirmed daily breakout above the channel could represent an important bullish structural shift. In that case, XRP could initially challenge the previous $1.48-$1.55 highs before potentially targeting the major $1.61-$1.70 resistance zone.
On the downside, the $1.33-$1.36 region remains the nearest significant support. A breakdown below this area would weaken the recovery scenario and could expose the lower channel boundary, which is gradually converging toward the broader $1.22-$1.27 demand zone.
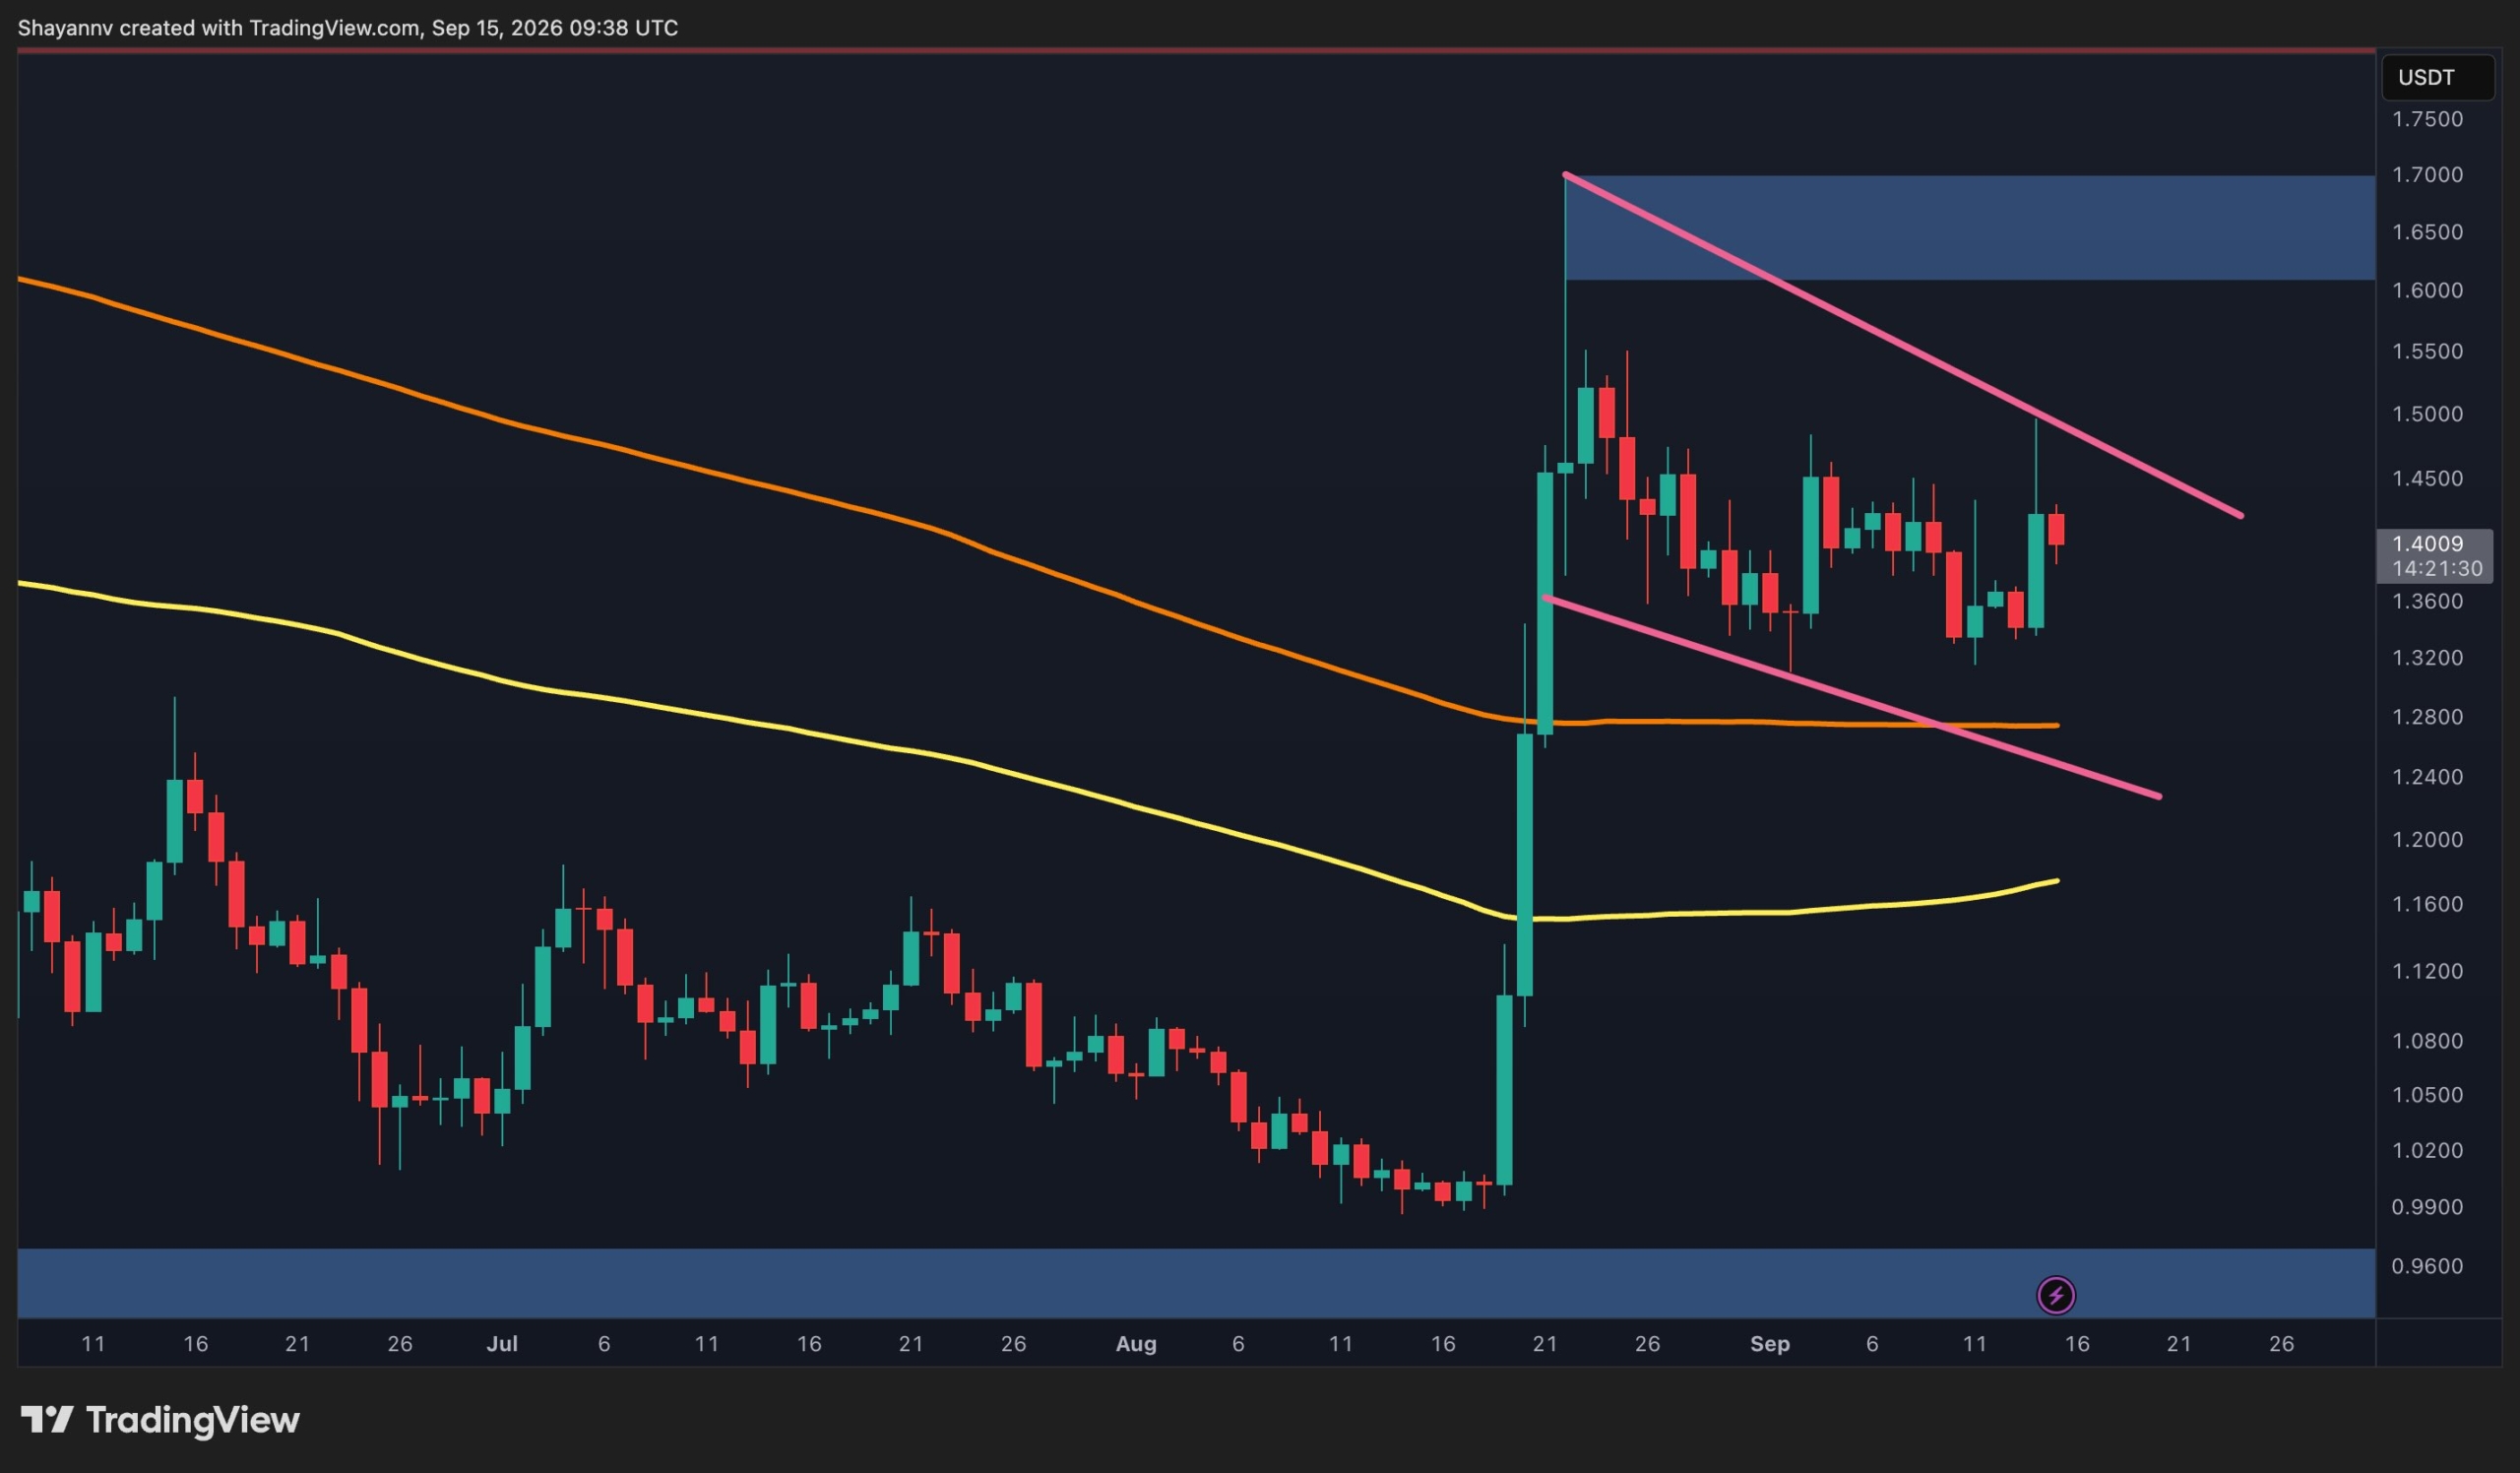
XRP/USDT 4-Hour Chart
The 4-hour chart shows the corrective structure more clearly. XRP recently bounced strongly from the $1.34-$1.36 support zone and rallied toward $1.48, but buyers were unable to break through the descending channel resistance. The rejection has since returned the price to approximately $1.40.
This leaves XRP caught between the $1.34-$1.36 support zone and descending resistance around $1.43-$1.45. A breakout above the latter would be the first meaningful indication that short-term momentum is shifting back toward buyers, potentially opening the path toward $1.48 and then $1.53-$1.55.
Conversely, another rejection followed by a loss of the $1.34-$1.36 support area would favor continuation of the correction. In that scenario, the lower boundary of the descending channel could become the next target, with the larger $1.22-$1.27 support zone providing a more substantial area of demand underneath.
For now, XRP remains in a corrective phase rather than a confirmed bearish breakdown. The reaction at the channel boundaries should provide the clearest indication of the next directional move.

The post Ripple Price Analysis: XRP Trapped in Descending Channel as Key Levels Loom appeared first on CryptoPotato.
A Brazilian bank collapse that cost depositors and insurers billions has now reached the country’s Supreme Court and presidential election.
Banco Master failed in November 2025 after attracting hundreds of thousands of savers with unusually high returns. Ten months later, allegations around its owner, Daniel Vorcaro, have pulled one of Brazil’s most powerful judges into the scandal.
On September 15, the Supreme Court is due to consider whether Justice Alexandre de Moraes should face an investigation over his contacts with Vorcaro. The hearing puts the court in the extraordinary position of examining one of its own members.

Brazil’s Biggest Banking Scandal?
Police evidence released this month alleges that the Bank’s owner Vorcaro contacted Justice Moraes shortly before his arrest. Moraes’ wife’s law firm also held a R$130 million contract with Banco Master.
Moraes denies wrongdoing. He has accused Justice André Mendonça, who oversees the investigation, of abusing his authority by releasing the material. The dispute has added a new layer to an already costly banking failure.
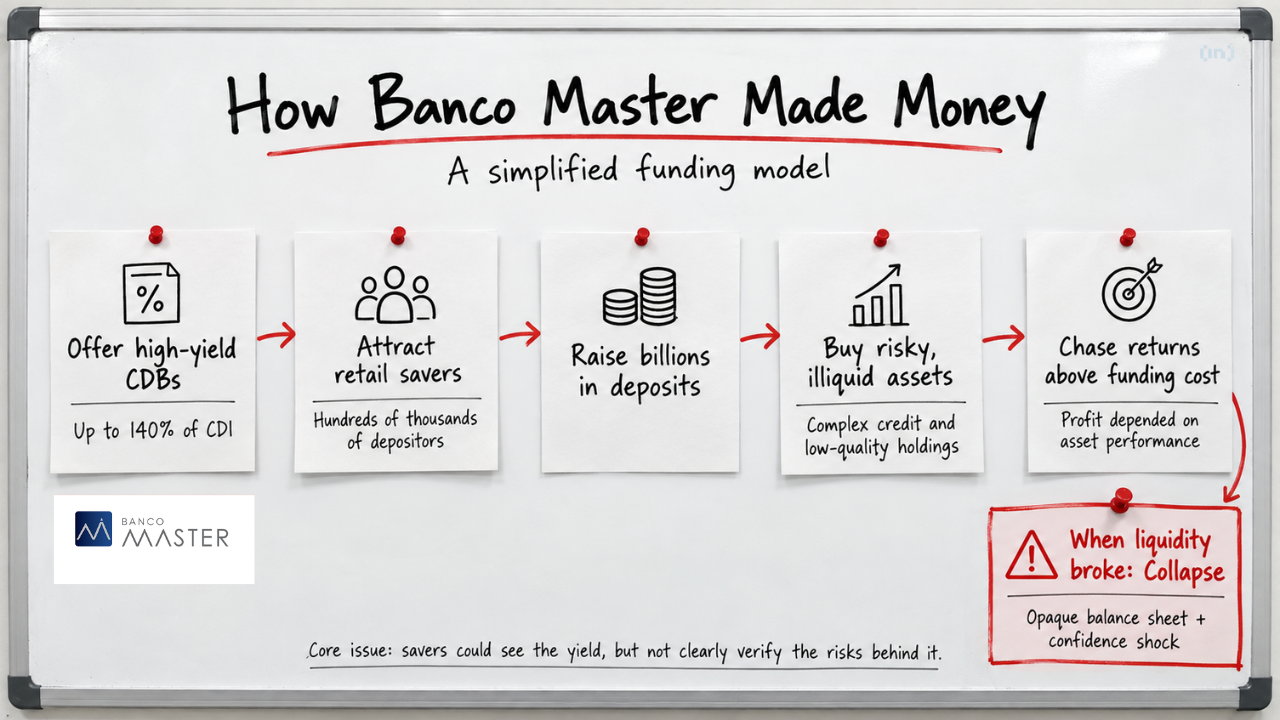
Banco Master had offered CDBs paying as much as 140% of Brazil’s CDI benchmark. It used that expensive funding to grow quickly while holding complex and illiquid assets.
Then the model broke.
Brazil’s central bank liquidated Master after citing a severe liquidity crisis and serious violations. The country’s deposit guarantee fund has since paid about R$40.2 billion to 722,000 clients linked to the group.

The legal consequences could extend further if investigators establish a conflict involving Moraes.
The legal consequences could extend further if investigators establish a conflict involving Moraes. “Potentially, but not automatically,” said João Luiz, managing partner at J. Pereira Advogados, when asked whether previous rulings could face challenges.
He said proven misconduct would not erase Moraes’ entire judicial record. However, defendants in individual cases could have stronger grounds to challenge decisions if they prove he lacked impartiality.
Meanwhile, the scandal has entered Brazil’s election campaign.
Senator Flávio Bolsonaro has called for Moraes’ removal and told supporters that voting for the current President Lula da Silva means supporting this scandal.
“Anyone who votes for Lula is voting for Alexandre de Moraes,” said Bolsonaro.
But even Bolsonaro is not free from this scandal. He also faces questions over financing linked to the Bank for a film about his father. He denies wrongdoing.
A bank that once sold extraordinary returns has now created a much larger problem for Brazil. This has now turned into a fight over trust in its courts, regulators and political system.
The post A $10 Billion Bank Collapse Is Now Shaking Brazil’s Election appeared first on BeInCrypto.
Crypto World
Standard Chartered predicts Arbitrum’s ARB to rise 70-fold to $10, citing Robinhood Chain revenue
There is a catch. ARB holders currently have no direct claim on that revenue, something Kendrick himself listed among the risks to the call. CoinDesk reported earlier this month that Robinhood Chain pays 10% of its net protocol revenue into the Arbitrum ecosystem, with 8% going to the DAO treasury and 2% to a developer fund. None flows directly to token holders currently.
Read More: Robinhood’s new crypto network is printing cash, and it’s sending Arbitrum’s token soaring
Robinhood Chain’s early growth has also come from a somewhat different crowd than the traditional-financial users behind Kendrick’s longer-term thesis. Memecoin launchpads and trading apps have supplied much of its activity even though the network was built primarily around tokenized stocks and other traditional assets.
Robinhood Chain paid about $360,000 in licensing fees in July, accounting for 35% of Arbitrum DAO income that month. The chain was generating $3.75 million in user fees by Sept. 1 and sending roughly $370,000 to Arbitrum over 24 hours.
Kendrick expects $4 trillion of traditional assets to be tokenized by the end of 2028 and sees Arbitrum capturing a growing share of the infrastructure behind them. He forecasts ARB at 50 cents by year-end, $1.50 in 2027, $3.50 in 2028, $6.50 in 2029 and $10 in 2030.


The pullback is also showing up on Kalshi, where traders are increasingly pushing any breakthrough further into the future. The contract for a crypto market structure bill becoming law before Oct. 1, 2027, fell to 36% Tuesday, down from around 53% Monday morning.
For comparison, traders on Monday had put the chances of passage before July 1, 2027, at 53%. By Tuesday, the longer timeline was looking more plausible: Kalshi traders gave the bill, or another qualifying crypto market structure measure, a 51% chance of becoming law only by Jan. 1, 2028.
The reversal comes after prediction markets surged on Monday on hopes that Republican concessions could finally break the months-long stalemate. That optimism quickly faded as banking groups pressed lawmakers to tighten restrictions around stablecoin interest and rewards, while a bipartisan group of state attorneys general warned the legislation could weaken states’ ability to police crypto-related fraud.
Republicans released what they called their final draft over the weekend after making more than 100 changes requested by Democrats, including concessions on ethics provisions. The Senate is scheduled to vote Tuesday afternoon on whether to invoke cloture on the motion to proceed, which requires 60 votes.


The European Central Bank (ECB) on Tuesday called on e-commerce and mobile commerce merchants in the euro zone to join a digital euro pilot as it prepares a retail central bank digital currency (CBDC) for possible issuance in 2029.
The pilot will test the technology, operational processes and user experience of a beta version of the currency, which will resemble the digital euro, but will not be legal tender.
The ECB’s call for merchants is about more than just technical testing. A digital euro will need enough places to spend it if consumers are to use it, making merchant acceptance a commercial question as much as a policy one.
“Many people think the digital euro’s success will depend on how governments and the public sector explain its usefulness,” Isadora Arredondo, vice president of global policy at Hedera, told CoinDesk via LinkedIn. “But the more difficult part will be making the project work commercially.”
Arredondo said merchants would need incentives to join in sufficient numbers and to ensure consumers do not encounter barriers when paying. One option, she said, could be for payment service providers to lower the fees merchants pay to accept digital-euro payments.

The US House Ways and Means Committee is set to consider a 114-page cryptocurrency tax package on Wednesday, designed to bring more structure to several areas of digital-asset taxation. The bill, H.R. 10357—the Digital Asset Tax Certainty Act—was published alongside the committee’s markup materials on Monday.
While the proposal retains multiple provisions affecting mining and staking, it does not include a key feature that would have delayed taxes on new rewards until the tokens are actually sold for cash. That omission could be a practical sticking point for miners and stakers who argue that taxing rewards as soon as they are received may create liquidity problems.
Key takeaways
- The House Ways and Means Committee will mark up H.R. 10357 (the Digital Asset Tax Certainty Act) on Wednesday, with markup text published Monday.
- The bill removes a proposed rewards-timing option that would have allowed deferring taxation until sale, as described in Rep. Mike Carey’s earlier staking/mining legislation.
- Beyond mining and staking, the package targets multiple tax mechanics, including treatment of network/transaction fee payments (up to $10) and special rules for certain stablecoins.
- The proposal extends wash-sale and constructive-sale style rules to crypto and creates a voluntary disclosure pathway for taxpayers seeking to remedy past digital-asset tax issues.
- The House effort arrives as the Senate weighs the CLARITY Act, which would reshape how federal regulators split oversight of crypto markets.
What the House bill keeps—and what it drops
H.R. 10357 is framed as a broad effort to reduce uncertainty in how the tax code applies to digital assets. According to the committee’s bill text, it would classify income from blockchain validator activities as ordinary income and address whether such income is sourced within or outside the United States.
The package also includes provisions meant to preserve the tax status of certain investment trusts that stake qualifying digital assets. In other words, it attempts to address questions that matter not just to individuals, but also to broader investment structures.
However, the legislation stops short of including a rewards-timing provision that had been part of Rep. Mike Carey’s earlier “Tax Clarity for Mining and Staking Act,” which was introduced in June. In the earlier proposal, taxpayers would have had a choice: treat newly created tokens as income when received, or instead handle them in a manner akin to self-created property—effectively triggering taxation when the tokens are sold.
Without that option, the underlying tax treatment in the House package keeps mining and staking rewards taxable when received or when they come under the recipient’s control, potentially before any cash sale occurs.
How H.R. 10357 handles payments, stablecoins, and ordinary crypto transactions
Beyond staking and mining, the bill targets several areas that have repeatedly complicated day-to-day crypto reporting.
For one, the proposal includes a mechanism to prevent taxpayers from recognizing gains or losses when crypto is used to pay network or transaction fees of up to $10. That change is aimed at reducing the tax friction that can arise from frequent, small fee payments across on-chain activity.
The bill also proposes special tax treatment for qualifying US dollar stablecoins and includes rules allowing certain qualifying digital asset loans to occur without being treated as taxable sales. Additionally, it calls for simplified accounting for widely traded crypto assets, a category that generally reflects the reality that many taxpayers interact with large, liquid assets rather than a narrow set of obscure tokens.
Another major thread in the proposal involves expanding rules commonly associated with wash sales and constructive sales. In practice, those provisions are meant to limit tax outcomes that can be achieved by replacing an asset before taxes are realized—rules that the bill would extend to crypto.
Voluntary disclosure and the push for “certainty”
H.R. 10357 also creates a voluntary disclosure program for taxpayers who want to correct earlier digital-asset tax violations. The existence of such a path suggests the committee is not just writing new rules, but also attempting to manage the compliance landscape for taxpayers who may have already made reporting decisions under prior ambiguity.
The committee’s markup process did not begin with H.R. 10357 alone. Earlier in June, Ways and Means circulated seven crypto tax drafts ahead of a digital asset taxation hearing. Those proposals reportedly covered stablecoins, mining and staking, and measures aimed at reducing the tax-reporting burden created by the structure of crypto transactions.
As the process developed, industry stakeholders pressed for specific changes. Reporting on earlier advocacy noted that the Blockchain Association, Crypto Council for Innovation, and Digital Chamber urged Congress to pass Rep. Carey’s legislation as introduced, arguing that taxing staking and mining rewards before tokens can be sold risks creating liquidity problems. They also opposed an amendment that would have limited the potential deferral to five years.
In this latest House package, that rewards-timing aspect did not survive into the committee’s published markup text. That makes Wednesday’s committee consideration especially significant for miners, stakers, and their tax advisors—because it determines whether liquidity concerns remain central to the bill’s final form or are addressed only indirectly through other provisions.
House tax drafting unfolds alongside Senate market-structure debate
The House crypto tax package is moving forward as lawmakers elsewhere consider a separate but related policy track: the CLARITY Act, which would clarify how the US Securities and Exchange Commission and the Commodity Futures Trading Commission divide oversight of the crypto market.
While H.R. 10357 focuses on taxation mechanics—how and when gains, income, and losses are recognized—the Senate’s regulatory-oversight debate affects a different dimension of the same ecosystem: what kinds of activities, products, and exchanges may fall under which regulator’s authority. For investors and builders, those questions can influence compliance costs, product design, and the willingness of firms to offer services that touch on crypto’s broader market infrastructure.
Taken together, the developments show Congress grappling with both “how to tax” and “how to regulate,” two policy domains that often move at different speeds but ultimately affect similar stakeholders.
As the House committee considers H.R. 10357 on Wednesday, market participants should watch whether the missing rewards-timing provision becomes a focal point for amendments, and whether the bill’s other operational changes—fee de minimis treatment, stablecoin rules, and the expansion of wash/constructive-sale style restrictions—survive intact into any later legislative steps.
Bitcoin is entering a potentially decisive macro catalyst with its short-term structure already under pressure. The asset has drifted back toward the lower boundary of its recent consolidation, while the market awaits tomorrow’s FOMC interest-rate decision, an event that could trigger a sharp expansion in volatility as expectations remain heavily skewed toward a rate increase.
Bitcoin Price Analysis: The Daily Chart
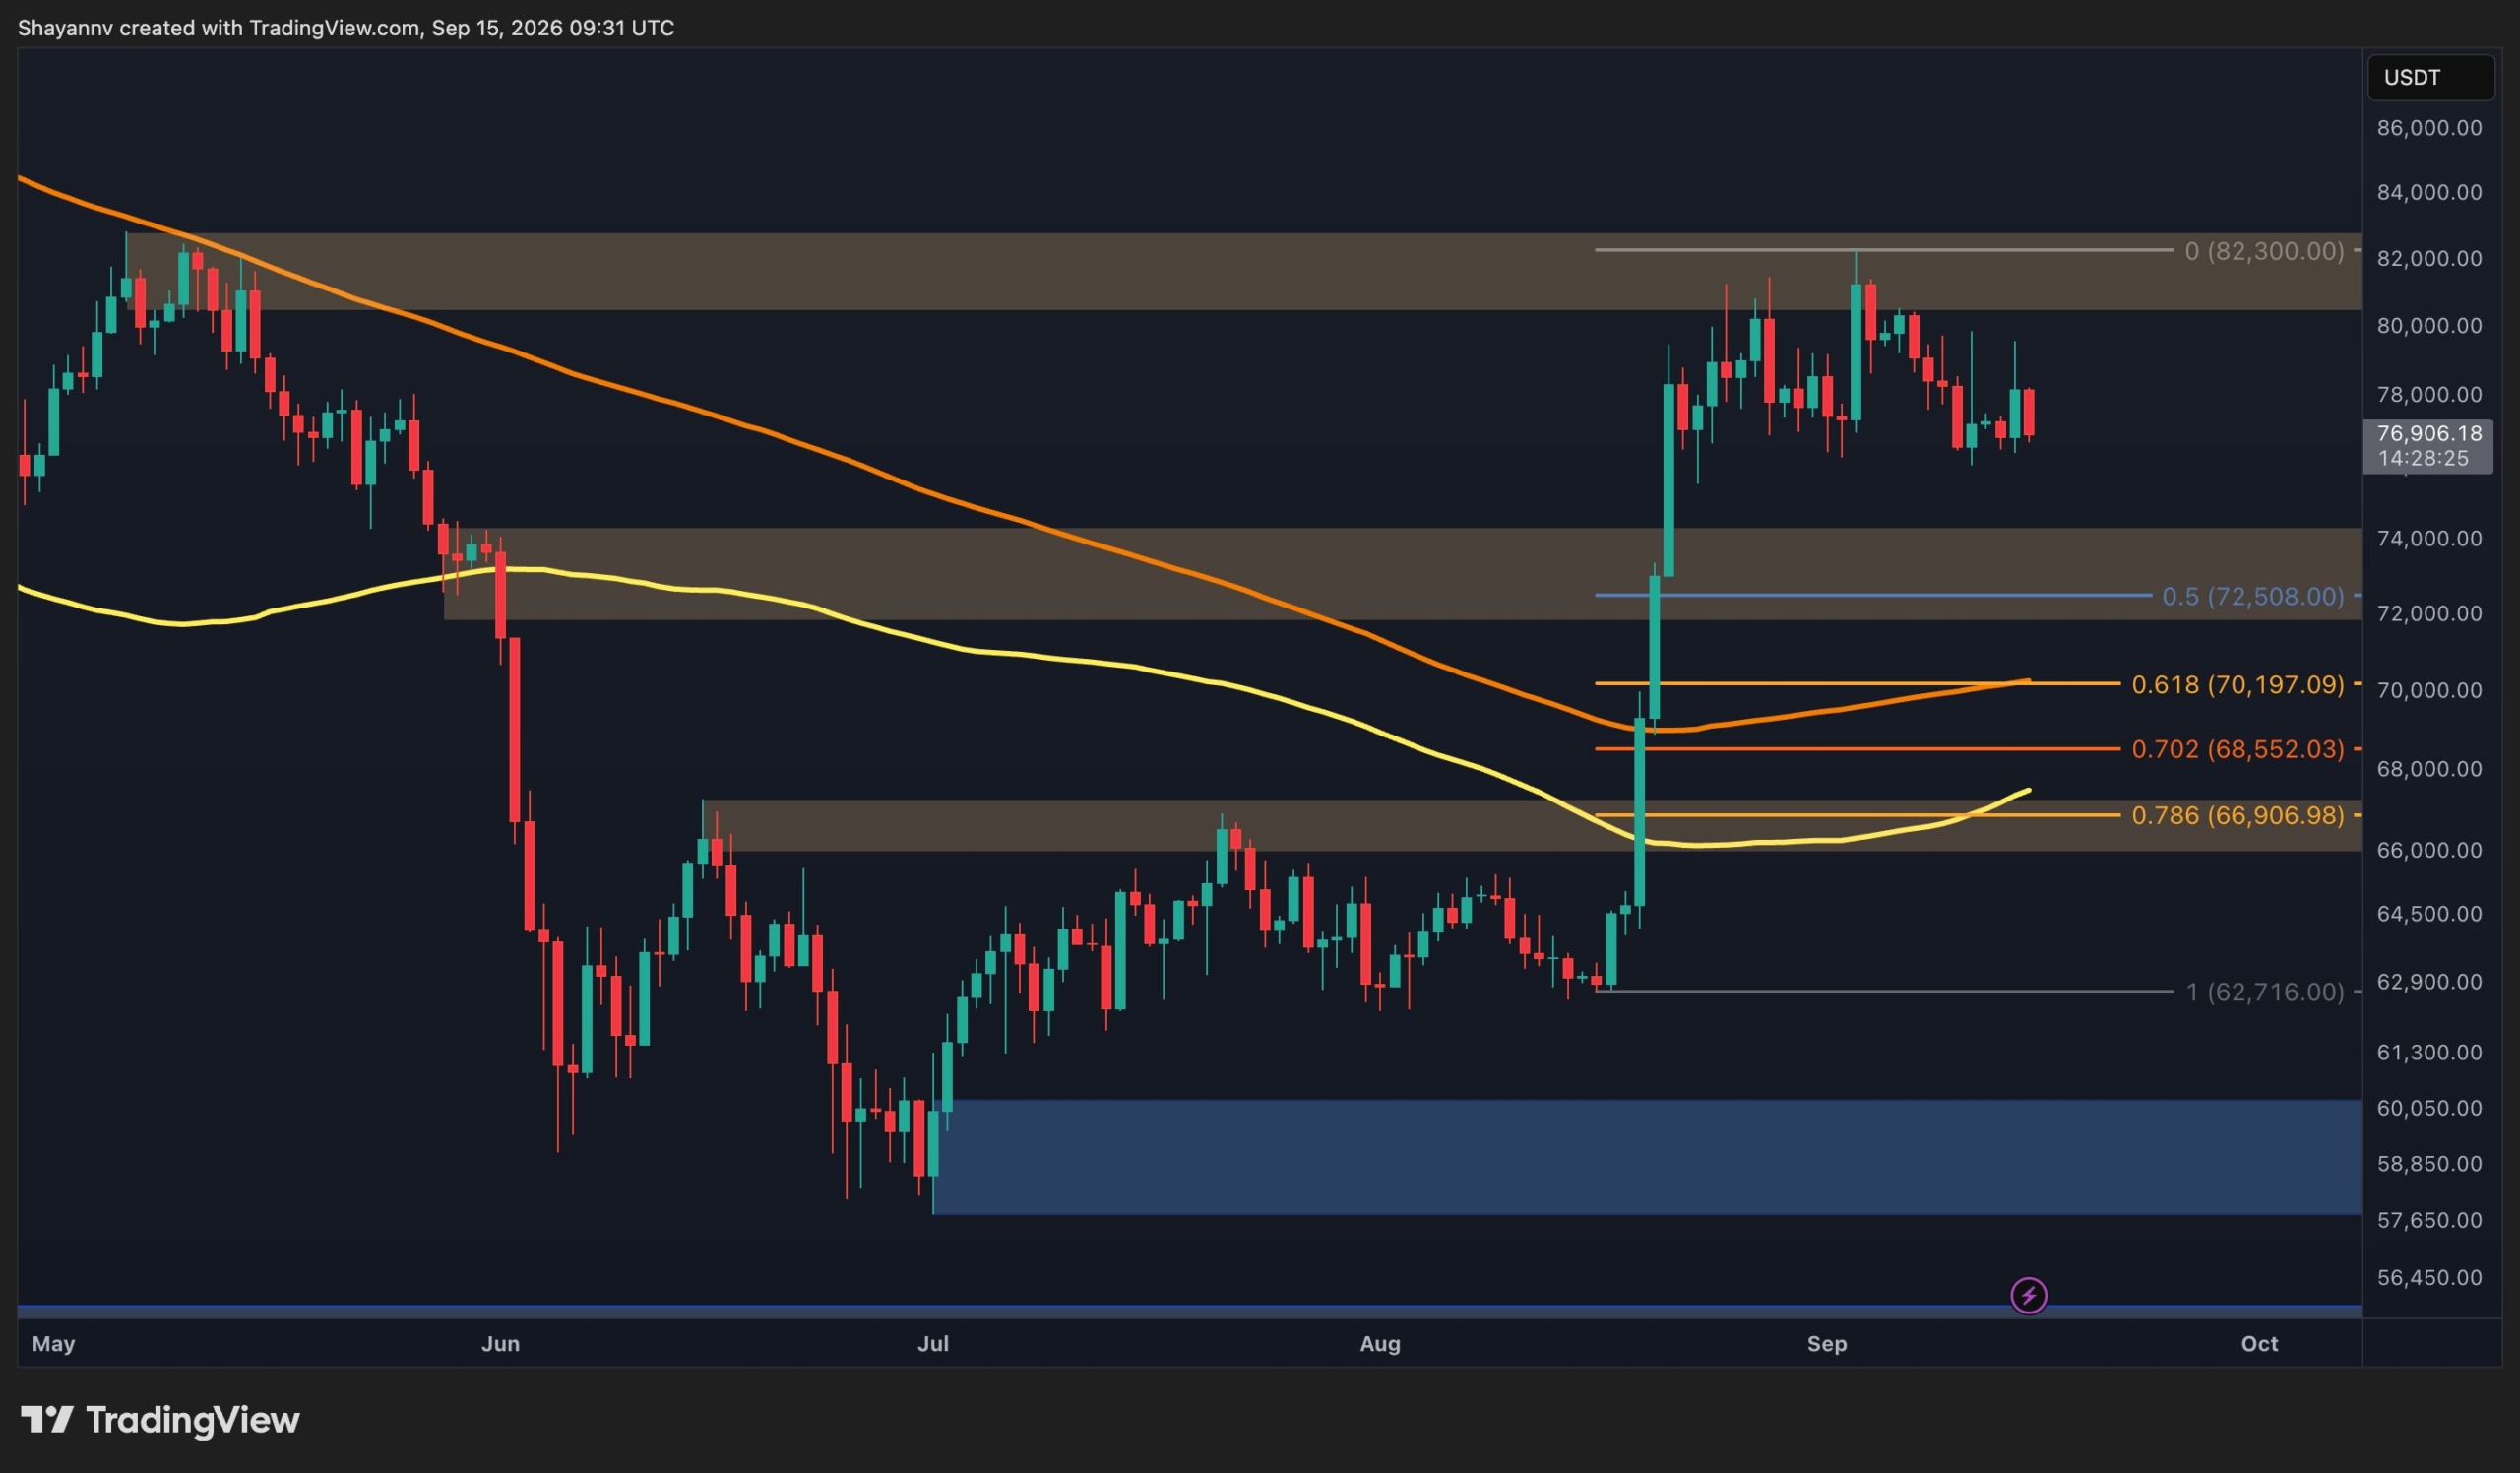
On the daily timeframe, Bitcoin is trading around $77K after repeatedly failing to establish itself above the $80K-$82.3K resistance zone. The rejection from this area has gradually weakened momentum, with the latest sequence showing lower highs and renewed pressure toward the lower end of the post-breakout range.
Despite this weakness, the broader structure has not broken down yet. The explosive August rally remains intact as long as BTC holds above the major support areas underneath. The first significant downside region is the $72K-$74K zone, with the 0.5 Fibonacci retracement positioned near $72.5K. Below it, the 0.618 retracement around $70.2K and the moving average provide another important confluence.
Therefore, a deeper correction toward $72K-$74K would not necessarily invalidate the broader bullish structure. However, continued rejection from $80K-$82.3K combined with a loss of these lower supports would indicate that the post-breakout correction is becoming considerably more significant.
BTC/USDT 4-Hour Chart
The 4-hour timeframe puts the immediate risk into sharper focus. BTC has been moving inside a broad ascending channel since the August breakout, but recent price action has progressively shifted toward its lower boundary.
The latest rejection from around $79K has pushed BTC back to roughly $76.9K, placing the market directly around the ascending support near $76K-$77K. This makes the current area particularly important. A decisive breakdown could confirm that the multi-week consolidation is resolving lower rather than simply continuing within the channel.
In that scenario, the $72K-$74K support zone becomes the primary downside target. Conversely, another successful defense of $76K-$77K could preserve the range and allow BTC to rotate back toward $79K-$80K, followed by the major $80.5K-$82.3K resistance zone.
With the FOMC meeting approaching tomorrow, however, short-term technical signals may become less reliable as traders wait for the interest-rate decision. The proximity of price to channel support means that any volatility generated by the announcement could determine whether the current structure survives or finally breaks.

Sentiment Analysis
Bitcoin’s Futures Average Order Size provides additional context on participation in the derivatives market. The latest readings are predominantly gray and light green around the $77K-$80K region, indicating a mixture of normal orders and smaller whale activity rather than clear dominance from exceptionally large participants.
Notably, the recent price recovery toward $80K has not been accompanied by the kind of concentrated large-order activity that would clearly signal aggressive conviction from major futures traders. This fits with the hesitant price action visible on the technical charts, where BTC has struggled to generate sustained momentum despite remaining relatively close to its recent highs.
With the FOMC decision now approaching, this lack of decisive positioning may also reflect traders reducing conviction ahead of a major macro event. A meaningful increase in larger orders after the announcement, particularly alongside a confirmed move away from the current $76K-$77K support area, could provide a stronger indication of where institutional futures participants expect Bitcoin’s next directional leg to develop.

The post Bitcoin Price Analysis: BTC Tests Key Support Ahead of Crucial FOMC Decision appeared first on CryptoPotato.
Chainlink price traded near $11.41 after failing to hold its latest rebound, while weak momentum and liquidity below $11.20 raised the risk of another decline.
Summary
- Chainlink price remained below the $11.72 resistance after retreating from its September peak near $13.60.
- Daily Aroon readings showed fading upward momentum, with Aroon Up falling to 7.14%.
- 4-hour Bollinger Bands placed immediate support near $11.20 and resistance around $11.68.
- Liquidation clusters near $11.00 could draw the price lower if the current support range fails.
Chainlink price remains under pressure
Chainlink (LINK) price was trading around $11.41 at the time of writing, down 0.91% on the daily candle after moving between $11.30 and $11.63. The token remained close to the lower end of its intraday range as buyers struggled to extend a brief recovery.
LINK has lost much of the advance that carried it from approximately $8.20 in early August to a September high near $13.60. The rally accelerated after the price broke through $9.40 and later cleared $11.00, but selling increased once the token moved above $13.00.
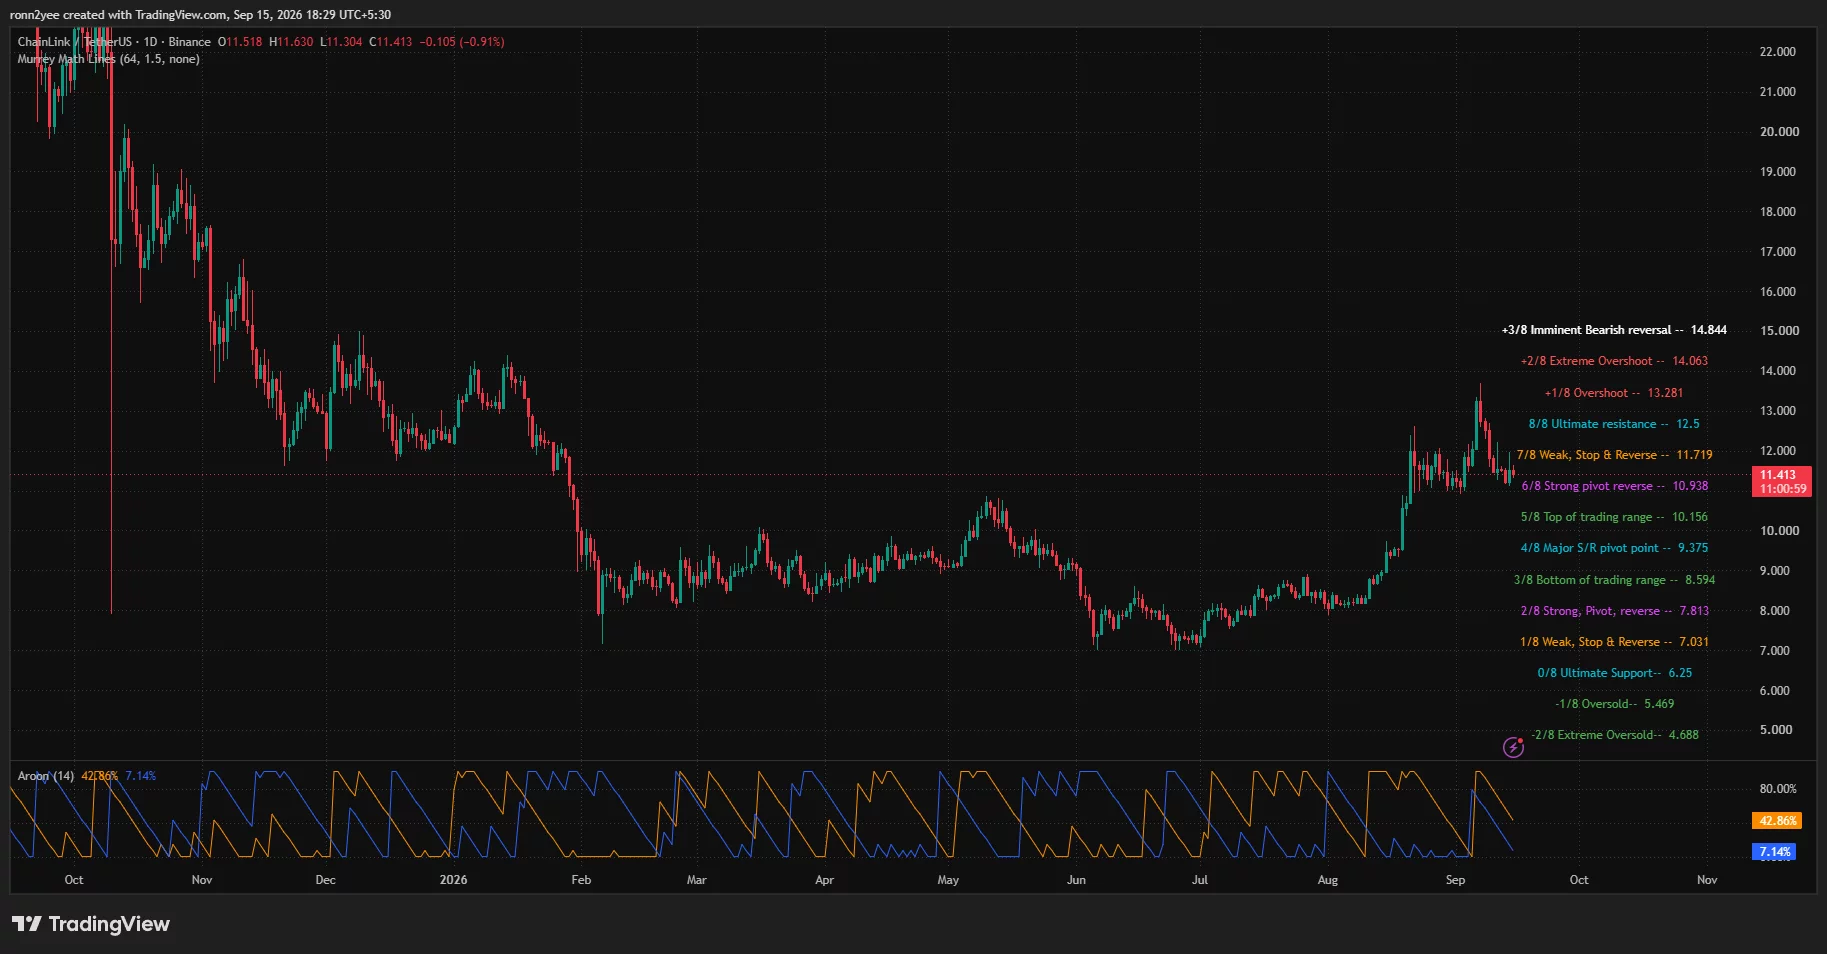
Price has since formed a sequence of lower highs and lower lows. The latest bounce stalled below $11.70, leaving LINK beneath the $11.72 Murrey Math resistance level on the daily chart.
The broader crypto market also faced pressure as investors assessed inflation, energy prices and the outlook for U.S. interest rates. Expectations that the Federal Reserve could keep borrowing costs restrictive reduced demand for higher-risk assets, including cryptocurrencies that do not offer a fixed yield.
Uncertainty surrounding the Digital Asset Market Clarity Act added another U.S.-specific risk for crypto traders. A delayed or unsuccessful Senate vote could weaken expectations for near-term regulatory clarity, although LINK’s immediate move remained closely tied to its technical setup and wider market direction.
Daily indicators show fading LINK momentum
The daily chart showed LINK holding above the 6/8 Murrey Math level at $10.94, which now serves as the nearest major pivot. Price previously used the area around $11.00 as a breakout level during its August rally, making the zone important for the short-term trend.
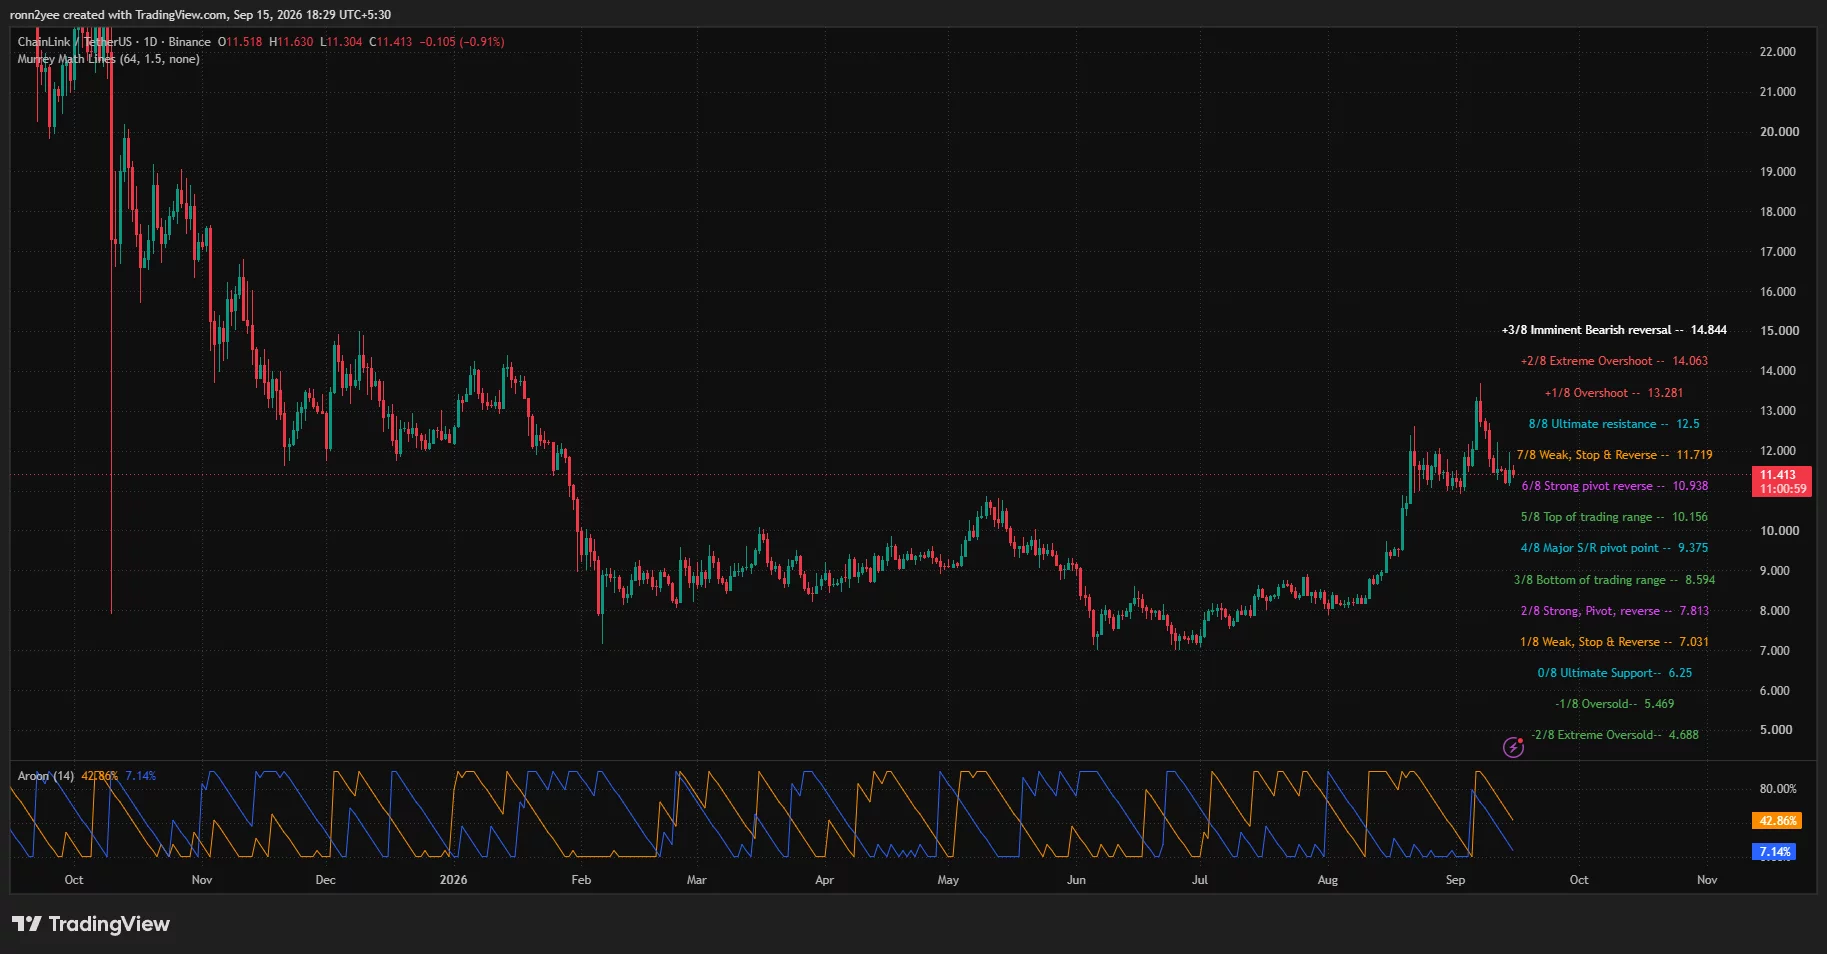
Aroon readings pointed to weakening bullish control. Aroon Up stood at 7.14%, while Aroon Down was at 42.86%. The wide gap suggests that LINK has not recorded a recent high, while downside pressure remains more active.
The readings do not confirm a fresh breakdown on their own, but they support the pattern of declining momentum since the early September peak. Buyers would need to reclaim $11.72 before LINK could attempt another move toward the 8/8 resistance at $12.50.
A break above $12.50 would expose the next Murrey Math targets at $13.28 and $14.06. LINK would still need stronger volume and broader market support to reach those levels, particularly after its rejection from the $13.00–$13.60 region.
If $10.94 fails, the daily chart places the next support at $10.16. A deeper correction could then bring the major $9.38 pivot into focus, although such a move would require a clear loss of the current $11.00 support area.
4-hour chart keeps $11.20 support in focus
LINK was trading slightly below the 4-hour Bollinger Band midpoint at $11.44. The upper band stood near $11.68, while the lower band was around $11.20.
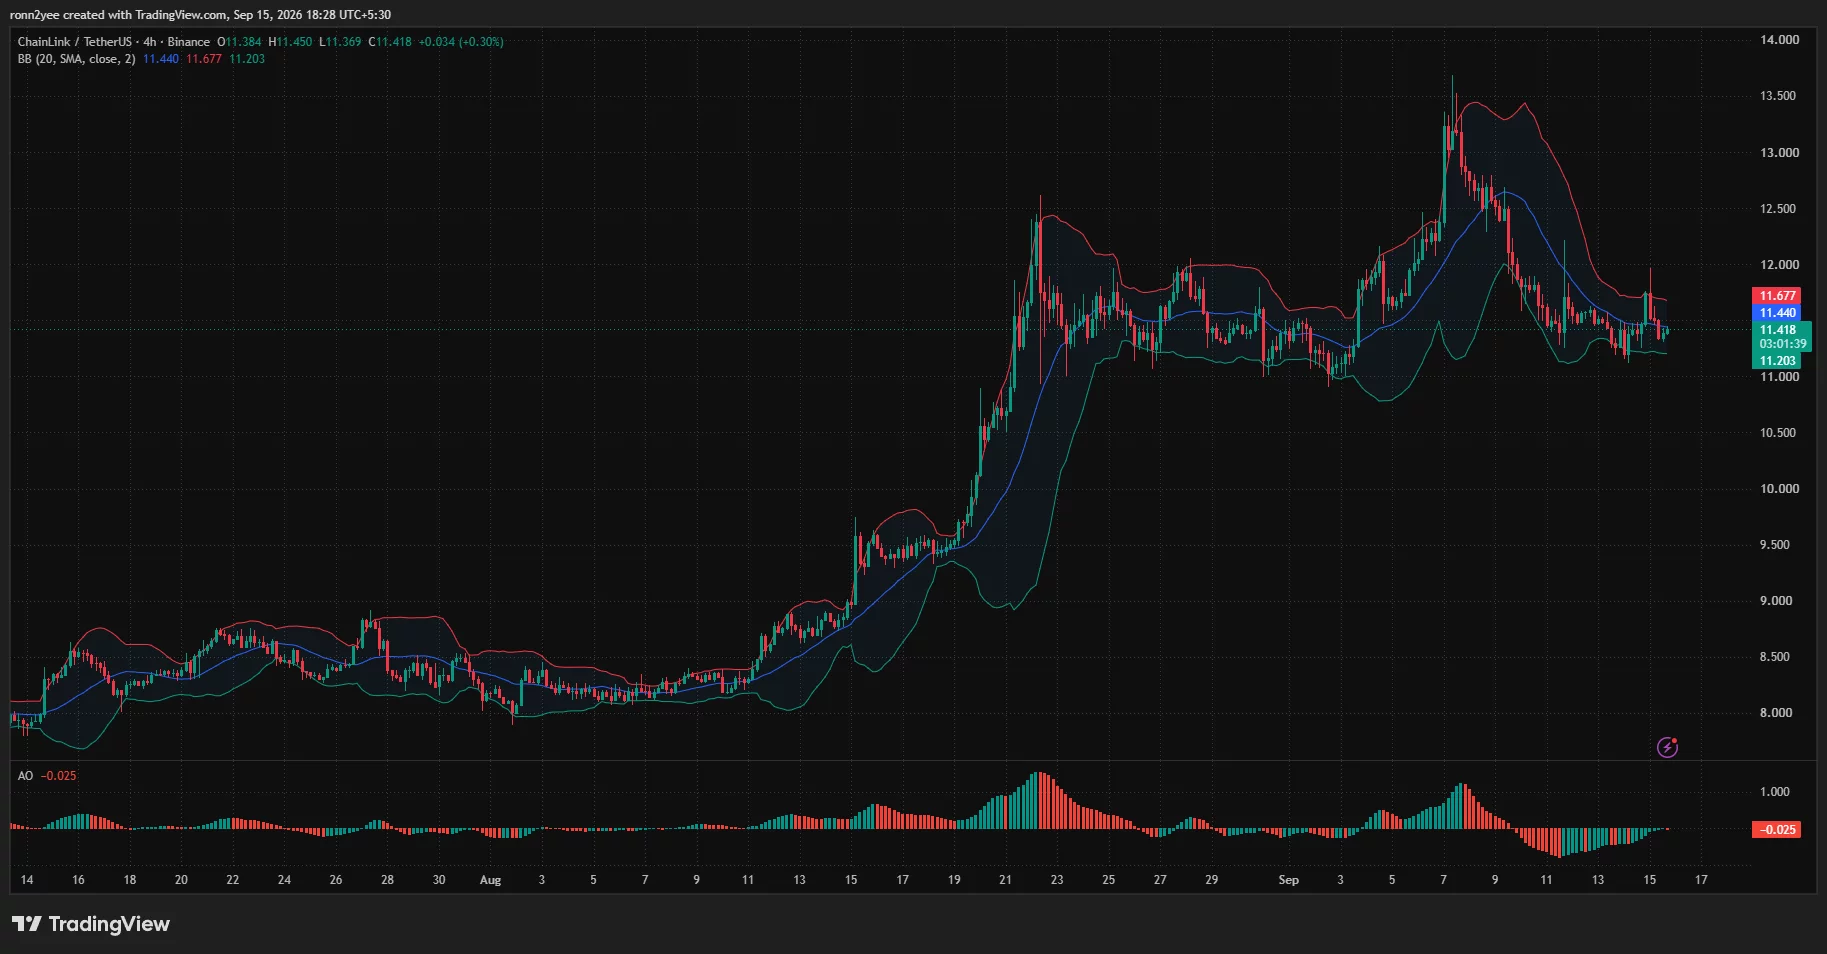
The narrow distance between the bands reflected reduced volatility following the sharp decline from the September high. Price has moved sideways between roughly $11.20 and $11.70, creating a short-term consolidation range.
A close above the Bollinger midpoint would be an early sign that buyers are regaining control. LINK would then need to break $11.68–$11.72 to challenge the psychological $12.00 level.
The Awesome Oscillator remained marginally negative at -0.025. Its red bars had shortened, indicating that bearish momentum was easing, but the indicator had not yet moved decisively above zero to confirm a bullish shift.
Failure to defend the lower Bollinger Band could send LINK toward the daily pivot at $10.94. Conversely, a breakout above the upper band would weaken the short-term bearish structure and increase the chance of a recovery toward $12.00 and $12.50.
Liquidation map points to liquidity near $11
CoinGlass’ one-week liquidation heatmap showed a dense concentration of leveraged positions below the current price, particularly around $11.00–$11.15. The strongest lower cluster appeared close to $11.05, with additional liquidity extending toward $10.90.
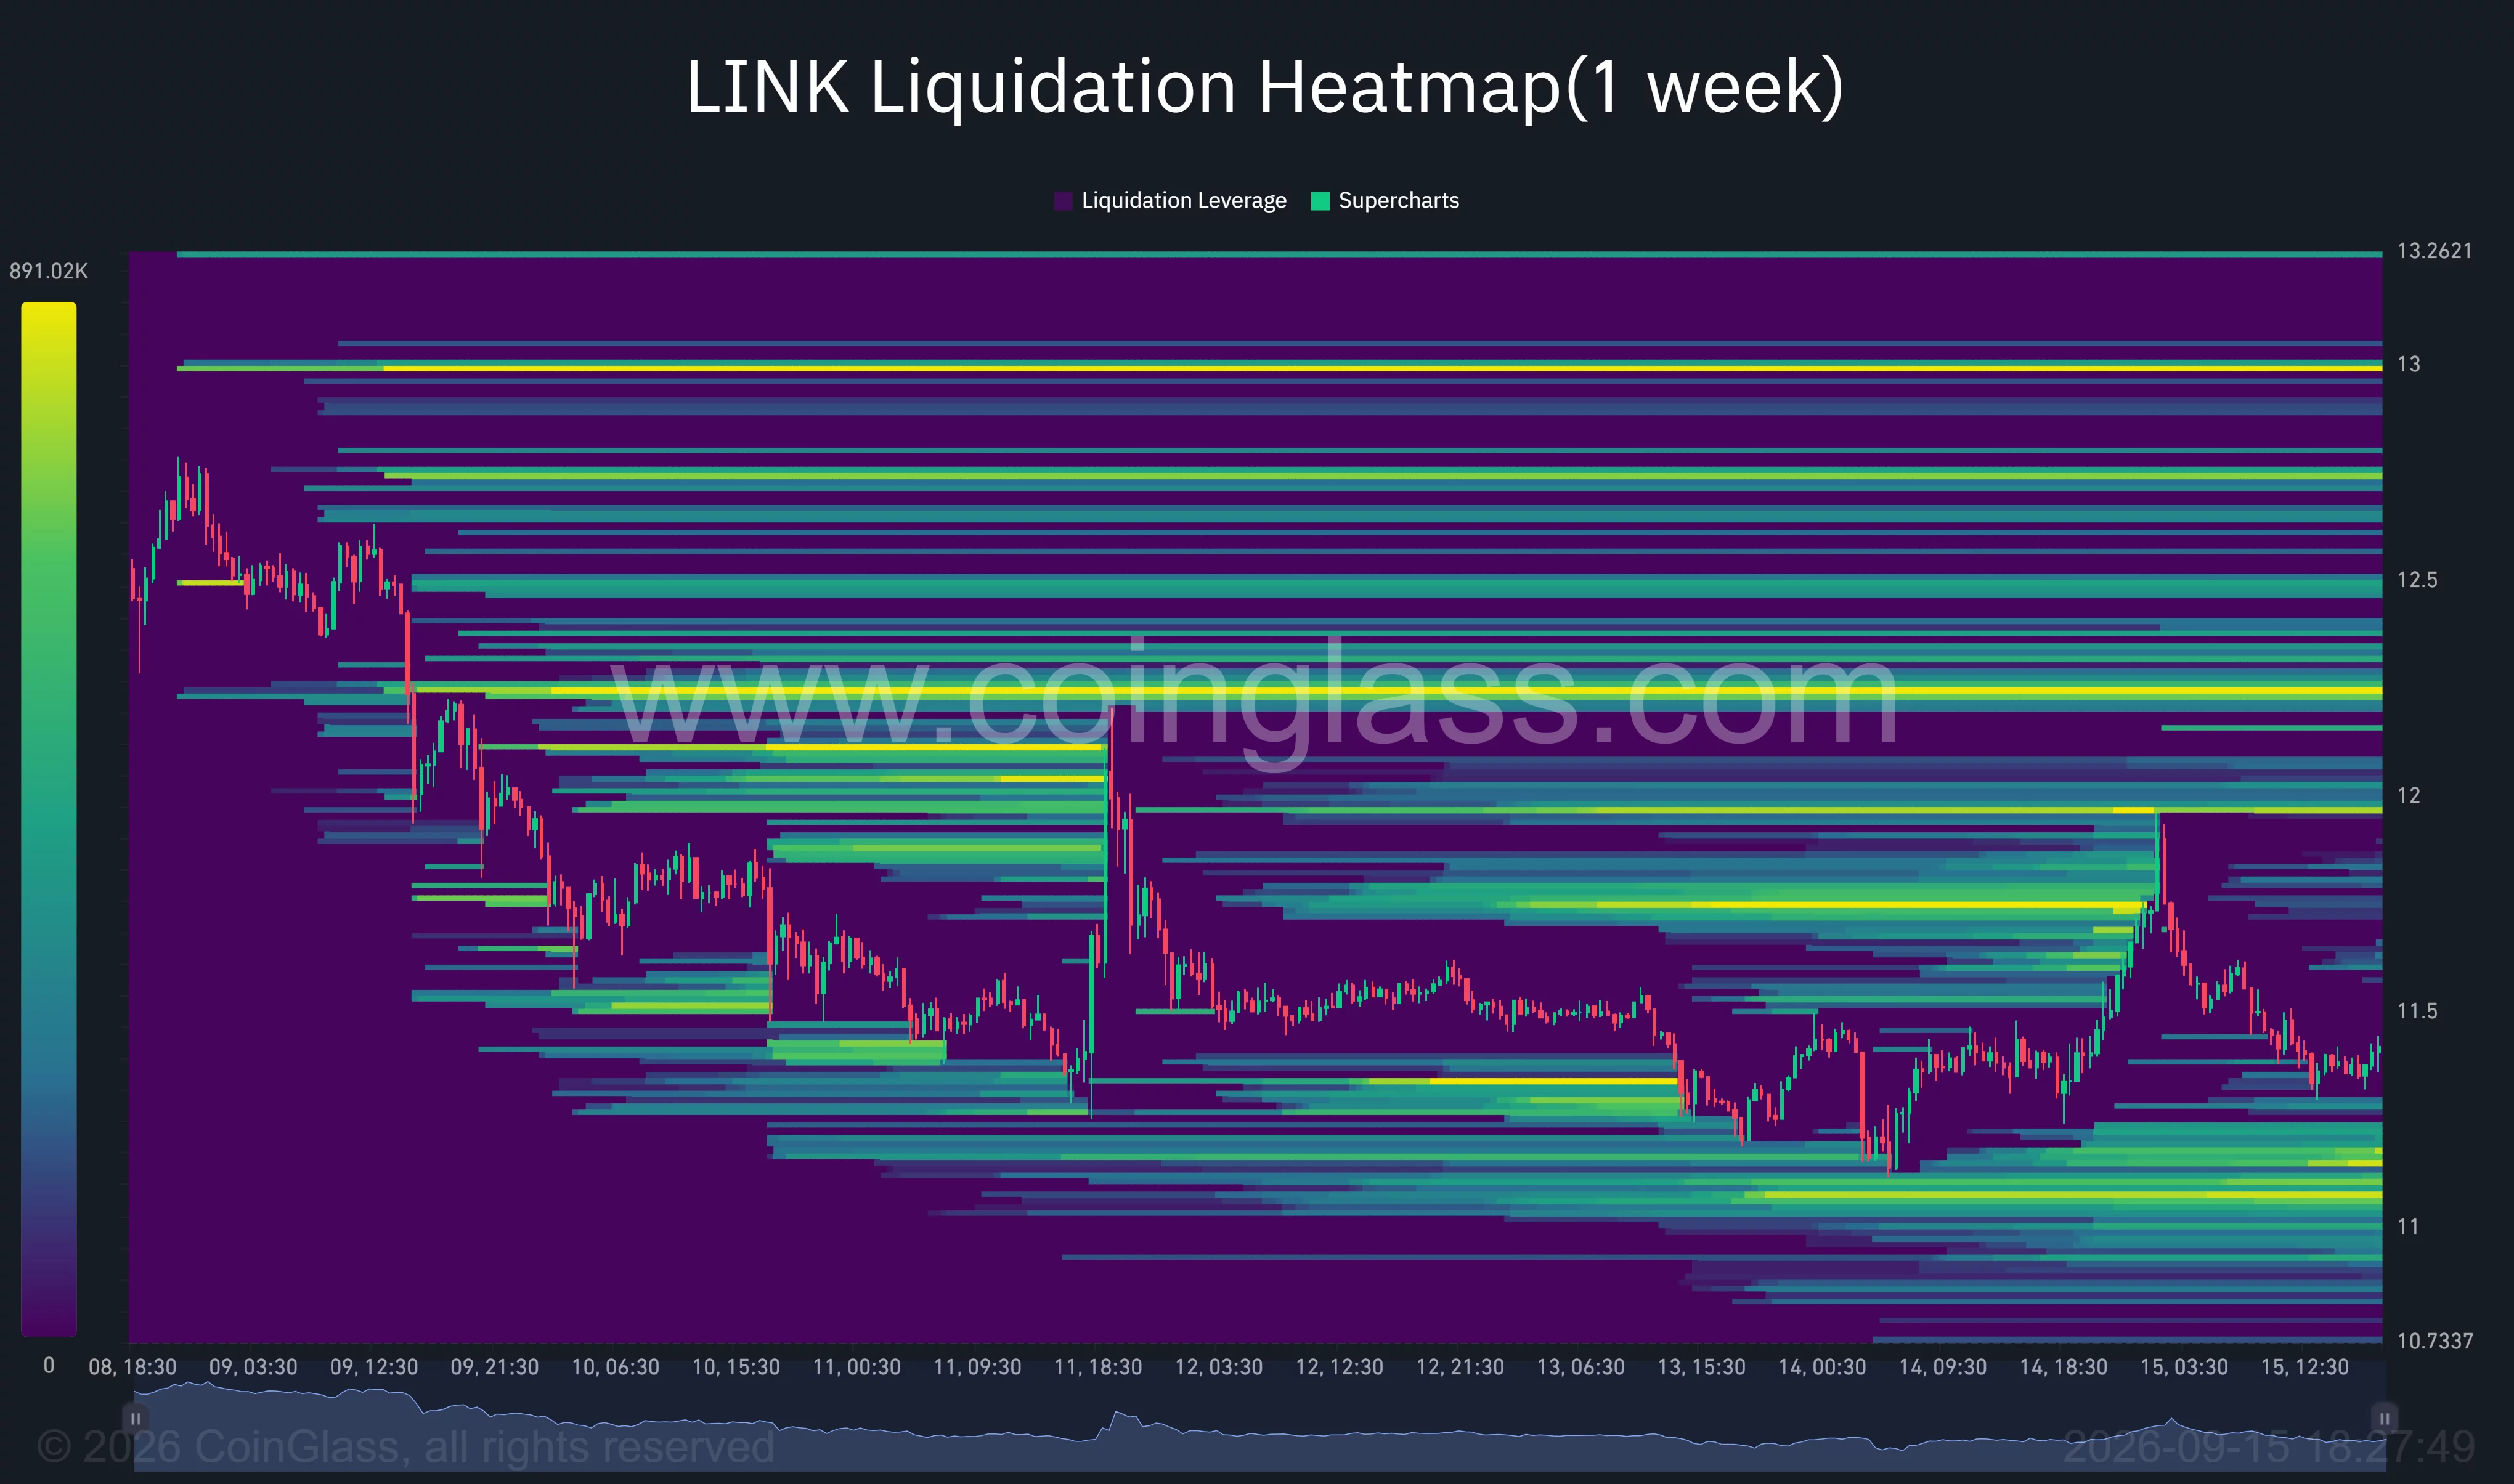
Large liquidation concentrations can attract price as traders target areas where leveraged positions may be forced to close. A drop below $11.20 could therefore accelerate toward $11.00 if long liquidations add mechanical selling pressure.
Upside liquidity was spread across several levels. The nearest visible concentrations sat around $11.70–$12.00, followed by stronger bands near $12.20 and $12.50. A particularly large cluster was visible around $13.00, although LINK would first need to reverse its lower-high structure to approach it.
The uneven distribution leaves LINK exposed to volatility in either direction. Lower liquidity sits closer to the current price, making the $11.00 region the more immediate level, while a break above $11.72 could force short positions to close and support a faster recovery.
For now, $10.94–$11.20 forms the main support zone, while $11.68–$11.72 remains the first resistance range. A decisive close outside those boundaries could determine whether LINK extends its correction toward $10.16 or begins another attempt at $12.50.
Disclosure: This article does not represent investment advice. The content and materials featured on this page are for educational purposes only.

TIME’s 2026 LATINO LEADERS LIST INCLUDES:
Ana Valdez, president and CEO of Latino Donor Collaborative
Cástulo de la Rocha, president and CEO of AltaMed Health Services Corporation
Jose Alvarado, NBA champion
Julián Castro, CEO of the Latino Community Foundation
Luana Lopes Lara, COO and co-founder of Kalshi
Marina Larroudé, co-founder of Larroudé
Mónica Ramírez, founder and president of Justice for Migrant Women
Nelson German, chef and restaurateur
Rachel Zegler, actor and singer
Ronaldo Salgado and Lorenzo Salgado Jr., advocates
Sofia Carson, actor, singer, and advocate
PepsiCo is the premier partner of TIME Latino Leaders.
To recognize this year’s honorees, TIME will host a special cocktail reception celebrating TIME’s fourth annual Latino Leaders list in Miami on October 27th, presented by premier partner PepsiCo. The evening will feature remarks from actor, singer, and advocate Sofia Carson, CEO of the Latino Community Foundation Julián Castro, CEO, Latin America, and Global Chief Strategy & Transformation Officer at PepsiCo Athina Kanioura, and more.

Lucy Letby inquiry latest: Nurse’s ‘boyfriend’ doctor ‘put her before patients’

Cops Searched Flock’s 19,000-Camera Surveillance Network for Reasons Like ‘LMAO’ and ‘IDK,’ EFF Finds

Fed, Bessent Fight For Credibility As 10-Year Treasury Yield Tops 5%



-

 Fashion4 days ago
Weekend Open Thread – Corporette.com
-

 Business6 days ago
Micron Stock Climbs Above $1,031 as AI Memory Crunch and a $50 Billion Outlook Fuel the Rally
-
 Tech2 days ago
The Latest Weird Thing to Play Doom Is the Mapped-Out Brain of a Fruit Fly
-

 Business6 days ago
AMD Stock Climbs After Management Lifts 2027 Data Center Outlook Toward $70 Billion in AI Sales
-

 Crypto World7 days ago
Robinhood Stock: How To Take Advantage With Reduced Risk
-
 Crypto World7 days ago
Bitcoin price risks $76K drop as $78K support weakens
-

 Crypto World4 days ago
XAG/USD: Silver’s Short-Term Rally Meets Its Moment of Truth
-
 Crypto World5 days ago
2 Chip Stocks Broke Out This Week. Neither Was Nvidia
-
 Crypto World7 days ago
Ethereum price stalls below $2,500 as ADX drops to 11
-

 Business4 days ago
10 Most-Streamed Songs On Spotify In 2026 So Far, Led By Ella Langley’s Dominant Run On The Charts This Year
-

 Tech5 days ago
Battery life is the only iPhone 18 Pro and iPhone Duo upgrade I care about. Apple didn’t disappoint
-

 Crypto World5 days ago
OKX launches 10x OpenAI, Anthropic X-Perps in Europe
-
 Crypto World7 days ago
Intel Stock Jumps 9% on Chip Price Hike Report, US Stake Gains $36 Billion
-

 Crypto World6 days ago
Pi Network ships Protocol 27 on a network with 14 million users and zero DeFi
-

 Crypto World4 days ago
Diesel Tops $6 a Gallon for the First Time as 28 States Set Records
-

 Tech6 days ago
Apple Watch Ultra 4 vs Watch Ultra 3: Should you really spend another $799?
-

 Crypto World7 days ago
CLARITY Act runs out of calendar as crypto regulation stalls
-

 News Videos4 days ago
Facing Financial Fears
-
 Crypto World6 days ago
Bitcoin price risks $70K if $78K neckline breaks
-
 Crypto World6 days ago
Bitcoin price holds near $79K as cycle drawdowns narrow
You must be logged in to post a comment Login