
Crypto World
Ethereum Price Prediction: Singapore Largest Bank Launches Gold on ETH
One of Singapore’s largest banks just handed Ethereum a significant institutional vote of confidence. OCBC has launched GOLDX, a tokenized physical gold fund on Ethereum, a move that will reshape how Asian institutional capital flows into public blockchain infrastructure. Following this, our Ethereum price prediction model pops with the most bullish in months.
OCBC, in partnership with its asset management arm Lion Global Investors and digital asset exchange DigiFT, issued GOLDX, targeting institutional investors, hedge funds, and asset managers, with the underlying fund carrying roughly $525 million in assets under management as of April 16. Investors can subscribe using stablecoins or fiat, with tokens delivered directly to blockchain wallets.
“We believe digital assets will play an increasingly important role in financial services,” said Kenneth Lai, OCBC’s head of global markets.
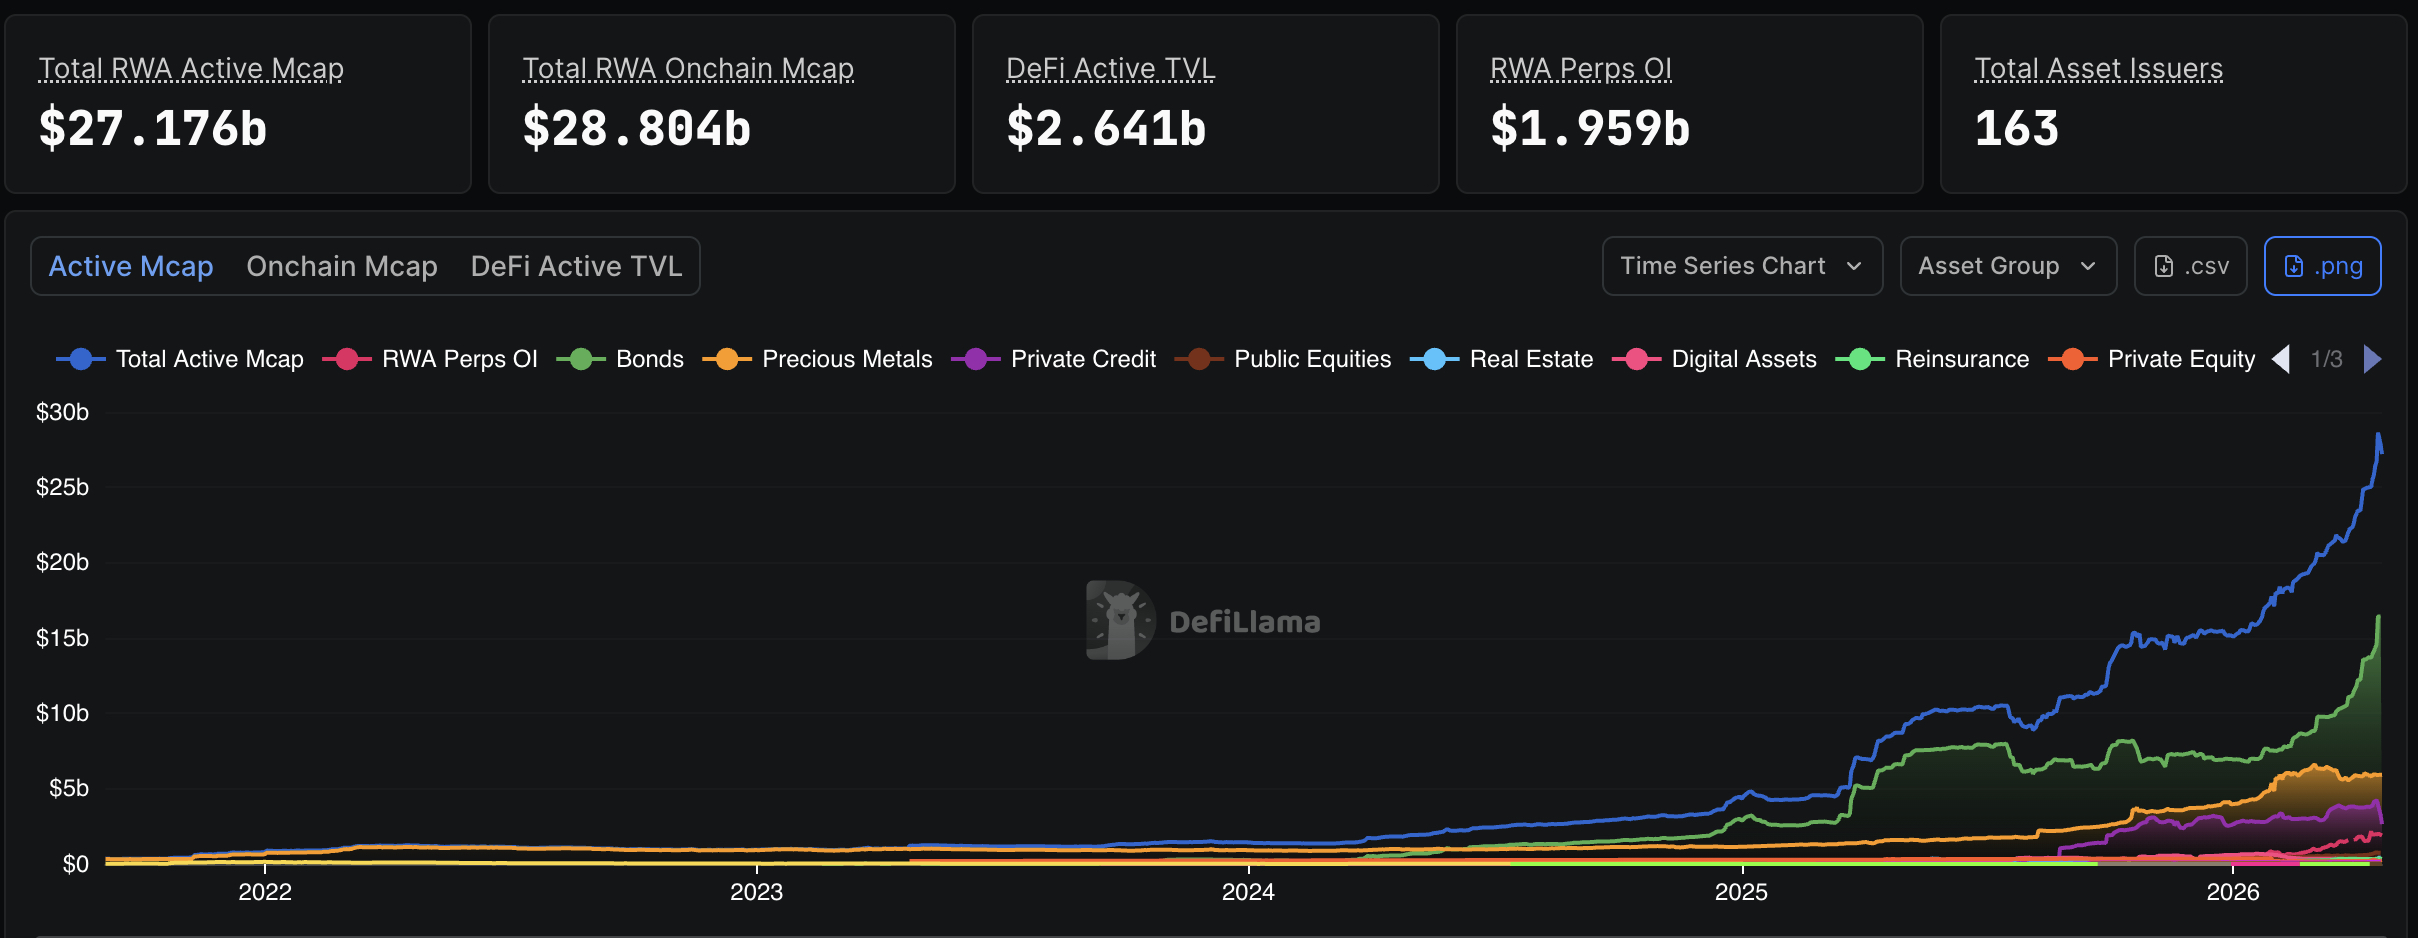
The broader tokenized real-world asset market now sits at over $29 billion on public blockchains, up more than 10% in the last 30 days, and grinding higher since it has been available.

This institutional momentum is building against a technically uncertain backdrop for ETH — and institutional inflows across crypto are accelerating sector-wide. The price setup deserves a closer look.
Discover: The best pre-launch token sales
Ethereum Price Prediction:$3,000 Soon with Singapore’s GOLDX Catalyst?
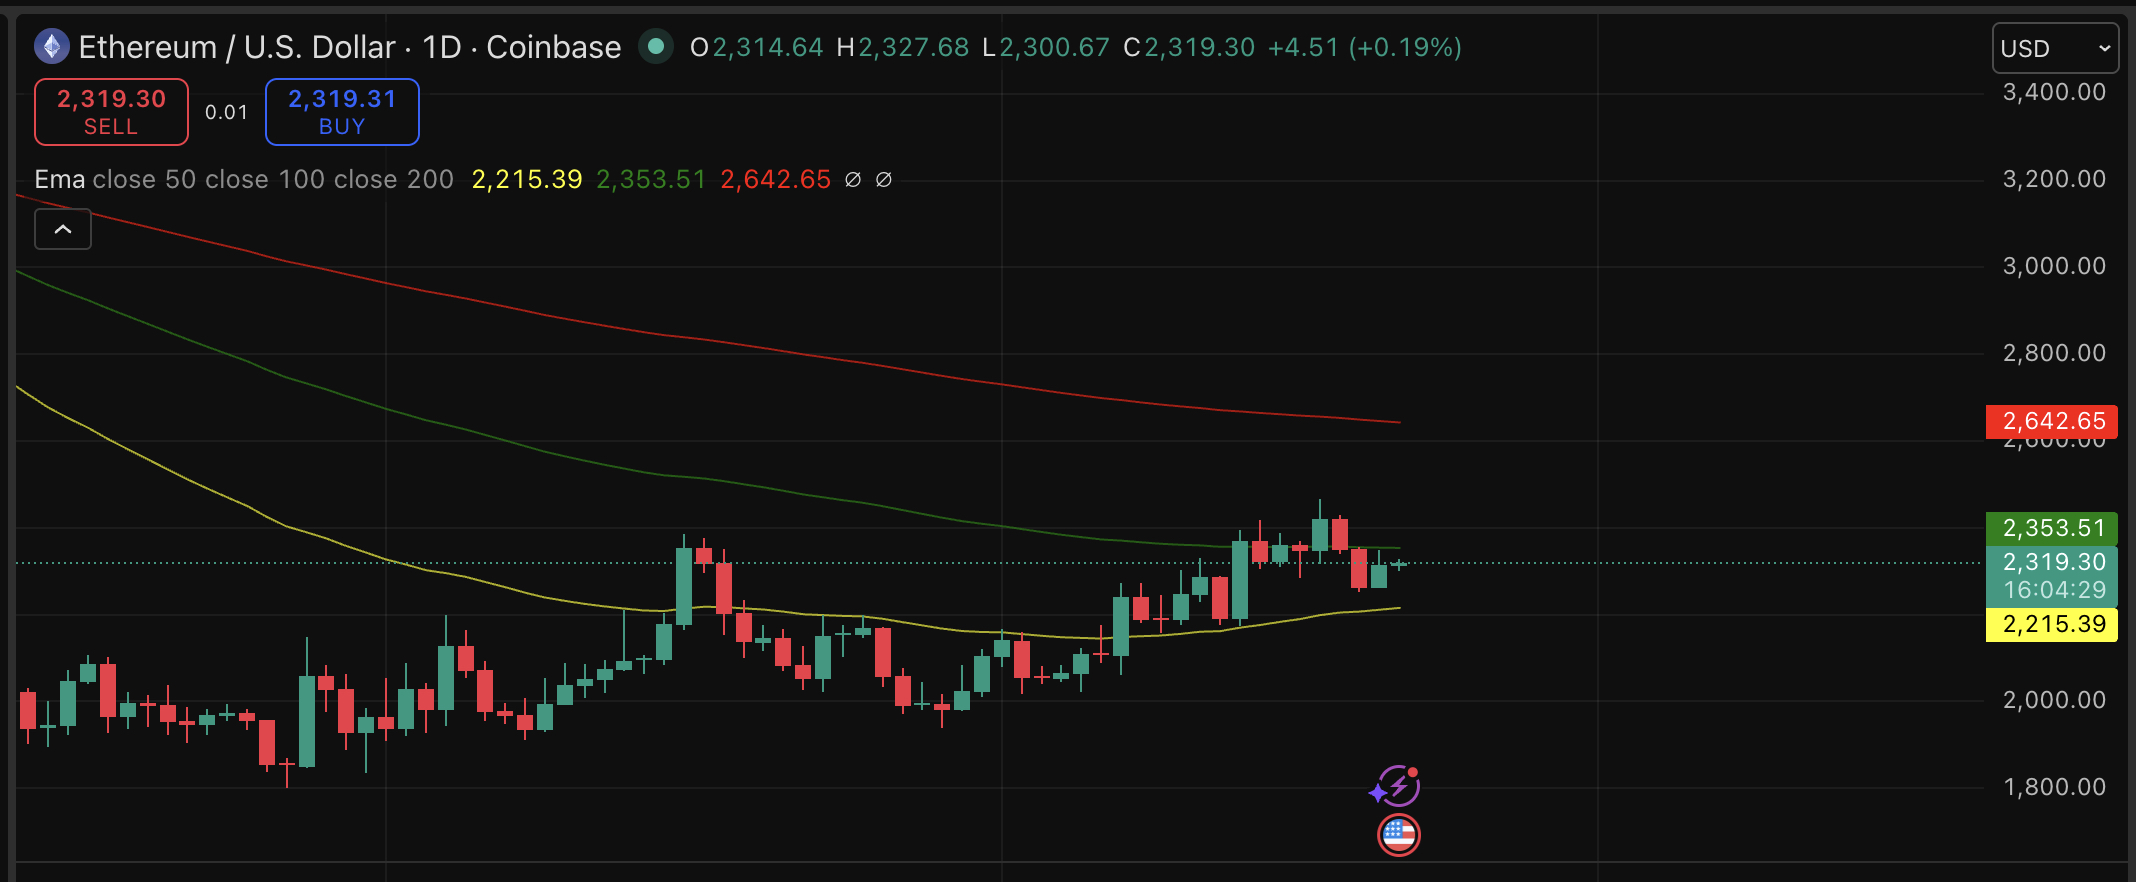
ETH has shed 2.11% over the past seven days, slipping from $2,450 to current levels, a psychological level that’s now flipped to resistance. The price is caught in a consolidation band that has been tightened.
The 200-day SMA rises to $2,642 sitting well above spot, confirming ETH remains in a recovery phase. Forecast models suggest a maximum 2026 upside of around $3,050, implying about 20% from current levels under normal conditions.
However, if OCBC’s GOLDX launch catalyzes fresh institutional demand on-chain, ETH might and could reclaim the $2,640 200-day SMA and test the resistance. Tom Lee’s TOKEN 2049 target of $22,000 remains a longer-duration thesis requiring BTC to hit $250,000 first.
The OCBC news is real and material, but ETH’s price history shows institutional announcements don’t always translate to immediate spot moves. For now, we wait.
Discover: The best crypto to diversify your portfolio with
LiquidChain Combines ETH, SOL, and Bitcoin
ETH’s 20% projected upside to $3,062 is real, but at a $280 billion market cap, the asymmetry is limited. That’s the structural reality of buying blue-chip crypto in consolidation. For traders willing to accept higher risk in exchange for earlier positioning, the calculus looks different at the infrastructure layer.
LiquidChain is an L3 infrastructure project with a proposition built directly around the OCBC moment: it fuses Bitcoin, Ethereum, and Solana liquidity into a single execution environment. The GOLDX launch, running on both ETH and Solana simultaneously, underscores the cross-chain complexity that LiquidChain’s Unified Liquidity Layer is designed to collapse.
A new layer emerges. Only a few see it first. — LiquidChain (@getliquidchain) March 24, 2026
The future is LiquidChain  ⟁https://t.co/vqvBcdSj94 pic.twitter.com/R7ZeZ0NPGl
Its Deploy-Once Architecture means developers access all three ecosystems without redeployment, with Single-Step Execution and Verifiable Settlement rounding out the stack.
The presale is currently priced at $0.01451, with $690,005.61 raised to date. As with any early-stage presale, capital is at risk and token liquidity is not guaranteed at launch.
Research LiquidChain before the current pricing tier closes.
The post Ethereum Price Prediction: Singapore Largest Bank Launches Gold on ETH appeared first on Cryptonews.


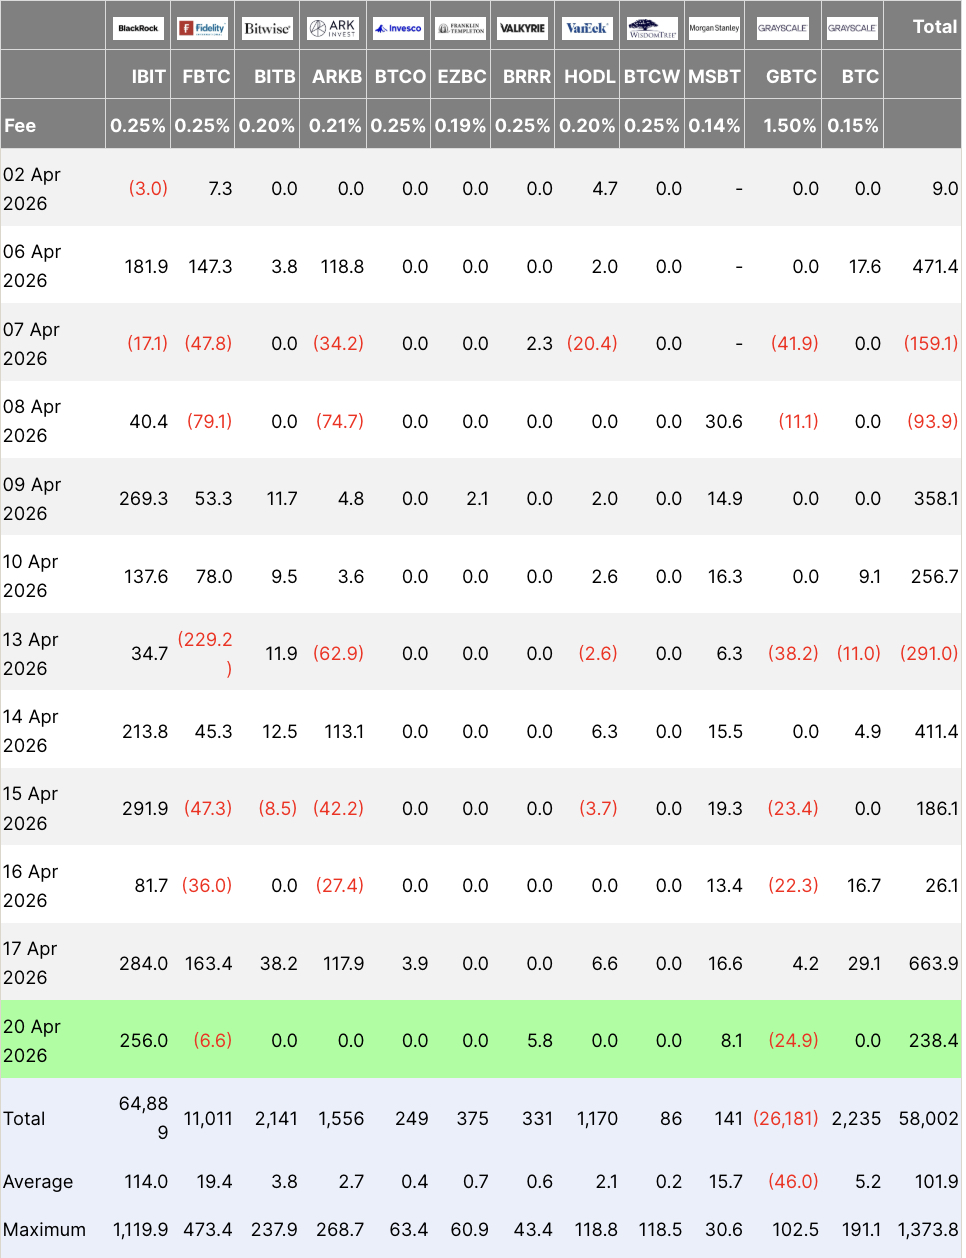
Strategy (MSTR), now holds more bitcoin than BlackRock’s iShares Bitcoin Trust (IBIT) for the first time since Q2 2024.
The world’s largest publicly traded BTC holder recently announced its third-largest bitcoin purchase on record, acquiring 34,164 BTC and bringing its total holdings to 815,061 BTC.
IBIT currently holds 802,824 BTC, leaving Strategy ahead by more than 12,000 BTC. While the gap is not anything meaningful in relative terms, it is symbolically important given IBIT’s rapid growth since launch. IBIT became the fastest ETF in history to reach $70 billion in assets, while IBIT ranks among BlackRock’s top revenue drivers.
Strategy held 189,150 BTC at the start of Q1 2024. IBIT surpassed it by early Q2 with roughly 273,000 BTC, compared with Strategy’s 214,400 BTC, a lead which it consistently maintained until now.
However, the two vehicles are fundamentally different. Strategy is an operating company that uses financial engineering, including at-the-market (ATM) equity issuance, convertible debt, and perpetual preferred securities, to accumulate bitcoin in a leveraged manner. IBIT, by contrast, is a spot ETF designed to passively track bitcoin’s price, offering investors straightforward exposure without leverage or corporate risk.
IBIT has gained around 55% since listing in January 2024, while Strategy has risen roughly 250%, driven by its leveraged structure.
Notably, Strategy accelerated accumulation during the recent market downturn, as bitcoin fell over 50% from its October all-time high, while adding nearly 80,000 BTC in 2026.
The perpetual preferred equity STRC has been a key differentiator for Strategy, providing a scalable source of capital that has funded a significant portion of its recent bitcoin accumulation.
Meanwhile, IBIT’s holdings remained relatively stable, with only a modest decline in assets under management.
BlackRock just placed its biggest weekly prediction bet on Bitcoin as it is trading at above the $74,000 price support. BlackRock’s spot bitcoin ETF, IBIT, absorbed $871 million in net inflows last week, leading every crypto ETF on the board.

U.S. spot bitcoin ETFs collectively booked $1.9 billion in net inflows across the same five-day stretch, the strongest weekly haul since early February. The marquee single-session was April 17, when total ETF flows hit $663.89 million, with IBIT alone pulling in $283.96 million and Fidelity’s FBTC adding another $163 million.
Iran tensions dragged BTC briefly to $63,000 2 months ago before Saturday’s bid briefly reclaimed $78,000, with institutional buyers treating every dip as an entry.
Discover: The best pre-launch token sales
Bitcoin Price Prediction: Larry Fink’s $500,000 Target This Year?
Bitcoin’s technical setup looks constructive after the consolidation. Price is holding above $74,000, up 10% in a month, with bullish consolidation building since the peak. Key resistance sits at the $78,000, and a confirmed close above that can open the door to the $80,000 breakout level.
The Liquidity Oscillator is showing positive Rate-of-Change signals, consistent with the global M2 money supply reversal that has historically correlated with BTC rallies.
For Bitcoin price itself, if ETF inflows sustain above $500M weekly, BTC could clear $78,000 and target $80,000, then maybe $83,000 on M2 tailwinds. Bitwise CIO Matt Hougan has upgraded his 2026 target to $200,000+, citing ETF flows, MicroStrategy accumulation, and Trump’s pro-crypto executive order unlocking Wall Street participation.
BlackRock CEO Larry Fink reiterated a $500,000–$700,000 long-term price target in a recent Bloomberg interview, citing sovereign wealth funds weighing 2%–5% BTC portfolio allocations as a hedge against currency debasement. It’s a structural demand that doesn’t reverse on a single FOMC meeting or a Strait of Hormuz headline.
Discover: The best crypto to diversify your portfolio with
Bitcoin Hyper to Follow Bitcoin Path with Bigger Upside
Spot BTC is undeniably bullish right now, but the asymmetric upside that early Bitcoin investors enjoyed simply isn’t available anymore. Traders hunting for early-cycle leverage within the Bitcoin ecosystem are rotating attention to infrastructure plays building on top of BTC itself.
Bitcoin Hyper ($HYPER) is positioning as the first-ever Bitcoin Layer 2 with Solana Virtual Machine (SVM) integration, delivering sub-second finality and low-cost smart contract execution while preserving Bitcoin’s base-layer security.
The pitch is direct: solve Bitcoin’s core limitations (slow transactions, high fees, no programmability) without abandoning its trust model. The presale has raised $32 million at a current price of $0.0136789, with 36% staking available for early participants.
Features include a Decentralized Canonical Bridge for BTC transfers and high-speed transaction execution that the team claims outperforms Solana itself on latency, and the presale has drawn attention alongside the broader Bitcoin ETF inflow narrative.
The post Bitcoin Price Prediction: Blackrock Big Bitcoin Bet appeared first on Cryptonews.
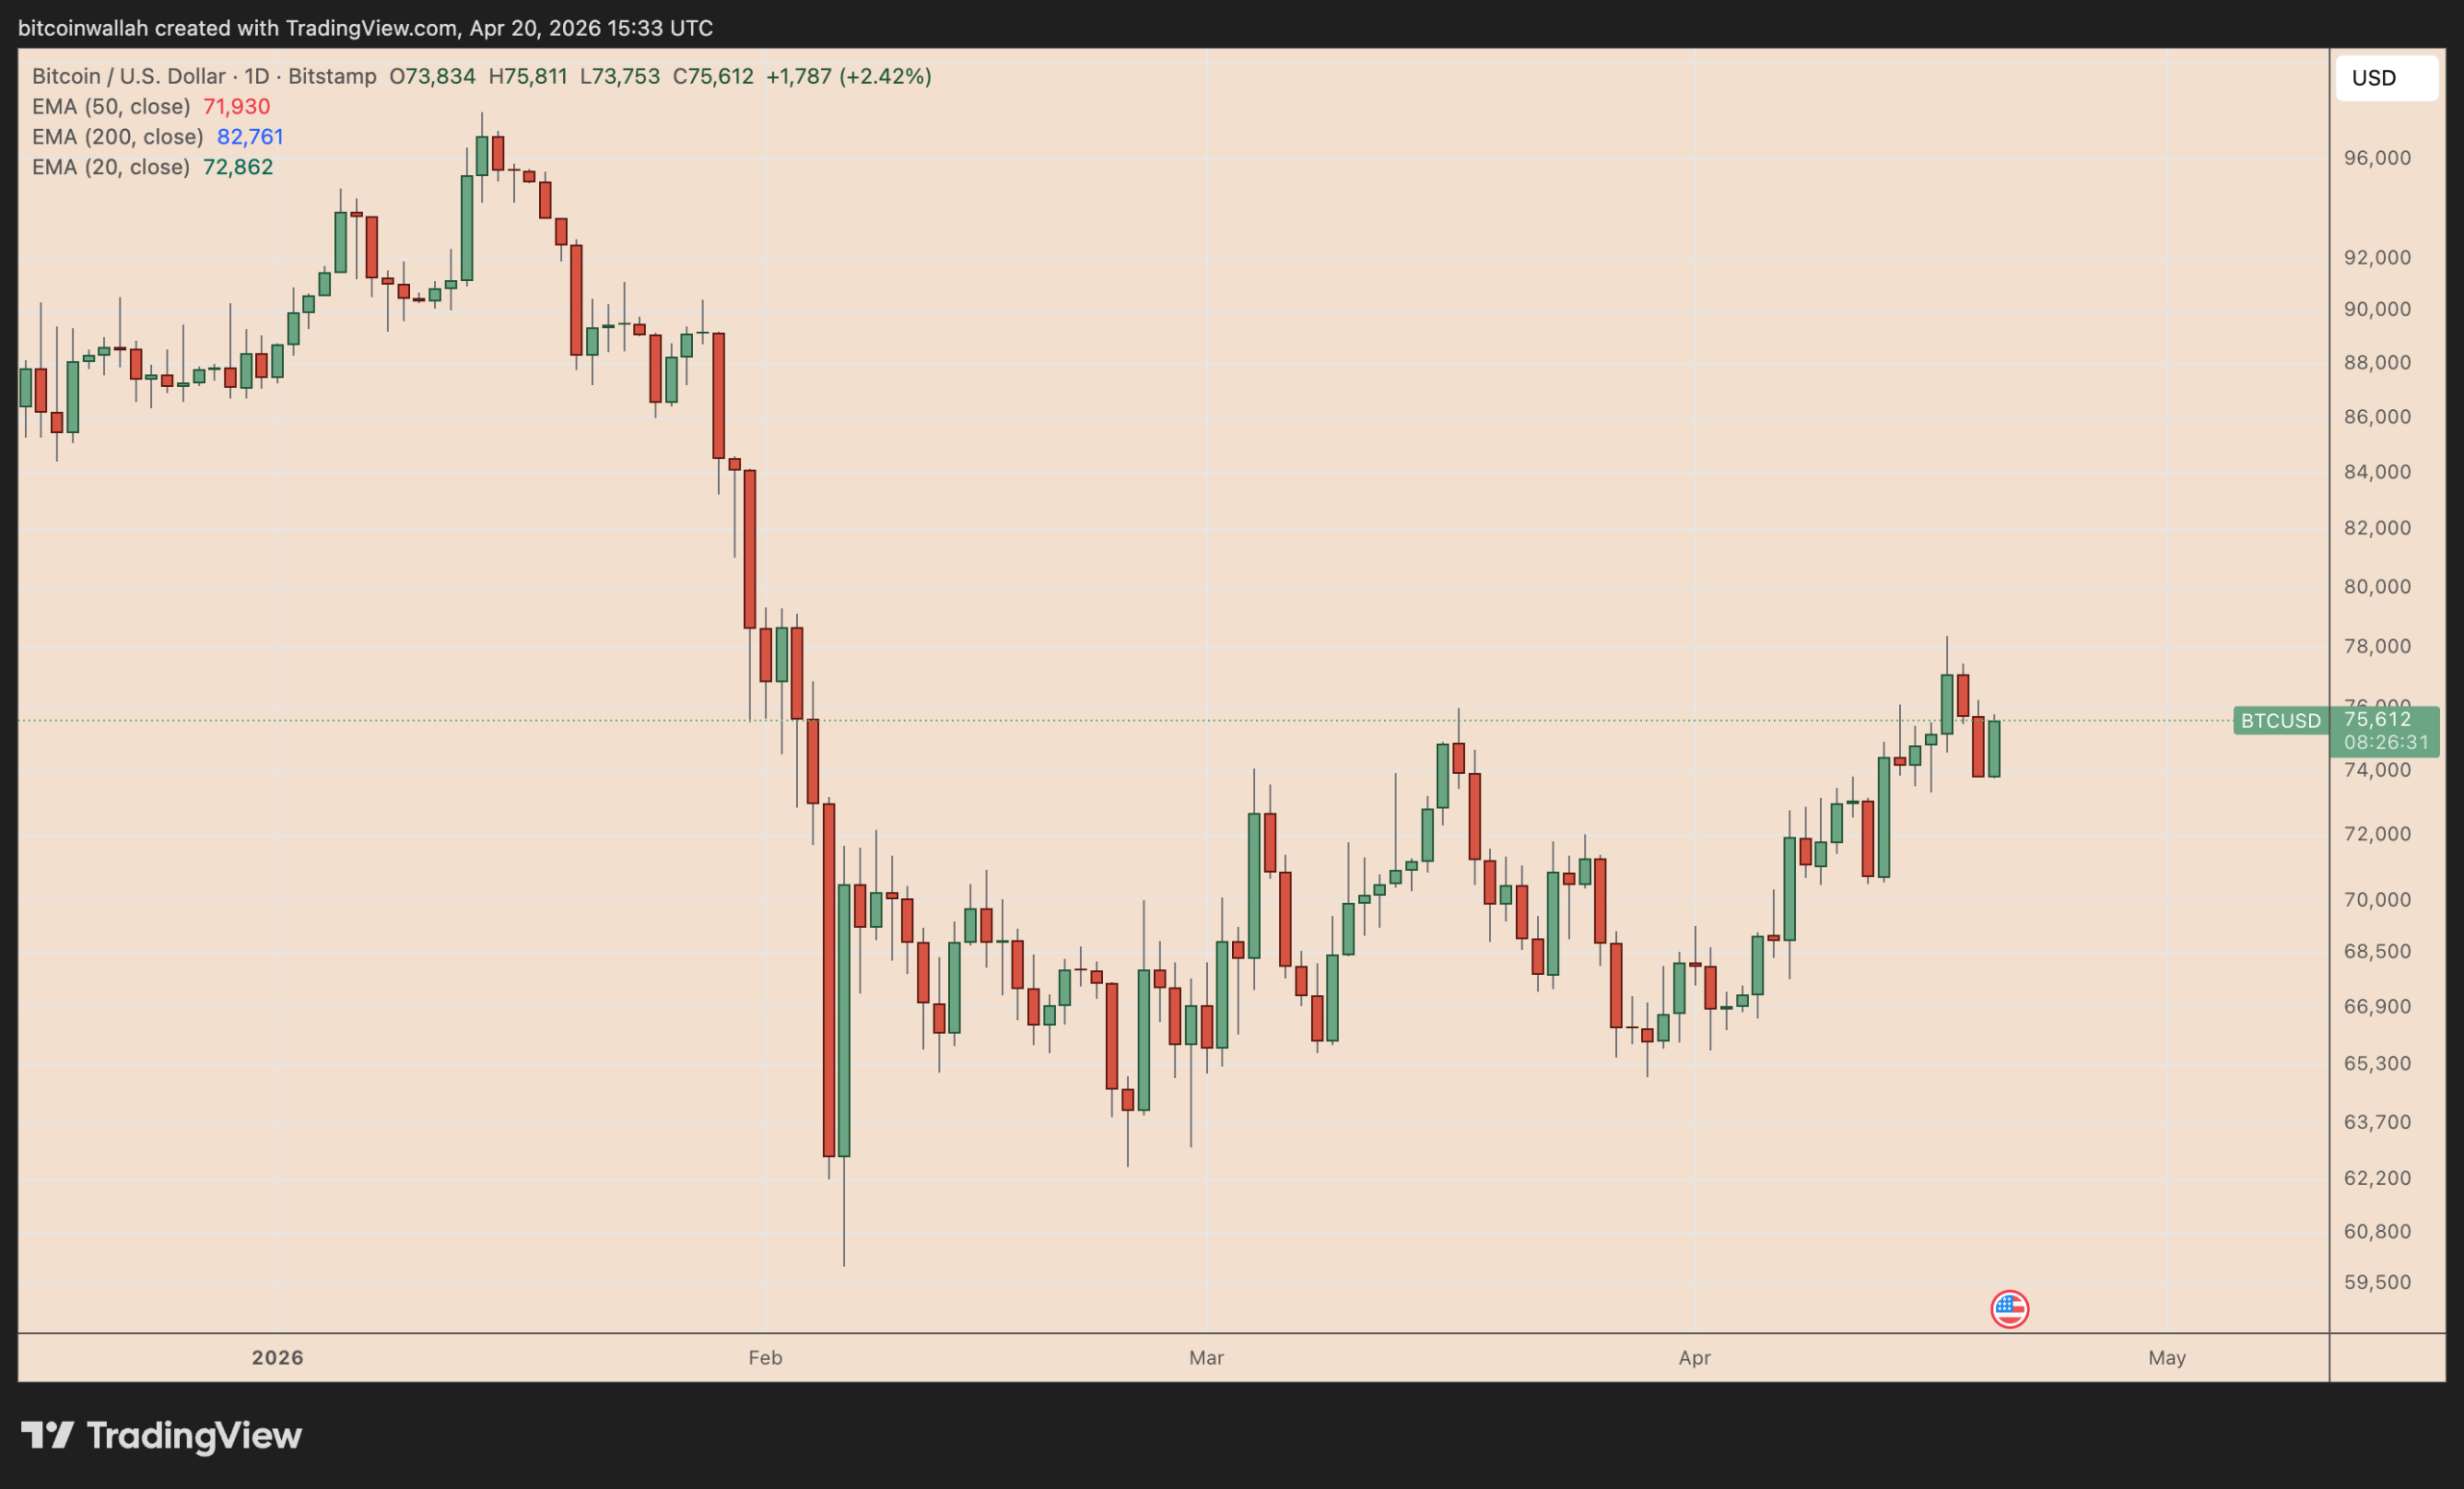
Bitcoin (BTC) rose 2.66% to around $75,800 on Monday after Strategy disclosed a $2.54 billion purchase, the company’s third biggest ever, and equivalent to about 2.5 months of new BTC supply.
However, several indicators suggest the rally may fizzle out.

Key takeaways:
-
Poor macro conditions can spark BTC price pullback if Strategy’s buying slows.
-
Bitcoin’s technical setup hints at a potential dip toward $67,000–$69,000.
Strategy may halt BTC purchases this week
Strategy funded most of its latest 34,164 BTC purchase through its preferred stock, Stretch (STRC), which generated over $2.17 billion through at-the-market share sales between April 13 and April 19.

That accounted for roughly 86% of the total amount spent, while sales of its Class A common stock, MSTR, added another $366 million.
STRC lets Strategy raise cash for Bitcoin when it trades at or above $100. Stronger prices mean easier fundraising and more BTC buying. In 2026, STRC enabled the purchases of 77,000 BTC, ten times more than all the ETFs combined, per River data.

But STRC has been trading below its $100 par value since April 15, which may limit Strategy’s ability to keep raising cash to purchase more Bitcoin this week.

In past episodes, pauses in Strategy’s Bitcoin purchases have coincided with BTC price slumps.
For instance, on average, BTC’s price has dipped by roughly 30% when STRC traded below its $100 par value.

A 30% dip will take Bitcoin’s price to $53,000 when measured from current levels.

The halt appears alongside weakening risk sentiment, with US stock indexes falling amid doubts over the US–Iran peace deal.

US President Donald Trump said it was “highly unlikely” he would extend the two-week truce if no agreement is reached before it expires on Wednesday.
Any signs of an extended Middle East conflict may weigh on BTC’s prices.
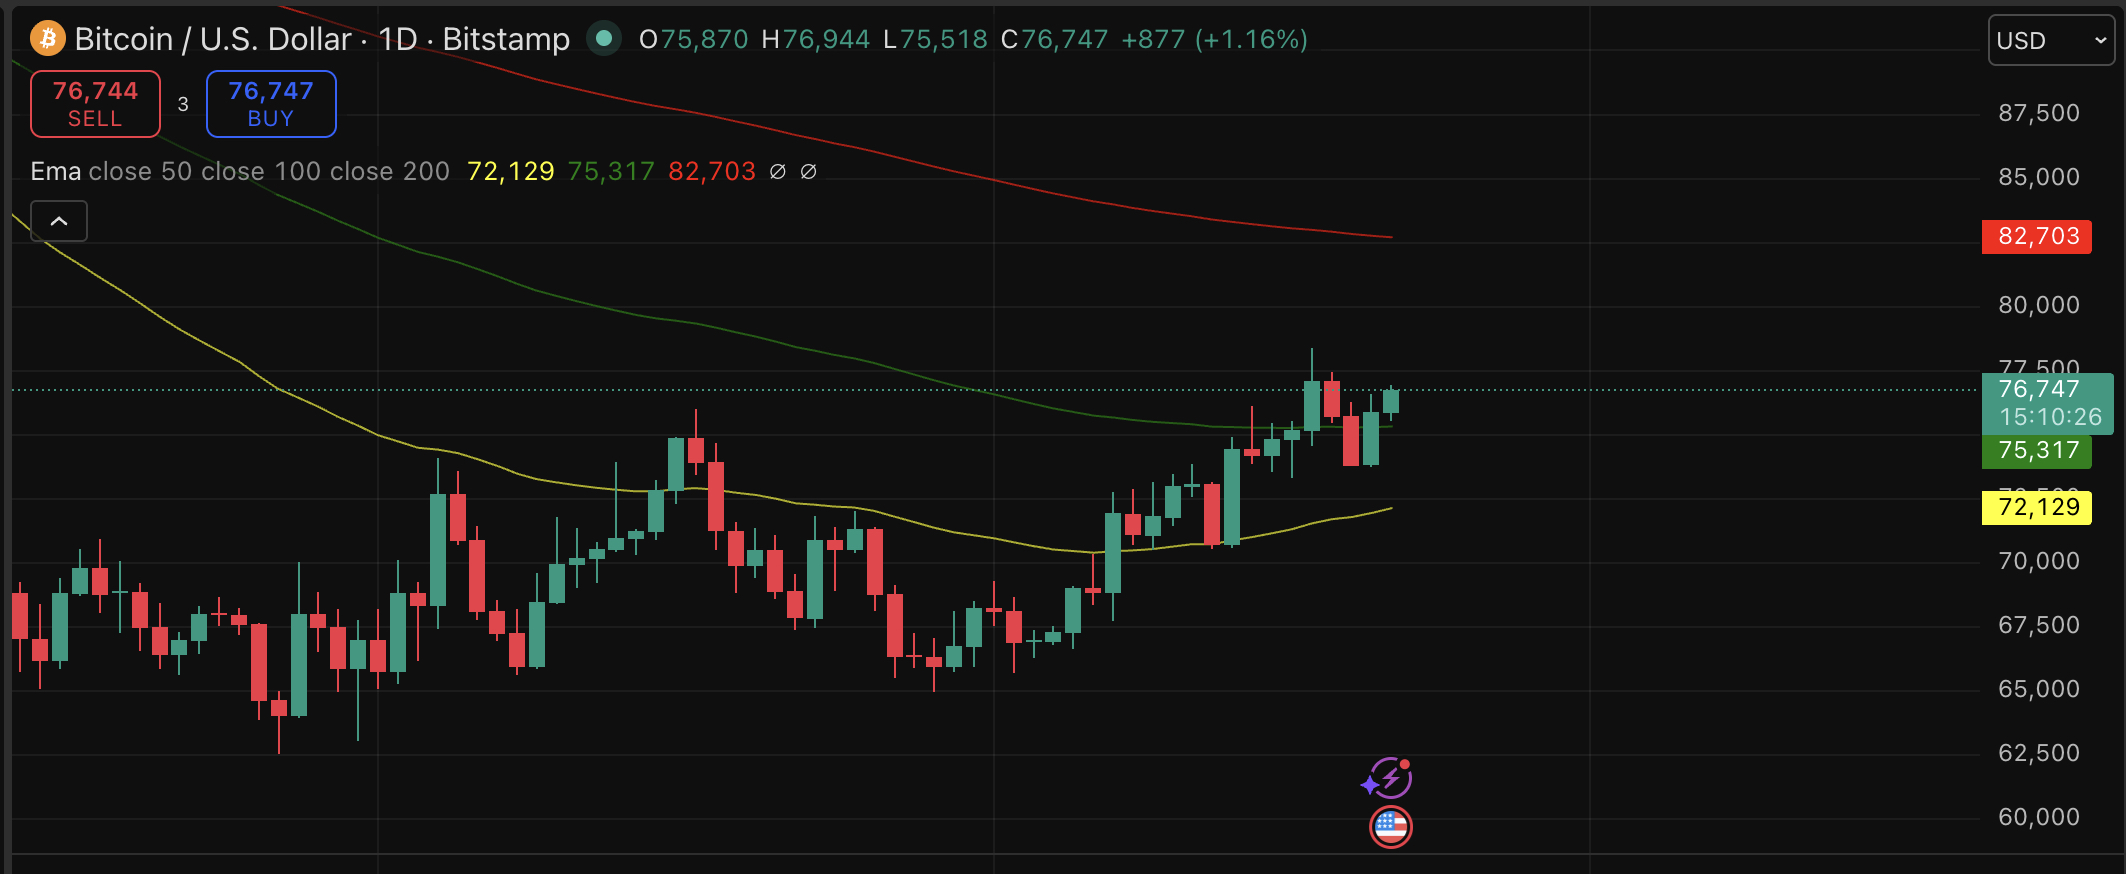
BTC flag pullback hints at $67,000–$69,000
Bitcoin’s current chart structure shows classic flag consolidation, with price now drifting toward the pattern’s lower boundary. This setup raises the risk of a pullback toward the $67,000–$69,000 region in April, if support gives way.

At the same time, downside may remain limited as the 20-day (green) and 50-day (red) EMAs continue to act as dynamic support levels. Holding above these averages would signal underlying demand, increasing the chances of a rebound.
Related: Adam Back says current demand is ‘almost’ enough to send Bitcoin to $1M
If that happens, BTC could attempt a breakout above the flag’s upper trend line, effectively invalidating the bearish setup.
Such a move would open the door for a recovery toward the 200-day EMA (blue), currently near $82,750.
As Cointelegraph reported, breaking the resistance near $78,000 is now a top priority for the bulls.
This article is produced in accordance with Cointelegraph’s Editorial Policy and is intended for informational purposes only. It does not constitute investment advice or recommendations. All investments and trades carry risk; readers are encouraged to conduct independent research before making any decisions. Cointelegraph makes no guarantees regarding the accuracy or completeness of the information presented, including forward-looking statements, and will not be liable for any loss or damage arising from reliance on this content.


HFI Research has stated that the oil market has passed its breaking point, which was projected around mid-April
The analysis argues that these inventory draws will occur regardless of any reopening of the Strait of Hormuz, driven by structural and logistical constraints. This comes amid notable uncertainty around the diplomatic efforts to resolve the US–Iran war.
Why a Peace Deal May Not Reverse the Oil Market Shock
HFI explained that even with a US-Iran peace deal, oil market recovery would be delayed by logistical bottlenecks. An estimated 160 million barrels of floating storage in tankers would begin discharging. However, transit and offloading alone would take 30–40 days, with tanker turnaround requiring an additional 20 days.
Meanwhile, around 70 very large crude carriers (VLCCs) en route to load US crude for Asia face a much longer cycle. It would take 6–8 weeks for loading, 45–50 days for transit, and another 20–25 days to offload and return.
“In total, we will not see meaningful tanker traffic back in the Strait of Hormuz from this entourage for at least 3 months,” the blog read.
Follow us on X to get the latest news as it happens
Onshore constraints in the Middle East further complicate the recovery. The region holds 600 million barrels in onshore storage. Producers need roughly 200 million barrels drained before they can restart output.
That would take at least 100 VLCC. However, current tanker activity suggests this rebalancing may not occur until mid-to-late June at the earliest.
“Once the onshore crude storage drains, we need a steady flow of tankers coming to through the Strait of Hormuz to pick up crude. By this point, producers like Saudi, UAE, Kuwait, Qatar, Iraq, and Bahrain can restart. This process will take a few more weeks all but guaranteeing that the lack of supply continues,” HFI Research added.
The report highlighted that cumulative storage lost due to the closure already totals roughly 1 billion barrels, rising to 1.98 billion by the end of June.
According to HFI, given the limited commercially available crude to offset such losses, the market may require demand destruction to restore equilibrium. If the Strait remains closed beyond April, oil prices could move into uncharted territory, with traditional pricing mechanisms breaking down.
Subscribe to our YouTube channel to watch leaders and journalists provide expert insights
The post A US-Iran Peace Deal May Not Be Enough To Save the Oil Market Now: Here’s Why appeared first on BeInCrypto.

The hackers that stole $290 million in the KelpDAO exploit are beginning to launder their ill-gotten gains, according to onchain sleuth ZachXBT and data from Arkham.
Arkham shows that the wallet in control of the proceeds of the exploit sent two transfers of $117 million and $58 million on the Ethereum blockchain during European hours on Tuesday.
ZachXBT reported that a portion of the stolen funds has already begun moving across chains. Roughly $1.5 million was bridged from Ethereum to Bitcoin via Thorchain, alongside an additional $78,000 routed through the privacy protocol Umbra. North Korean hackers Lazarus Group have previously used protocols like Thorchain to launder funds.
Cross-chain routing and privacy tools are commonly used in the early ‘layering’ stage of laundering, suggesting the attacker may be preparing to further disperse the funds across multiple venues.
The KelpDAO exploit is one of the largest decentralized finance breaches in recent months, spurring a wave of negative sentiment across the DeFi sector and fears over contagion will spread to other blockchains.
Layer 2 network Arbitrum said Monday it had frozen $71 million in ether linked to the hack, a move that could pressure the exploiter to accelerate efforts to move and launder the remaining funds.
The newly appointed Governor of the Bank of Korea, Shin Hyun-song, has voiced support for central bank digital currencies (CBDCs) and tokenized deposits in his first public address.
Shin, who began his four-year term after an inauguration ceremony in Seoul on Tuesday, said the central bank will advance the second phase of “Project Hangang,” a Bank of Korea-led pilot project to test a blockchain-based, wholesale CBDC system.
He also pointed to international cooperation efforts, including the “Agora Project,” an international collaborative initiative launched in April 2024 by the Bank for International Settlements (BIS) and seven central banks to explore the tokenization of cross-border payments. Shin said these initiatives “will elevate the status of the Korean won in the digital payment environment.”
While previous reports had suggested Shin was open to won-based stablecoins, he did not mention stablecoins in his inaugural speech.
South Korea’s stablecoin bill remains stalled, with regulators and lawmakers split over whether issuance of won-pegged tokens should be limited to commercial banks or opened up to non-bank players such as fintech and tech firms.
Related: South Korea draft bill puts stablecoins, RWAs under finance laws: Report
Shin flags geopolitical risks
Shin also mentioned rising tensions in the Middle East and its effect on oil prices, saying that the Bank of Korea must adapt to rising uncertainty driven by geopolitical shocks, inflation pressures and shifts in the global economy.
“We must strive for price and financial stability through the operation of prudent and flexible monetary policy,” he said.

Shin was the BIS economic adviser from May 2014 to March 2026 and also served as head of the Monetary and Economic Department from January 2025, according to the BIS website.
Last month, he published an academic paper arguing that stablecoins fail to meet a core property of money, “unity,” because blockchain networks are inherently fragmented across different chains with varying fees, security and decentralisation levels.
Related: Naver-Dunamu filing sets IPO committee, listing timeline for fintech group
South Korea to test tokenized deposits for government spending
South Korea’s Ministry of Economy and Finance is preparing to test blockchain-based payments for selected government expenses as part of a regulatory sandbox exploring distributed ledger technology in public finance.
The pilot will use tokenized deposits to execute government operational spending, with a full rollout targeted for the fourth quarter of 2026. The initial phase will be launched in Sejong City and will include conditions such as limits on timing and spending categories.


A group of 12 European banks led by Qivalis has chosen Fireblocks to provide infrastructure for a MiCA-compliant euro stablecoin.
Summary
- Qivalis and 12 European banks are building a MiCA-compliant euro stablecoin with Fireblocks infrastructure support.
- The euro token will target institutional settlement, treasury, and tokenized asset use across Europe.
- European banks are pushing local stablecoins as dollar-backed tokens continue dominating the global market.
The project is targeting a launch in the second half of 2026, pending approval from De Nederlandsche Bank under the European Union’s Markets in Crypto-Assets Regulation framework.
Qivalis said the token will be fully regulated and backed 1:1 with euros. The company plans to structure the product as an electronic money institution under Dutch supervision. The group includes bank-backed support from firms such as BBVA, BNP Paribas, ING, and UniCredit.
Fireblocks will supply the tokenization system, wallet infrastructure, and lifecycle management tools for the project. The platform will also support compliance functions such as identity verification and sanctions screening, which are central to regulated digital asset products in Europe.
A Fireblocks spokesperson said the project is being built as a ”regulated euro-native settlement instrument” for European institutions. The spokesperson added that the platform is designed to support issuance, custody, treasury management, and payment orchestration across several banking use cases.
Moreover, the planned stablecoin is intended for institutional uses such as settlement, treasury operations, and tokenized assets. The banks involved are aiming to provide a euro-denominated digital payment tool that can work across multiple business lines without relying on dollar-based stablecoins.
The move comes as European banks and companies step up efforts to build local digital payment infrastructure. The project also reflects a wider push to reduce dependence on dollar-denominated stablecoins, which still dominate global digital asset settlement and payments activity.
Europe responds to dollar stablecoin dominance
DeFiLlama data shows the global stablecoin market stands near $320 billion, with about 99% of supply tied to the US dollar. Euro-denominated stablecoins remain a small part of the market, which has pushed European institutions to back local alternatives under clear regulatory frameworks.
The project also comes as policymakers and regulators in Europe continue to raise concerns about the role of foreign-currency stablecoins in the region. The Bank for International Settlements recently repeated warnings that some dollar stablecoins may operate more like investment vehicles than money because of their short-term securities exposure.
Earlier this month, Bank of France first deputy governor Denis Beau called on the European Union to limit the use of non-euro stablecoins in everyday payments. Against that backdrop, the Qivalis-led initiative adds another effort to build a regulated euro stablecoin market with direct banking support and MiCA-compliant infrastructure.
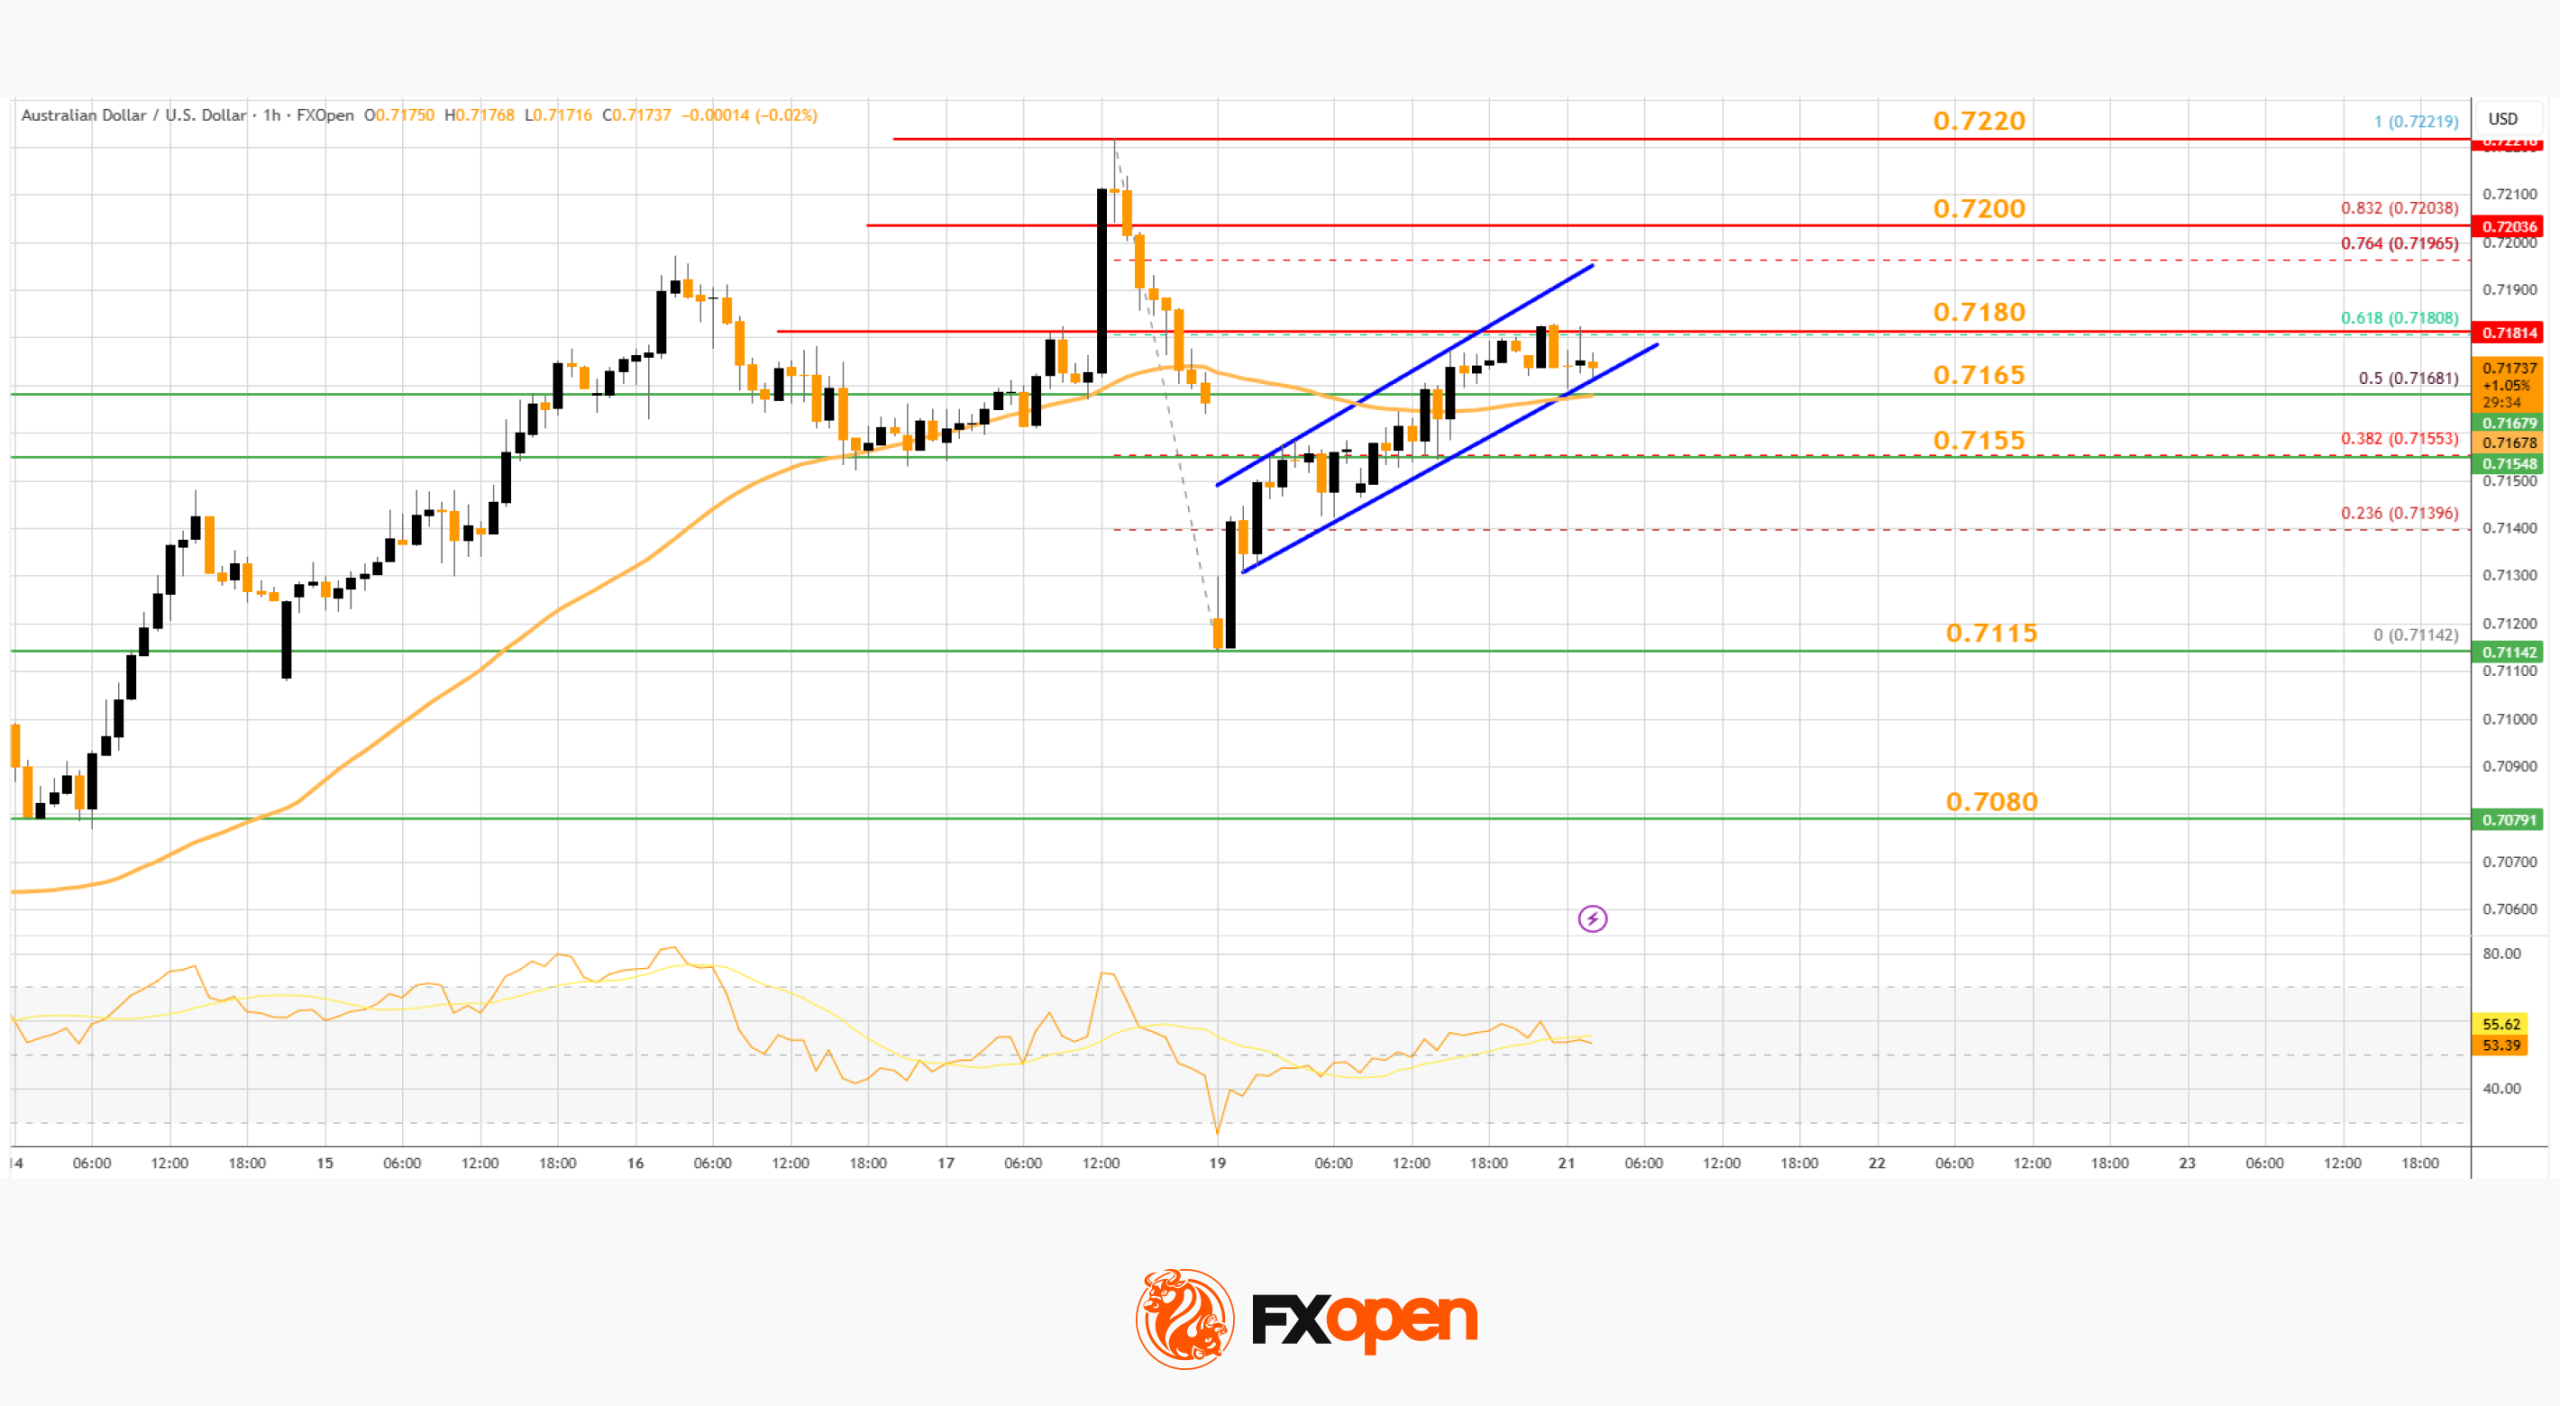
AUD/USD is attempting a fresh increase from 0.7115. NZD/USD is consolidating and could aim for a move above 0.5930 in the short term.
Important Takeaways for AUD/USD and NZD/USD Analysis Today
• The Aussie Dollar remained supported above 0.7100 and recovered losses against the US Dollar.
• There is a rising channel forming with resistance at 0.7200 on the hourly chart of AUD/USD at FXOpen.
• NZD/USD is consolidating gains above 0.5900 and 0.5890.
• There is a bullish trend line forming with support at 0.5890 on the hourly chart of NZD/USD at FXOpen.
AUD/USD Technical Analysis

On the hourly chart of AUD/USD at FXOpen, the pair formed a base above 0.7100. The Aussie Dollar started a decent increase above 0.7150 against the US Dollar to enter a short-term positive zone.
The bulls even pushed the pair above the 50% Fib retracement level of the downward move from the 0.7221 swing high to the 0.7114 low and the 50-hour simple moving average. The AUD/USD chart indicates that the pair could struggle to clear the 61.8% Fib retracement at 0.7180.
The first major hurdle for the bulls could be 0.7200. There is also a rising channel forming with resistance at 0.7200. An upside break above 0.7200 might send the pair further higher. The next major target might be 0.7220.
Any more gains could clear the path for a move toward 0.7300. If there is no close above 0.7200, the pair might start a fresh decline. Immediate bid zone could be near 0.7165 and the 50-hour simple moving average.
The next area of interest is 0.7155. If there is a downside break below 0.7155, the pair could extend its decline toward 0.7115. Any more losses might signal a move toward 0.7080.
NZD/USD Technical Analysis
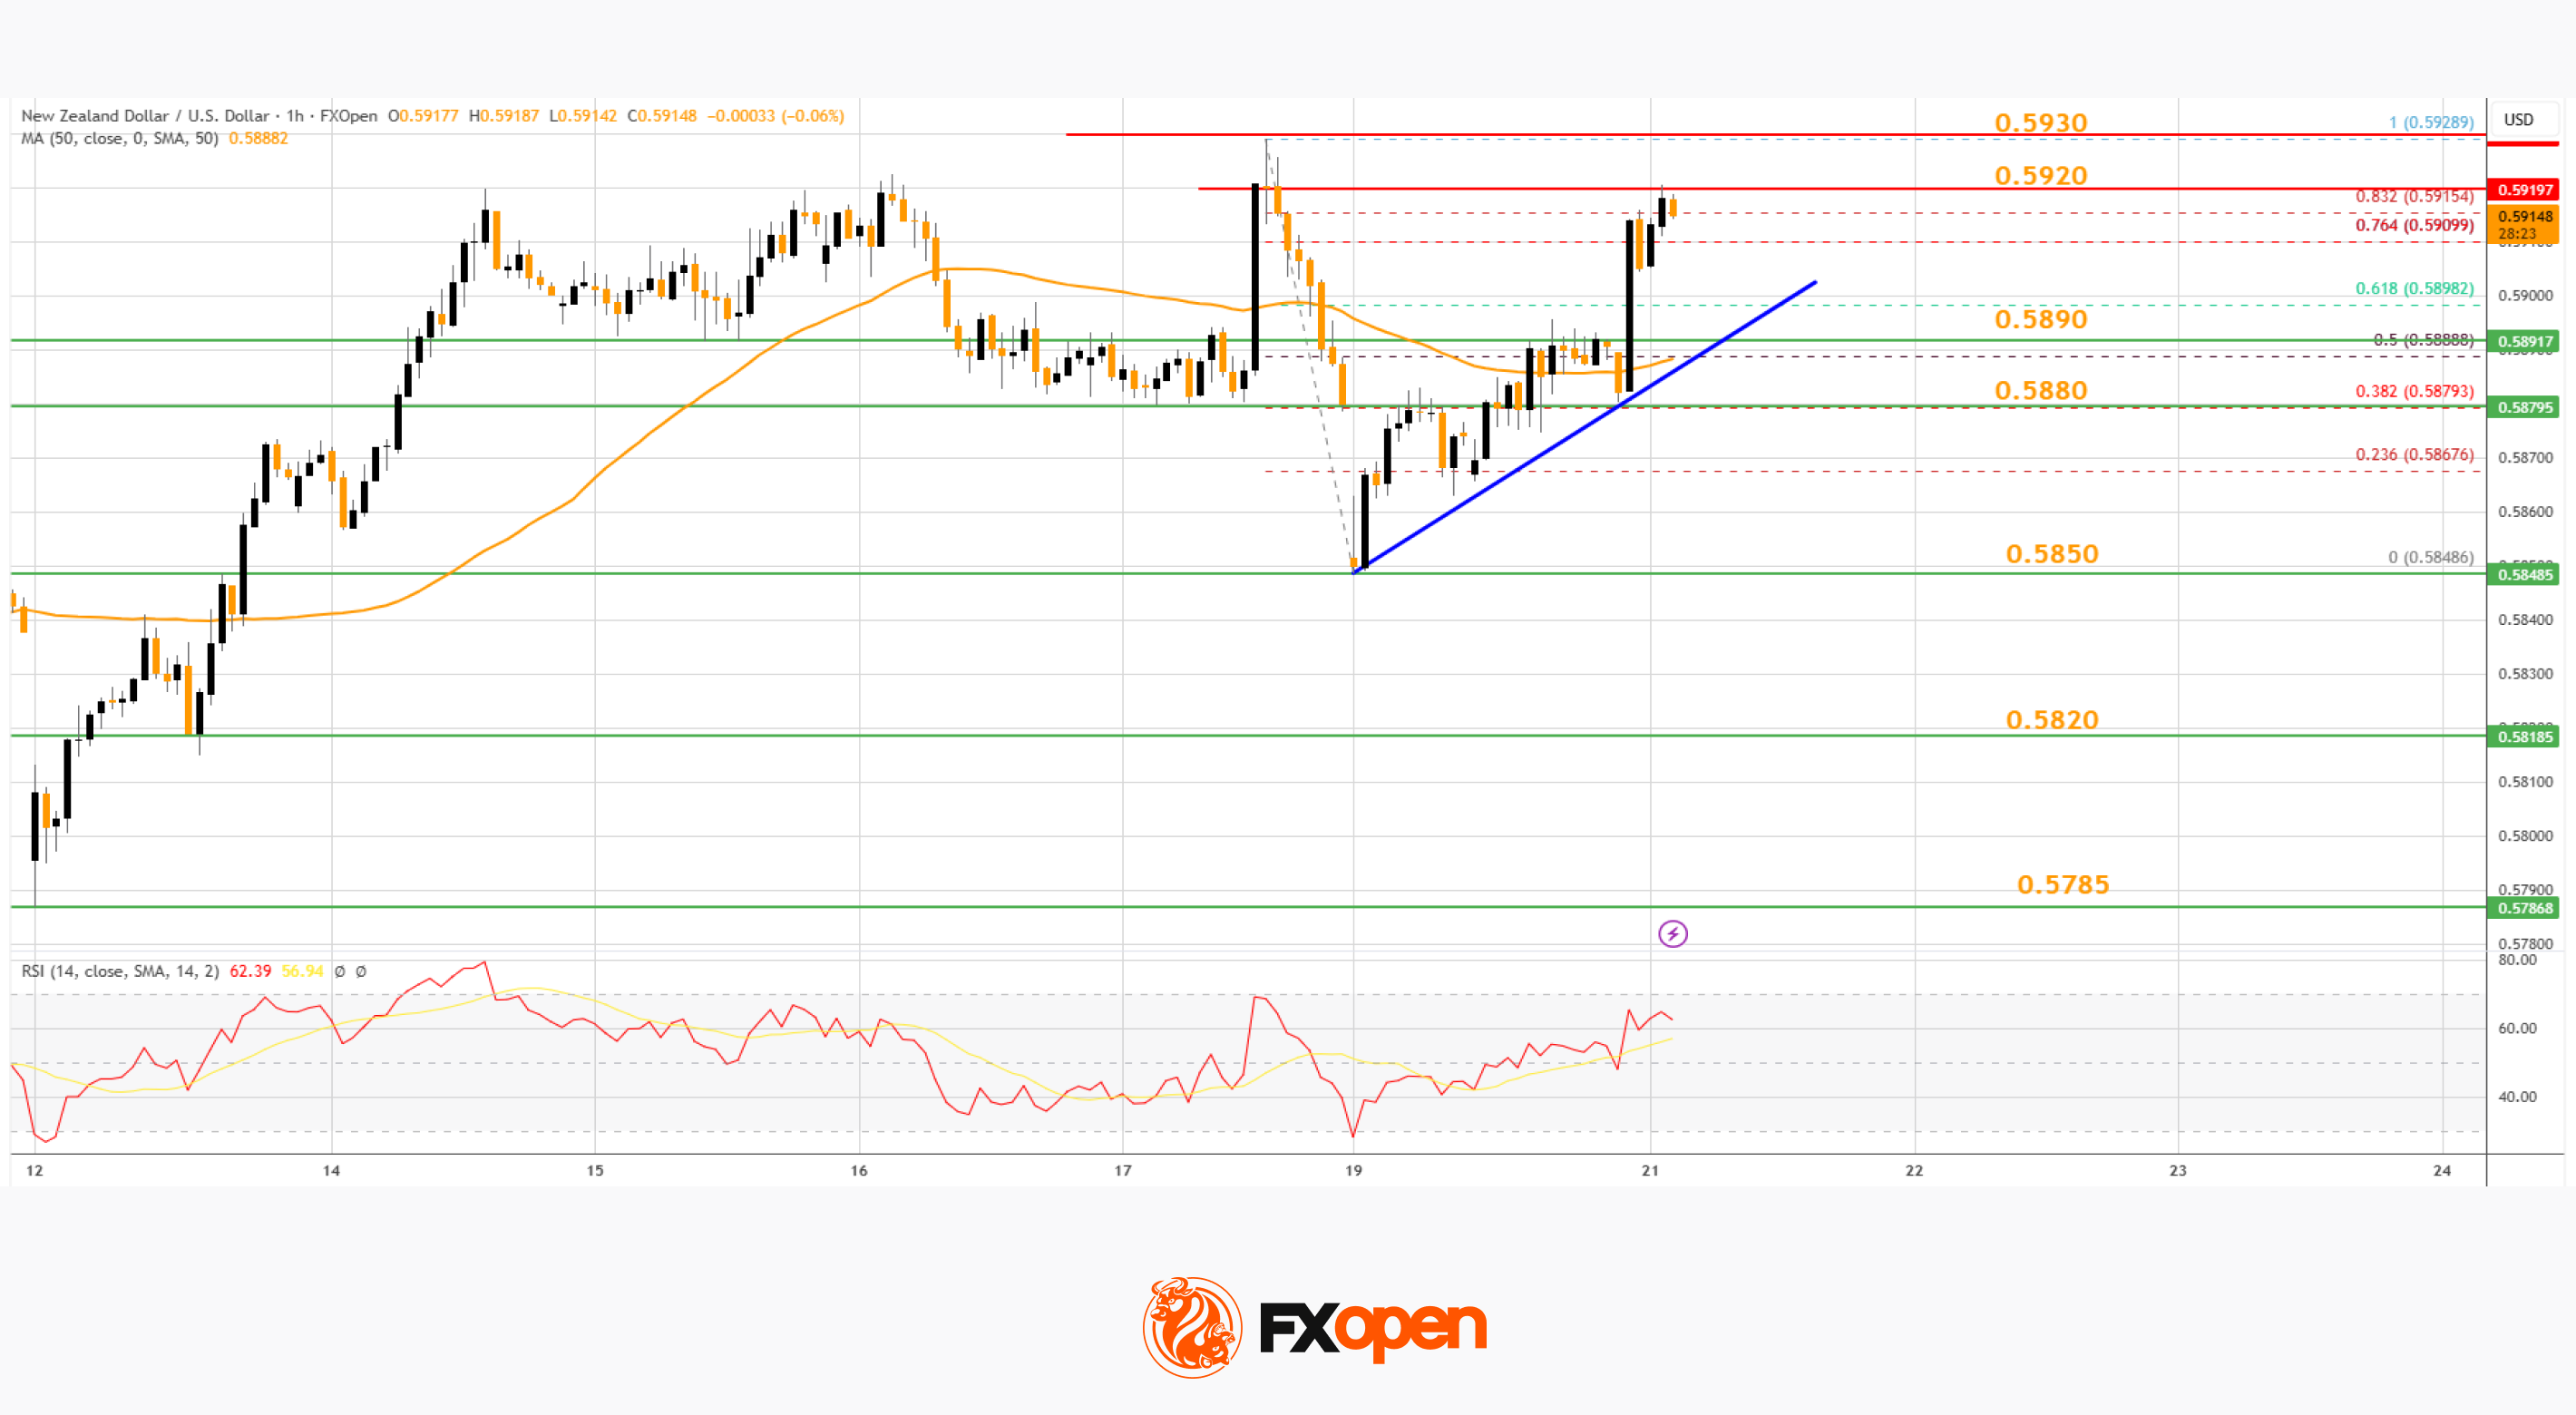
On the hourly chart of NZD/USD on FXOpen, the pair also followed AUD/USD. The New Zealand Dollar failed to stay above 0.5920 and corrected gains against the US Dollar.
The pair dipped below 0.5900 and the 50-hour simple moving average. A low was formed at 0.5848, and the pair is now attempting to recover losses. There was a move above the 50% Fib retracement level of the downward move from the 0.5928 swing high to the 0.5848 low.
Besides, there is a bullish trend line forming with support at 0.5890. The NZD/USD chart suggests that the RSI is above 50, signaling a short-term positive bias. On the upside, the pair is facing resistance near 0.5920.
The next major hurdle for buyers could be near 0.5930. A clear move above 0.5930 might even push the pair toward 0.5950. Any more gains might clear the path for a move toward the 0.6000 pivot zone in the coming sessions.
On the downside, there is support forming near 0.5890 and the 50-hour simple moving average. If there is a downside break below 0.5890, the pair might slide toward 0.5850. Any more losses could lead NZD/USD into a bearish zone to 0.5820.
Trade over 50 forex markets 24 hours a day with FXOpen. Take advantage of low commissions, deep liquidity, and spreads from 0.0 pips (additional fees may apply). Open your FXOpen account now or learn more about trading forex with FXOpen.
This article represents the opinion of the Companies operating under the FXOpen brand only. It is not to be construed as an offer, solicitation, or recommendation with respect to products and services provided by the Companies operating under the FXOpen brand, nor is it to be considered financial advice.


Bitcoin price reclaimed the $76,000 mark on Tuesday as investors await confirmation of a potential peace deal between the U.S. and Iran.
Summary
- Bitcoin reclaimed $76K after dipping below $74K, rising 2% to an intraday high of $76,483 as investors bought the recent pullback.
- Price action remained tied to U.S.-Iran tensions, with markets awaiting clarity on a potential peace deal ahead of a Wednesday deadline.
- Analysts warn BTC could target $80K on a deal, while prolonged conflict risks a drop below the $75K psychological support level.
According to data from crypto.news, Bitcoin (BTC) price rose 2% to an intraday high of $76,483 on Tuesday before stabilizing around $76,150 at press time.
Bitcoin edged higher today as investors bought the dip in its price below $74,000 on Monday after reports emerged that Iran may not be attending the emergency peace summit with the U.S. in Islamabad, as the U.S. continues to place its naval blockade on Iranian traffic moving through the Strait of Hormuz.
On Monday, tensions between the two nations escalated after the U.S. intercepted and seized an Iranian ship carrying military supplies, following which Iran retaliated with its own targeted missile strikes against regional naval assets.
As such, diplomatic efforts to end the US-Israel war on Iran remain uncertain, with Tehran saying it will not negotiate on a deal with the U.S. under its terms or under a constant military threat.
While U.S. President Donald Trump has called for a final negotiation deadline by Tuesday, he extended the timeline to Wednesday evening Washington time for further diplomatic deliberations.
Despite his repeated claims that Iran is ready to sign on a deal, sources from within Tehran have suggested otherwise, with officials stating they will agree only if a deal is made under specific conditions set by Iran.
Earlier, Iran had asked for several concessions, including billions in reparations for wartime damages to the nation’s infrastructure and the right to continue its uranium enrichment for peaceful energy purposes. However, the U.S. has firmly opposed Iran possessing any form of nuclear power, with Trump noting that such capabilities are a non-negotiable red line.
Trump has indicated that there may not be a further extension of the deadline after tomorrow if Iran fails to cooperate fully with the proposed terms.
The ongoing conflict has left the Strait of Hormuz blocked for over ten days, effectively cutting short global energy supplies, with economists warning that a continued stalemate could lead to a global recession.
Despite no concrete signs of whether Iran would go with the U.S. proposal, Bitcoin price has benefited from dropping crude oil prices today. Notably, WTI crude oil fell back to $86 while Brent crude prices retracted to under $95. Meanwhile, the bellwether cryptocurrency has also benefited from a potential investor capital rotation from gold, which has fallen significantly today.
For many traders, the outlook for Bitcoin price is largely tied to how successfully the deal will play out tomorrow. If a potential deal is reached, Bitcoin bulls could target a rally toward $80,000 in the coming days.
On the contrary, if Iran continues to resist diplomatic terms, BTC could drop below the $75,000 major psychological support. This could further erode investor confidence and trigger a potential mass liquidation event across the broader crypto market.
Disclosure: This article does not represent investment advice. The content and materials featured on this page are for educational purposes only.
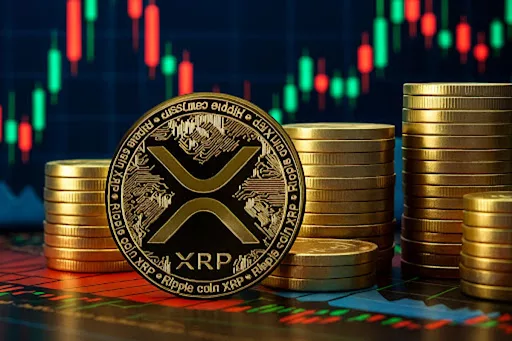

Ripple’s native token has returned to focus after crypto analyst Ali Martinez, known as Ali Charts on X, said whales accumulated 360 million XRP over the past week.
Summary
- XRP whales accumulated 360 million tokens in one week as price held near resistance levels.
- Ali Charts flagged a bullish setup, with $1.55 now the key breakout level.
- wXRP on Solana and WhatsApp trading added fresh attention to XRP’s recent momentum story.
The large buying activity came as XRP traded at $1.44, with a 24-hour trading volume of $2.67 billion. The token was up 1.59% over 24 hours and 4.98% over seven days (according to CoinGecko data).
The whale accumulation has added to market attention around XRP’s next move. Traders are now watching whether strong buying from larger holders can help support another push higher after recent gains slowed near resistance.
Technical signals point to a possible breakout
As we previously reported, Ali Charts said ”$XRP consolidates in a symmetrical triangle, pointing to a potential 35% move.” That pattern has kept XRP in a tight range as traders wait for a breakout in either direction. The comment has added to speculation over whether XRP could be preparing for a larger price swing.
The analyst also said on April 18 that ”$XRP: SuperTrend flips bullish!” He added that the daily chart showed its first bullish flip since Jan. 17. According to the post, the key level remains $1.55.
Meanwhile, open interest in XRP futures climbed to $2.61 billion, with gains reported across CME and Binance. At the same time, short liquidations rose between April 15 and April 16 after XRP moved above $1.40. That activity showed rising trader interest as price pushed into a higher range.
Support is now seen around $1.37 to $1.38. If XRP holds that zone, traders may look for another test of $1.50. If buyers clear that resistance, $1.65 could become the next level in view.
Broader developments add to market activity
Part of XRP’s recent move has also been linked to Ripple’s work with Kyobo Life Insurance on tokenized government bonds in South Korea. That development added a fresh use case narrative as interest around tokenization continued to grow.
The launch of wrapped XRP on Solana also brought new attention to the asset. Through Hex Trust and LayerZero, users can now access wXRP in new trading flows, including an AI-powered interface on WhatsApp that lets users buy and trade through text commands.
Together with the rise in the Crypto Fear and Greed Index to 62, these factors have added more momentum to the current XRP discussion, though price still needs to break key resistance before a stronger rally can be confirmed.
Disclosure: This article does not represent investment advice. The content and materials featured on this page are for educational purposes only.

Gas exports tax chatter 'superficial', says Premier

Strategy (MSTR) overtakes BlackRock’s IBIT after aggressive bear market BTC buying
“Wednesday” heads to Paris in first look at season 3
Manchester United reach agreement with Casemiro over contract clause amid transfer speculation

Steven Gerrard disagrees with Gary Neville over ‘shock’ Chelsea and Arsenal claim | Football

US brings back mandatory military draft registration


-

 News Videos6 days ago
Secure crypto trading starts with an FIU-registered
-

 Fashion4 days ago
Weekend Open Thread: Theodora Dress
-

 Sports4 days ago
NWFL Suspends Two Players Over Post-Match Clash in Ado-Ekiti
-

 Politics4 days ago
Palestine barred from entering Canada for FIFA Congress
-

 Business2 days ago
Powerball Result April 18, 2026: No Jackpot Winner in Powerball Draw: $75 Million Rolls Over
-

 Crypto World3 days ago
Russia Pushes Bill to Criminalize Unregistered Crypto Services
-

 Politics13 hours ago
Gary Stevenson delivers timely reminder to register to vote as deadline TODAY
-
 Business5 days ago
Creo Medical agree sale of its manufacturing operation
-

 Politics2 days ago
Zack Polanski demands ‘council homes not luxury flats for foreign investors’
-

 Tech2 days ago
Auto Enthusiast Scores Running Tesla Model 3 for Two Grand and Turns It Into Bare-Bones Go-Kart
-

 Tech5 days ago
‘Avatar: Aang, The Last Airbender’ Leaked Online. Some Fans Say Paramount Deserves the Fallout
-

 Crypto World3 days ago
Russia Introduces Bill To Criminalize Unregistered Crypto Services
-
 Tech6 days ago
Microsoft adds Windows protections for malicious Remote Desktop files
-
 Entertainment6 days ago
Dave Portnoy Slams Dianna Russini: ‘Makes Zero Sense’
-

 Crypto World6 days ago
X Launches New Cashtag Feature for Stocks and Crypto: X
-

 Sports7 days ago
Younger Than Sachin Tendulkar: Vaibhav Sooryavanshi Set To Make Historic India Debut
-

 Entertainment7 days ago
Prince Carter Brings Fans Front Row and Backstage at Boys 4 Life Tour
-

 Sports5 days ago
British climbers complete new route in Swiss Alps
-
 Crypto World6 days ago
Bitcoin surpasses halfway mark in current halving cycle
-
 Crypto World7 days ago
Paxos Labs Raises $12M to Launch Crypto Yield and Lending Platform
You must be logged in to post a comment Login