
Crypto World
Four 1-Minute Scalping Strategies: Ideas and Applications

Scalping on the 1-minute chart is about reacting to short bursts of order flow, momentum shifts, and volatility as they unfold in real time. Execution speed, clarity, and repeatable rules matter more than broad narratives or longer-term bias. This article looks at four 1-minute trading strategies that combine price behaviour with common technical tools, outlining how many traders structure entries, exits, and trade management when working on ultra-short timeframes.
Takeaways
- Scalping is a trading approach that focuses on short-lived price moves on small timeframes (from 1-minute to 15-minute charts), with trades managed over seconds or minutes and outcomes shaped by execution, spread, and timing rather than extended market moves.
- The article outlines four approaches: VWAP with MACD, Keltner Channels with RSI, ALMA with Stochastic, and RSI with Bollinger Bands. We show how traders frame entries and exits within 1-minute trading strategies.
- Volume Weighted Average Price (VWAP), Moving Average Convergence Divergence (MACD), Relative Strength Index (RSI), Bollinger Bands, Keltner Channels, Arnaud Legoux Moving Average (ALMA), and Stochastic Oscillator are common 1-minute scalping indicators used to track momentum, volatility, and short-term structure.
- Frequent trading increases exposure to costs and execution variance, so predefined stops, take-profit targets, and session rules may help manage your trades.
1-Minute Scalping Trading: Basics
1-minute scalping is a fast-paced trading style focusing on taking advantage of small price movements within a minute timeframe. Traders using this approach rely on 1-minute charts to make quick, multiple trades throughout the trading session. The primary goal is to accumulate potential small gains that might add up to larger returns over time.
A scalp trading strategy requires a solid understanding of technical analysis and market conditions. Scalpers typically use indicators, price action patterns, and trend analysis to identify short-term market movements and potential entry and exit points. The rapid nature of 1-minute scalping demands precision and discipline, as even a slight delay can impact the trade outcome.
One of the advantages of 1-minute scalping is the ability to generate frequent trades, which can be particularly appealing during volatile market conditions. However, it also comes with higher risks due to the speed and frequency of trades, meaning risk management plays a significant role.
Scalpers should also be aware of transaction costs, as frequent trading can lead to significant fees, which may erode potential returns. Choosing a broker with low commissions, tight spreads, and fast execution speeds may help when implementing a scalping forex strategy.
Four 1-Minute Scalping Strategies
Now, let’s take a closer look at four 1-minute trading strategies. To apply these strategies, see how they work in practice, and access each of these 1-minute scalping indicators, you can consider following along on FXOpen’s TickTrader trading platform.
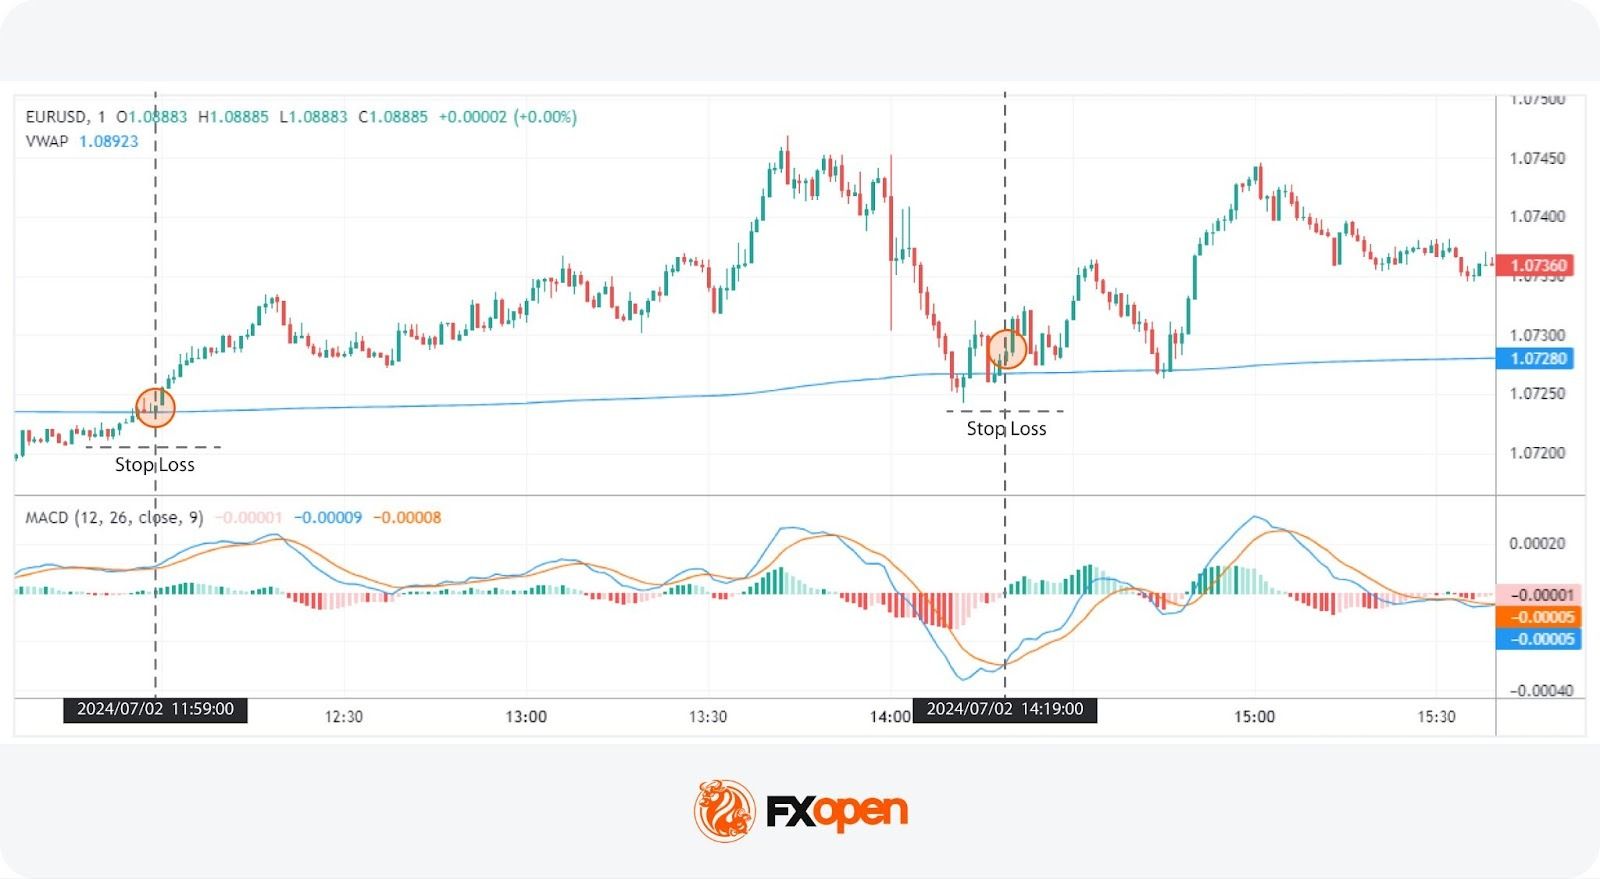
Strategy 1: VWAP + MACD
Indicators Used
- VWAP (Volume Weighted Average Price): VWAP calculates the average price a security has traded at throughout the day, based on both volume and price. It may help traders determine the trend and identify potential support and resistance levels.
- MACD (Moving Average Convergence Divergence): MACD is an indicator that visualises the relationship between two moving averages. MACD settings for a 1-minute chart are standard: the MACD line is derived from the difference between the 12-period and 26-period exponential moving averages (EMA), while the signal line is a 9-period EMA of the MACD line.
VWAP and MACD work well together by providing both trend and momentum analysis. VWAP is used to determine the overall trend and significant price levels, while MACD offers insights into momentum changes. This combination may help traders set entries by confirming trends and potential reversals.
Entry
- Traders typically look for the price to close through the VWAP, with the MACD turning from positive to negative or vice versa. This coincides with the signal line crossing over the MACD line.
- Alternatively, another common entry point is when the price uses the VWAP as a level of support or resistance, confirmed by the MACD turning from positive to negative or vice versa.
These triggers will likely occur within a few candles of each other, typically within 4 or 5 candles.
Stop Loss
- Stop losses might be set just beyond a recent high or low swing point.
Take Profit
- Traders could place take-profit orders when the signal line crosses the MACD line in the opposite direction, and the histogram switches from positive to negative or vice versa. This approach allows traders to take advantage of momentum shifts and potentially lock in gains as the trend changes.
- However, some may prefer to exit at a significant support or resistance level in order to maximise potential gains.
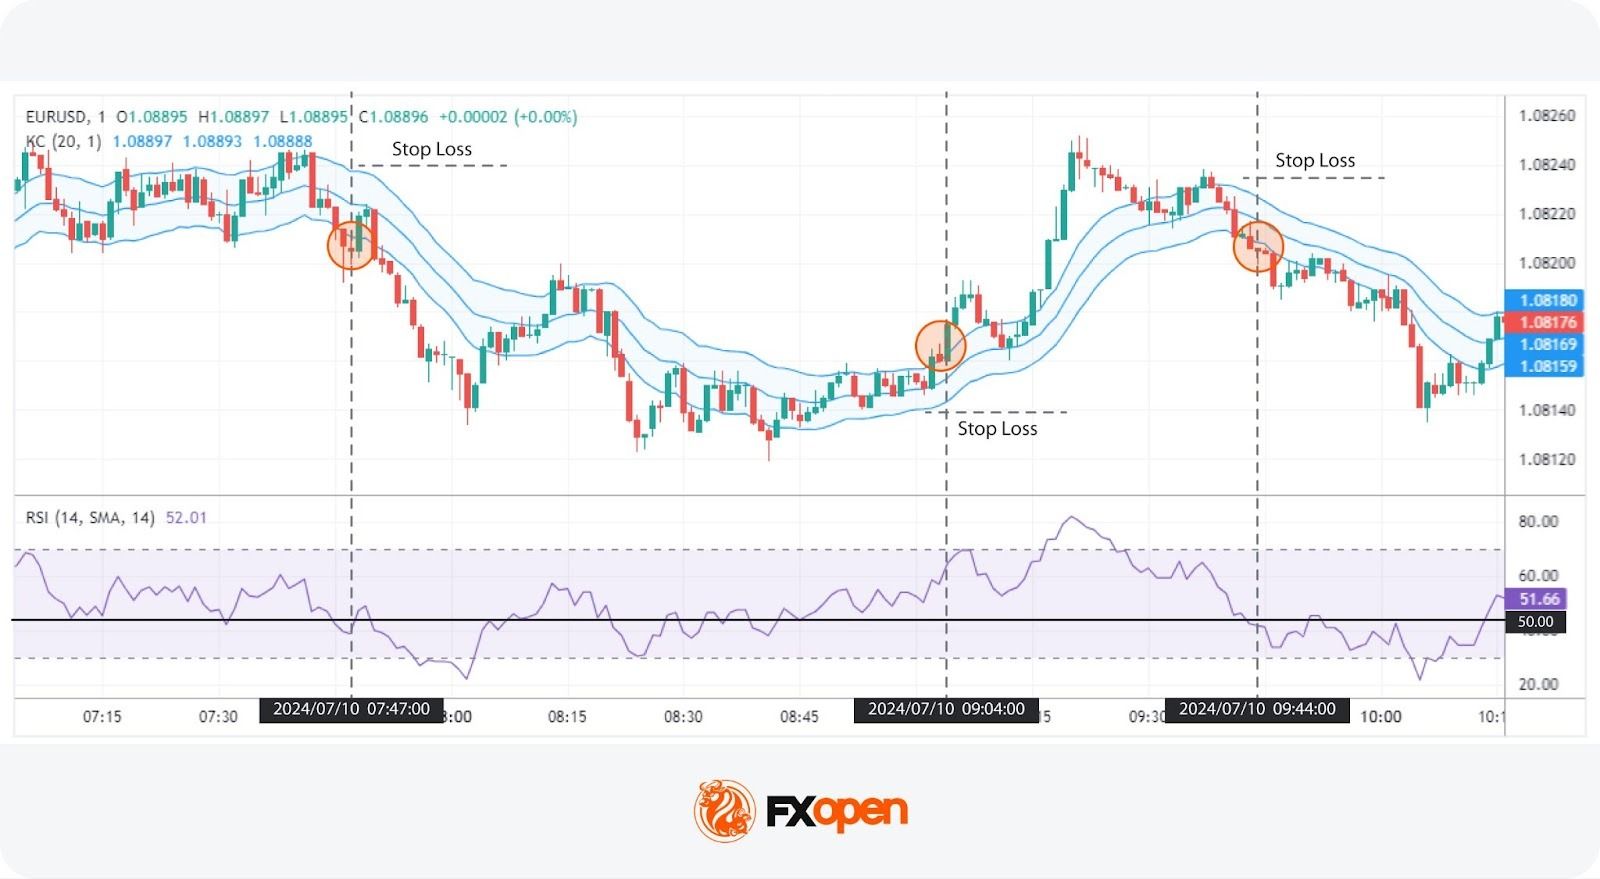
Strategy 2: Keltner Channels + RSI
Indicators Used
- Keltner Channels: Volatility-based bands plotted above and below an exponential moving average. The channels are typically set to two average true range (ATR) values away from the EMA. They are used by traders to identify overbought and oversold conditions and potential breakouts.
- RSI (Relative Strength Index): A momentum oscillator, introduced by J. Welles Wilder in his book New Concepts in Technical Trading Systems, that gauges the rate and extent of price changes. It ranges between 0 and 100, where readings above 70 signal overbought conditions, and readings below 30 indicate oversold conditions. RSI can also indicate bullishness when it crosses above 50 and vice versa.
The Keltner Channels, which offer insights into breakouts, and the RSI, which gauges momentum, may support traders in finding entry points on the 1-minute chart. It is widely used not only in the forex market but as a 1-minute gold scalping strategy, given the high volatility of gold.
Entry
- Traders often look for two or more closes outside of the Keltner Channel and ideally strong and/or consecutive green (bullish) or red (bearish) candles.
- This is confirmed by the RSI recently breaking above 50 for bullish signals or below 50 for bearish signals.
The combination of strong price action and momentum change may help traders identify potential trend continuations.
Stop Loss
- Stop losses might be set beyond the opposite side of the Keltner Channel.
- For a higher risk-reward ratio, traders might place stop losses beyond a nearby swing candle.
Take Profit
- Traders might set take-profit orders when the price crosses back beyond the Keltner Channel’s midpoint or reaches the opposite side of the channel, indicating a potential exhaustion of the current move.
- Alternatively, profit targets might be placed when RSI moves beyond 70 (overbought) or below 30 (oversold), signalling potential reversals in price direction.
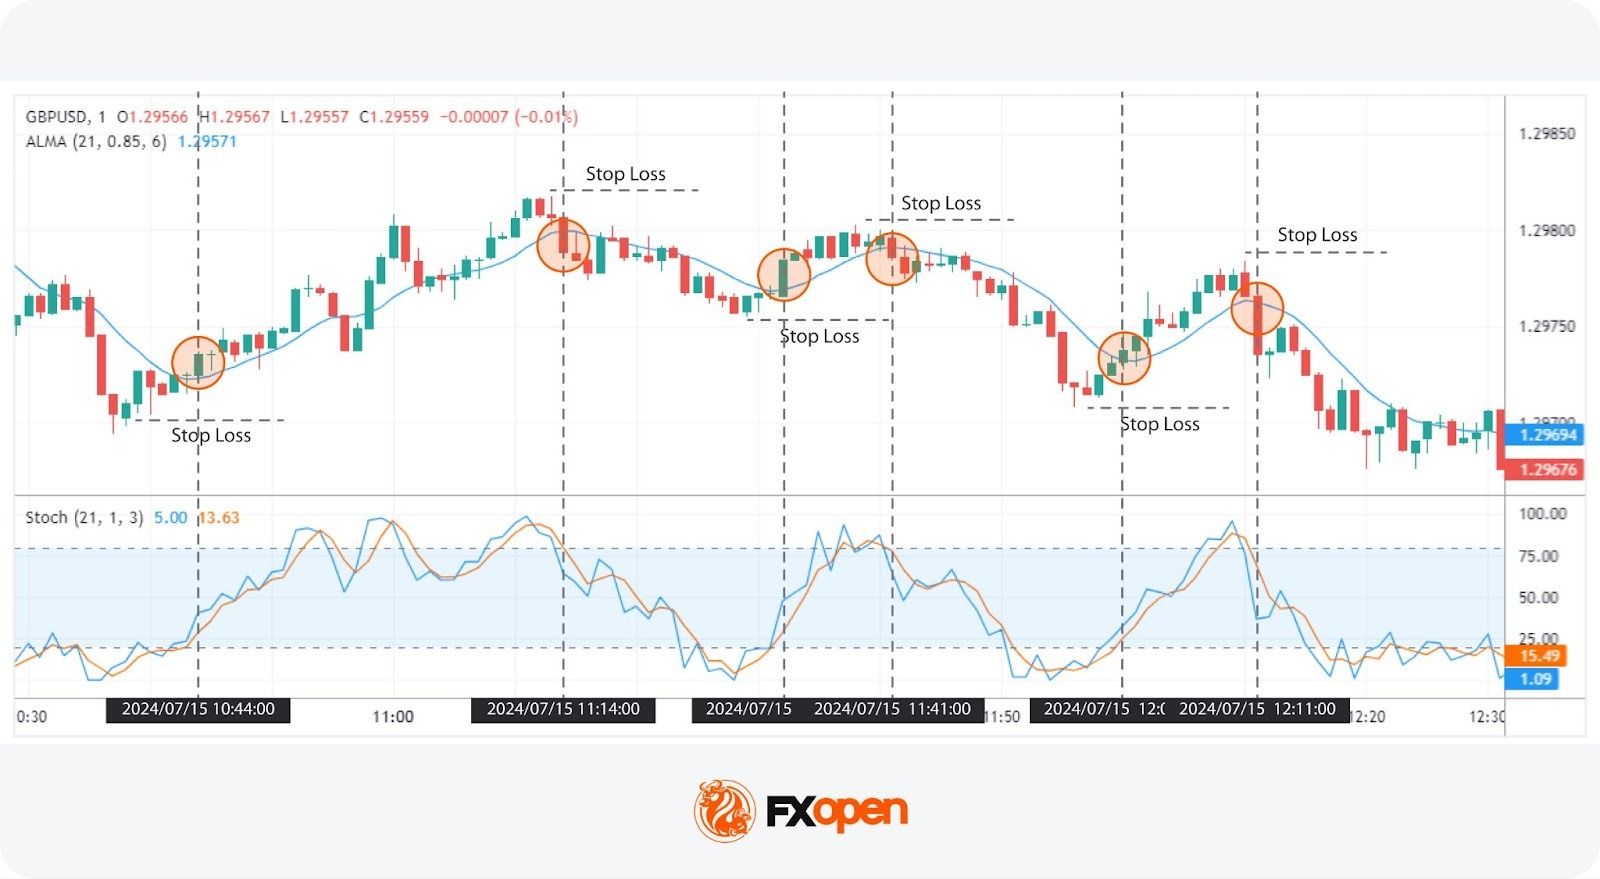
Strategy 3: ALMA + Stochastic
Indicators Used
- ALMA (Arnaud Legoux Moving Average): ALMA is a moving average that aims to smooth price data while reducing lag. The settings used are 21 for the window size, 0.85 for the offset, and 6 for the sigma. This combination may support traders when identifying the trend.
- Stochastic Oscillator: The Stochastic measures the location of the close relative to the high-low range over a set period. Settings of 21, 1, 3 are used to capture momentum and potential reversal points. A figure above 80 signals overbought conditions, while below 20 indicates the opposite.
Combining ALMA with the Stochastic Oscillator allows traders to identify potential reversals in trends. ALMA provides a smoothed view of the price trend, while the Stochastic Oscillator offers momentum-based signals that are expected to help confirm the strength of a move.
Entry
- Traders look for the price to close through the ALMA, ideally with a strong close, which suggests a potential trend change.
- This is confirmed by the Stochastic Oscillator crossing below 80 for a bearish signal or above 20 for a bullish signal, indicating momentum alignment with the trend.
Note that price may fluctuate above and below the ALMA in ranging conditions and produce false signals.
Stop Loss
- Stop losses might be set beyond the nearest swing point.
Take Profit
- Traders might place take-profit orders when the Stochastic reaches the opposite territory (e.g., from above 80 to below 20 for a bearish move), indicating a potential exhaustion of the current trend.
- Alternatively, profit targets might be set at identified areas of support or resistance, where price action historically reacts, providing a logical exit point.
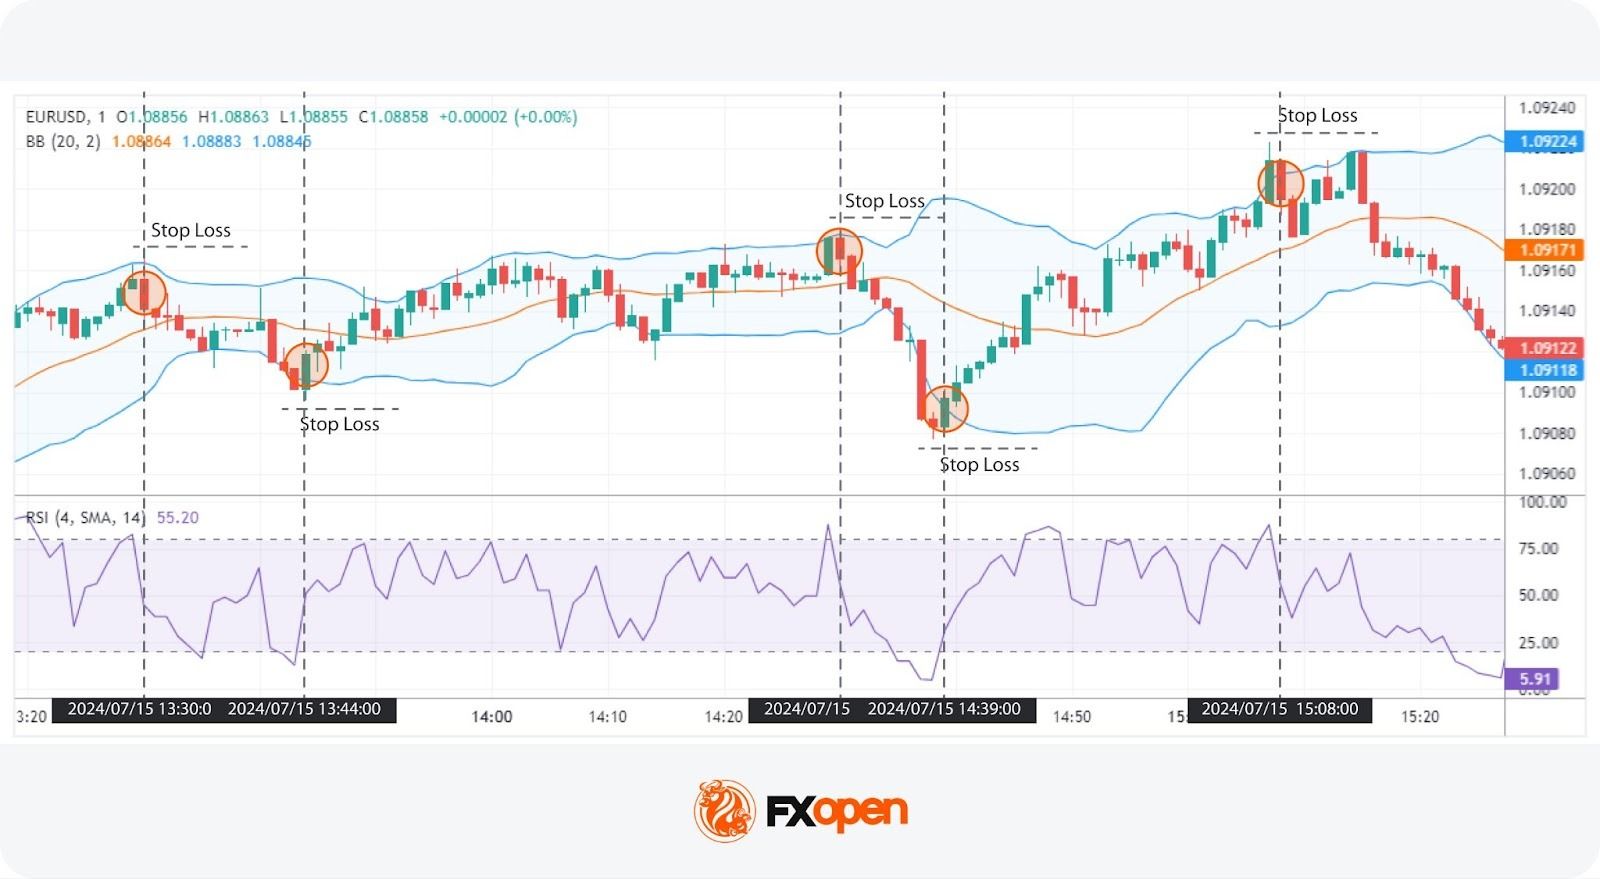
Strategy 4: RSI + Bollinger Bands
Indicators Used
- RSI (Relative Strength Index): For this 1-minute strategy, RSI settings are a length of 4, with overbought and oversold boundaries at 80 and 20, respectively. These settings are popular when identifying short-term overbought and oversold conditions.
- Bollinger Bands: Bollinger Bands settings for a 1-minute chart are a 20-period simple moving average (middle band) and two outer bands set at a standard deviation level of 2 from the middle band. They may help determine periods of high and low volatility as well as potential reversal points.
The combination of RSI and Bollinger Bands allows traders to identify potential short-term reversals in the market. Bollinger Bands provide a dynamic range for price action, while the RSI confirms overbought or oversold conditions. This may support traders when identifying entry and exit points.
Entry
- Traders often enter when the RSI crosses below 80 from above or above 20 from below, signalling an exit from potential overbought or oversold conditions.
- This entry is confirmed when the price is also touching or breaching the Bollinger Band, indicating the likelihood of a short-term reversal.
Stop Loss
- Stop losses might be set beyond a nearby swing point or just outside the Bollinger Band, giving the trade room to develop.
Take Profit
- Traders might place take-profit orders when the price touches the opposing Bollinger Band, suggesting a potential end to the current price move.
- Alternatively, some might set take-profit orders when the RSI crosses into the opposing overbought or oversold territory, indicating a shift in momentum.
The Bottom Line
Mastering a 1-minute trading strategy requires a combination of speed, precision, and disciplined risk management. The usefulness of a trading strategy may depend on several factors, including a thorough understanding of technical indicators, adherence to strict trading rules, and the ability to adapt to changing market conditions in real time.
If you want to develop your own trading approach and learn market behaviour in different conditions, you may consider opening an FXOpen account. FXOpen provides access to over 700 instruments, with commissions starting from $1.50 and spreads from 0.0 pips (additional fees may apply).
FAQ
What Is the 1-Minute Timeframe Trading Strategy?
The 1-minute timeframe trading strategy involves making multiple trades within a single minute, aiming to capture small price movements. Traders use a 1-min scalping strategy when they rely heavily on technical indicators and prefer to act immediately.
Which Indicator Is Popular for a One-Minute Scalping Strategy?
There is no single 1-minute scalping strategy indicator; it comes down to preference and experience. However, popular choices include the Moving Average Convergence Divergence (MACD), Relative Strength Index (RSI), Bollinger Bands, and the Volume Weighted Average Price (VWAP). Many traders combine several indicators to confirm signals.
What Is the Popular Timeframe for Scalping Crypto*?
The timeframe for crypto* scalping depends on the trader’s preference and strategy. While a 1-minute crypto* scalping strategy is based on numerous rapid trades, some traders prefer slightly longer timeframes like the 5-minute or 15-minute charts to balance speed and cryptocurrency* market noise.
What Is the Stochastic Setting for Scalping 1-Minute Strategy?
For 1-minute scalping, the Stochastic Oscillator is typically set to the standard settings of 14, 1, 3. These settings may help capture short-term momentum changes, providing timely signals for entry and exit points. Adjustments can be made based on the trader’s specific strategy and market conditions.
*Important: At FXOpen UK, Cryptocurrency trading via CFDs is only available to our Professional clients. They are not available for trading by Retail clients. To find out more information about how this may affect you, please get in touch with our team.
This article represents the opinion of the Companies operating under the FXOpen brand only. It is not to be construed as an offer, solicitation, or recommendation with respect to products and services provided by the Companies operating under the FXOpen brand, nor is it to be considered financial advice.

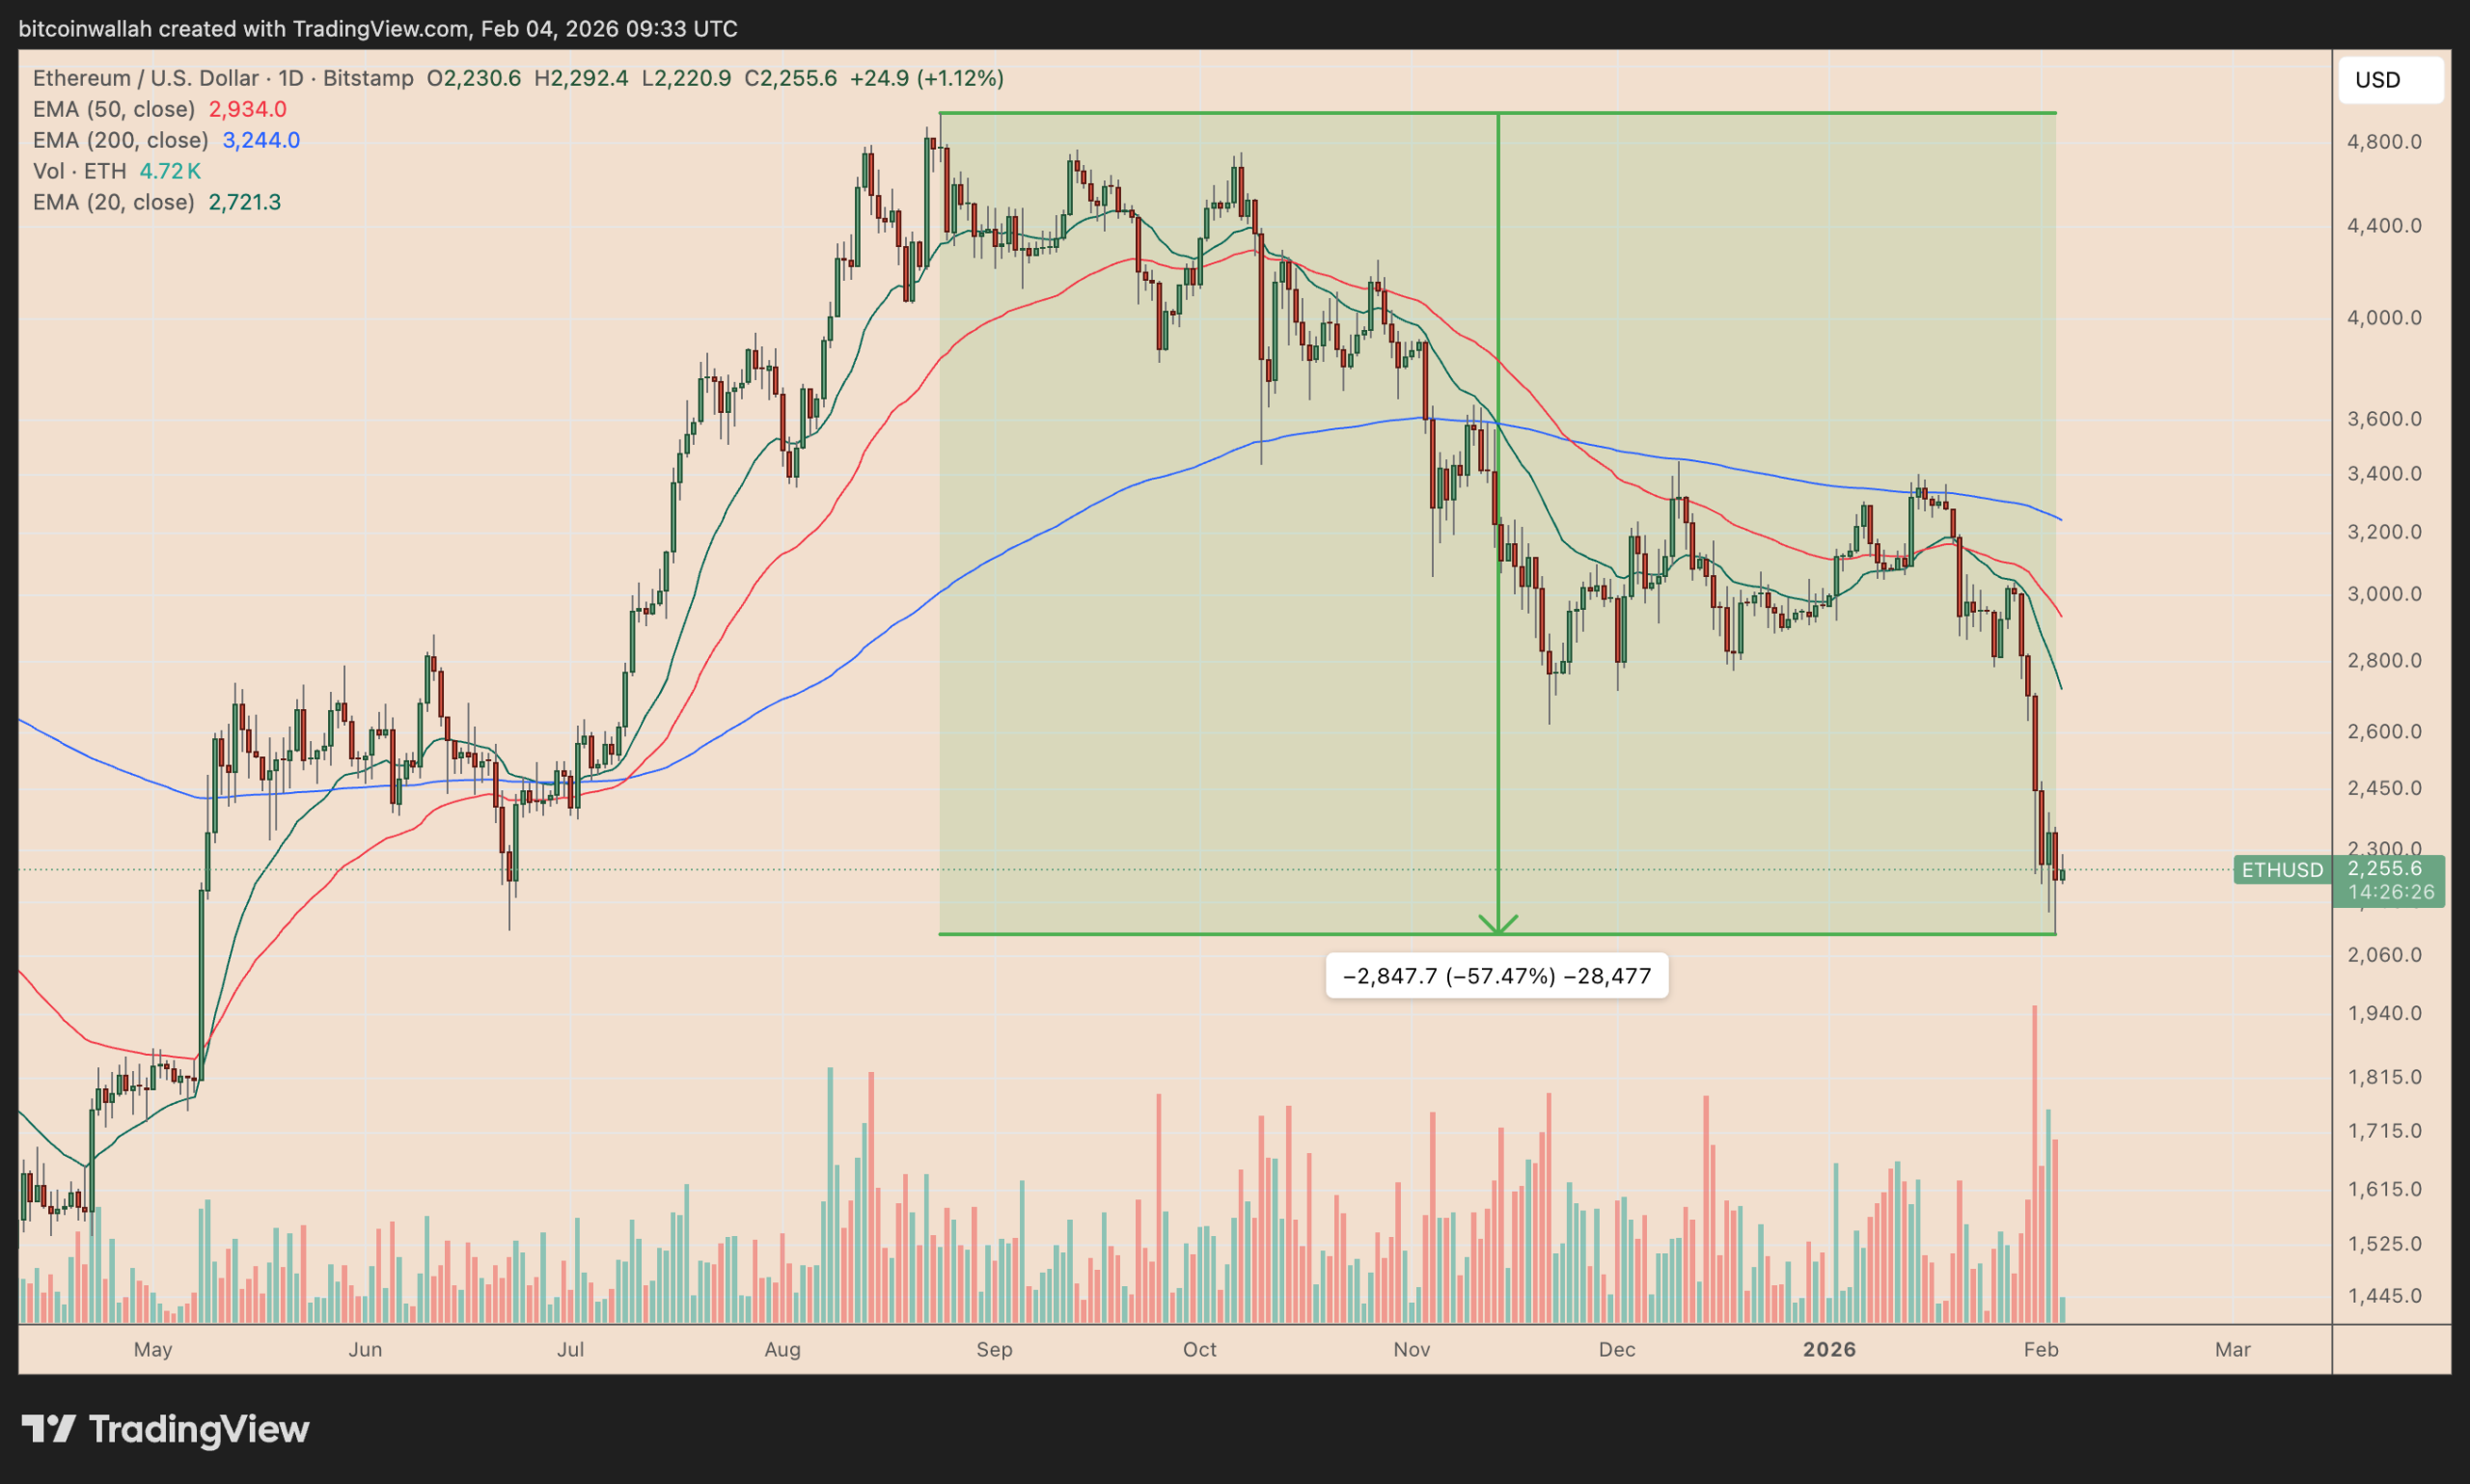
The price of Ethereum’s native token, Ether (ETH), risks sliding below $2,000 in February as a classic bearish setup plays out.
Key takeaways:
-
ETH breakdown keeps $1,665 downside target in focus.
-
MVRV bands also point to price sliding toward $1,725 or lower before a potential bottom.

ETH risks declining 25% in February
As of Wednesday, ETH had entered the breakdown stage of its prevailing inverse-cup-and-handle (IC&H) pattern. This could extend a downtrend that has already erased about 60% from its August 2025 peak.
An IC&H pattern forms when price forms a rounded top and then drifts higher in a small recovery channel. It typically resolves when the price breaks below the neckline support, often falling by as much as the cup’s maximum height.
Ether broke below the inverse cup-and-handle neckline near $2,960 in January. It later rebounded to retest that level as resistance, a common post-breakdown move, only to resume its decline.

ETH’s rebound also stalled below the 20-day (green) and 50-day (red) EMAs, which acted as overhead resistance.
These confluence indicators raised ETH’s odds of declining toward the IC&H breakdown target at around $1,665, down 25%, in February or by early March.
Historically, the inverse cup-and-handle hits its projected downside target with an 82% success rate, according to a study by Chartswatcher.
From a macro perspective, Ethereum’s downside risk is increasing as traders cut back on crypto bets, worried the market could slip into a broader 2026 downturn similar to past “four-year cycle” pullbacks.
Fears of an “AI bubble” popping are also forcing traders to avoid riskier bets such as crypto.
Ethereum’s MVRV bands hint at $1,725 target
Ethereum’s technical downside target sat just below the lowest boundary of its MVRV extreme deviation pricing bands, currently at $1,725.
These bands are onchain price zones that show when ETH is trading below or above the average price at which traders last moved their coins.

Historically, ETH price plunged near or even below the lowest MVRV band before bottoming out.
That includes the April 2025 bounce, when the ETH price rose 90% a month after testing the lowest MVRV deviation band around $1,390. A similar rebound occurred in June 2018.
Related: ETH funding rate turns negative, but US macro conditions mute buy signal
Therefore, Ether may decline toward $1,725 or below in February, which lines up with the IC&H downside target.
This article does not contain investment advice or recommendations. Every investment and trading move involves risk, and readers should conduct their own research when making a decision. While we strive to provide accurate and timely information, Cointelegraph does not guarantee the accuracy, completeness, or reliability of any information in this article. This article may contain forward-looking statements that are subject to risks and uncertainties. Cointelegraph will not be liable for any loss or damage arising from your reliance on this information.
TLDR
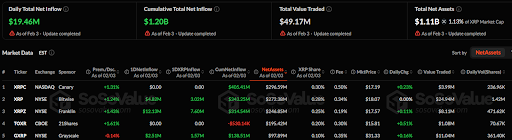
- Total daily net inflow across XRP ETFs reached $19.46 million, with cumulative net inflow at $1.20 billion.
- XRPC ETF on NASDAQ saw no daily inflow, with assets totaling $296.59 million, representing 0.30% of XRP’s share.
- The XRP ETF, sponsored by Bitwise on NYSE, had a daily net inflow of $4.82 million, with assets of $272.38 million.
- The XRPZ ETF reported a daily inflow of $12.13 million, with assets at $246.85 million and a +0.11% daily change.
- The GXRP ETF had a negative daily change of -0.14%, with a net inflow of $2.51 million and assets of $195.42 million.
According to a SoSoValue update as of February 3, the total daily net inflow across XRP ETFs stood at $19.46 million. This brings the cumulative total net inflow to $1.20 billion. The total value traded on the day amounted to $49.17 million, with the total net assets reaching $1.11 billion, representing 1.13% of XRP’s market cap.
XRPC and TOXR ETFs Record No Change in Daily Flows
The XRP ETFs on the market showed various levels of performance. A look at individual XRP ETFs reveals that XRPC ETF, listed on NASDAQ and sponsored by Canary, saw no change in daily inflow with a cumulative net inflow of $405.41 million.

The fund’s assets amounted to $296.59 million, and it represented 0.30% of XRP’s market share. Its market price stood at $17.19, with a daily change of +0.23%. The value traded reached $3.99 million, with daily volume hitting 236.96K shares.
The TOXR ETF, listed on CBOE and sponsored by 21Shares, saw a positive change of +1.61%. Despite no inflow or outflow, the ETF has had a cumulative net inflow of $314.54 million and assets of $195.42 million, representing 0.25% of XRP’s share. The market price was $15.81, showing a +0.51% daily change. The value traded was $1.08 million, with 70.67K shares traded on the day.
XRPZ, GXRP, and XRP ETFs Reports Inflows
XRP on the NYSE, sponsored by Bitwise, experienced a daily net inflow of $4.82 million. Its total assets amounted to $272.38 million, representing 0.28% of XRP’s share. The fund’s market price was $18.07. The value traded reached $24.94 million, with a daily volume of 1.42 million shares.
The XRPZ ETF, listed on the NYSE and sponsored by Franklin, reported a daily inflow of $12.13 million. The ETF’s assets amounted to $246.85 million, or 0.25% of XRP’s share. Its market price was $17.57, reflecting a +0.11% daily change. This ETF saw $8.11 million in value traded, with a daily volume of 471.62K shares.
Finally, the GXRP ETF, listed on the NYSE and sponsored by Grayscale, had a negative daily change of -0.14%. It recorded a net inflow of $2.51 million, bringing total assets to $195.42 million. The ETF’s market price was $31.33, up 0.16% on the day. The total value traded was $11.04 million, and daily volume was 361.40K shares.


Tether has quietly pulled back from plans to raise as much as $20 billion in fresh capital after facing investor resistance to a proposed valuation that would rank the stablecoin issuer among the world’s most valuable private companies, per an FT report on Wednesday.
The company, which issues the USDT stablecoin with over $185 billion in circulation, had explored a funding round last year that could have valued Tether at around $500 billion, according to people familiar with the talks.
Advisers have since floated raising closer to $5 billion, a sharp reduction from earlier discussions, as investors questioned both the size of the deal and the valuation.
Chief executive Paolo Ardoino said the larger figures had been misunderstood, describing the $15 billion to $20 billion range as a ceiling rather than a target.
“That number is not our goal,” Ardoino said in an interview to FT. “If we were selling zero, we would be very happy as well.”
Tether’s fundraising push has drawn attention because the company is already highly profitable and has limited operational need for external capital. Ardoino said the firm generated roughly $10 billion in profit last year, largely from interest earned on the assets backing USDT, and added that insiders were reluctant to sell shares.
Still, prospective investors have raised concerns about a valuation that would place Tether alongside firms such as SpaceX, ByteDance and leading artificial intelligence companies. Some have also pointed to regulatory risks and long-standing questions around reserve transparency as sticking points.
Tether has faced scrutiny since its founding over the quality of its reserves and the use of USDT in illicit activity. While the company now publishes quarterly attestations from BDO Italia, it has not released a full audit. Ratings agency S&P Global downgraded Tether’s reserve assessment last year, citing increased exposure to assets such as bitcoin and gold.
But Ardoino has defended the company’s approach, arguing that Tether’s profitability compares favorably with loss-making AI firms commanding similar valuations.
“If you believe some AI company is worth $800 billion with a huge minus sign in front, be my guest,” he said.
Tether’s growing footprint in U.S. Treasuries and gold has made it one of the most significant bridges between traditional finance and digital assets — a role that continues to attract attention even as investors debate how much the company is worth.


Crypto press release distribution services have become a tool for questionable projects to sidestep third-party scrutiny and create an illusion of legitimacy, a new report from Chainstory shows.
The researchers reviewed 2,893 releases sent out between June and November last year. They found that more than 60% came from projects with “classic red flags” such as an anonymous team making unrealistic claims, copy-paste websites and aggressive tactics to scare investors into action. Some were outright scams confirmed as fraudulent by cross-referencing with blacklists and active scam alerts.
Unlike established, traditional distribution services, crypto-focused press wires often have deals that guarantee placement on dozens of websites with little oversight. These paid-for placements often appear alongside actual news, sometimes without clear labels, making it difficult for readers to tell the difference.
“If you stumble upon a crypto press release on a news site, odds are better than 50/50 that the project behind it is of low credibility (or worse),” the researchers wrote in the report published Tuesday.
Most of the releases were self-authored marketing announcements about minor product updates, token sales or exchange listings, the team said. Only about 2% reported meaningful news like venture funding or acquisitions, types of stories that would typically earn editorial coverage.
CoinDesk contacted several press wires, but none had replied by publication time.
Pay to display
At heart is the relationship between distribution services and websites. The wires act as a pipeline, pushing out content for a fee, while the websites charge to display them without editorial filtering, according to the report.
To the casual reader, it may look like coverage from reputable media outlets, even though no journalist reported the story and the claims within the release are unverified.
This tactic is not limited to startups. Major exchanges regularly push press releases announcing every token listing to create a sense of constant activity, the researchers noted. There is no suggestion the exchanges are involved in wrongdoing.
The scattergun approach, however, boosts visibility with search engines, clutters news feeds and muddies the line between reporting and promotion while giving otherwise unproven or high-risk projects a veneer of unearned legitimacy.
“The core mechanism of the crypto press release industry is piggybacking,” the study said. “By funneling content through syndication networks, issuers avoid the ‘newsworthiness’ filter of a newsroom and instead rely on the credibility of the distribution platform.”
In one example from December, scammers used fake branding to impersonate Circle Internet (CRCL), the issuer of the USDC stablecoin. The release promoted a fake tokenized metals platform and linked to what appeared to be a wallet-draining site. The release was debunked by CoinDesk, but only after appearing on multiple news sites.
While some news outlets have started labeling or limiting press release content, the lack of clear standards and editorial filters remains a vulnerability in the crypto media ecosystem, the report said.


The hype around cryptocurrency companies going public is waning because markets are still viewed as insufficiently large for the traditional finance (TradFi) firms that are taking an increased interest in the industry.
Fewer investors feel as confident as they did last year, according to a report from the influential CfC St. Moritz, Switzerland crypto conference, which recorded the outlook and predictions of 242 respondents at the event.
After a record 2025 that saw 11 IPOs raise $14.6 billion, “sentiment points to waning IPO intensity and rising consolidation risk,” the report said. Liquidity shortages are seen as the biggest threat, according to the report.
Of 242 respondents, 107 believe “TradFi is taking over” crypto, up more than 50% year over year.
Attendees, however, noted an improvement in crypto regulation in the U.S. and UAE. The U.S. jumped from last to second place in regulatory favorability within a year, reflecting rising confidence, and the UAE remains the top jurisdiction.
“The CfC St. Moritz Report captures the thinking of some of the most influential decision-makers in digital assets,” said Nicolo Stöhr, CEO of the CfC St. Moritz. “Their responses point to a clear shift in priorities, from hype to infrastructure, liquidity, and regulatory credibility, as well as a rapidly changing view of the U.S. market. This is informed capital speaking, and it reflects where the industry is truly heading.”

Two leading prediction-market platforms, Kalshi and Polymarket, are leaning into experiential marketing as they vie for dominance in a fast-growing segment of the financial landscape. Kalshi staged a $50 grocery giveaway for more than 1,000 Manhattan residents on Tuesday, drawing lines that stretched for blocks and highlighting the power of real-world perks to convert interest into signups. In tandem, Polymarket announced plans to open a free grocery store, a venture branded as “The Polymarket,” slated to launch next week with a pledge of $1 million to Food Bank for NYC to assist food access across all five boroughs. The dual promotions illustrate how prediction-market platforms are blending commerce, charity, and media partnerships to expand reach beyond digital trading floors.
Thousands have already picked up their free Kalshi groceries!
We are being told we’ve already inspired other companies to keep up the initiative!
2 more hours to get yours
Westside Market | 84 3rd Ave. NYC pic.twitter.com/8R11OGODLu
— Kalshi (@Kalshi) February 3, 2026
Kalshi’s giveaway took place at the Westside Market on 84 3rd Ave in Manhattan, a venue chosen to maximize visibility among urban shoppers already accustomed to the grocery aisles of daily life. The event ran between 12 pm and 3 pm local time, and footage circulating on social media shows long lines that extended for several blocks. The guest list for the promotion tallied 1,795 names, a figure described by Kalshi as an indicator of robust interest in markets that sit at the intersection of public participation and financial speculation. The company’s broader strategy in 2025 included generating $263.5 million in fee revenue, illustrating how these platforms monetize crowdsourced insights through prediction activity and related services.
“Free groceries. Free markets. Built for the people who power New York.”
Meanwhile, Polymarket revealed a parallel push to inject the experience of its markets into real-world settings. The company said it had signed a lease to open what it brands as “New York’s first free grocery store,” aiming to launch the venture next Thursday at 12 pm local time. In support of the initiative, Polymarket donated $1 million to the Food Bank for NYC to bolster food access across all five boroughs. The timing aligns with a broader push by both platforms to integrate traditional media strategies with their online ecosystems, including public-facing campaigns and high-visibility advertising components that are increasingly difficult to distinguish from mainstream marketing.
The Polymarket initiative was not the only signal of a broader marketing tilt. Kalshi has engaged in media partnerships, including collaborations with CNN and CNBC during 2023 and 2024 cycles, while Polymarket has pursued collaborations with Dow Jones in early 2024. These alliances reflect a trend in which prediction-market operators seek to normalize and accelerate participation through mainstream outlets, a move that can affect liquidity and user acquisition in a space that sees daily volume in the hundreds of millions.
Kalshi gives out free groceries to thousands of New Yorkers https://t.co/62BO68KbuZ pic.twitter.com/rBnSAqWdBg
— Historic Vids (@historyinmemes) February 3, 2026
Across the industry, trading volumes in prediction markets have surged in recent months, with daily activity measured well above $400 million. The scale underscores the sector’s momentum as traditional finance intersects with decentralized and on-chain thinking. Kalshi’s and Polymarket’s growth has been underscored by their valuations; both platforms have drawn multibillion-dollar assessments following significant funding rounds and strategic integrations. The volume growth is notable because it coincides with a broader reaggregation of liquidity around derivative-style contracts tied to current events, sports outcomes, and macro developments—areas where prediction markets have garnered increasing interest from both retail and institutional participants.
Those market dynamics intersect with regulatory and competitive considerations. Industry observers note that prediction-market advertising faced a high-profile challenge during major U.S. sports broadcasts, specifically with the Super Bowl slated for Feb. 8, when advertising restrictions were cited as a constraint for such platforms. In the meantime, the promotional efforts by Kalshi and Polymarket reflect a broader appetite to test new distribution channels and community-building models, particularly in major markets like New York City where both platforms are headquartered.
Kalshi has distributed free groceries to thousands in NYC as part of a broader push to democratize markets
— Historic Vids (@historyinmemes) February 3, 2026
Both Kalshi and Polymarket are rooted in New York City, a jurisdiction that remains central to the industry’s branding and strategy. The city’s status as a financial hub, housing the New York Stock Exchange and the Nasdaq, provides a backdrop that could help attract mainstream attention to prediction markets as legitimate tools for forecasting and civic participation. The partnerships with traditional media outlets, coupled with on-the-ground promotions, illustrate how the space is attempting to bridge online activity with tangible, real-world experiences.
Market context
Market context: The prediction-market segment continues to exhibit rapid growth in liquidity and engagement, even as it navigates a complex regulatory and advertising environment. The combination of large-donor events, high-profile media partnerships, and city-focused promotions indicates a push to normalize and scale these platforms beyond niche online communities, while still relying on event-driven incentives to drive signups and participation.
Why it matters
For users, these promotions may lower the friction to engage with prediction markets and explore how markets price events in real time. For investors and builders, the initiatives reveal the potential for user acquisition through experiential programs and philanthropy, while also highlighting the importance of disciplined risk management and regulatory awareness as volumes rise. The campaigns also reflect a broader trend of blending consumer experiences with financial instruments, a development that could shape how new entrants think about distribution, trust-building, and community governance in prediction ecosystems.
From a market structure perspective, the convergence of media partnerships, real-world store concepts, and online trading desks could influence liquidity flows, contract design, and the range of outcomes that platforms offer. The emphasis on partnerships with established media brands and charity groups may help broaden the audience beyond traditional traders, a factor that could influence the valuation trajectories and strategic priorities of these operators in the coming quarters.
What to watch next
- Launch date and details for “The Polymarket” free grocery store, including its location, hours, and product offerings, scheduled for next Thursday at 12 pm local time.
- Results and turnout from Kalshi’s Westside Market promotion, including any follow-on campaigns or additional free-grocery events.
- Regulatory and advertising developments around prediction markets ahead of major events such as the next Super Bowl.
- Any new media partnerships or cross-promotional campaigns as the platforms seek to sustain growth in NYC and beyond.
Sources & verification
- Kalshi’s Westside Market grocery giveaway details, including the event timing and location (Westside Market, 84 3rd Ave, Manhattan).
- Guest-list figures and attendance reporting for Kalshi’s promo (1,795 sign-ups; media estimates of “thousands”).
- Polymarket’s lease announcement for a new NYC grocery store and the $1 million donation to Food Bank for NYC.
- The Polymarket post on X announcing the store launch and related updates.
- Industry context on prediction-market volumes and Kalshi’s 2025 fee revenue ($263.5 million) and “multibillion-dollar valuations.”
- Partnerships with Dow Jones (Polymarket) and CNN/CNBC (Kalshi) and broader media activity.
- Advertising restrictions related to the Super Bowl affecting prediction-market promotions.
- DefiLlama’s reporting on daily prediction-market trading volumes (above $400 million).
Grocery promos illuminate the race to shape prediction markets
The rivalry between Kalshi and Polymarket is less about a single product and more about a narrative that blends user engagement, real-world impact, and media visibility. Kalshi’s promotional event at the Westside Market in Manhattan demonstrates a direct approach to converting curiosity into participation, with a tangible payoff in the form of free groceries and a high turnout. The associated social-media chatter—evidence of a pipeline from online engagement to offline foot traffic—suggests the campaign achieved its core objective: to broaden awareness and recruit a broader audience into a space that has, to date, been dominated by digital activity and a relatively narrow subset of enthusiasts.
Polymarket’s response—a move to open a free grocery store—extends the promotional strategy into a durable, long-form engagement. By tying the store to a charitable effort with a reported $1 million donation to Food Bank for NYC, the company frames its market ecosystem as an instrument for social good while simultaneously creating a venue for real-world interaction with its trademark “free markets” concept. The lease agreement and the store’s planned launch time—12 pm local time on a Thursday—edge the project closer to a conventional retail rollout, albeit anchored by a prediction-market frame that invites visitors to consider probabilities in everyday decisions.
From a market-structure perspective, these promotional pushes are set against a backdrop of surging liquidity. Daily volumes in prediction markets exceed $400 million, a level that signals growing appetite for event-driven contracts and crowd-sourced forecasting. Kalshi’s reported 2025 fee revenue of $263.5 million, coupled with “multibillion-dollar valuations,” underscores the financial scale that these platforms have achieved in a relatively short period. While the revenue and valuation figures reflect fundraising and partnerships rather than pure trading profits, they point to a vibrant ecosystem in which media tie-ins, sponsorships, and philanthropic commitments intersect with product development and user acquisition strategies.
The campaigns also reflect a broader regulatory and reputational environment. The industry has faced scrutiny around advertising during major events, including proposals to limit promotional activity around the Super Bowl. As Kalshi and Polymarket expand their footprint, they will likely navigate this landscape by emphasizing transparency, compliance, and partnerships with established brands. The NYC focus of both initiatives spotlights the importance of local markets in building a scalable national or international footprint for prediction markets, an approach that echoes the way traditional financial markets have grown through regional hubs connected by digital platforms.
//platform.twitter.com/widgets.js

TLDR:
- Bitcoin’s power-law z-score at -0.69 indicates 38.2% discount from $122,681 mathematical trend value
- ETF outflows accelerated 265% to $15.25 billion in 30 days, driving persistent mechanical selling
- Open interest dropped 21.6% alongside 19.5% price decline, signaling deleveraging not panic selling
- Maximum gamma at $75K creates price compression with call wall at $90K and flip level at $71K
Bitcoin trades at $76,337 as of writing while mathematical models place its trend value at $122,681, creating a 38.2% discount that stems from mechanical deleveraging rather than fundamental weakness.
Data analyst David highlights this gap between short-term price formation driven by exchange-traded fund flows and long-run anchors determined by fixed supply and production costs.
The power-law z-score stands at -0.69, suggesting the asset trades significantly below its statistical trend despite unchanged underlying fundamentals.
ETF Outflows Drive Persistent Price Pressure
The primary catalyst behind Bitcoin’s current price weakness appears through exchange-traded fund activity.
Estimated net outflows reached $15.25 billion over the past 30 days, representing a 265% acceleration in redemptions. Trading volume remains at 0.8 times normal levels, indicating sustained rather than panicked selling pressure.
David explains that “this is how a scarce asset gets pushed below its ‘map’ without a dramatic capitulation.” The flow remains persistent but measured, avoiding the high-volume liquidation cascades typical of market crashes. Spot trading volume corresponds with gradual position unwinding rather than forced selling.
The distinction matters because mechanical selling creates different market dynamics than sentiment-driven crashes.
Exchange-traded fund investors can redeem shares steadily without triggering the feedback loops that amplify volatility. This steady pressure pushes price lower while maintaining relatively orderly market conditions.
Traditional panic selling typically accompanies volume spikes and accelerating price declines. Current market behavior shows neither characteristic, suggesting the selling pressure stems from portfolio rebalancing or institutional allocation shifts.
The absence of volatility expansion supports this interpretation of gradual rather than distressed selling.
Derivative Positioning Reveals Compression Dynamics
Open interest declined 21.6% over 30 days while price dropped 19.5%, producing a positive correlation of 0.66 between the two metrics.
David notes that “when price falls with collapsing open interest, you’re not seeing panic. You’re seeing balance sheets quietly shrink.” This synchronized decline indicates deleveraging rather than new short positions accumulating.
The paper-to-spot ratio stands at just 1.9%, reflecting reduced derivative activity relative to underlying asset trading. Options market structure shows net gamma exposure at negative $43 million, near neutral territory.
Maximum gamma concentrates at the $75,000 strike, creating a gravitational effect around current prices.
Put walls sit at $75,000 approximately 1.3% below spot, while call walls emerge at $90,000 roughly 18.5% higher. The gamma flip level appears at $70,999, about 6.5% below current trading levels.
David observes that “price feels ‘stuck’ because hedging flows are absorbing movement near the strike. Not because demand disappeared.”
The analyst emphasizes the asymmetric setup this creates, stating that “downside needs the persistent seller to keep selling. Upside mostly needs the seller to stop.”
The derivative structure adds friction to large moves in either direction until flow patterns shift materially or positioning constraints change substantially.

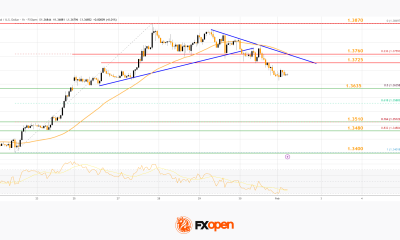
Gold prices started a fresh increase from $4,400 and moved above $5,000. WTI Crude oil prices are gaining bullish momentum and might even test $65.00.
Important Takeaways for Gold and WTI Crude Oil Prices Analysis Today
· Gold prices started another increase from $4,400 after a sharp decline.
· A connecting bullish trend line is forming with support at $5,000 on the hourly chart of gold at FXOpen.
· WTI Crude climbed above the $61.50 and $62.00 levels.
· There is a key bearish trend line forming with resistance at $64.65 on the hourly chart of XTI/USD at FXOpen.
Gold Price Technical Analysis
On the hourly chart of Gold at FXOpen, the price found support near $4,400 after a massive selloff. The price formed a base and started a fresh increase above $4,800.
The bulls cleared the $5,000 barrier and the 50-hour simple moving average. There was also a move above the 50% Fib retracement level of the downward move from the $5,595 swing high to the $4,402 low. The RSI is now above 50, and the price could aim for more gains.
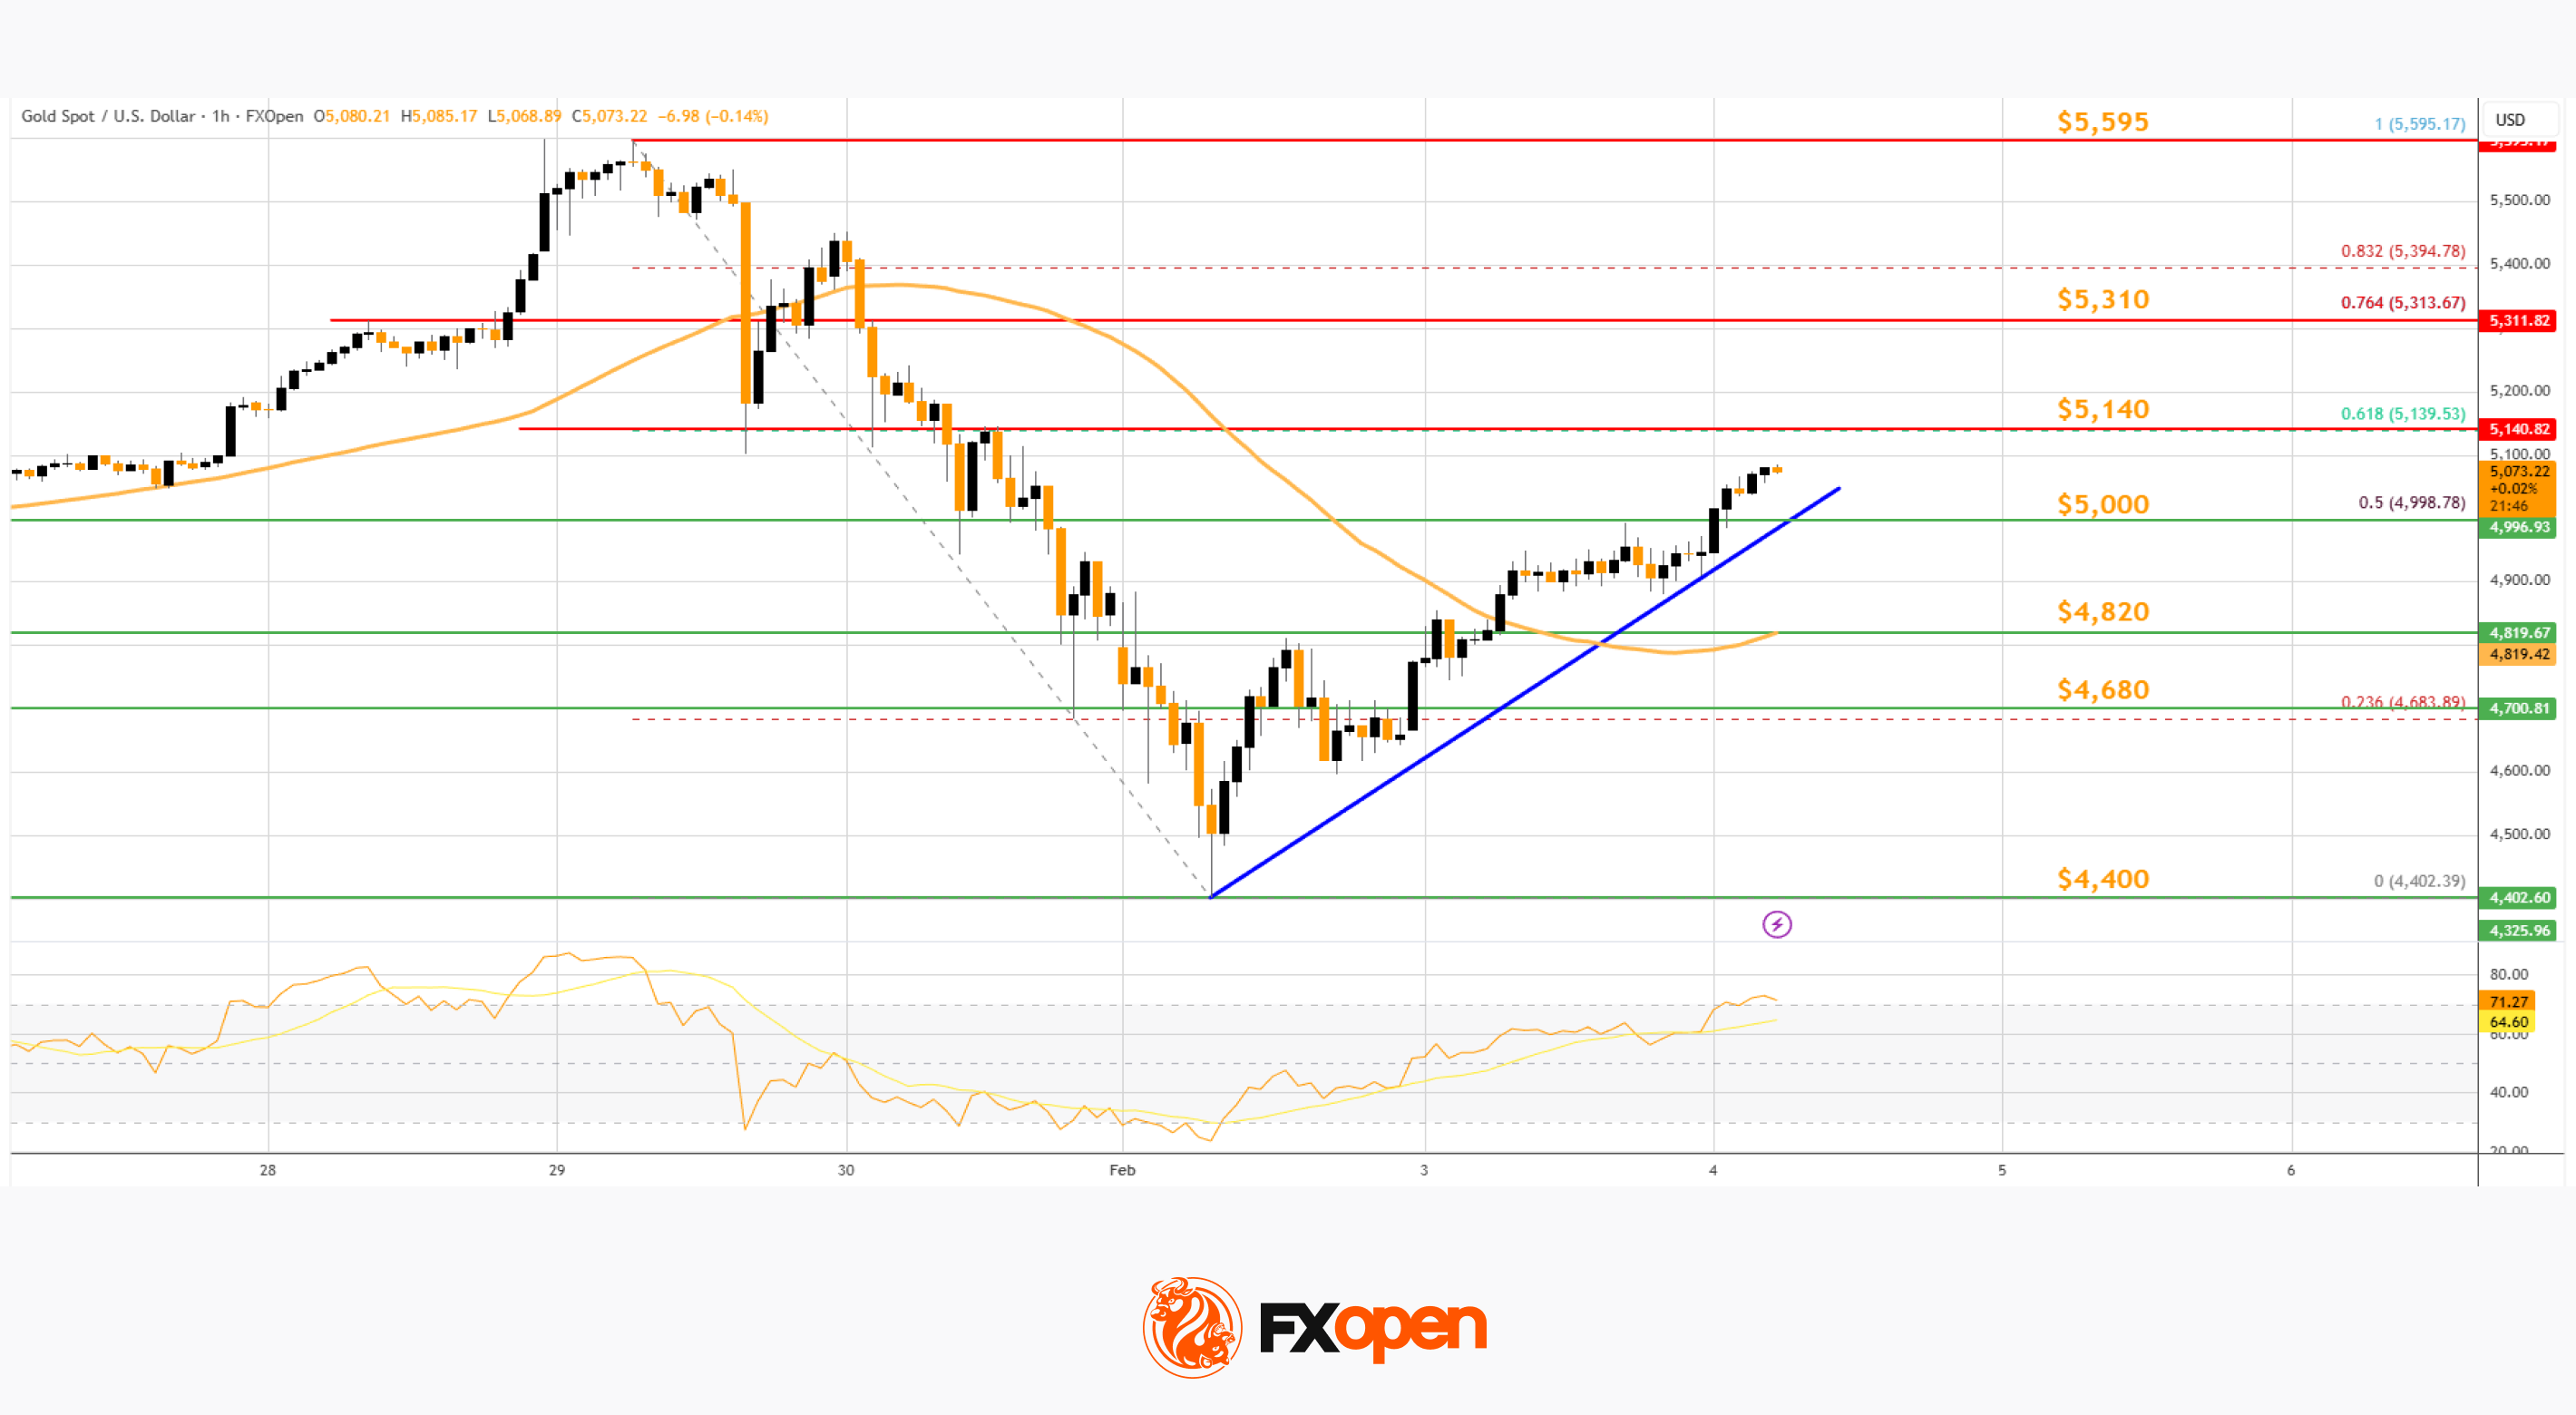
An immediate hurdle is near the 61.8% Fib retracement at $5,140. The first key area of interest might be $5,310. An upside break above $5,310 resistance could send Gold toward $5,500. Any more gains may perhaps set the pace for an increase toward the $5,595 high.
An initial bid zone on the downside is near a connecting bullish trend line at $5,000. If there is a downside break below $5,000, the price might decline further.
In the stated case, the price might drop toward $4,820. The next key zone for the bulls might be $4,680. Any more losses might send the price toward $4,400.
WTI Crude Oil Price Technical Analysis
On the hourly chart of WTI Crude Oil at FXOpen, the price started a fresh upward move from $60.85 against the US Dollar. The price gained bullish momentum after it broke $62.00.
The bulls pushed the price above the 50% Fib retracement level of the downward move from the $65.83 swing high to the $60.84 low. The price even climbed above the 50-hour simple moving average. The price is now facing hurdles near the 61.8% Fib retracement level at $63.90.
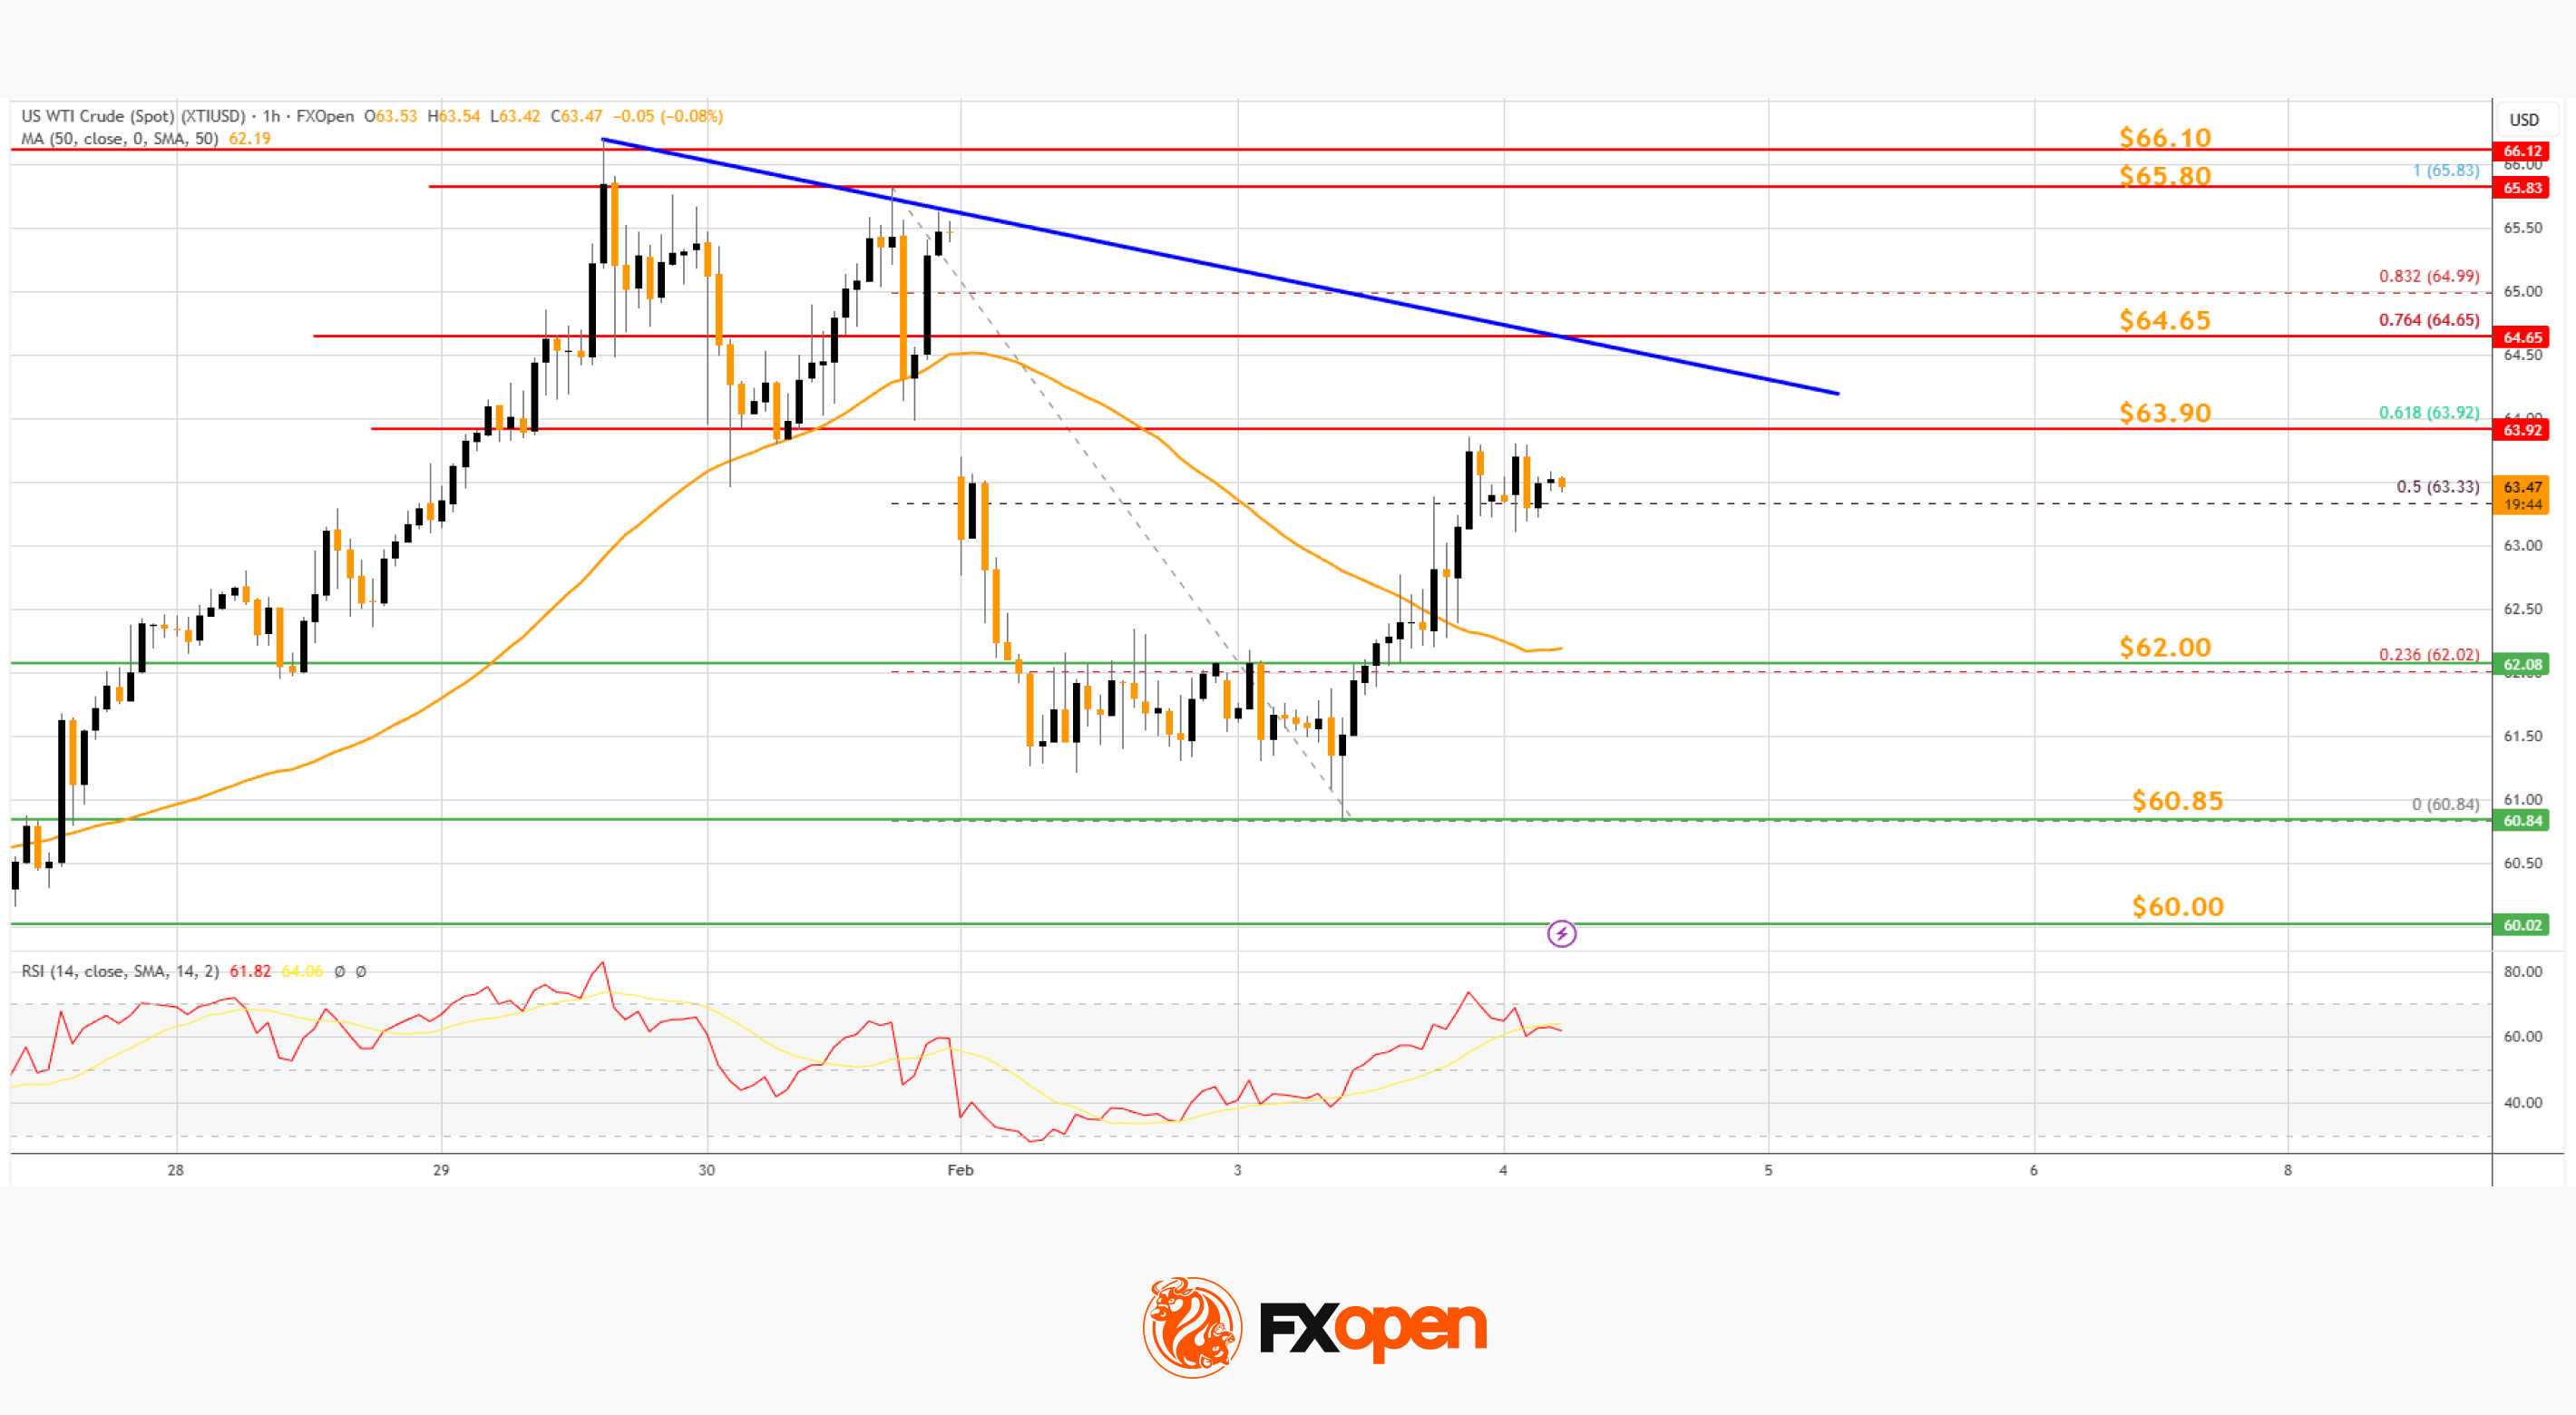
The RSI is now near the 60 level, and the price could aim for more gains. If the price climbs higher again, it could face resistance near a key bearish trend line at $64.65.
The next major hurdle for the bulls sits at $65.80. Any more gains might send the price toward the $66.10 zone or even $67.20. Conversely, the price might correct gains and test $62.00.
The next major breakdown zone on the WTI crude oil chart is $60.85, below which the price could test $60.00. If there is a downside move below $60.00, the price might decline toward $58.50. Any more losses may perhaps open the doors for a move to $55.00.
Start trading commodity CFDs with tight spreads (additional fees may apply). Open your trading account now or learn more about trading commodity CFDs with FXOpen.
This article represents the opinion of the Companies operating under the FXOpen brand only. It is not to be construed as an offer, solicitation, or recommendation with respect to products and services provided by the Companies operating under the FXOpen brand, nor is it to be considered financial advice.
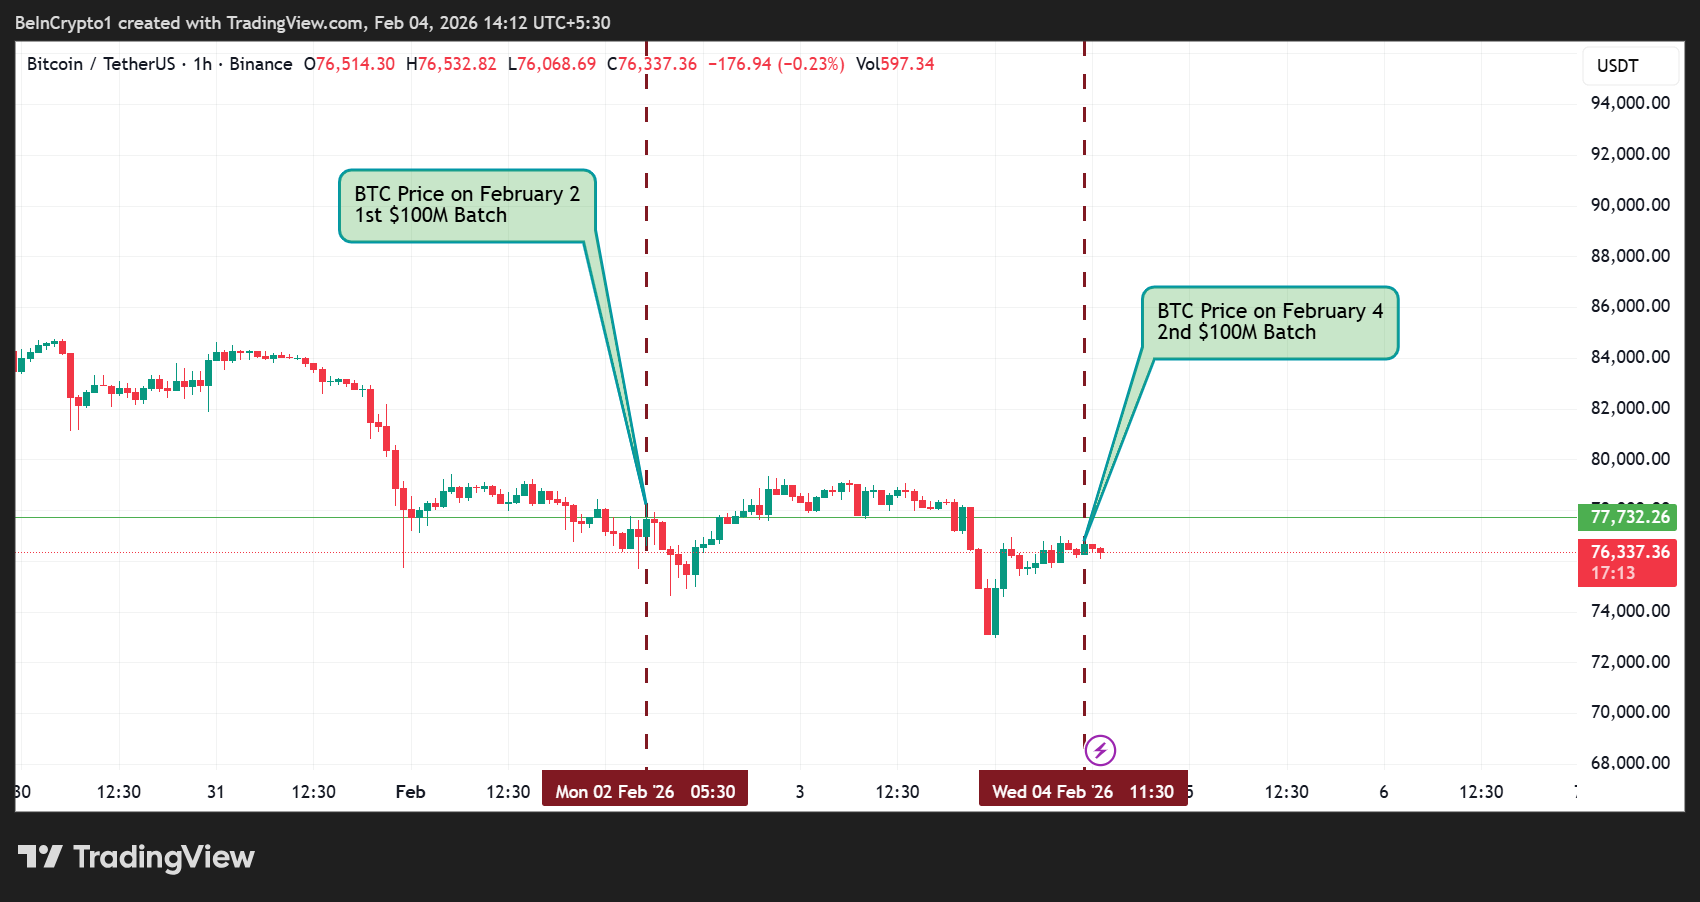
Binance has completed two $100 million batches of stablecoin-to-Bitcoin conversions from its Secure Asset Fund for Users (SAFU), totaling $200 million or 20% of its $1 billion target.
The conversions are part of a 30-day plan announced on January 30, 2026, which aims to shift the SAFU Fund’s reserves from stablecoins into Bitcoin while maintaining a protective floor for user funds.
Sponsored
Sponsored
Binance SAFU Fund Conversions: $200 Million In, Bitcoin Price Shows Little Reaction
The first batch, announced and executed on February 2, involved 1,350 BTC, valued at about $100.7 million at the time, with Bitcoin trading near $77,000.
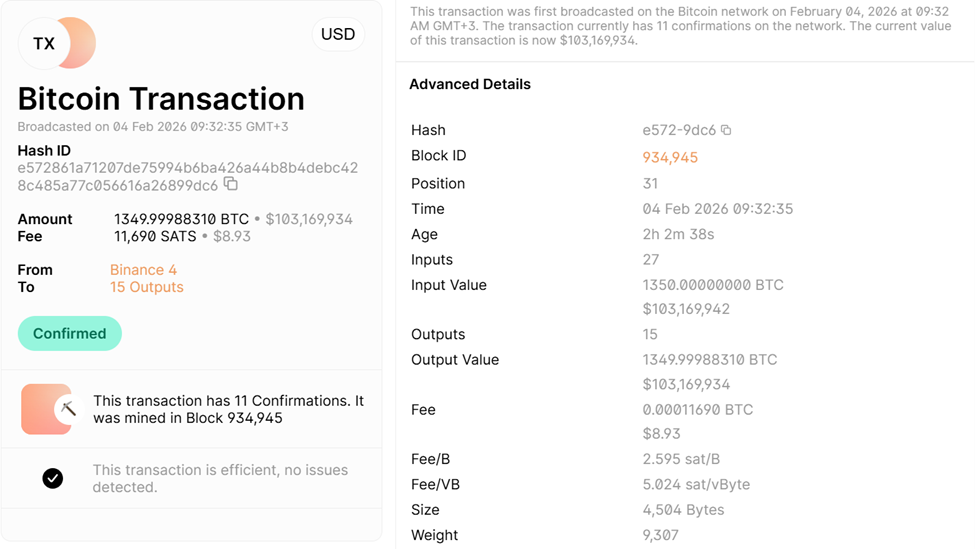
The second batch, announced today, February 4, converted another $100 million in stablecoins to approximately 1,349.9 BTC.
These conversions were sent to the SAFU Fund’s publicly disclosed Bitcoin address: 1BAuq7Vho2CEkVkUxbfU26LhwQjbCmWQkD.
Despite the $200 million inflows, Bitcoin has remained largely flat, hovering around $76,300–$76,700 as of February 4.

So, what explains the muted reaction?
Sponsored
Sponsored
The acquisition pace averages roughly $33 million per day if the plan stays on track. It represents gradual accumulation rather than a market-shaking purchase.
Additionally, on-chain data suggests that much of the conversion is internal reclassification. They move existing Binance BTC holdings into the SAFU wallet.
This is not equivalent to aggressive open-market buys, where Binance would purchase new BTC from the spot market, adding fresh demand and potentially driving up prices immediately.
This provides long-term conviction in holding but limited immediate buying pressure in spot markets.
Broader market forces also play a role. Post-2025 corrections, liquidation cascades, and ongoing macro volatility have kept downward pressure dominant. This likely offsets any “buy-the-dip” effect from the SAFU conversions.
Sponsored
Sponsored
Binance’s SAFU moves, while structurally supportive, are defensive rather than a literal quantitative easing (QE)- style intervention.
The fund includes a floor mechanism: if volatility pushes the SAFU value below $800 million, Binance will top it up to $1 billion, mimicking a price-support strategy.
Long-term, the structured accumulation signals strong institutional confidence in Bitcoin. By converting a traditionally stable, low-risk reserve into BTC, Binance positions itself as a quasi-“crypto central bank,” quietly stacking reserves while signaling commitment to Bitcoin as a reserve asset.
Community sentiment on X (Twitter) frames the moves as “central bank-like support” or “structural demand,” highlighting potential upside if more batches are executed and volatility stabilizes.
Sponsored
Sponsored
With 80% of the SAFU Fund still to convert ($800 million), the gradual, predictable inflows could establish a solid support floor, providing downside protection while sustaining steady demand for Bitcoin over the coming weeks.
For now, the market reaction is subdued, but the strategy’s structural bullishness remains clear, coming only days after Binance’s community woes.
While short-term price effects have been minimal, the ongoing strategy reflects a calculated long-term approach to Bitcoin exposure.
“Binance moving $100M of stablecoins into Bitcoin for SAFU shows serious commitment to crypto holdings, but is this long-term confidence—or just opportunistic accumulation during market dips?” one user highlighted.

Join Our Telegram channel to stay up to date on breaking news coverage
The U.S. Commodity Futures Trading Commission (CFTC) has launched a new program called Future-Proof to modernize its rules for crypto assets and prediction markets.
CFTC Chair Mike Selig said the agency’s current regulations were originally written for agricultural futures and are no longer suitable for today’s fast-growing crypto and financial technology markets. Selig explained that prediction markets and digital assets have expanded quickly, but clear regulations have not kept up. Crypto is now a multi-trillion-dollar global industry, and the CFTC believes updated, transparent rules are needed to protect investors while allowing innovation to grow.
Today, I am launching the “Future-Proof” initiative at the @CFTC.
We are at a pivotal moment in the evolution of American financial markets. The CFTC must be equipped to serve the markets of the future.
Read my full op-ed in today’s @washingtonpost: https://t.co/zWAAjXt4Kg. /1
— Mike Selig (@ChairmanSelig) January 20, 2026
To guide this process, the agency will rely on its Innovation Advisory Committee, which will make policy recommendations on crypto, prediction markets, and other emerging asset classes. Selig also criticized the CFTC’s past approach of relying mainly on enforcement actions. Under the Future-Proof initiative, the agency wants to shift toward a balanced regulatory strategy that protects markets without slowing innovation.
CFTC Pushes for Clearer Crypto Rules
Selig has also emphasized that rules should be clear, flexible, and designed for modern financial systems. The program also recognizes the growing role of artificial intelligence and blockchain in finance. These technologies now allow for 24/7 trading. For example, the New York Stock Exchange has announced plans to use blockchain for its tokenization platform, enabling round-the-clock trading of stocks and ETFs.
Looking ahead, Selig said the CFTC must prepare for broader responsibilities as the crypto market continues to expand. Under the proposed CLARITY Act, the CFTC and the SEC would share more oversight of the industry. Selig believes the CFTC is well-positioned to regulate blockchain-based assets.
This announcement follows years of tension between U.S. regulators and cryptocurrency companies. Industry leaders, including Coinbase CEO Brian Armstrong, have argued that unclear rules in the U.S. have slowed innovation and forced some firms to move abroad. Selig said the CFTC will move away from “regulation by enforcement” and instead introduce purpose-specific rules through public consultation.
Related News:
Best Wallet – Diversify Your Crypto Portfolio

- Easy to Use, Feature-Driven Crypto Wallet
- Get Early Access to Upcoming Token ICOs
- Multi-Chain, Multi-Wallet, Non-Custodial
- Now On App Store, Google Play
- Stake To Earn Native Token $BEST
- 250,000+ Monthly Active Users
Join Our Telegram channel to stay up to date on breaking news coverage

Next Man United Manager odds slashed on Michael Carrick to lead team next season

Onkyo TX-RZ30 9.2-Channel A/V Receiver Review: Sound Matters

Delays on M60 near Prestwich after six-car pile-up


-

 Crypto World5 days ago
Smart energy pays enters the US market, targeting scalable financial infrastructure
-
 Crypto World6 days ago
Software stocks enter bear market on AI disruption fear with ServiceNow plunging 10%
-

 Politics5 days ago
Why is the NHS registering babies as ‘theybies’?
-
 Crypto World5 days ago
Adam Back says Liquid BTC is collateralized after dashboard problem
-

 Video1 day ago
When Money Enters #motivation #mindset #selfimprovement
-

 Tech2 hours ago
Wikipedia volunteers spent years cataloging AI tells. Now there’s a plugin to avoid them.
-

 NewsBeat5 days ago
Donald Trump Criticises Keir Starmer Over China Discussions
-

 Politics2 days ago
Sky News Presenter Criticises Lord Mandelson As Greedy And Duplicitous
-
 Crypto World4 days ago
U.S. government enters partial shutdown, here’s how it impacts bitcoin and ether
-

 Sports4 days ago
Sinner battles Australian Open heat to enter last 16, injured Osaka pulls out
-

 Fashion5 days ago
Weekend Open Thread – Corporette.com
-
 Crypto World4 days ago
Bitcoin Drops Below $80K, But New Buyers are Entering the Market
-
 Crypto World2 days ago
Market Analysis: GBP/USD Retreats From Highs As EUR/GBP Enters Holding Pattern
-

 Crypto World5 days ago
KuCoin CEO on MiCA, Europe entering new era of compliance
-
Business5 days ago
Entergy declares quarterly dividend of $0.64 per share
-

 Sports2 days ago
Shannon Birchard enters Canadian curling history with sixth Scotties title
-

 NewsBeat1 day ago
US-brokered Russia-Ukraine talks are resuming this week
-

 NewsBeat2 days ago
GAME to close all standalone stores in the UK after it enters administration
-

 Crypto World12 hours ago
Russia’s Largest Bitcoin Miner BitRiver Enters Bankruptcy Proceedings: Report
-

 Crypto World5 days ago
Why AI Agents Will Replace DeFi Dashboards