
Crypto World
Globalstar (GSAT) Delivers Impressive Q4 Revenue Growth Amid Operational Losses

Key Highlights
-
Globalstar achieves $71.96M in quarterly revenue, exceeding analyst projections even with reported losses.
-
Shares jump 4% as the company outlines ambitious growth plans through 2026.
-
Fourth-quarter results demonstrate robust performance in satellite communications and IoT sectors.
-
Revenue expansion continues despite per-share losses, indicating sustainable growth trajectory.
-
Wall Street analysts maintain bullish stance with $66.50 average price target for GSAT.
Globalstar, Inc. (GSAT) delivered noteworthy fourth-quarter performance metrics, recording a loss of $0.07 per share while simultaneously demonstrating remarkable revenue expansion. The satellite communications firm witnessed its share price surge 4.00% to reach $60.19 in midday market activity. Although the quarterly losses exceeded analyst forecasts, the company’s robust revenue trajectory suggests a promising outlook for its operational future.
Revenue Performance Exceeds Market Predictions
The satellite operator delivered quarterly revenue totaling $71.96 million, beating the Zacks Consensus Estimate by 0.23%. This represents substantial progress compared to the prior year’s figure of $61.18 million achieved by the company. While per-share losses were recorded, the firm’s capacity to generate above-forecast revenue demonstrates its sustained competitive advantage within the satellite communications marketplace. These results emerge as the organization continues enhancing its service revenue streams and Internet of Things functionalities.
Service revenue experienced a 17% year-over-year increase, primarily driven by enhanced wholesale capacity offerings and performance-based incentives. Furthermore, the introduction of advanced two-way satellite IoT technologies and the deployment of the RM200M module have significantly broadened Globalstar’s commercial footprint. This service revenue expansion corresponds with the company’s strategic initiatives to scale operations through cutting-edge satellite infrastructure and diversified IoT applications.
Strong Forward-Looking Growth Trajectory
Management forecasts 2026 revenue ranging from $280 million to $305 million, accompanied by an adjusted EBITDA margin hovering around 50%. The company’s sustained emphasis on broadening satellite IoT capabilities, combined with strategic partnerships across government and defense industries, establishes a foundation for substantial expansion. Globalstar intends to fortify its competitive standing while scaling operations with advanced-generation satellite infrastructure.
The organization’s forward guidance remains encouraging, bolstered by its diversifying portfolio of service solutions. Market success will largely depend on maintaining momentum within the satellite communications arena, especially through continued government and defense sector partnerships. Wall Street maintains an optimistic perspective, with consensus 12-month projections reaching $66.50, implying approximately 15% appreciation potential from current trading levels.
Wall Street Perspective and Growth Potential
The company’s latest financial disclosure has not diminished analyst confidence in the equity. Average analyst sentiment remains at “buy” level, with consensus price objectives set at $66.50. This bullish perspective persists despite current losses and competitive headwinds within the intensely contested satellite communications sector.
Globalstar’s 2026 success will depend on maintaining expansion momentum while navigating industry challenges. Moving forward, strategic priorities include scaling IoT capabilities and delivering consistent operational excellence across government and defense verticals. Through these initiatives, Globalstar appears well-positioned to strengthen its satellite communications market presence and sustain its upward growth path.


Russia’s lower house of parliament received a draft law aimed at tightening criminal accountability for crypto services operating without regulatory approval. The legislation would attach criminal liability to entities that organize digital currency circulation without a Bank of Russia license, signaling a tougher stance as Moscow moves to regulate the sector ahead of broader digital-asset rules.
Under the draft, individuals who provide crypto-related services without registration with the central bank could face fines of up to 4,000 USD and up to four years in prison. More severe penalties would apply to organized groups or cases involving large-scale damage or illicit gains. The bill envisions compulsory labor for up to five years or imprisonment for as long as seven years when the act is committed by an organized group or causes significant harm. A separate provision would allow fines of up to 1 million rubles (approximately 13,100 USD) or profit-linked penalties for up to five years, depending on the circumstances.
Key takeaways
- The draft law would criminalize unregistered crypto-asset services, expanding the regulatory net beyond existing licensing regimes.
- Penalties scale with the nature of the violation—from individuals facing modest fines and potential prison time to harsher outcomes for organized groups or large-scale wrongdoing.
- The move aligns with Russia’s broader push to regulate digital currencies, but comes while a broader “Digital Currency and Digital Rights” framework is still being formalized and set to take effect in July.
- Russia’s Supreme Court has questioned the necessity of criminal penalties in the absence of the accompanying digital-currency law, calling the measure premature.
- In parallel, Russia faces high-profile crypto-security incidents, such as the Grinex exchange hack, underscoring the real-world risks for traders and exchanges as oversight tightens.
- Earlier in March, a package of crypto regulation proposals included penalties for illegal miners, indicating a multi-pronged regulatory approach that could shape market dynamics going forward.
Regulatory tightening and the licensing regime
The core of the draft law is a licensing regime led by the Bank of Russia. By tying criminal liability to activities that “carry out the organization of digital currency circulation” without a license, lawmakers appear to be moving beyond civil or administrative remedies and into criminal enforcement. The intent, as described in the draft, is to deter unregistered providers and bring a centralized oversight mechanism to what Moscow views as a growing sector with potential for misuse.
Specifically, individuals operating without registration could be fined as much as 4,000 USD and face up to four years in prison. If the operation involves an organized group or yields particularly large profits or damages, penalties would intensify to compulsory labor for up to five years or imprisonment for up to seven years. In addition, the bill contemplates fines up to 1 million rubles or an income-based penalty for up to five years, depending on the case’s particulars.
The legislation is part of a broader trend in Russia toward formalizing oversight of crypto activities, including licensing requirements and centralized supervision. It follows a March package that proposed criminal penalties for illegal crypto mining, signaling a comprehensive framework that would address both exchange activity and mining under a unified regulatory lens.
Judicial cautions and timing concerns
Even as lawmakers push for stricter enforcement, Russia’s Supreme Court has voiced concerns about the bill’s approach. In recent remarks reported by RBC, the court suggested that criminal penalties lack a “reasoned justification” and argued that the measure could be premature before the full regulatory architecture is in place. The court noted the forthcoming Digital Currency and Digital Rights law, expected to take effect in July, would set the groundwork for how digital assets are treated in Russia and how enforcement should be structured.
Observers note the tension between urgency on the legislative side and the Court’s call for measured steps that align with a coherent regulatory framework. If the Digital Currency and Digital Rights law does pass and comes into force on schedule, it could provide the statutory basis for the more punitive powers envisaged in the draft law. Until then, advocates of a cautious, rules-based approach argue that criminal penalties should wait for a clearer legal foundation and for the details of licensing, supervision, and consumer protections to be finalized.
As Russia moves toward more formalized oversight, the debate underscores a key question for the market: what level of risk will participants bear while the regulatory framework remains in flux? For crypto services, the path to compliance may require not only licensing but a broader readiness to meet centralized data-sharing, capital-adequacy, and anti-money-laundering standards that critics say could raise barriers to entry and reshape the competitive landscape.
Grinex hack as a reminder of operational risk
Against the backdrop of regulatory maneuvering, Russia-based exchange Grinex has been dealing with a high-profile security incident. The platform halted trading after reporting losses exceeding 1 billion rubles (roughly 13.7 million USD) in a hack it suspects involved “hostile state” entities. Grinex has since alerted law enforcement and filed a criminal complaint as it works to resolve the incident and safeguard user funds.
The Grinex event highlights the real-world risks that exchanges and users face even as regulators step up scrutiny. Security incidents can complicate compliance efforts by drawing attention from authorities and potentially increasing the appetite for stringent enforcement. The parallel tracks of tightening regulation and cybersecurity stress-testing may influence how quickly market participants seek licensing, improve risk controls, and pursue clearer governance structures.
In the same vein, Russian media coverage and industry reporting have connected these regulatory developments to broader shifts in the country’s crypto landscape. The ongoing discourse reflects a market watching closely for a coherent rulebook that balances innovation with investor protection and national-security considerations.
What to watch next
The most immediate milestones are July’s implementation of the Digital Currency and Digital Rights framework and the legal clarifications that will follow. If the new law enshrines the central-bank licensing regime and criminal penalties for unregistered services, market participants could see a rapid shift toward greater formalization, with more entities seeking compliance measures and registration to avoid potential penalties.
Market observers will also be watching for further clarifications on enforcement practices, including how authorities interpret “organization of digital currency circulation” and what constitutes the threshold for “large-scale” offenses. As the Grinex case unfolds, regulators may use real-world incidents to calibrate enforcement intensity and to demonstrate the practical costs of cyber breaches within a tightly regulated environment.
For investors and builders in Russia’s crypto ecosystem, the current phase signals both caution and opportunity. While the tightening stance could raise compliance costs and limit gray-market activity, it may also foster a more stable regulatory climate that could eventually attract legitimate businesses and institutional participation. The coming weeks will be telling as lawmakers lay out the legislative language and courts weigh the appropriate balance between enforcement and innovation.


Bitcoin price prediction turned aggressively bullish early Friday as CoinDesk reported that perpetual funding rates dropped to their most negative level since 2023 on a seven-day moving average, with ZeroStack CEO Daniel Reis-Faria targeting $125,000 within 30 to 60 days if the market’s heavily short positioning is forced to unwind.
Summary
- BTC was trading near $74,700 in Asian morning hours Friday, up 3.5% on the week but down 0.4% on the day, with the 10-day global equity rally pausing ahead of the April 22 Iran ceasefire expiry.
- The 7-day moving average funding rate dropped to approximately -0.005% per Glassnode data, last seen during the FTX crash bottom in late 2022, with every prior historical episode of similar funding extremes — March 2020, mid-2021, August 2024 — aligning with local price lows.
- On-chain data shows many active bitcoin holders are currently underwater relative to their cost basis, meaning a squeeze-driven rally could face material sell pressure from holders who acquired BTC in the $75,000 to $95,000 range during 2025.
Bitcoin (BTC) price prediction turned aggressively bullish early Friday as CoinDesk reported that perpetual funding rates dropped to their most negative level since 2023 on a seven-day moving average, with ZeroStack CEO Daniel Reis-Faria targeting $125,000 within 30 to 60 days if the market’s heavily short positioning is forced to unwind.
BTC was changing hands near $74,700 in early Asia trading Friday, up 3.5% on the week but down 0.4% on the day as a 10-day global equity rally paused ahead of next week’s Iran ceasefire deadline. The asset has climbed from the mid-$60,000s through March and April despite persistently negative funding, meaning shorts have been paying longs for weeks while price continued to grind higher.
Funding rates are periodic payments between long and short holders in perpetual futures contracts, designed to keep contract prices aligned with spot. When rates go negative, shorts pay longs — a condition that only develops when speculative positioning is tilted heavily against price. The 7-day moving average rate has dropped to approximately -0.005%, per Glassnode data, a reading last seen at the FTX crash bottom in late 2022.
“Funding rates this negative tell you the market is heavily short,” Reis-Faria said. “If Bitcoin continues to move higher despite that, a lot of those positions could get liquidated, and the move can accelerate quickly.” He targets $125,000 within 30 to 60 days if the short base unwinds, citing buy pressure from large corporate accumulators as the force most likely to trigger forced liquidations across the short base.
Every prior historical episode of similar funding extremes has aligned with a local price floor. March 2020, mid-2021, the FTX collapse in late 2022, the yen carry trade unwind in August 2024, and the Liberation Day selloff in April 2025 all featured deeply negative funding that resolved with sharp recoveries. For traders tracking the ceasefire hopes around the April 22 deadline as a timing catalyst, this historical pattern reinforces a bullish view on the near-term setup.
What Could Prevent a Squeeze Rally
On-chain data introduces a structural counterpoint. Many active bitcoin holders are currently underwater relative to their acquisition cost, meaning any squeeze-driven rally that approaches their cost basis could generate significant sell pressure from holders who bought in the $75,000 to $95,000 range during 2025’s peak accumulation period. This is sometimes called the “wall of worried holders” — participants who will not be forced to sell but will sell when they can.
A rally to $125,000 would require absorbing that supply sequentially, moving through each cost-basis cluster without capitulating. The oversold signals visible in on-chain and technical data support the bullish case structurally, but the distribution of underwater holders complicates a clean short-squeeze-to-new-high scenario without a strong macro catalyst doing the heavy lifting.
The Catalyst Calendar
Three events over the next two weeks will resolve the current setup. The April 22 Iran ceasefire expiry is the first: a credible extension removes the geopolitical tail risk that has capped risk-asset rallies since February, while a breakdown would likely push BTC toward the $68,000 structural support floor. The FOMC meets April 28-29, and any dovish signal from Chair Powell would reduce the opportunity cost of holding BTC. A confirmed CLARITY Act committee date in early May would add a third potential trigger specific to the digital asset market.


Russia’s government submitted a bill to its parliament’s lower house in an effort to amend the country’s legal code to attach criminal liability for crypto services offered without regulatory approval or licensing.
In a draft law sent to the State Duma on Friday, Russian lawmakers proposed that entities “carrying out activities related to the organization of digital currency circulation,” that operate without a license from Russia’s central bank, could be subject to criminal liability.
Without registration with the Bank of Russia, individuals could face up to $4,000 in fines and up to four years in prison, or more severe penalties if part of an organized group.
“The same act committed by an organized group, or involving the infliction of damage or the extraction of income on a particularly large scale, would be punishable by compulsory labor for up to five years or imprisonment for up to seven years,” the bill’s text said.
The bill also proposes a “fine of up to 1 million rubles [$13,100] or an amount equal to the convicted person’s salary or other income for a period of up to five years.”
The draft law followed a package of bills initially proposed in March that included criminal penalties for illegal crypto miners, but the most recent legislation included details on fines and potential prison time for any unregistered digital asset services.
According to Russian media outlet RBC, the country’s Supreme Court said that the crypto bill lacks “reasoned justification” for criminal penalties.
The court said that the measure was “premature” until Russia enacted its “Digital Currency and Digital Rights law,” expected to go into effect in July. If the bill passes it would give Russia’s government more control and oversight over the crypto industry.
Related: At least a dozen crypto entities attacked since Drift Protocol hack
Russian crypto exchange Grinex still reeling from $14 million hack
Grinex, a Russia-based crypto exchange currently being sanctioned, halted trading for users on Thursday after losing more than 1 billion rubles — about $13.7 million — in a hack it suspected was carried out by “entities of hostile states.”
The company said it forwarded relevant information on the attack to law enforcement agencies and filed a criminal complaint.
Morpheus Research’s report alleges that the $7.7B fintech is exaggerating its use of blockchain technology, while Figure and asset manager Van Eck dispute the findings.
Figure Technology Solutions found itself at the center of a public battle this week after short-seller Morpheus Research published a detailed report accusing the blockchain-focused HELOC lender of overstating its use of on-chain technology.
Morpheus, which disclosed it holds short positions in FIGR, called the Nasdaq-listed fintech “little more than a risky home equity lender masquerading as a blockchain innovator.” The firm alleged that Figure’s loan origination system does not rely on blockchain, citing the company’s own SEC filings, and argued that its suite of crypto-native products, including Figure Connect, Democratized Prime, YLDS, and the OPEN equity network, has either stalled or is propped up internally.
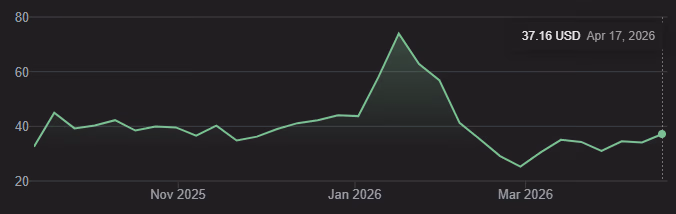
FIGR shares have been under pressure in recent weeks, falling from a January high of $78 to roughly $37 as of today. The company went public in September 2025 at $25 per share, raising $787.5 million.

Figure responded on X, calling the allegations a “misunderstanding of how blockchain is integrated into the Figure loan lifecycle.” The company acknowledged that certain legal steps, particularly for HELOCs, still require traditional documentation to comply with existing regulations. But it said that from the moment a loan is funded, it is represented on blockchain, and all subsequent ownership transfers and pledges are recorded and executed on-chain.
“Participants in our ecosystem are contractually required to transact on blockchain, making it the operational system of record for loan ownership and activity, while traditional documents serve primarily as legal formalities,” the company wrote.
Figure pushed back on claims of deteriorating loan performance, citing a weighted-average delinquency rate of 0.80% across roughly $4.6 billion of securitized assets. It also cited borrower fundamentals, including an average FICO score of approximately 754, average income of around $187,000, and a combined post-loan-to-value ratio of about 62%.
On the question of institutional demand, Figure said over $1.15 billion in whole loan sales were executed on its marketplace in March 2026 alone, and that a recent loan auction on its platform resulted in a record-low spread to the risk-free rate.
Matthew Sigel, head of digital assets research at Van Eck, offered a separate defense of the company. Sigel argued that the bear case relies on a “fundamental misunderstanding of how blockchain features actually work” and focuses on “process issues long solved.” He highlighted Figure’s Digital Asset Registry Technology, or DART, which he said replaces the legacy MERS paper registry with an active digital system that connects via APIs to institutional data aggregators and records liens on the Provenance Blockchain.
Sigel also noted that Figure’s deterministic underwriting model has compressed production costs to roughly $700 per loan, compared with an $11,000 average for legacy banks, and pointed to preliminary Q1 operating data showing marketplace volume of $2.9 billion, up 113% year over year.
Morpheus Research’s report also took aim at the Provenance Blockchain, which Figure describes as an independent Layer 1 network. Morpheus alleged that Figure, its affiliates, and co-founder Mike Cagney collectively control over 65% of the chain’s native HASH governance token, and that a small number of accounts could theoretically halt or alter the network. Figure countered that it holds approximately 25% of outstanding HASH tokens and that key decisions are made through a broader governance framework.
Cagney, who co-founded Figure in 2018, has sold roughly $64 million worth of stock since the IPO at an average price of $28.50, according to the Morpheus report. Figure said the sales occurred pursuant to standard pre-established trading plans or in connection with stock vesting and associated tax obligations.
This article was written with the assistance of AI workflows. All our stories are curated, edited and fact-checked by a human.
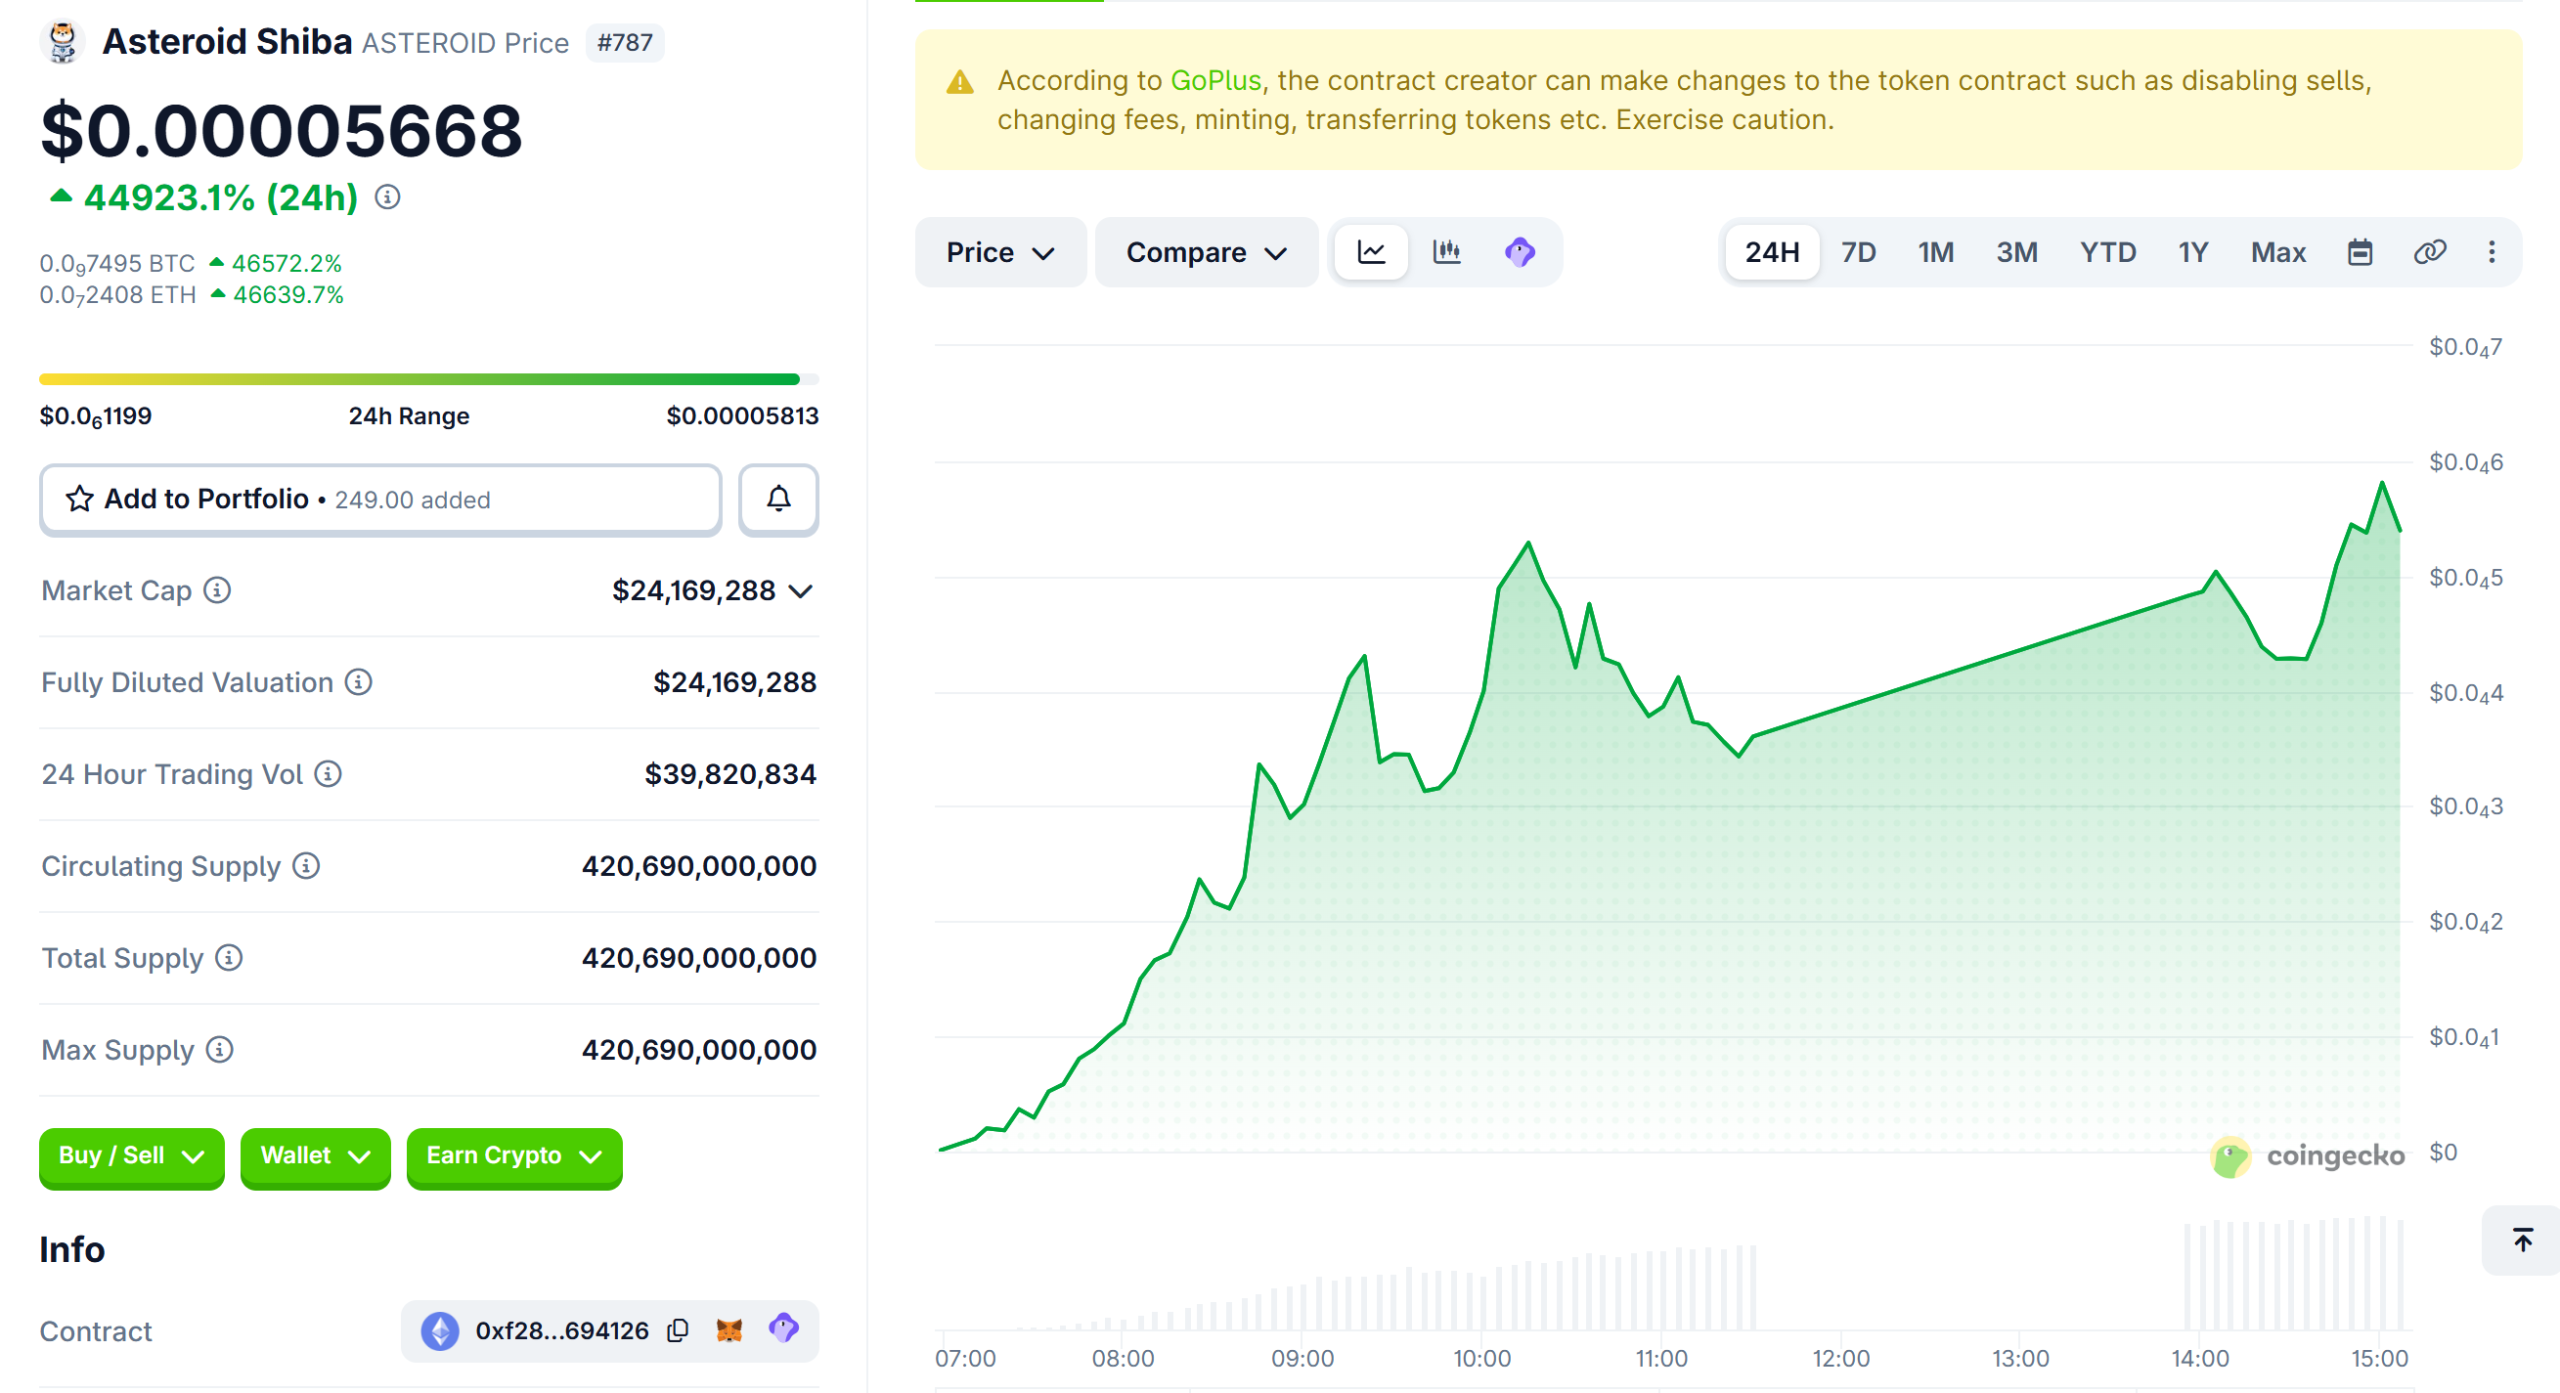
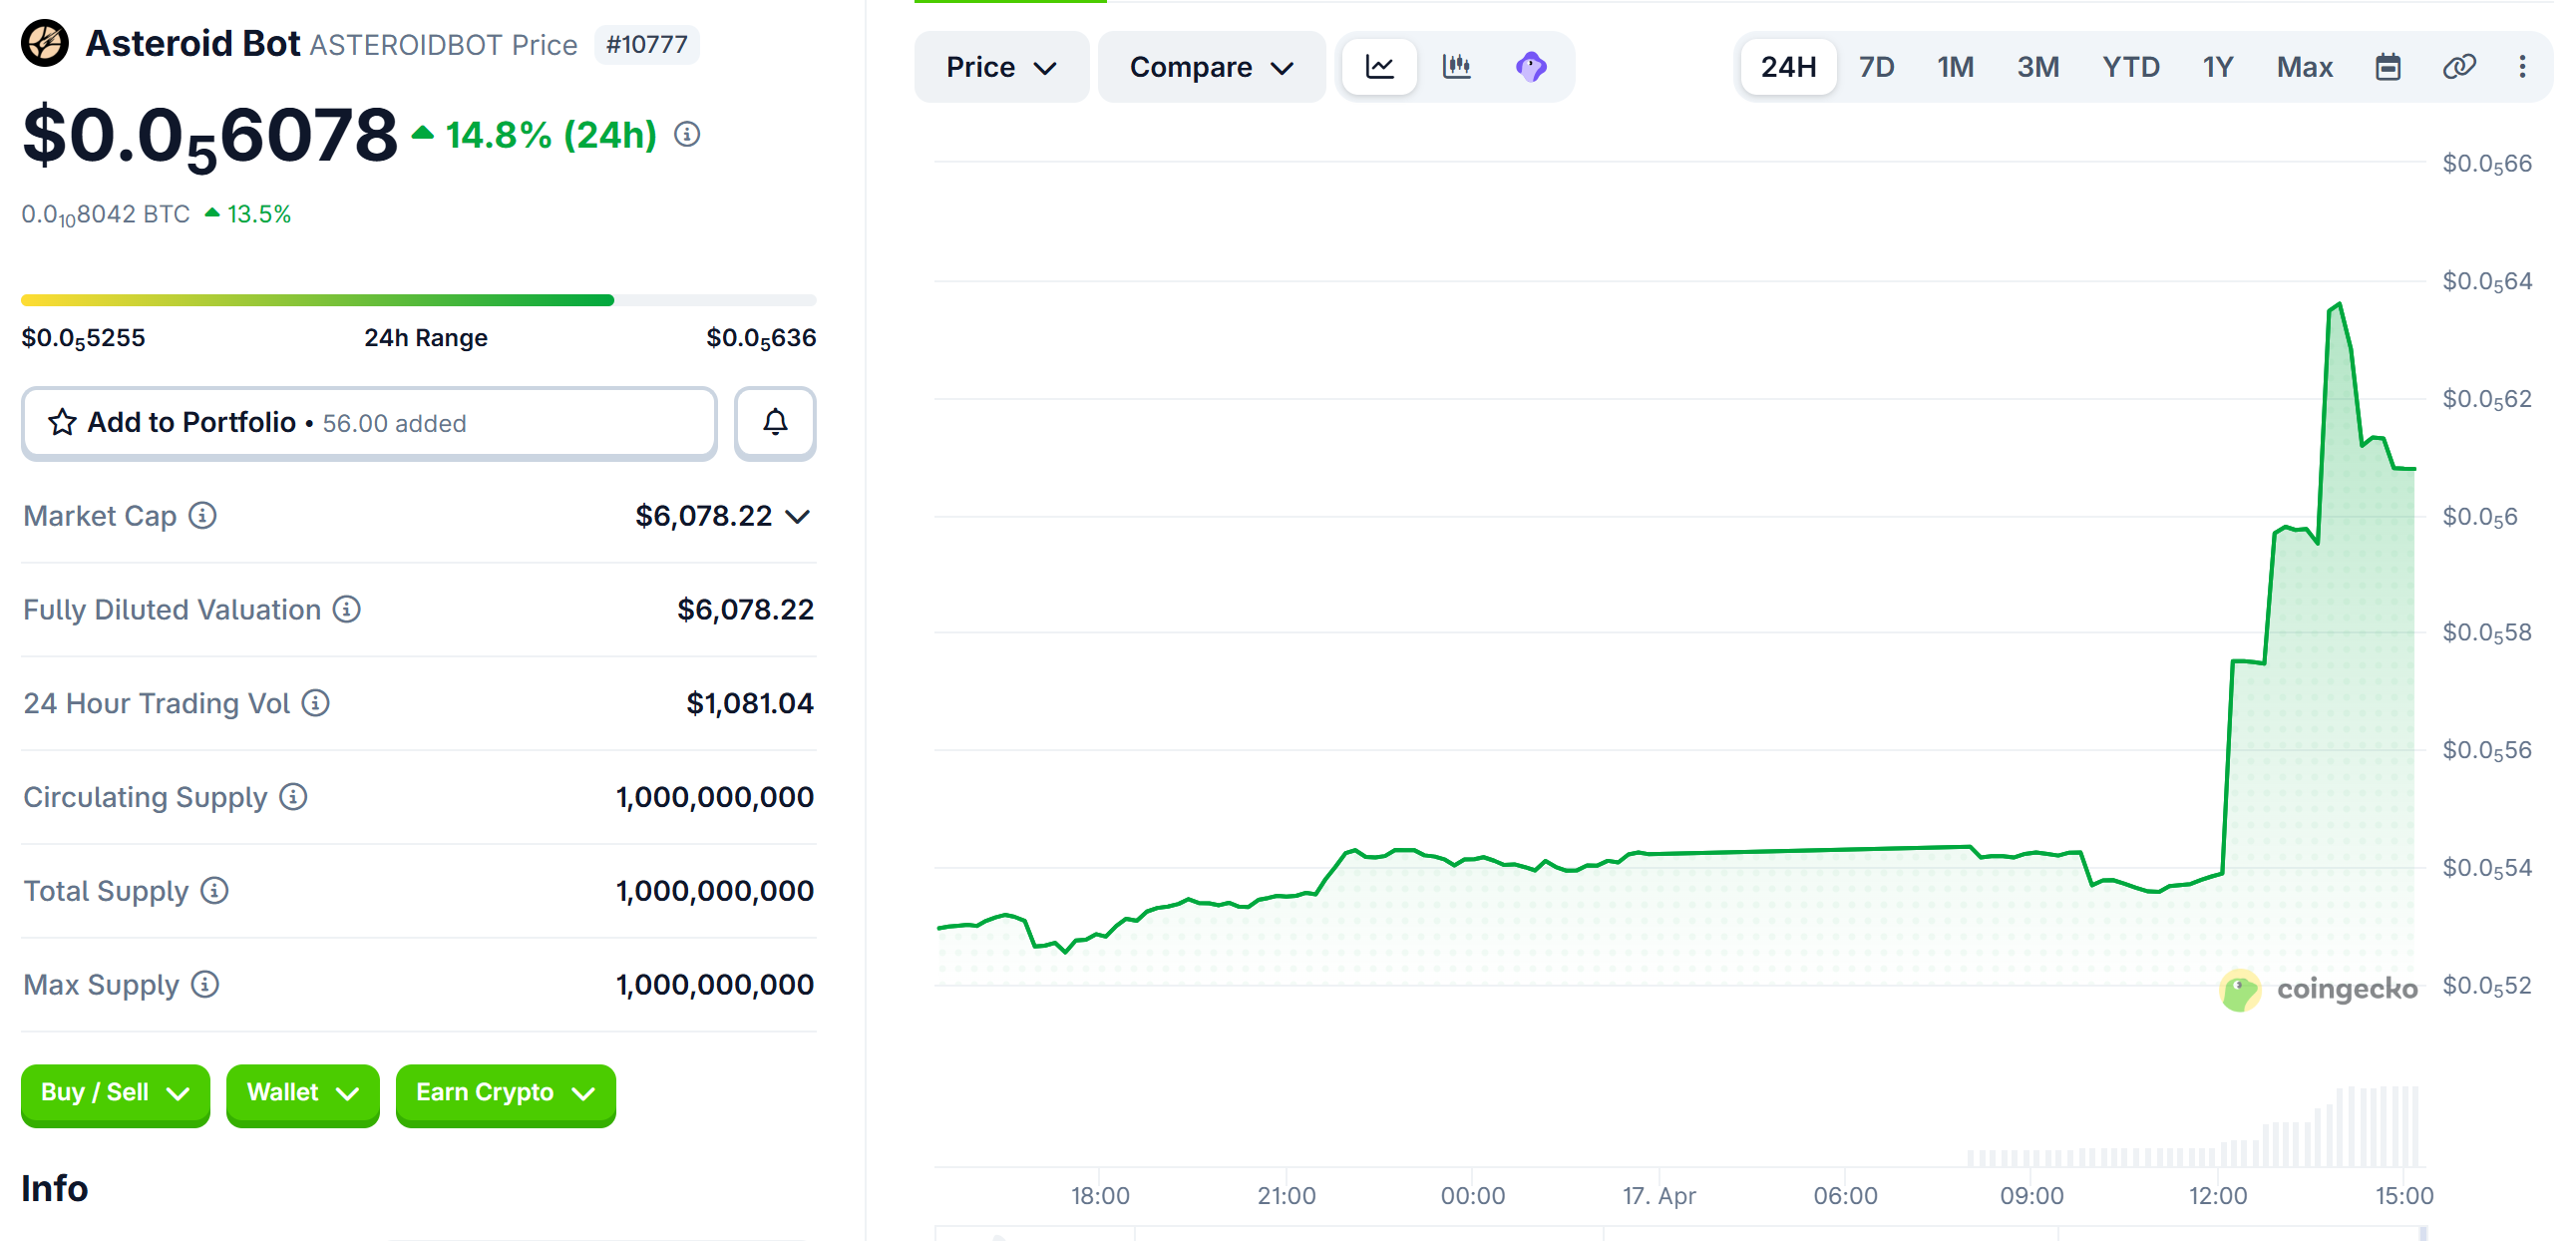
Asteroid Shiba (ASTEROID) gained over 45,000% in 24 hours while Asteroid Bot (ASTEROIDBOT) rallied 15% in the same timeframe. The rally followed Elon Musk’s response to a viral post linking the token to SpaceX’s Polaris Dawn mission.
The move started after radio host Glenn Beck shared Liv Perrotto’s story. The teenager designed a plush Shiba Inu named Asteroid.
Musk’s Reply Ignites Speculative Trading
The Asteroid flew as the zero-gravity indicator on SpaceX’s Polaris Dawn mission in 2024. Perrotto passed away from cancer, leaving behind a list of unanswered questions for Musk.
Among her questions was whether Asteroid could become SpaceX’s official mascot.
Musk responded with “Will answer shortly,” and speculative traders moved within minutes. One meme coin, ASTEROID, rallied by 44,923% while another, and was trading for $0.00005668 as of this writing.

Elsewhere, blockchain analytics firm Arkham identified several traders who profited from the move.
- One swapped 1 ETH into an ASTEROID token position now worth nearly $474,000 within three hours.
- Another early buyer generated $210,000 in profit while still holding $84,000 in the token.
- A dormant holder who spent $21,390 buying ASTEROID at launch in September 2024 has not moved tokens for three months. That position is now worth roughly $370,000.
Sell-Off Risk Grows
The concentration of gains among a small number of wallets raises the prospect of a sharp correction. If early holders begin taking profit, the thin liquidity typical of low-cap meme tokens could amplify any downturn.
Meanwhile, Asteroid Bot (ASTEROIDBOT), a separate token riding the same narrative, posted a more modest 15% gain
.Whether Musk’s eventual answer to Perrotto’s questions sustains or deflates the speculative interest remains the key variable for ASTEROID’s near-term direction.
The post Elon Musk Fuels ASTEROID Crypto Frenzy, Scores 500X Windfall For One Trader appeared first on BeInCrypto.
X’s Cashtags feature has driven an estimated $1 billion in global trading volume since its pilot launch on Tuesday, according to the platform’s Head of Product Nikita Bier.
The trading milestone arrived just 48 hours after the social media platform introduced Smart Cashtags for crypto and stock assets.
X Cashtags Turn Timeline Into a Trading Gateway
Bier revealed the volume figures on April 17, noting the data came from aggregated trading activity tied to the pilot.
The feature lets users tap cashtags such as $BTC, $ETH, $XRP, and $DOGE to view real-time price charts, sentiment data, and related posts without leaving the app.
A pilot integration with Canadian brokerage Wealthsimple also enables direct trading from the timeline.
However, the pilot remains limited in scope. Only iPhone users in the US and Canada have access, and the buy button is not yet active for US users. Android and web support have not yet rolled out.
DeFi analyst Tat Thang highlighted the scale of X’s early traction, noting that Robinhood needed years to reach comparable daily volumes.
“Robinhood’s first year: 500K users. “Thousands of trades per week.” X’s first 48 hours: $1 billion. $1B in estimated volume from a pilot that hasn’t even hit Android yet,” wrote Thang.
Indeed, Robinhood launched its app publicly in April 2015 after a long private beta (waitlist phase) starting in 2013–2014. By the end of 2015 (roughly its first full year), it had around 500,000 funded accounts or users.
X Money Launch Remains Uncertain
The Cashtags rollout comes as X prepares to launch its broader payments platform, X Money. Elon Musk stated in March that early public access would begin in April.
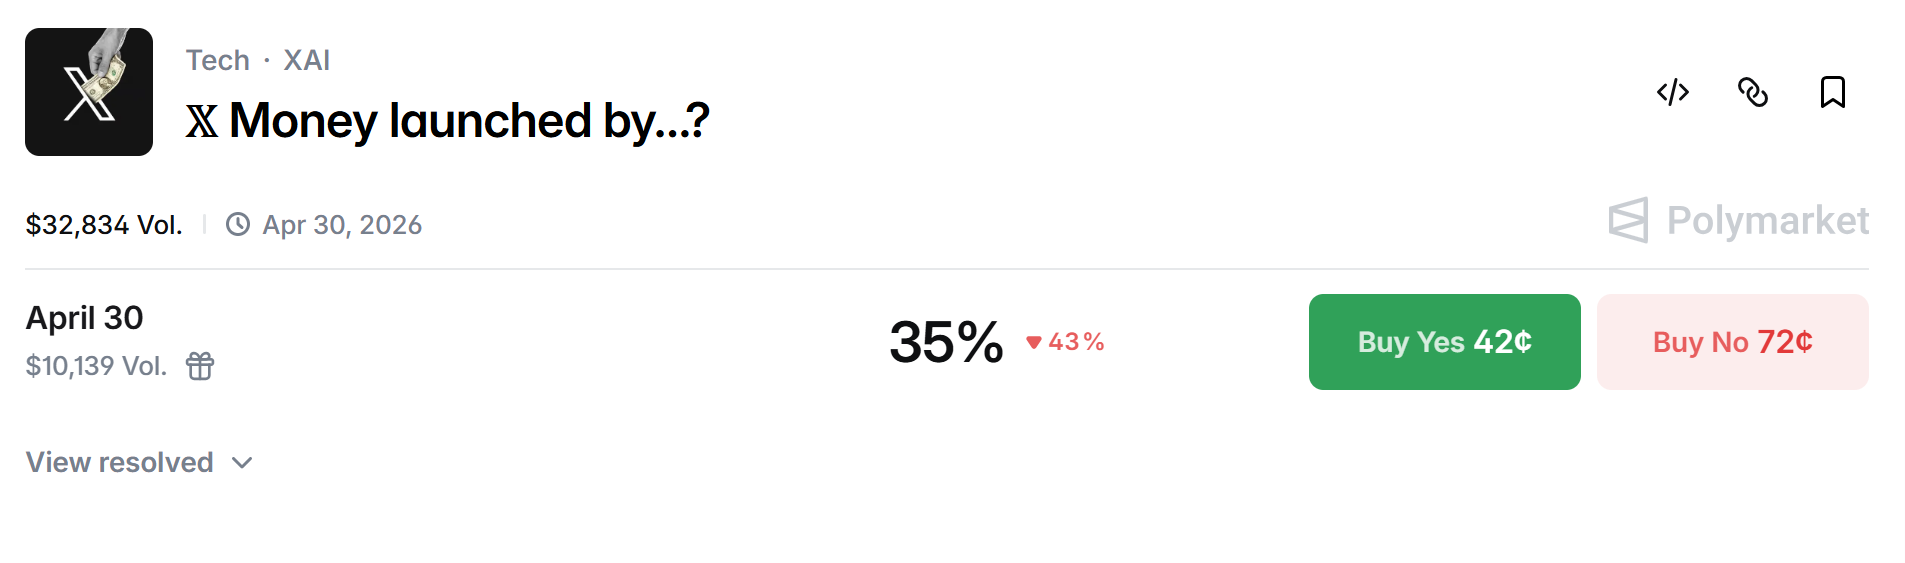
Polymarket data currently shows a 36% chance that X Money will launch by April 30, suggesting most traders remain skeptical.

Senator Elizabeth Warren has also raised concerns about the platform’s proposed 6% APY and potential stablecoin issuance, requesting Musk provide a written response by April 21.
The post X Cashtags Trigger Estimated $1 Billion Surge In Crypto Trading appeared first on BeInCrypto.
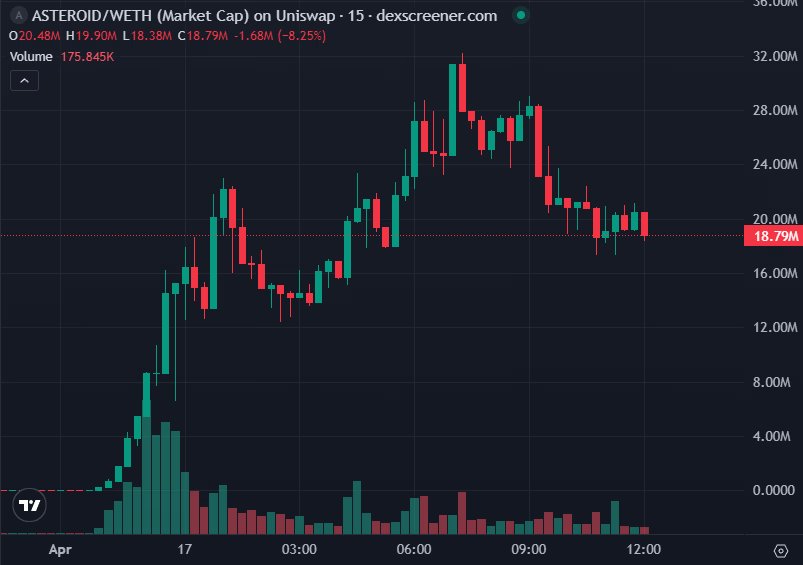
Narrative-driven tokens are catching bids again as the broader memecoin sector attempts to recover from a bruising 2025.
The memecoin trenches are showing signs of renewed life this week, led by an unlikely catalyst, a Shiba Inu plush toy that once floated in zero gravity aboard a SpaceX spacecraft.
ASTEROID, an Ethereum-based memecoin named after the toy that flew on SpaceX’s Polaris Dawn mission in September 2024, surged more than 70,000% in 24 hours to a $28 million market cap on Friday. Trading volume spiked above $43 million, according to DexScreener data, with some early holders recording six-figure gains.

The rally was sparked by a viral post from Glenn Beck on X highlighting the story of Liv Perrotto, the 15-year-old cancer patient who designed the Asteroid plush. Perrotto, who passed away from cancer, had dreamed of meeting Elon Musk and had written a list of questions for him, including whether he would make Asteroid SpaceX’s official mascot. Her mother, Rebecca Perrotto, shared the story through Beck’s platform.
Musk replied to the post with “Will answer shortly,” and that response was all the memecoin market needed. Buying pressure flooded both the Ethereum and Solana versions of the token.
On-chain analyst Lookonchain flagged a wallet that spent 12 ETH (about $31,000) on ASTEROID back in September 2024 and held it for more than 580 days at near-zero value. After Musk’s engagement, that position swelled to roughly $292,000 in unrealized gains.
Arkham highlighted another wallet that is sitting on more than $400,000 in unrealized profits after spending 1 ETH ($2,400) on the token shortly after Musk’s response.
UNC Catches a Bid
ASTEROID is not the only micro-cap drawing attention. On Solana, the UNC memecoin surged above $21 million on Thursday with $15.3 million in trading volume, the highest on the chain that day.
The token, built around Gen Z “cool uncle” internet culture, caught fire after a trader known as fibonacki purchased 37.45% of UNC’s supply when its market cap sat at just $6,000. That trader then airdropped 33.85% of the total supply to over 2,000 on-chain addresses, including several well-known figures.
Broader Memecoin Sector Stirs
The micro-cap action comes as the broader memecoin sector attempts to stabilize after a punishing 2025, during which total memecoin market capitalization fell from $93.1 billion to roughly $36.5 billion.
Data from CoinGecko shows the sector currently sits near $39 billion, up 10% over the past 24 hours.
All of the top-10 memecoins by market cap, including DOGE, SHIB, PEPE, TRUMP, BONK, Pudgy Penguins (PENGU), and FLOKI, are green on the week as activity has picked up alongside the broader risk-on rotation earlier this week.
This article was written with the assistance of AI workflows. All our stories are curated, edited and fact-checked by a human.
Crypto World
Strait of Hormuz Open During U.S.-Iran Ceasefire as Naval Blockade Holds Pending Final Deal

TLDR:
- Iran’s foreign minister confirmed the Strait of Hormuz is open to all commercial vessels during the ceasefire period.
- President Trump stated the U.S. naval blockade will remain active until a deal with Iran is fully and completely finalized.
- The Trump administration is weighing the unfreezing of $20 billion in Iranian assets as part of ongoing nuclear negotiations.
- A 10-day Lebanon ceasefire between Israel and Hezbollah is holding, easing a key sticking point in the broader Iran talks.
The Strait of Hormuz is currently open to all commercial shipping vessels following a ceasefire between the United States and Iran.
Iran’s foreign minister confirmed the vital trade route would remain accessible during the truce period. However, President Donald Trump stated that the U.S. naval blockade will stay active. A broader agreement must be fully completed before any military presence is withdrawn from the region.
Iran Commits to Keeping the Strait of Hormuz Open
Iran’s foreign minister officially announced that the Strait of Hormuz would be open to commercial vessels. The waterway handles a substantial portion of the world’s oil trade and remains critical to global markets. This announcement came alongside a ceasefire agreement reached between Tehran and Washington.
Despite the announcement, Iranian state media introduced some uncertainty around the commitment. Shipping companies are also expressing caution and have not fully resumed normal operations through the strait. Industry players are waiting for clearer guarantees before adjusting their routes or schedules.
President Trump publicly confirmed Iran’s pledge, stating that Tehran has committed not to close the waterway. However, he made clear that U.S. naval forces would not stand down just yet. Trump said the blockade would remain until a deal with Iran is “100% complete.”
The situation reflects a delicate balance between military posture and diplomatic progress. Both sides appear committed to keeping talks moving forward while maintaining their respective positions. Commercial shipping remains cautious but operational through the strait at this stage.
Nuclear Deal Talks and Broader Conflict Resolution Progress
Peace negotiations between the U.S. and Iran are actively ongoing, with Trump expressing confidence in a near-term resolution.
He told reporters a deal could be reached “in the next day or two.” Talks are also expected to continue through the weekend, according to the president.
One notable development involves a proposal to unfreeze approximately $20 billion in Iranian assets. This measure is being considered as part of broader incentives to bring Iran to a final agreement. Sources familiar with the discussions confirmed this option is currently on the table.
Trump also stated that the United States intends to acquire Iran’s enriched uranium stockpile as part of any deal. He said the U.S. “will acquire Iran’s enriched uranium” under the terms being negotiated. The exact conditions surrounding uranium transfers remain a point of active discussion.
Separately, a 10-day ceasefire in Lebanon appears to be holding steadily. The conflict between Israel and Hezbollah has been described as a “key sticking point” in the broader Iran negotiations. Stability in Lebanon could support momentum toward a wider regional agreement in the coming days.

In Solana news today, DoubleZero Foundation launched Edge, a public beta platform that delivers raw Solana block data through a private global fiber network using multicast, bypassing the public internet to cut average delivery times by 6 milliseconds — the same data distribution standard that traditional exchanges have used for decades.
Summary
- Edge launched with 379 validators publishing shreds, covering approximately 43% of Solana’s total stake, with Jito, Triton, Staking Facilities, and Harmonic participating as initial launch partners.
- Traders subscribe in USDC per device per epoch, with prices from $30 to $100 depending on city, while revenue splits 50% to network contributors, 32.5% to validators originating shreds, and 17.5% to protocol clients, with 10% going to a protocol burn mechanism.
- DoubleZero, co-founded by former Solana Foundation communications director Austin Federa, raised $28 million in March 2025 in a round co-led by Multicoin Capital and Dragonfly Capital.
In Solana news today, DoubleZero Foundation launched Edge, a public beta platform that delivers raw Solana block data through a private global fiber network using multicast, bypassing the public internet and cutting average data delivery times by 6 milliseconds compared to conventional routing. The service went live Thursday with 379 validators actively publishing shreds.
The data subscribers receive is raw — the same UDP packets emitted by the Solana leader before any third-party processing. Reconstruction, decoding, and strategy logic remain on the subscriber’s side. Access is permissionless; payment is in USDC per device per epoch, approximately every two days.
Solana’s block data currently travels over the public internet, introducing unpredictable latency, forcing trading firms to piece together combinations of APIs, RPC nodes, and CDN connections with varying performance ceilings. Edge replaces that path with multicast. A single stream is sent once and replicated at the network level, reaching all subscribers in one hop from the Solana leader with no relay tree and no positional advantages between participants.
The 6-millisecond gain is an average. During peak network activity — the conditions that matter most to high-frequency trading firms and market makers — the advantage from dedicated fiber compounds. Solana’s growing DEX volume has already placed five Solana-native protocols in the global top-10 by daily trading activity. Traders competing in that environment operate on execution margins where milliseconds translate directly to profitability.
DoubleZero co-founder Andrew McConnell stated the case plainly. “Traditional finance has spent decades building infrastructure where speed and deterministic performance are a real competitive advantage,” he said. “On-chain markets didn’t get that foundation, which left even sophisticated trading firms working on uneven ground.”
The Validator Revenue Model
Validators earn additional income by publishing shreds to Edge, creating a direct economic incentive for consistent, low-latency data publication that operates independently of block rewards and staking yields. Current subscription prices run from $30 to $100 per epoch depending on the city through May 2026. Revenue is distributed each epoch: 50% to network contributors who supply fiber links, 32.5% to validators originating shreds, and 17.5% to protocol clients. An additional 10% burns the protocol’s native token.
DoubleZero plans to expand Edge’s data coverage beyond Solana shreds to include centralized exchange feeds, prediction market data, and traditional exchange order-by-order data, positioning the platform as a unified data layer across on-chain and off-chain markets. That ambition sits directly within Solana’s broader upgrade narrative for 2026, which includes the Alpenglow consensus overhaul targeting 150ms finality and the Firedancer client targeting over one million transactions per second.
The Institutional Context
DoubleZero raised $28 million from Multicoin Capital and Dragonfly Capital in March 2025. The project is co-founded by Austin Federa, who previously served as head of strategy and communications at the Solana Foundation, giving it direct lineage to the network’s infrastructure development community. The launch of Edge beta marks the first time a dedicated market data distribution product has gone live on a major Layer-1 blockchain in a format that explicitly mirrors what Bloomberg and Reuters-style direct data feeds provide in traditional markets — a gap that institutional trading firms have cited as a structural disadvantage of on-chain venues since DeFi began competing for institutional flow.
Connecticut Senator Richard Blumenthal has intensified congressional oversight of Binance, asking the Justice Department and FinCEN for detailed updates on whether the exchange is meeting anti-money-laundering and sanctions obligations embedded in its 2023 monitoring regime. A Fortune report on Friday describes Blumenthal’s letters as requesting a current assessment of Binance’s compliance with the agreement.
The 2023 settlement required Binance to pay $4.3 billion in civil penalties and to fall under ongoing U.S. monitoring and reporting by regulators. Changpeng “CZ” Zhao, Binance’s founder, agreed to plead guilty to one felony as part of the resolution. DOJ and FinCEN officials responsible for overseeing the monitoring reportedly did not comment when approached by Fortune.
Blumenthal’s correspondence reportedly highlighted “mounting allegations of dangerously lax anti-money laundering prevention by Binance,” underscoring ongoing questions about the effectiveness of post‑settlement oversight and the sufficiency of the program’s controls.
Fortune also notes that the case has broader sanctions implications, including Iran-related scrutiny. The outlet reports that Binance had been accused of sanction evasion and that employees who flagged potential violations were reportedly dismissed; a Binance spokesperson denied the specific claims.
Separately, a bipartisan group of lawmakers pressed for action earlier this year. In February, Senator Chris Van Hollen and 10 colleagues urged Treasury Secretary Scott Bessent and former Attorney General Pamela Bondi to complete a “prompt, comprehensive review” of Binance’s compliance controls. The letter, circulated by Van Hollen’s office, signals continued bipartisan concern over how Binance’s regulatory posture is being assessed and enforced. Source: Van Hollen’s office.
Key takeaways
- A sitting U.S. senator asks DOJ and FinCEN for a current update on Binance’s compliance with AML and sanctions monitoring, citing a Fortune report on the matter.
- The 2023 settlement’s monitoring regime remains under scrutiny, with regulators yet to publicly detail its effectiveness or any gaps.
- Iran sanctions-related inquiries and related staffing changes at Binance are part of the ongoing oversight narrative, though Binance denies the specific allegations.
- Lawmakers have pressed for a rapid, comprehensive review of Binance’s controls, illustrating sustained bipartisan concern about crypto exchanges’ regulatory compliance.
- Questions about Binance’s political associations and external partnerships continue to surface, adding a political dimension to regulatory risk for the sector.
Regulatory monitoring under the 2023 settlement
The 2023 settlement placed Binance under an active regime of monitoring and reporting to U.S. authorities. As part of the deal, the exchange faced a substantial civil penalty and agreed to ongoing regulatory scrutiny designed to police anti-money-laundering controls and sanctions compliance. The latest inquiries focus on whether those measures are functioning as intended and how regulators verify ongoing adherence. Fortune’s reporting emphasizes that lawmakers want a transparent, current account of the program’s status, including any identified shortcomings and planned fixes.
Sanctions scrutiny and Iran-related dynamics
Iran sanctions have repeatedly surfaced in discussions around Binance. Reports cited by Fortune suggest that concerns about evasion tactics prompted internal reviews and staff changes, with claims that one billion dollars’ worth of activity may have moved toward Iran-linked entities. Binance has publicly denied these allegations through a spokesperson, underscoring the ongoing dispute over what actually occurred and how it should be interpreted within the monitoring framework.
Political entanglements and ongoing oversight tensions
The regulatory conversation around Binance is taking place against a backdrop of broader political considerations. In March 2025, a UAE-based entity reportedly acquired a $2 billion stake in Binance using a USD1 stablecoin issued by World Liberty Financial, a company associated with Donald Trump. In a separate development, Trump pardoned CZ in October 2025 after a four‑month prison stint tied to the 2023 settlement. While these items are part of public discourse around Binance, they contribute to a broader risk perception for investors and users who weigh regulatory certainty against political influence in the crypto space.
For readers tracking the regulatory arc, these disclosures reinforce why a formal, auditable update from U.S. authorities and Binance remains pivotal. The evolving status of the monitoring program, forthcoming agency statements, and any new enforcement steps will be essential to watch in the coming months.
Readers should keep an eye on forthcoming confirmations from the DOJ, FinCEN, and Binance about any adjustments to the monitoring regime, as well as any legislative or administrative signals that could reshape how large crypto platforms are governed in the United States.

Russia Pushes Bill to Criminalize Unregistered Crypto Services

General Hospital: Willow Goes Completely Unhinged – The Walls Are Closing In Fast!

AP Politics, Buggana Analyzes Reasons For Financial Instability Due To Amaravati

Why Israel is blocking foreign journalists from entering

Bitcoin: We’re Entering The Most Dangerous Phase

Alan Cumming Brands Baftas Ceremony A ‘Triggering S**tshow’
AP Politics, Buggana Analyzes Reasons For Financial Instability Due To Amaravati

Crypto Gold Live Trading 17 April | Market Trader | #goldtrading #cryptotrading #bitcoin

The most painful moment even family bonds your financial situations #youtube #youtubeshorts
-
 NewsBeat5 days ago
Pep Guardiola and Gary Neville agree over Arsenal title problem that benefits Man City
-

 Politics5 days ago
World Cup exit makes Italy enter crisis mode
-

 Crypto World4 days ago
The SEC Conditionalises DeFi Platforms to Be Avoided for Broker Registration
-

 Crypto World4 days ago
SEC Signals Exemption for Crypto Interfaces From Broker Registration
-

 News Videos3 days ago
Secure crypto trading starts with an FIU-registered
-

 Sports14 hours ago
NWFL Suspends Two Players Over Post-Match Clash in Ado-Ekiti
-

 Crypto World4 days ago
SEC Proposes Certain Crypto Interfaces Don’t Need to Register as Brokers
-

 Business6 days ago
Ireland Fuel Protests Enter Day 5 as Blockades Spark Shortages and Government Prepares Support Package
-

 NewsBeat4 days ago
Trump and Pope Leo: Behind their disagreement over Iran war
-

 Crypto World7 days ago
Federal judge blocks Arizona from bringing criminal charges against Kalshi
-
 NewsBeat6 days ago
JD Vance announces ‘no agreement’ with Iran over nuclear weapons fear
-

 Business7 days ago
IMF retains floor for precautionary balances at SDR 20 billion
-
Sports6 days ago
Dexter Lawrence, Stefon Diggs, Trading for De’Von Achane
-

 Crypto World5 days ago
Trump whales load up ahead of Mar-a-Lago luncheon.
-

 Business7 days ago
Former Liverpool CEO eviscerates FIFA for World Cup ticket pricing
-
Crypto World5 days ago
Sei Network Enters Quiet Reset Phase as On-Chain Metrics Signal a Slowdown in 2026
-
Business7 days ago
Coreweave CSO Venturo sells $5.5m in class a common stock
-
Sports7 days ago
1st-Round WR Enters Vikings Mock Draft Orbit
-
Business5 days ago
Kering slides after Morgan Stanley downgrade, Gucci woes loom
-
 Business1 day ago
Creo Medical agree sale of its manufacturing operation
You must be logged in to post a comment Login