
Crypto World
Gold Prices Recover After a Catastrophic Sell-Off

Yesterday, while analysing the silver price chart, we described a fundamental shift in supply and demand dynamics that likely became the key driver behind the sharp decline in prices.
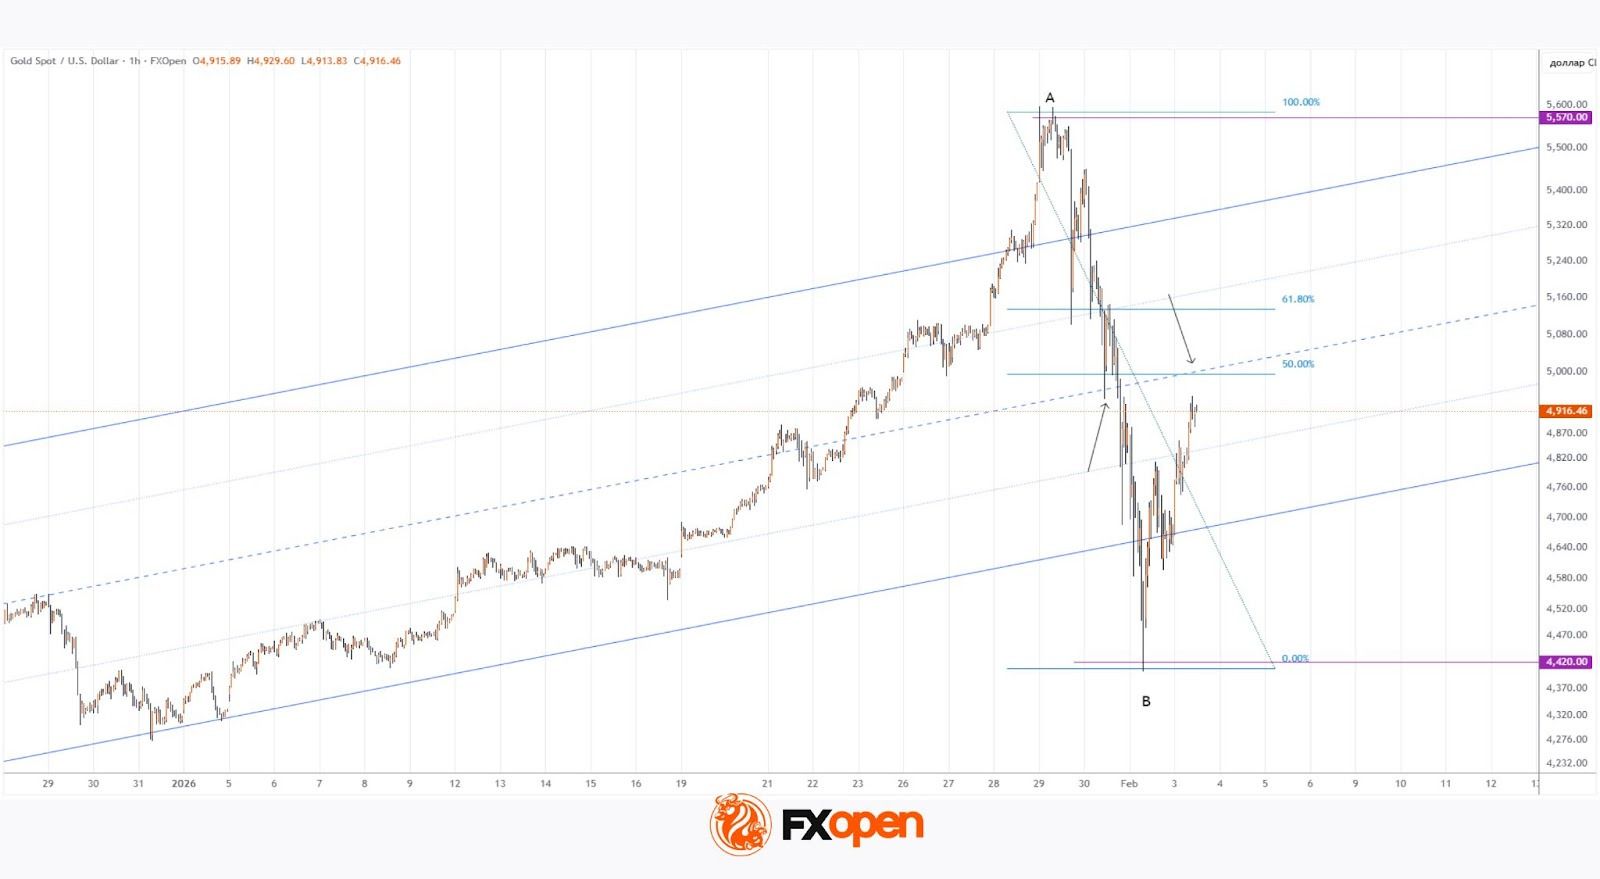
This same reasoning can likely be applied to the gold market, which experienced a synchronous and dramatic sell-off. From the A peak on 29 January near $5,570, the gold price (XAU/USD) collapsed to the B low on 2 February below $4,420 — a drop of around 20%:
→ “Smart money” locked in profits on long positions and switched to selling at market;
→ retail speculators were forced to close long positions at a loss, while the liquidation of previously leveraged trades accelerated the cascading decline.
On 26 January, when analysing gold price movements, we:
→ highlighted that the market was extremely overbought;
→ noted, however, that abandoning bullish expectations prematurely would be inappropriate without a major catalyst.
It now appears that the A→B collapse may have been precisely such an event.
Technical Analysis of the XAU/USD Chart
The previously identified channel was extended upwards by the abnormal surge in XAU/USD prices. Within this structure:
→ the A peak formed in overbought territory above the upper boundary of the channel;
→ the B low developed in oversold territory below its lower boundary;
→ during the sell-off on 30 January, the channel median briefly acted as support (as indicated by the arrow).
It is therefore reasonable to assume that the current rebound from extreme oversold conditions may encounter resistance formed by:
→ the median of the channel;
→ key Fibonacci retracement levels (50% and 61.8%).
Looking several weeks ahead, it is possible that XAU/USD may stabilise in the lower half of this channel. At the same time, the long-term outlook remains constructive: JPMorgan analysts have raised their year-end gold price forecast to $6,300 per ounce, while Deutsche Bank expects gold to reach $6,000 per ounce.
Start trading commodity CFDs with tight spreads (additional fees may apply). Open your trading account now or learn more about trading commodity CFDs with FXOpen.
This article represents the opinion of the Companies operating under the FXOpen brand only. It is not to be construed as an offer, solicitation, or recommendation with respect to products and services provided by the Companies operating under the FXOpen brand, nor is it to be considered financial advice.


On Wednesday, World Liberty Financial published a governance proposal that would burn 4.5 billion WLFI tokens and restructure vesting for 62 billion “early supporters” including Justin Sun.
Tron founder Sun, who sank $75 million into the project plus nearly $150 million in commitments to other Trump-linked crypto projects, called the proposal “tyranny” and “coercion.”
Tokenholders who don’t accept the new terms could remain locked on the blockchain indefinitely.
A vote that punishes no votes
Sun posted his disagreement within hours of World Liberty’s proposal arguing that its design is a logical trap. Reject it and risk a permanent token freeze.
His own tokens, which he says represent roughly 4% of the project’s voting power, have remained frozen since September 2025. Because his tokens are frozen, Sun holds no ability to participate in the vote.
“This is not a governance vote,” Sun wrote. “This is a performance where the police have already barricaded the doors of parliament and only let their own people inside to raise their hands.”
Laura Shin wholeheartedly agreed with Sun. “I’ve seen a lot of crazy things in crypto, but this might be one of the nuttiest,” she said in reference to the proposal. “Like, truly, WTF.”
MyEtherWallet co-founder Taylor Monahan disagreed, noting the legal disclosures available to Sun when he initially bought WLFI tokens.
“Everyone bought these tokens literally accepting the fact that they would be locked till somebody decided on a future date that something else will be done to change the circumstances.”
Read more: Every token in World Liberty Financial’s portfolio is down bad
Sun invested $223M in Trump crypto ventures
The proposal added to the escalating social media battle between the Trump family and Sun.
On April 12, Sun demanded that the people behind the WLFI account identify themselves. He accused the team of implanting backdoor controls and freezing investor funds without disclosure.
Incredibly, his complaints arrived months after Sun had already committed $223 million into the Trump family’s crypto ventures and received a $10 million slap-on-the-wrist settlement of his ominous SEC lawsuit.
A lead developer from Yearn Finance published an analysis of WLFI’s smart contracts, highlighting a special vesting category for Sun individually. Sun’s special vesting category contrasts with 519 other investors sitting in an otherwise identical yet distinct smart contract category.
It also notes that one administrative wallet of World Liberty Financial can freeze any holder unilaterally.
That same wallet runs a stablecoin borrowing loop on Dolomite. The lending protocol’s co-founder, Corey Caplan, also serves as a WLFI technical adviser.
World Liberty deposited 5 billion WLFI tokens as collateral, representing the vast majority of all WLFI on Dolomite at the time, to borrow roughly $75 million in stablecoins.
After over $40 million of those proceeds moved to Coinbase Prime, World Liberty later repaid $25 million.
Got a tip? Send us an email securely via Protos Leaks. For more informed news, follow us on X, Bluesky, and Google News, or subscribe to our YouTube channel.

As bitcoin continues to trade sluggishly near $75,000, several other crypto projects are showing notable developments.
Among them is XRP (XRP), the payments-focused token used by fintech firm Ripple to facilitate cross-border transactions. U.S.-listed spot XRP ETFs drew more than $17 million in inflows on Wednesday, the most since Feb. 2, according to data source SoSoValue. While that is smaller than the flows seen in bitcoin ETFs, it nonetheless points to a revival in demand for XRP after a prolonged period of muted activity marked by little to no uptake.
News flow has been encouraging, too. Ripple has partnered with Kyobo Life Insurance to pilot South Korea’s first real-time tokenized government bond settlement system on blockchain.
In addition, XRP’s derivatives market is flashing bullish signals with open interest (OI) rising alongside positive funding rates and cumulative volume delta. The OI has jumped to 1.89 billion XRP, a level last seen in late March, per Coinglass data.
The other noteworthy development is stablecoin-focused layer-1 blockchain Plasma, which has emerged as the world’s seventh-largest blockchain by total value locked (TVL), a measure of the dollar value of assets on the network.
At the time of writing, TVL stood at $2 billion, up 27% over the past week and more than 80% over the past 30 days, according to DeFiLlama. The driver behind the growth is not clear, but could be linked to rising optimism around the CLARITY Act nearing approval in the U.S., as noted by JPMorgan.
The act is a proposed U.S. bill that seeks to clarify how digital assets, including stablecoins, are regulated and which agencies oversee them.
In addition, Plasma is among a select group of networks, alongside Ethereum and Arbitrum, chosen to support Tether’s new self-custody wallet, Tether Wallet, announced earlier this week.
Lastly, there is , the meme-inspired token. Bollinger Bands, volatility indicators plotted two standard deviations above and below the token’s price, are currently at their tightest since February 2024, typically signaling a period of low volatility that is likely to end with significant price swings.
As for the market leader, bitcoin, the combination of onchain profit-taking, uneven spot demand, and cautious options suggests continued rangeplay near $75,000. Stay alert!
Read more: For analysis of today’s activity in altcoins and derivatives, see Crypto Markets Today . For a comprehensive list of events this week, see CoinDesk’s “Crypto Week Ahead.”
What’s trending
Today’s signal

The chart shows dogecoin’s (DOGE) daily price swings in candlestick format. Overlaid on the chart are Bollinger bands, which have compressed to their narrowest in over two years
The squeeze signals an extended period of low volatility, characterized by muted price action, with neither buyers nor sellers able to establish a clear trend. Such situations eventually get resolved in a decisive breakout. This often leads to an outsized move and volatility boom.
Note that this does not provide any signal about direction. A volatility expansion could just as easily result in a strong rally as it could in a steep decline.
The key takeaway is magnitude. Once dogecoin eventually breaks out of this low-volatility regime, the resulting move is likely to be significant and fast. For now, however, the market remains in a holding pattern.


A viral clip from the Jack Neel Podcast reignited debate over Bitcoin’s (BTC) origins after Professor Jiang argued that game theory points to the CIA as its most likely creator.
The Beijing-based educator and commentator, whose Predictive History channel has 2.3 million YouTube subscribers, framed Bitcoin as a deep state surveillance tool. The claim drew swift and pointed criticism from across the crypto community.
Did The CIA Create Bitcoin?
In the podcast, Jiang posed three questions. He asked who had the technical capability to build Bitcoin, who benefits from it, and why the creator stayed anonymous.
“When you do game theory analysis, you look at all possibilities, you end up with a deep state, the American deep state. You end up with a CIA,” he said.
Jiang speculated that blockchain may have been developed by the same institutions that developed technologies such as the internet and GPS. Next, he argued that the CIA could benefit from such a framework.
According to him, blockchain could serve dual purposes: enabling large-scale surveillance and potentially acting as a covert financial mechanism to support off-the-books operations.
Finally, he claimed that secrecy would be essential to maintaining trust in the system. In his view, if users believed blockchain was influenced or controlled by a government agency, it could undermine confidence and deter participation.
Follow us on X to get the latest news as it happens
Jiang also questioned where blockchain servers are physically located, arguing that whoever controls the hardware controls the software, regardless of open-source claims.
“Because I imagine if you’re able to control the hardware, you can also control the software. I don’t care what they tell me about open source and all that. I want to know where the databases are, where the servers are physically.It’s interesting too that it’s it’s designed like a religion,” he noted.
In addition, he flagged the Winklevoss twins’ large early bet on BTC after their Facebook settlement.
Bitcoin Community Challenge Professor Jiang
Critics called out the server question. An analyst explained that Bitcoin runs on tens of thousands of independently operated nodes globally, with no central server infrastructure and no single point of failure.
“Bitcoin is ultimately an IQ test and this ‘Professor’ has failed. It’s been 17 years and they still fail to understand the basics. It’s okay to say ‘I don’t know’ sometimes, you know,” the analyst added.
Ansel Lindner called it the “opinion of so many midwits.” He argued that such views explain why some gold advocates still struggle to understand Bitcoin and why others gravitate toward centralized, low-quality tokens.
According to him, the core issue is a fundamental misunderstanding of decentralization.
“People with this view don’t truly understand the open source aspect or the proof of work aspect fully. A strong point about Bitcoin is that it literally doesn’t matter who created it. It can be assessed on its own merits since it’s transparent and decentralized,” Lyn Alden, an investor and author, added.
BeInCrypto previously analyzed Jiang’s claims, concluding that they align more with a conspiracy narrative than a substantiated account of Bitcoin’s origins. To date, no public evidence has linked Bitcoin’s creation to agencies such as DARPA, the Pentagon, or the CIA.
Meanwhile, speculation surrounding Satoshi Nakamoto’s true identity is nothing new. Over the years, numerous theories have emerged pointing to various individuals.
Most recently, The New York Times published an extensive investigation suggesting that Blockstream CEO Adam Back is the strongest candidate for the person behind Bitcoin’s creation. Back, however, has rejected these claims.
Subscribe to our YouTube channel to watch leaders and journalists provide expert insights
The post Crypto Community Pushes Back at Professor Jiang’s Viral CIA Bitcoin Theory appeared first on BeInCrypto.


A multi-million dollar influx from crypto-aligned donors is set to shape the 2026 Ohio Senate race as the Sentinel Action Fund commits $8 million to support Republican Senator Jon Husted.
Summary
- The Sentinel Action Fund and its affiliate Right Vote pledged $8 million to back Republican Senator Jon Husted in the 2026 Ohio Senate race.
- Husted remains a primary legislative ally for the digital asset industry through his support of the GENIUS Act and his advocacy for a pro-innovation regulatory framework.
Sentinel Action Fund officials announced Wednesday that the super PAC, alongside its affiliate Right Vote, will direct the funds toward Husted’s bid to retain his seat in the upcoming November midterms.
The move signals a concerted effort by the digital asset industry to solidify its influence in Washington following significant shifts in the 2024 election cycle.
Husted, a consistent advocate for blockchain technology, has built a reputation as a “strongly supports crypto” candidate through his backing of the GENIUS Act and calls for a pro-innovation regulatory framework.
“Digital asset technology represents the next wave of economic opportunity for working families,” Husted stated, advocating for a federal approach that encourages domestic growth rather than restrictive oversight.
Federal Election Commission records show that the Solana Institute and Multicoin Capital are the primary drivers behind Sentinel’s current war chest, contributing $750,000 and $250,000, respectively.
The PAC has also drawn support from traditional Wall Street heavyweights, including Blackstone CEO Stephen Schwarzman and Fisher Investments Chairman Kenneth Fisher, bringing together Silicon Valley capital and established finance in a way that sets Husted apart from his predecessor, Sherrod Brown, who lost his seat in 2024 after frequently challenging the industry over concerns tied to sanctions evasion and illicit finance.
“[Brown] has stood in the way of pro-innovation policies when it comes to digital assets,” Sentinel Action Fund President Jessica Anderson said in an accompanying statement, positioning Husted as the necessary correction to that legislative approach.
Strategic expansion into the 2026 midterms
The Ohio commitment is part of a larger nationwide strategy by crypto-focused political groups to secure a friendly Senate majority.
Husted is the third candidate to receive Sentinel’s formal endorsement this cycle, joining Maine Senator Susan Collins and Michigan’s Mike Rogers.
This surge in spending follows the blueprint established by Fairshake, a massive super PAC backed by Coinbase and a16z, which spent $12 million to help Republican Bernie Moreno defeat Brown in the previous election.
Fairshake has already reported a balance of $193 million to deploy as the midterms approach. Other players are also entering the fray, with Cantor Fitzgerald contributing $10 million to the Fellowship PAC, which recently appointed Tether executive Jesse Spiro as its chairman.
This level of early-cycle spending suggests that the intersection of digital finance and federal policy will remain a primary battleground for the foreseeable future.
Crypto World
BTC price holds near $75,000 as short-term holders look for profit opportunities: Crypto Markets Today

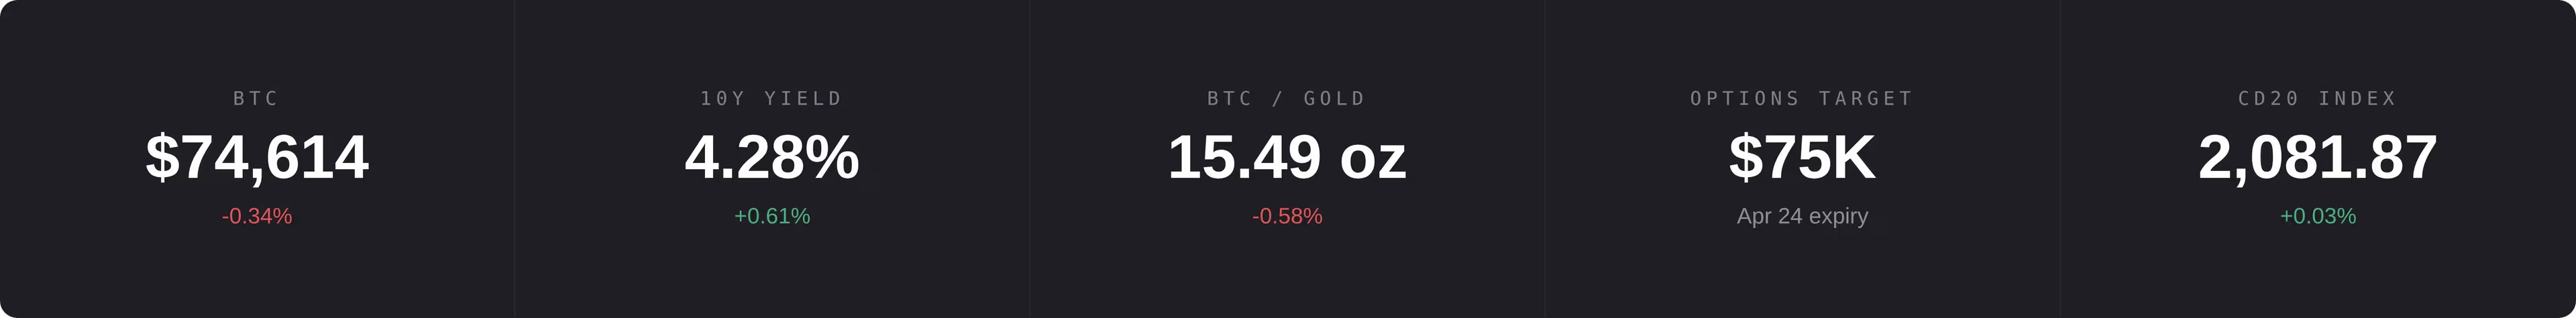
Bitcoin is still hovering near $75,000 as it hits a wall of supply while institutional demand remains steady, with traders weighing progress in U.S.-Iran peace talks during a two-week ceasefire.
The CoinDesk 20 (CD20) index rose around 1.9% in the past 24 hours, compared with bitcoin’s 1%, amid reports of a ceasefire extension, improving risk sentiment.
The increases come alongside a softer U.S. dollar, which slipped to a near six-week low, and easing Treasury yields, conditions that often support crypto prices by lowering the relative appeal of holding cash. Gold also gained, pointing to a market balancing risk appetite with hedging demand.
Still, the backdrop remains tense. The U.S. blockade of Iranian ports and Iran’s threats to disrupt shipping routes in the Persian Gulf and nearby waterways continue to cloud the outlook for the global economy.
Energy supply shocks have already begun feeding into inflation expectations, a factor that could shift central bank policy and ripple into crypto markets.
Onchain data also show bitcoin supply tends to appear when prices reach key cost-basis levels for short-term holders. That’s around $76,800, a level that could act as resistance as investors cash out when breaking even.
Derivatives positioning
- Crypto futures open interest (OI) has risen 2.5% in the past 24 hours even as trading volume dropped 16% and liquidations fell 48% to $220 million.
- The divergence suggests traders are adding or holding positions despite a slowdown in activity, pointing to a buildup of exposure without strong conviction. The sharp decline in liquidations indicates reduced volatility and fewer forced exits.
- Among the biggest tokens, XRP and DOGE stand out with OI increases of at least 3%, showcasing a bullish combination of positive perpetual funding rates and OI-adjusted cumulative volume delta (CVD).
- DOGE has the most positive 24-hour CVD, indicating that buyers have been more aggressive in lifting offers and driving trades.
- On decentralized exchange Hyperliquid, perpetuals tied to commodities continue to do solid business and now account for 30% of the platform’s total notional open interest.
- Bitcoin and ether’s 30-day implied volatility indexes, BVIV and EVIV, continue to hover below their 200-day averages, indicating market calm.
- In the BTC options market, the one-week implied volatility is now trading cheaper relative to realized or actual volatility. In other words, short-dated options are now cheap. This kind of setup often has traders taking bullish volatility bets via straddle/strangle strategies that involve buying both call and put options.
- The Deribit-listed bitcoin and ether options continue to show a bias for puts. The persistent demand for downside hedges indicates that the sustainability of recent rally is still being questioned.
Token talk
- CoW Swap, a decentralized exchange aggregator tied to CoW Protocol, on Tuesday suffered a domain name system (DNS) hijacking attack that redirected users to a malicious site and drained funds from connected wallets.
- The breach did not touch the protocol’s smart contracts or back-end systems. Instead, attackers used social engineering to gain control of the project’s domain registrar, allowing them to reroute traffic from cow.fi to a cloned interface designed to capture wallet approvals.
- Losses appear limited to affected users rather than the protocol itself. Onchain data points to at least $1 million drained, including a single wallet that lost 219 ETH.
- The COW token fell about 2.6% that day, with trading volume spiking as news spread. Prices continued to drift lower in the following sessions, and are now 11% lower.
- CoW DAO reclaimed control of the cow.fi domain little over half a day ago, but sentiment for the protocol doesn’t appear to have improved. The token is down another 6% since then.

- World Liberty Financial is reshaping WLFI token supply.
- About 4.52 billion insider tokens may be burned if the vote passes.
- WLFI token price stays volatile, driven by governance vote expectations.
World Liberty Financial’s WLFI token has been in the spotlight after a major governance proposal that is expected to reshape the token’s supply structure.
The proposal centres on unlocking 62.28 billion tokens over time while also burning about 4.52 billion tokens tied to insider allocations.
The market reaction has been quick, mixed, and heavily driven by speculation rather than steady trend building.
At the time of writing, WLFI traded around $0.081, slightly higher on the day by about 1%.
However, the broader picture is less stable. Over the past week, the token has dropped more than 10%, and losses extend beyond 20% over the past month.
Despite occasional intraday recoveries, the overall trend still reflects sustained pressure from earlier selloffs.
A major shift in WLFI’s token structure
The core of the current debate is the proposed restructuring of a large portion of WLFI’s supply.
Roughly 62.28 billion tokens that were previously locked will no longer remain in indefinite restriction.
Instead, they would be released gradually over a multi-year period, estimated between four and five years.
This change is important because it replaces uncertainty with a defined timeline.
Investors will no longer have to guess if or when a large amount of tokens might enter circulation at once.
Instead, the release becomes structured and predictable, which reduces the fear of sudden supply shocks.
Alongside this unlock plan is a separate but closely connected mechanism: a burn of approximately 4.52 billion tokens.
This burn is targeted mainly at insider allocations, including team and advisor holdings, and is expected to take effect only if participants accept the new governance terms.
The combination of these two moves creates a balancing effect. On the one hand, more tokens are gradually introduced into the system.
On the other hand, a portion is permanently removed from supply expectations.
This dual approach is designed to ease concerns around dilution while still improving liquidity over time.
Market reaction driven by speculation and vote expectations
The market response to the proposal has been far from calm.
WLFI has seen sharp bursts of trading activity, including sudden volume spikes that suggest short-term speculation rather than long-term positioning.
In one instance, trading activity surged dramatically within a short window, showing how sensitive the token is to governance-related headlines.
Price action has also been closely tied to broader crypto sentiment.
Recent strength in the wider market has provided temporary support, helping WLFI hold small gains even as its medium-term trend remains weak.
Still, these gains have not been strong enough to reverse the overall downward structure that has been in place for weeks.
Whale activity has added another layer of volatility.
Large holders have been seen both selling into strength and accumulating during dips, creating a choppy and unpredictable price environment.
This kind of behaviour is typical when traders are positioning ahead of a major governance decision rather than reacting to long-term fundamentals.
Short-term WLFI token price outlook
In the short term, WLFI’s direction appears tightly linked to the outcome of the ongoing governance vote.
If support around $0.078 holds and the proposal gains approval, WLFI could attempt another move toward the $0.084 area, which has acted as a near-term resistance zone.
This scenario would likely be driven by renewed confidence in the tokenomics restructuring and reduced fear of uncontrolled supply expansion.
However, if the vote fails or sentiment weakens, the downside risk becomes more visible. A break below $0.078 could open the door to a retest of recent lows near $0.072.

In that case, selling pressure could accelerate as traders unwind short-term positions built around the proposal hype.
Beyond short-term volatility, the proposal signals a deeper restructuring of WLFI’s economic model.
By turning previously locked tokens into a structured vesting system, the project is attempting to replace uncertainty with long-term predictability.
The 4.52 billion token burn adds another layer to this strategy, acting as a signal of commitment from insiders while also reducing perceived excess supply pressure.
Combined with a multi-year unlock schedule, the goal is to smooth out future token distribution rather than allowing large, sudden changes in supply dynamics.
The S&P 500 Index tracks the performance of 500 large US companies and is widely used as a benchmark for equity markets. Market participants typically gain exposure through instruments such as CFDs, futures, or ETFs. CFD trading enables positioning on both rising and falling price movements without ownership of the underlying assets. This article covers how the index is structured, what moves the S&P 500, and how traders commonly approach S&P 500 CFDs in practice.
What Is the S&P 500 Index?
The S&P 500 Index is a stock market index that tracks 500 of the largest publicly traded companies in the United States. It covers approximately 80% of available US market capitalisation and serves as a benchmark for the performance of US equities.
S&P Dow Jones Indices manages the index and selects constituents through a committee. Companies must meet criteria including a minimum market capitalisation of $22.7 billion, adequate liquidity, and sector representation. The index is rebalanced quarterly in March, June, September, and December, and constituent changes can happen at any time.
The S&P 500 uses a float-adjusted market-cap weighting system. Each company’s influence on the index depends on the total market value of its publicly available shares. Larger companies carry more weight than smaller ones. As of early 2026, the top 10 constituents, including NVIDIA, Apple, Microsoft, and Amazon, accounted for over 37% of the entire index.
That concentration matters for traders. When a stock like NVIDIA, weighted at over 7%, moves by 2% in a session, it shifts the index far more than a smaller constituent moving by the same amount. Traders watching the S&P 500 often pay close attention to these heavily weighted names, as their price action can drive the direction of the index on any given day.
How Is the S&P 500 Calculated and Why Does Weighting Matter?
The S&P 500 weights each company by its float-adjusted market capitalisation, meaning only shares available for public trading count towards a company’s influence on the index. A company with a larger public float and higher share price carries more weight than a smaller one.
To calculate the index value, the combined float-adjusted market caps of all 500 companies are added together and divided by a number called the divisor. The divisor is adjusted whenever structural changes occur, such as stock splits, spin-offs, or constituent swaps, so that these events do not create artificial jumps in the index level. It keeps the index continuous over time.
This structure also creates a built-in momentum effect. As a company’s price rises, its weighting in the index increases automatically, giving it even more influence over the index’s direction. The reverse happens during selloffs. That’s why recent extended rallies in a handful of large-cap technology stocks have pulled the S&P 500’s sector balance and intraday price action heavily towards big tech names.
What Moves the S&P 500 Index?
Federal Reserve policy, macroeconomic data, corporate earnings, and geopolitical developments are the main drivers of S&P 500 price movements.
Interest rate decisions from the Federal Reserve tend to have the most direct impact. Lower rates reduce borrowing costs for companies and make equities more attractive relative to bonds. Higher rates do the opposite. Even the tone of a Fed statement or press conference can shift sentiment within minutes.
Inflation data, particularly the Consumer Price Index (CPI), influences the market because it shapes expectations about future rate moves. Labour market reports carry similar weight. A stronger-than-expected Nonfarm Payrolls (NFP) print can push the index lower if traders interpret it as a reason for the Fed to keep rates elevated.
Corporate earnings round out the fundamental picture. During earnings season, which occurs four times a year, results from heavily weighted companies like Apple, Microsoft, and NVIDIA can move the index on their own. Sector leadership also shifts over time. In recent years, technology stocks have driven much of the index’s direction, but rotations into financials, energy, or healthcare occur as economic conditions change.
Geopolitical risk, including trade policy shifts and military conflicts, adds another layer of volatility. They affect bond yields and the US dollar. Rising 10-year Treasury yields compete with equities for capital, while a stronger dollar pressures the earnings of S&P 500 companies that generate a large part of their revenue internationally.
Releases traders commonly watch include:
- Federal Reserve interest rate decisions and meeting minutes
- CPI (inflation)
- Nonfarm Payrolls (first Friday of each month, 8:30 am ET)
- Quarterly earnings from top-weighted constituents
S&P 500 Trading Instruments: CFDs, Futures, ETFs
Market participants typically access the S&P 500 through three main instruments: contracts for difference (CFDs), futures, and exchange-traded funds (ETFs). Each works differently in terms of capital requirements, costs, and flexibility.
S&P 500 futures are standardised, exchange-traded contracts that provide exposure to the forward value of the S&P 500, with central clearing and high institutional liquidity. Each contract has predefined specifications, including contract size, tick value, and fixed expiry dates, after which positions must be rolled or settled – a distinct feature of S&P 500 futures vs CFDs and ETFs.
Pricing is determined directly on regulated exchanges and reflects real-time expectations of market participants, with margin requirements set by the exchange rather than a broker. As a result, they are typically used for hedging, macro positioning, and short-term trading around key data release.
S&P 500 ETFs are exchange-traded funds that aim to replicate the performance of the S&P 500 by holding a basket of its constituent stocks, offering direct, unleveraged exposure to the underlying market. Unlike derivatives, ETFs are traded on stock exchanges in the same way as individual shares, with pricing driven by net asset value and market demand, and without features such as overnight financing charges or contract specifications like expiry.
If you’re wondering, “Can you short the S&P 500 with ETFs?”, it is possible to gain short exposure through inverse ETFs and leverage can be embedded in certain products. However, standard S&P 500 ETFs are typically used for longer-term positioning, portfolio diversification, and capital allocation rather than short-term, margin-based trading. However, you don’t have to invest in ETFs, you can trade CFDs on index or ETF.
CFDs are derivative contracts that track the price of the underlying asset without requiring ownership of them. Traders can take both long and short positions, meaning they can take advantage of rising or falling prices. CFDs typically offer leverage, which means a smaller initial capital controls a larger position. There is no fixed expiry date, though overnight funding costs (swaps) may apply when positions are held past the daily close.
At FXOpen, you can trade CFDs on the S&P 500 (US SPX 500 mini) and other global indices from the US, Europe, and Asia with zero commission* and ETF CFDs, including SPDR S&P 500 ETF Trust (SPY), with tight spreads* and low commissions*. All trading instruments are available through the TickTrader trading platform.
CFD and ETF trading differ in several ways, particularly around leverage and short-selling access.
S&P 500 CFD Trading Process
Trading the S&P 500 via CFDs typically follows a structured workflow. Below is a common approach used by some traders when exploring how to trade S&P 500 CFDs.
1. Choosing between a cash index CFD or a futures-based CFD.
The cash-style CFD typically offers tighter spreads and closer tracking to the spot level of the S&P 500, but incurs daily overnight funding costs when positions are held beyond the trading day.
In contrast, a futures-based CFD reflects the price of the underlying futures contract, where the cost of carry (interest rates and expected dividends) is already embedded in the price. As a result, it does not involve daily funding charges, but has a fixed expiry date and may require rollover into the next contract for longer-term positions.
Futures on the S&P 500, such as E-mini contracts, are typically cash-settled at expiry, meaning no physical delivery of underlying shares takes place.
2. Defining a directional bias using technical or fundamental analysis.
Traders commonly form a view on the index direction before engaging with S&P 500 trading, guided by chart-based analysis, such as support and resistance levels, or a fundamental view based on upcoming earnings or central bank policy.
3. Marking upcoming event risk on the calendar.
Fed decisions, CPI releases, NFP prints, and major earnings dates can all trigger sharp moves. Many traders note these dates in advance and adjust their approach accordingly, either by reducing position size or waiting until after the release.
4. Setting an entry level, stop-loss, and target before placing the trade.
Pre-defining these levels is a common practice in CFD trading. Stop-loss and take-profit levels are typically based on technical levels or a fixed risk-to-reward ratio.
5. Sizing the position relative to account equity and stop distance.
Position sizing determines how much capital is at risk. Some traders risk a fixed percentage of the trading account per trade, often between 1% and 3%.
6. Monitoring overnight funding costs, spreads, and margin requirements.
Holding S&P 500 CFD positions overnight may incur a swap charge. Spreads can also widen during low-liquidity periods, such as the daily maintenance break or ahead of major data releases. Traders typically keep margin usage in check to avoid margin calls during volatile moves.
S&P 500 Trading Conditions and Risk Considerations
S&P 500 CFD trading concentrates around the US cash session and key data releases, while leverage, gap risk, and overnight funding costs are the main risk factors traders typically account for.
Market Sessions and Liquidity Patterns
The New York session runs from 9:30 am to 4:00 pm ET, this is when trading volume and liquidity peak. The first 30 minutes after the open and the final 30 minutes before the close tend to produce the sharpest price moves, as institutional order flow concentrates at these times.
Outside the standard session, S&P 500 CFDs are available to trade for nearly 24 hours on weekdays, tracking the underlying futures market. Liquidity thins during the overnight period, particularly between the US close and the Asian open. Spreads often widen during these quieter hours.
The European-US overlap, roughly 8:00 am to 11:30 am ET, typically brings a second wave of activity as London-based participants trade alongside New York. US macroeconomic releases at 8:30 am ET, including NFP and CPI, frequently trigger volatility before the market even opens.
Risk Factors in S&P 500 CFD Trading
Leverage is the most prominent risk in US 500 CFD trading. While it reduces the capital needed to take a position, it also amplifies losses at the same rate it amplifies gains. A small adverse move in the index can result in a loss larger than the initial margin if risk controls are not in place.
Stop-loss orders are used by traders as a risk management tool, but they do not guarantee execution at the specified price during fast-moving markets. Gaps, where the price jumps past a specified stop level between sessions, can occur after major news events or over weekends.
Overnight funding costs accumulate on positions held past the daily close. These are calculated based on the position direction and prevailing interest rates, typically resulting in a charge for long positions, while short positions may receive a credit, depending on market conditions and broker pricing.
Comparison of the S&P 500, Nasdaq 100, and Dow Jones
The S&P 500, Nasdaq 100, and Dow Jones Industrial Average differ primarily in composition, weighting methodology, and sector exposure, making each index reflect a distinct segment of the US equity market and respond differently to macroeconomic and earnings-driven developments.
The Nasdaq 100 tracks 100 of the largest non-financial companies listed on the Nasdaq exchange. Its heavy concentration in technology stocks, which make up more than half the index, means it tends to move more aggressively during tech-driven rallies and selloffs.
The Dow Jones Industrial Average takes a more concentrated approach, comprising just 30 large, established US companies, often viewed as industry leadersю It is less diversified than broader indices and tends to reflect the performance of a select group of mature, globally recognised corporations rather than the wider US equity market.
The S&P 500 sits between the two in terms of breadth and sector balance. With 500 constituents across all 11 GICS sectors, it offers the widest representation of the US economy among the three.
S&P 500 vs Nasdaq 100 vs Dow Jones
Each index responds differently to the same catalyst. A Fed rate cut, for example, tends to have a larger impact on the Nasdaq 100 because growth and technology stocks are more sensitive to interest rate changes. The DJIA, with its tilt towards mature, dividend-paying companies, typically reacts less sharply. The S&P 500 falls somewhere in between, given its broader mix.
The Bottom Line
The S&P 500 gives traders broad exposure to the US equity market through a single instrument. CFDs offer a way to take positions on both rising and falling prices, with leverage and near 24-hour access on weekdays. Understanding what drives the index, how weighting affects price action, and how sessions influence liquidity can support your market analysis.
Wondering how to trade the S&P 500 index via CFDs alongside forex, commodities, and share CFDs? You may consider opening an FXOpen account and gain exposure to US SPX 500 mini (the FXOpen version of S&P 500 E-mini futures) with zero commission* and SPDR S&P 500 ETF Trust (SPY) with tight spreads*.
FAQs
What Is the S&P 500 Index?
The S&P 500 is a stock market index that tracks 500 large US companies across all major sectors. It covers approximately 80% of available US market capitalisation and uses float-adjusted market-cap weighting, meaning larger companies have more influence on the index’s value.
Can You Trade the S&P 500 With CFDs?
Yes. CFDs allow traders to speculate on S&P 500 price movements without owning the underlying shares. Positions can be taken on both rising and falling prices, and leverage reduces the capital required. At FXOpen, you can trade the US SPX 500 mini (SPXm) index and SPDR S&P 500 ETF Trust (SPY) CFDs with low commissions* and tight spreads*.
What Factors Influence S&P 500 Price Movements?
Federal Reserve interest rate decisions, inflation data, labour market reports (NFP), GDP figures, and corporate earnings are the primary drivers. Bond yields, US dollar strength, and geopolitical events such as trade policy changes also affect sentiment and index direction.
When Is S&P 500 Market Activity Typically Highest?
Liquidity peaks during the US cash session from 9:30 am to 4:00 pm ET. The first and last 30 minutes of that session tend to see the sharpest price moves. Macroeconomic releases at 8:30 am ET may also generate high volatility.
What Is the Difference Between Trading the S&P 500 and Investing in It?
Trading the SPX 500 online typically involves short-term positioning around price movements, often using leveraged instruments like CFDs or futures. Investing usually means buying and holding ETFs such as SPY or VOO over longer periods to gain exposure to the index’s long-term performance.
Can Positions on the S&P 500 Be Taken in Both Directions?
Yes. CFDs and futures allow traders to go long if they expect the index to rise or go short if they expect it to fall. ETFs are primarily used for long positions, though some inverse ETFs exist for short exposure.
*Additional fees may apply.
This article represents the opinion of the Companies operating under the FXOpen brand only. It is not to be construed as an offer, solicitation, or recommendation with respect to products and services provided by the Companies operating under the FXOpen brand, nor is it to be considered financial advice.

Key Highlights
-
Verizon builds enhanced 5G infrastructure to manage unprecedented World Cup data traffic
-
Advanced fiber and wireless systems enable worldwide broadcast transmission
-
Tournament venues receive significant network upgrades for improved fan connectivity
-
Network enhancements designed to support emergency services and operational efficiency
-
Host cities benefit from lasting digital infrastructure improvements beyond the event
Verizon (VZ) stock closed trading at $45.03, reflecting a 0.99% decline, with pre-market activity showing further softness at $44.98, indicating modest near-term bearish sentiment. Despite market headwinds, the telecommunications leader is pushing forward with significant infrastructure initiatives connected to major international sporting events. The company’s comprehensive involvement in FIFA World Cup 2026 places it at the forefront of managing unprecedented connectivity requirements.
Verizon Communications Inc., VZ
Massive Network Buildout Targets Tournament Demands
The telecommunications provider is implementing comprehensive 5G and fiber optic upgrades throughout competition venues and surrounding municipalities ahead of FIFA World Cup 2026. Network capacity expansions are specifically designed to accommodate extraordinary data consumption expected during tournament matches. Projections indicate individual matches will generate upwards of 50 terabytes of data traffic within stadium boundaries alone.
Verizon has strategically positioned thousands of compact antennas beneath seating sections to maximize signal coverage and transmission speeds. The telecommunications giant has additionally established approximately 140 small cell installations and provisional network sites throughout adjacent neighborhoods. These technical enhancements target uninterrupted connectivity during transit periods, fan festival activities, and mass congregation events.
The company has substantially increased accessible 5G spectrum allocation across tournament facilities to optimize network performance. This strategic expansion is projected to multiply available network capacity by a factor of five. Consequently, attendees will maintain access to instant content delivery, mobile commerce platforms, and social networking applications without service degradation.
Cutting-Edge Systems Enable Broadcasting and Tournament Management
The carrier is constructing a robust, high-throughput network foundation to facilitate international broadcasting activities throughout the competition. This technological framework will enable consolidated data handling and ultra-high-definition content distribution to audiences globally. The architecture is specifically engineered to provide dependable connectivity for the International Broadcast Center’s operations.
Verizon is implementing dedicated private 5G networks throughout stadium facilities to enable mission-critical systems. These specialized networks will facilitate referee-worn camera systems and instantaneous data analysis platforms. They deliver the ultra-low latency performance essential for real-time broadcast production and streamlined operational workflows.
The company is leveraging 5G Fixed Wireless Access technology for provisional network deployments across tournament sites. This approach enables accelerated connectivity establishment for commercial spaces, supply chain operations, and fan interaction areas. Network slicing capabilities will ensure critical applications receive bandwidth priority during maximum usage timeframes.
Infrastructure Investments Benefit Communities and Emergency Services
The telecommunications provider is committing resources to enduring infrastructure enhancements within host communities that extend beyond tournament requirements. These improvements target enhanced internet accessibility for educational institutions, medical facilities, and municipal services. The company frames these capital investments as contributions to a permanent digital transformation.
Verizon Frontline is equipping public safety organizations with specialized communication infrastructure. The dedicated platform guarantees dependable connectivity for emergency personnel throughout high-attendance events. It facilitates streamlined coordination among emergency response agencies during matches with maximum crowd capacity.
Verizon is assisting local enterprises through its Digital Ready initiative across host municipalities. The program delivers technological resources, educational workshops, and connectivity infrastructure to handle elevated customer volume during tournament periods. These support mechanisms aim to enable businesses to effectively process increased patron interactions and enhance payment processing capabilities.
Verizon’s comprehensive FIFA World Cup 2026 partnership underscores its strategic focus on large-scale digital infrastructure implementation. Although recent stock movement indicates modest downward pressure, the company maintains momentum in expanding network capabilities. These strategic initiatives strengthen its competitive standing in advanced connectivity solutions and international event support operations.

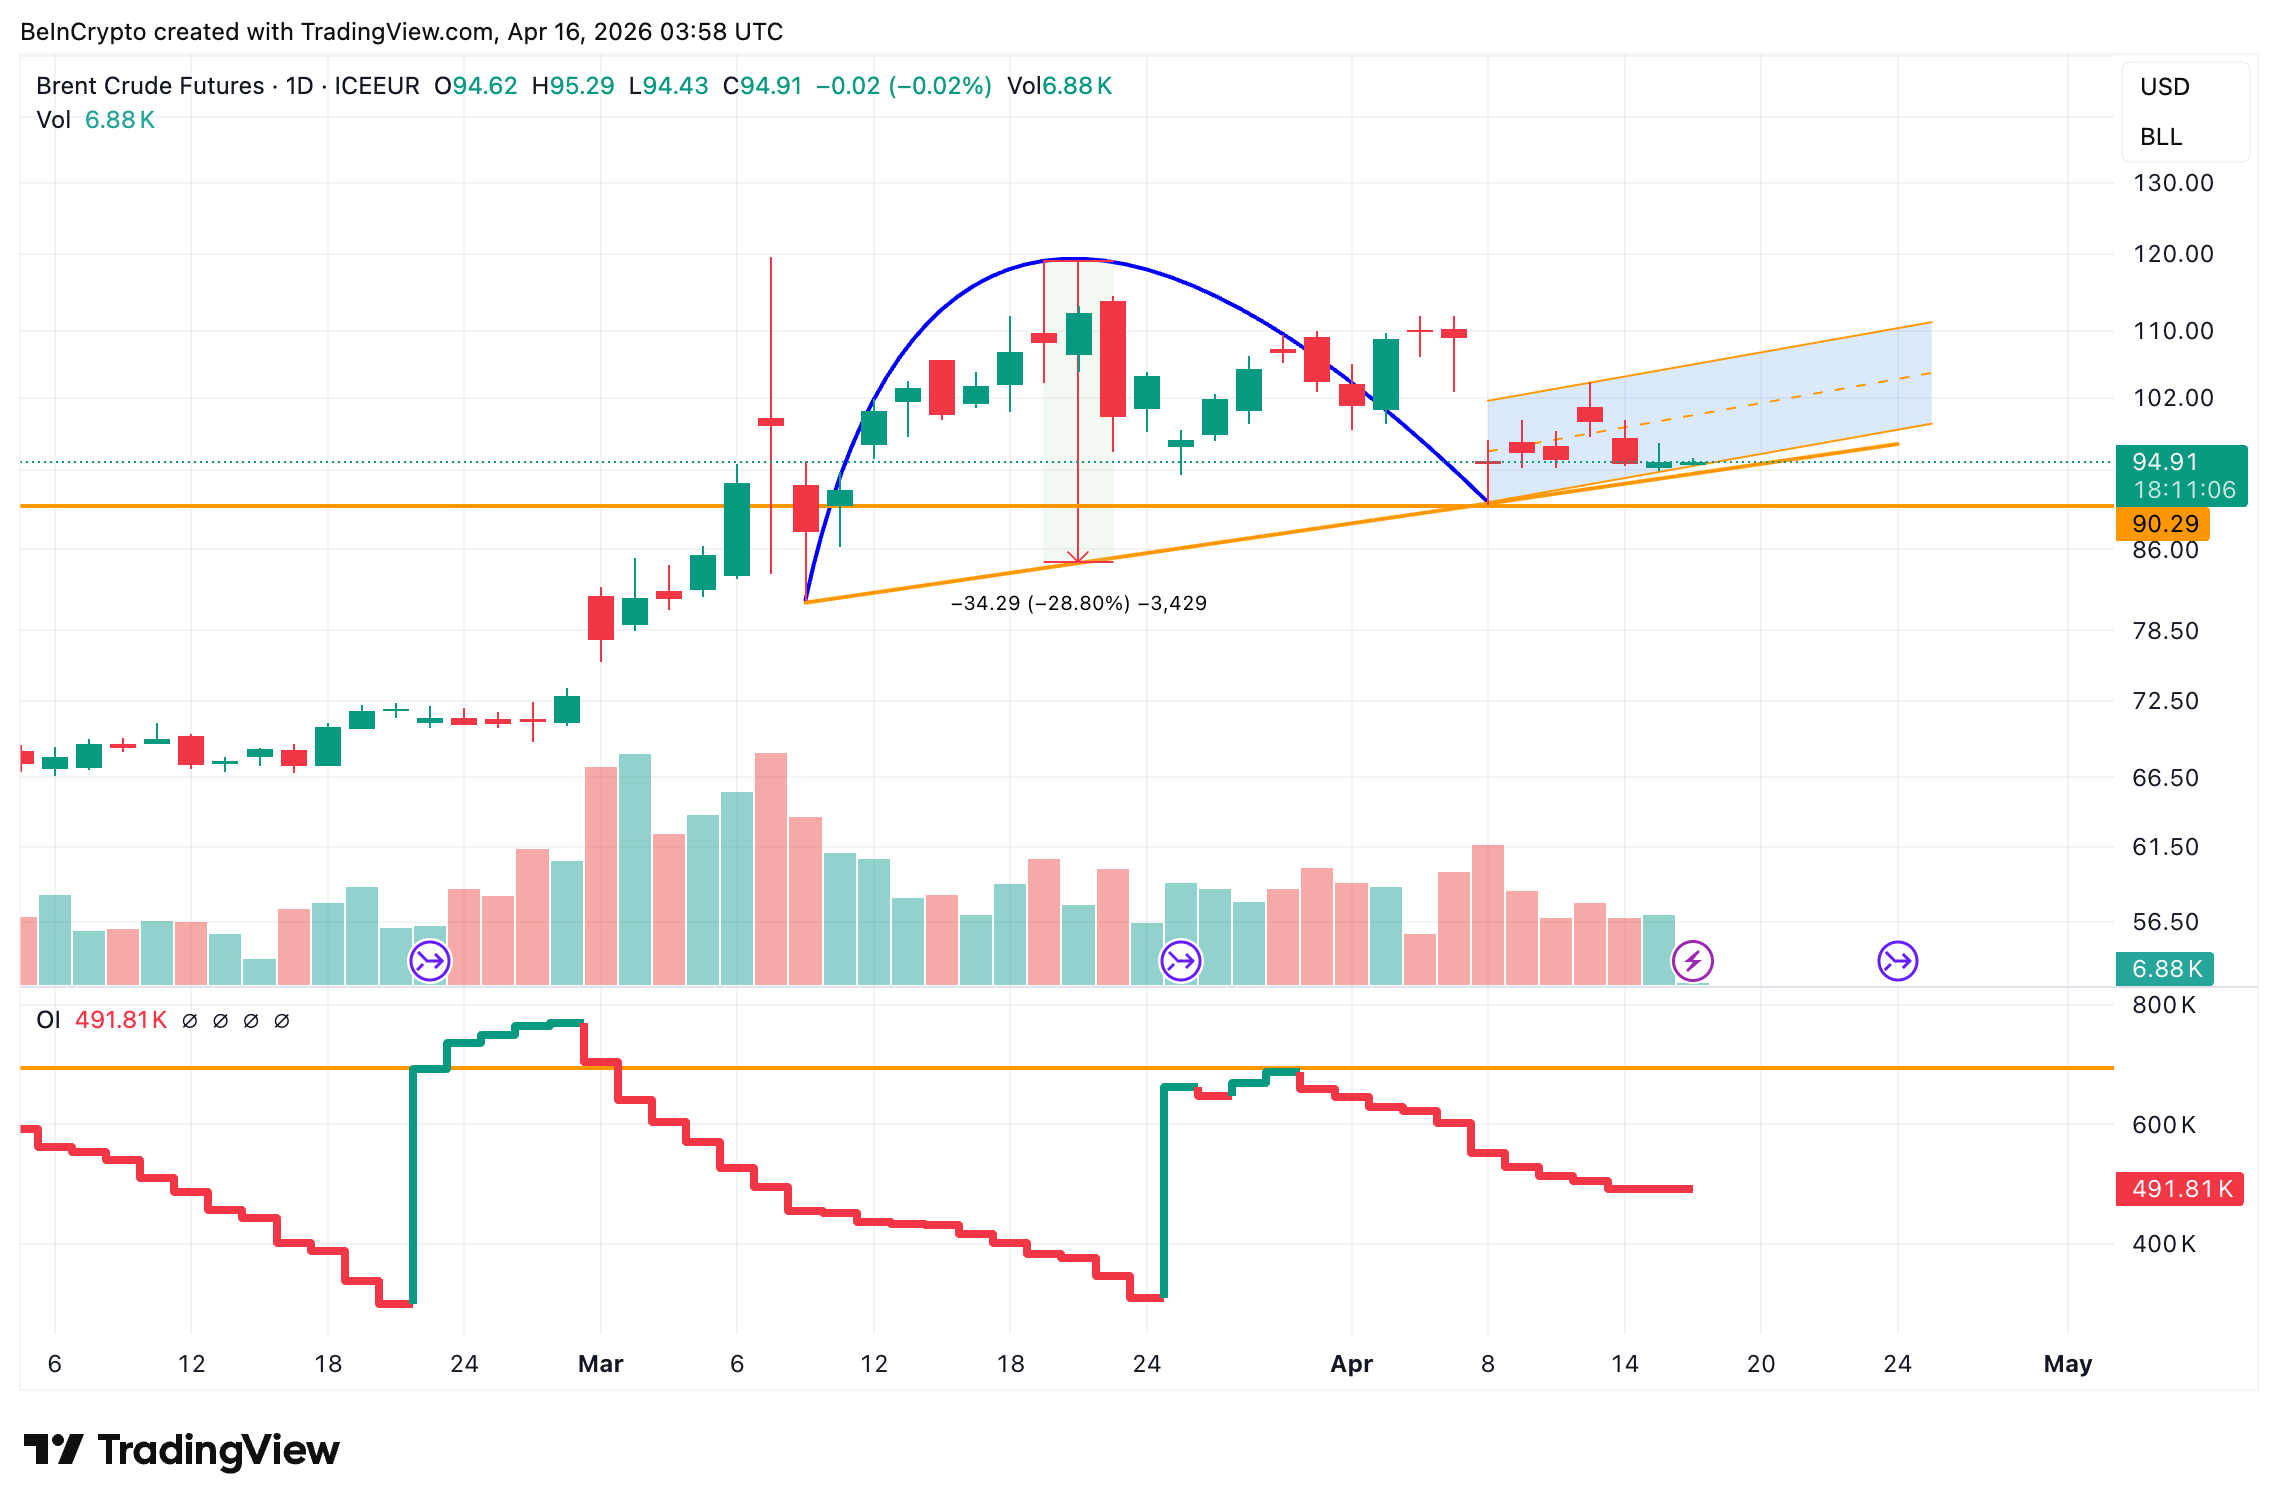
Brent crude oil price trades near $94.92, trapped inside the handle of an inverted cup-and-handle pattern. The pattern measured a 28.8% decline from its March peak.
The recent bounce looks constructive on the surface. Yet three signals beneath the price chart suggest the rally is running on fumes. Volume is declining, open interest is collapsing, and options traders are buying upside calls not out of conviction but as conflict insurance.
An Inverted Cup and Handle Forms as Volume and Open Interest Collapse
Oil price has been declining since Brent peaked in mid-March. The rounded top that formed between early March and late March created the cup portion of an inverted cup-and-handle pattern, a bearish continuation structure.
The drop from the cup’s peak to the neckline measures 28.8%, a drop projection if the price corrects further and breaks below it. However, since hitting a war low at around $90.29, Brent has bounced into a rising channel with a 5% bounce. That channel is forming the handle of the pattern.
However, the bounce has no conviction behind it. Volume has declined steadily throughout the handle formation. The most recent candle printed just 6.88K contracts, well below the levels seen during the cup’s formation.
Open interest, the total value of outstanding futures contracts, tells a sharper story. OI peaked above 700,000 during the March rally. It has since collapsed roughly 30% to 491,810. Money, or rather traders, are actively leaving oil futures.
Want more insights like this? Sign up for Editor Harsh Notariya’s Daily Newsletter here.

The declining volume and collapsing OI together confirm that the bounce is happening on shrinking participation. Institutional capital is exiting, not entering.
BNO Options Show Conflict Insurance, Not Bullish Positioning
Options data on the United States Brent Oil Fund (BNO), an ETF that tracks Brent futures, adds another layer. On April 15, the put-call volume ratio stood at 0.13. The open interest ratio sat at 0.25. Both readings are heavily call-skewed.
That might appear bullish at first glance. However, the context changes the interpretation. These are likely conflict hedges, not directional bets. Traders appear to be buying upside calls as insurance against an escalation in the Iran blockade. The collapsing futures OI from the previous section confirms they are not betting on sustained higher prices.
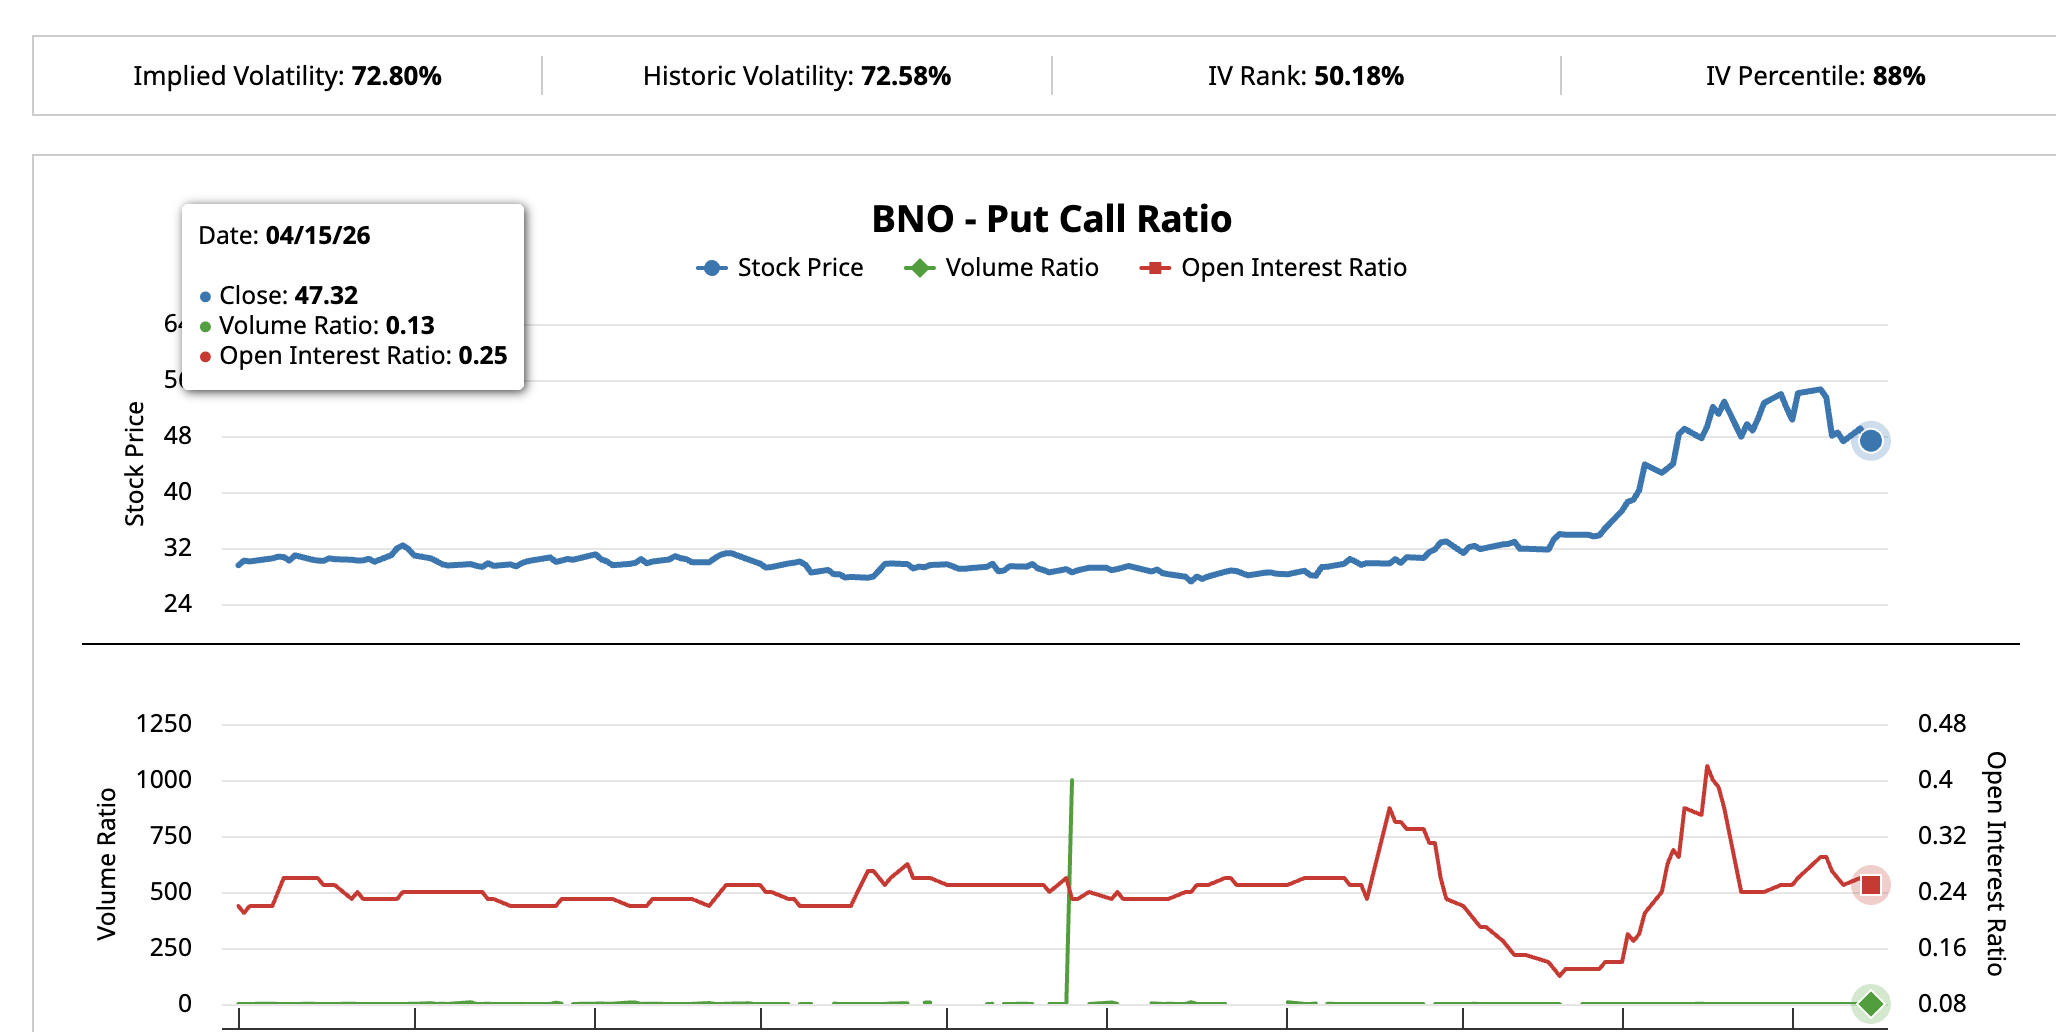
Implied volatility at 72.80% with an IV Percentile of 88% confirms the market is pricing in a large potential oil price move. Yet the IV Rank at 50.18% reveals that this level of volatility has been persistently elevated all year because of the war.
The futures market is losing participation while options traders hedge against a shock. That combination does not support a sustained recovery. Instead, it looks like a bounce-riding opportunity.
Oil Price Levels That Determine the Pattern’s Outcome
The daily Brent price chart maps where oil price resolves the pattern. Brent currently sits at $94.92. The 0.236 Fibonacci level at $97.05 is the first hurdle. A move above that would test $103.90.
However, reclaiming $103.90 alone would not invalidate the bearish structure. Only a daily close above $111.80 would confirm that oil has broken free.
Yet the downside path carries more structural support from the data. A drop below $92.81, the 0.382 Fibonacci, would break the handle. A further loss of $89.39, the 0.5 Fibonacci, would trigger the neckline breakdown.
If the breakdown confirms, the inverted cup-and-handle pattern projects a measured move of roughly 28% from the neckline. That targets the $65 zone, aligning with the $65.04 support level on the chart.
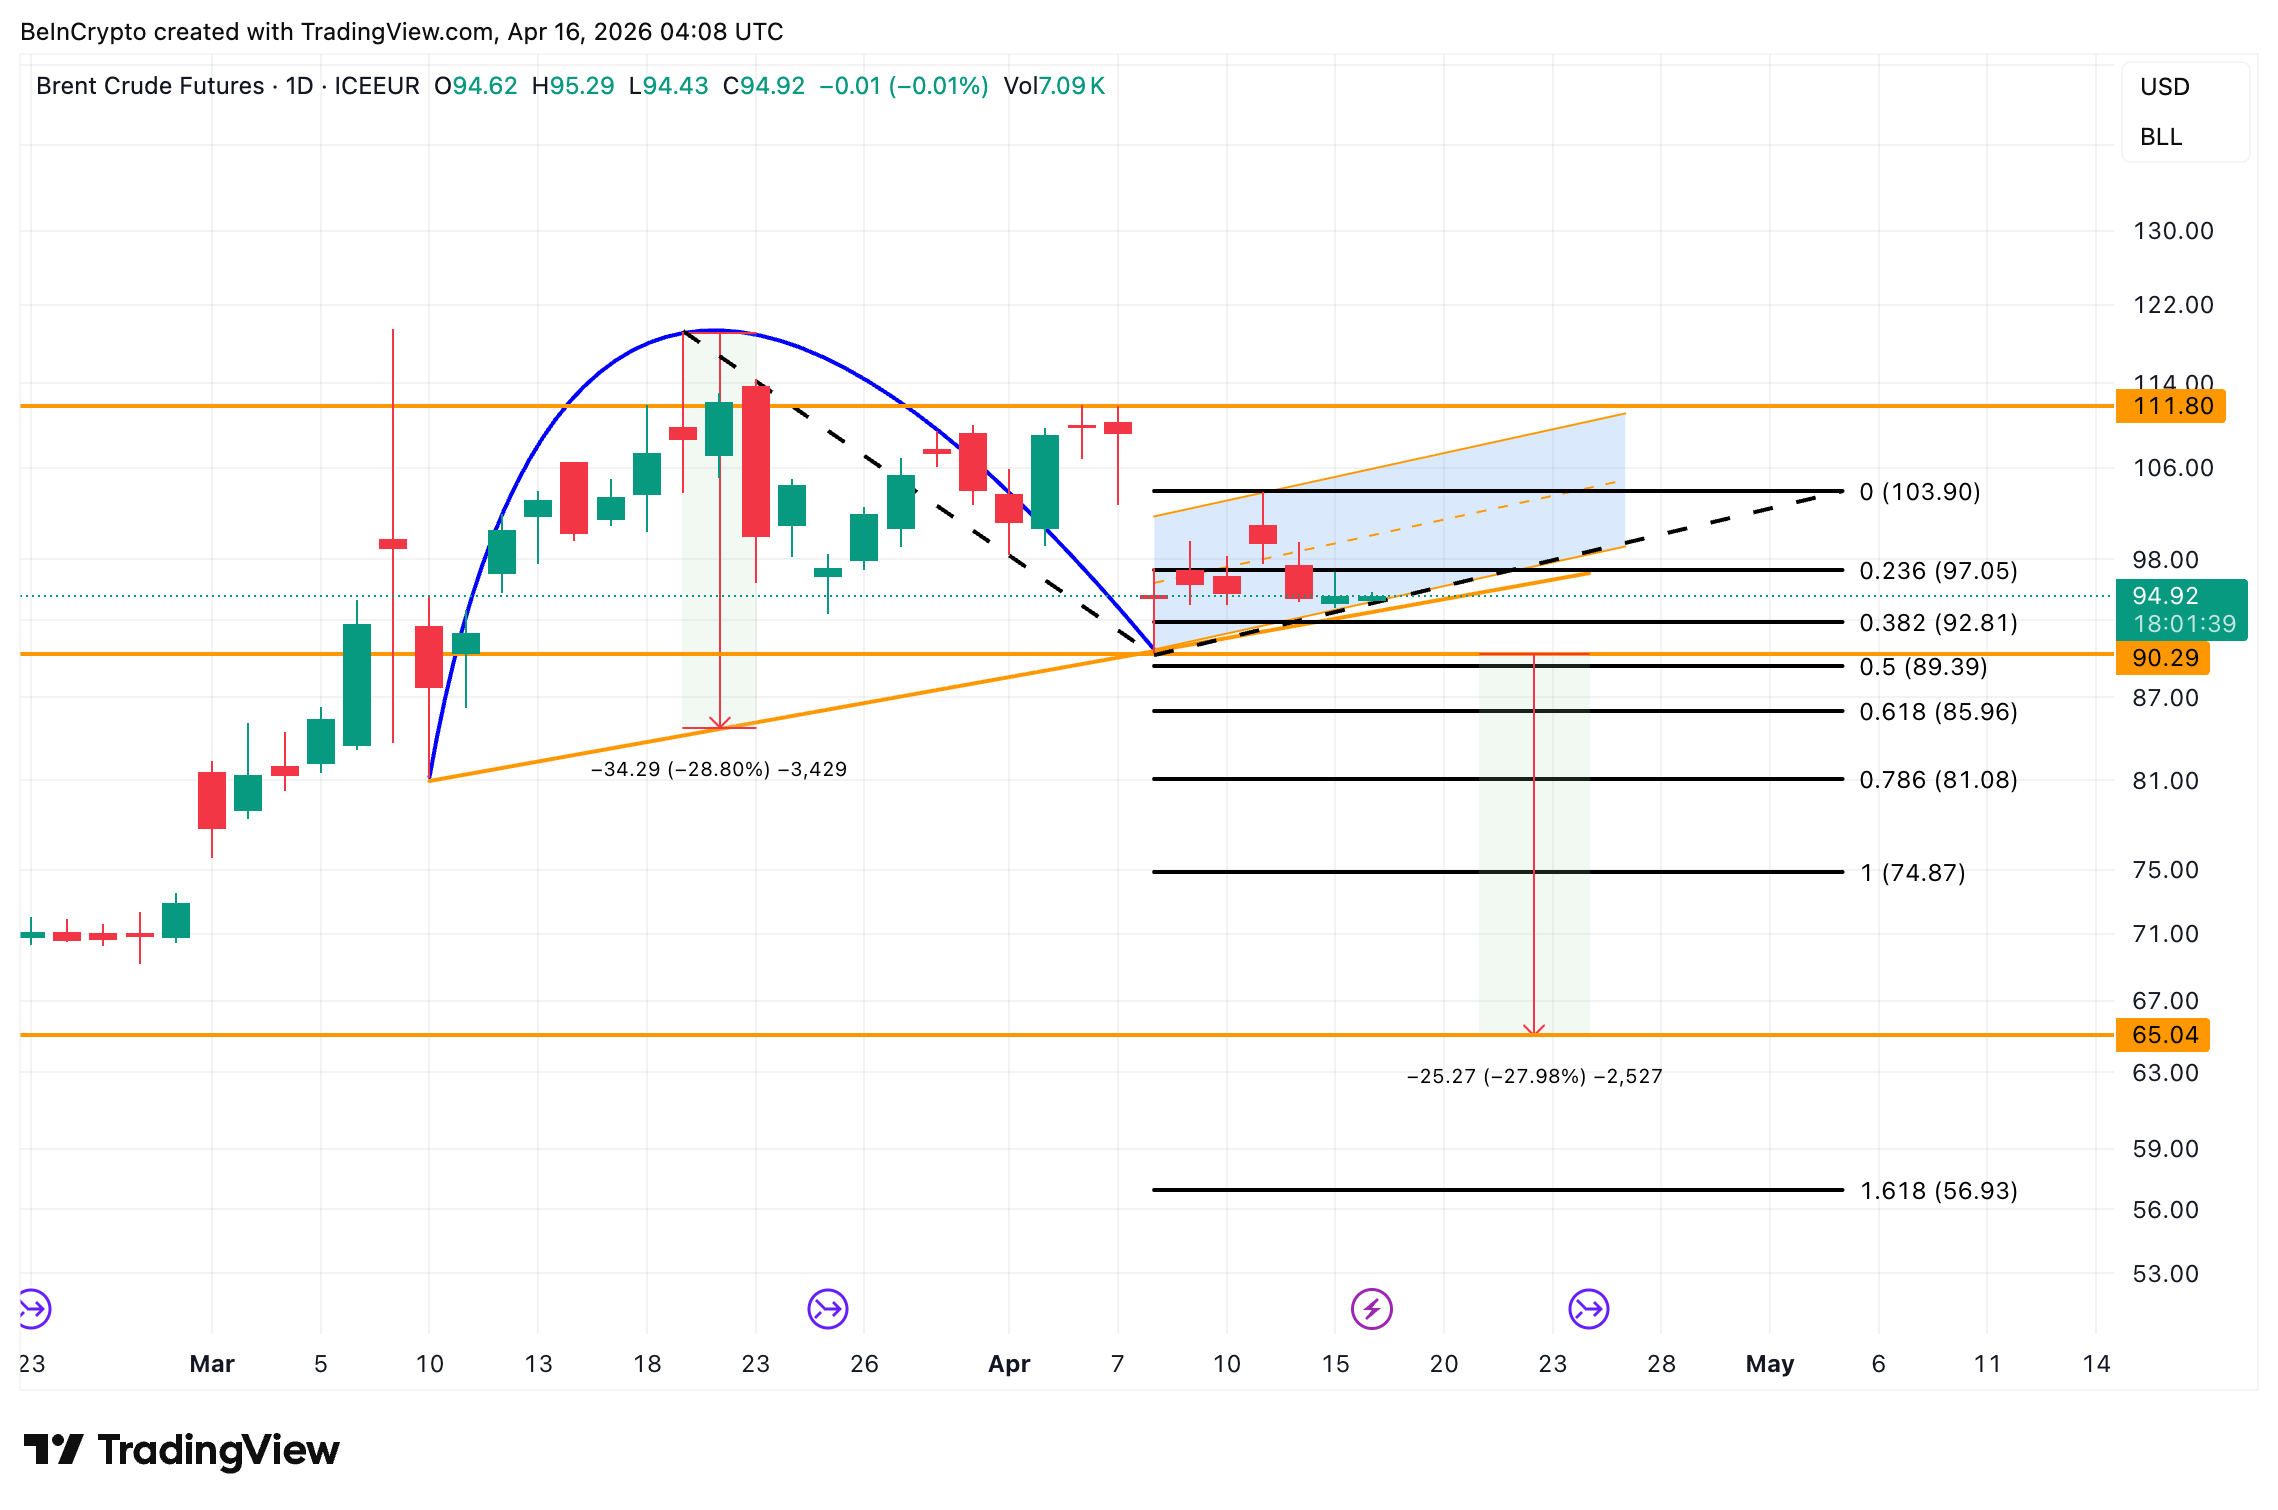
Oil price at $92.81 separates a handle that holds from a pattern that completes. A break below it opens a path toward $65. A close above $111.80 invalidates the entire bearish structure, though neither volume nor open interest currently supports that outcome.
The post Oil Price Bounced From a War Low but 30% of Traders Already Left appeared first on BeInCrypto.


Morgan Stanley’s (MS) spot bitcoin exchange-traded fund (ETF), trading under the ticker MSBT, has drawn more than $100 million in inflows within its first week on the market, signaling strong early demand for the bank’s latest push into digital assets.
The fund, which began trading on April 8, tracks the CoinDesk Bitcoin Benchmark 4 PM New York Settlement Rate and charges a 0.14% expense ratio. That makes it the cheapest product in the category, giving it a pricing edge as competition among issuers intensifies.
Still, cost is only part of the story. MSBT enters the market with a built-in distribution advantage through Morgan Stanley’s vast wealth management business, which oversees trillions of dollars in client assets. The firm’s network of financial advisors provides a direct channel to investors who may prefer gaining exposure to bitcoin through managed portfolios rather than trading on crypto-native platforms.
That reach could prove critical as the spot bitcoin ETF market matures. While MSBT’s early inflows are notable, the fund remains far smaller than BlackRock’s iShares Bitcoin Trust (IBIT), which has amassed more than $53 billion in assets since launching in January 2024 and dominates the category.
Morgan Stanley’s head of digital assets, Amy Oldenburg, said MSBT has already become the firm’s most successful ETF launch in an interview with Bloomberg.
Some analysts expect Morgan Stanley’s product to pull assets from existing funds like IBIT, particularly among clients already within its advisory ecosystem. At the same time, the firm’s entry may help expand the overall market by bringing in new investors.
Goldman filing signals broader Wall Street shift
Morgan Stanley’s move is already prompting responses from peers. Earlier this week, Goldman Sachs filed for a Bitcoin Premium Income ETF, marking one of its first direct entries into the crypto investment space. The proposed fund would use options strategies to generate income, reflecting a growing trend toward packaging bitcoin into products that produce steady cash flow rather than relying solely on price gains.
BlackRock is also preparing a similar income-focused ETF, underscoring how competition is moving beyond simple spot exposure into more structured offerings.
“The significance of Goldman’s filing is that yet another blue-blooded, old guard financial institution is acknowledging it can no longer ignore bitcoin,” Nate Geraci, president of NovaDius Wealth Management, said. “With Morgan Stanley’s recent entry into spot bitcoin ETFs, it’s becoming clear that other legacy Wall Street firms are realizing they can’t just stand pat. I wouldn’t be surprised to see firms like JPMorgan soon follow suit.”
As inflows build and new products list, Wall Street’s role in shaping how investors access bitcoin appears to be expanding quickly.

How tennis stars forced a rule change and won a fight to access their health data

UK Steel Warns Electricity Prices Now 77% Higher Than France and Germany

Justin Sun goes to war with World Liberty Financial


-

 Politics6 days ago
US brings back mandatory military draft registration
-
 Sports6 days ago
Man United discover Nico Schlotterbeck transfer fee as defender reaches Dortmund agreement
-

 Fashion6 days ago
Weekend Open Thread: Veronica Beard
-

 Politics6 days ago
Malcolm In The Middle OG Turned Down ‘Buckets Of Money’ To Appear In Reboot
-

 Politics4 days ago
World Cup exit makes Italy enter crisis mode
-

 Crypto World7 days ago
Canary Capital Files SEC Registration for PEPE ETF
-

 Business6 days ago
Tesla Model Y Tops China Auto Sales in March 2026 With 39,827 Registrations, Beating Cheaper EVs and Gas Cars
-

 Crypto World3 days ago
The SEC Conditionalises DeFi Platforms to Be Avoided for Broker Registration
-

 Crypto World3 days ago
SEC Signals Exemption for Crypto Interfaces From Broker Registration
-

 News Videos1 day ago
Secure crypto trading starts with an FIU-registered
-
 NewsBeat4 days ago
Pep Guardiola and Gary Neville agree over Arsenal title problem that benefits Man City
-

 Business6 days ago
OpenAI Halts Stargate UK Data Centre Project Over Energy Costs and Copyright Row
-

 Business5 days ago
Ireland Fuel Protests Enter Day 5 as Blockades Spark Shortages and Government Prepares Support Package
-

 Crypto World5 days ago
Federal judge blocks Arizona from bringing criminal charges against Kalshi
-

 Politics6 days ago
LBC Presenter Mocks Trump Over Iran War Failures
-

 NewsBeat2 days ago
Trump and Pope Leo: Behind their disagreement over Iran war
-
 NewsBeat4 days ago
JD Vance announces ‘no agreement’ with Iran over nuclear weapons fear
-

 Crypto World2 days ago
SEC Proposes Certain Crypto Interfaces Don’t Need to Register as Brokers
-

 Tech7 days ago
A version of Windows 10 released a decade ago is now eligible for additional security patches
-

 Business5 days ago
IMF retains floor for precautionary balances at SDR 20 billion
You must be logged in to post a comment Login