
Crypto World
Grayscale expands Q2 crypto watchlist as HYPE ETF filing gains steam


Grayscale has updated its list of digital assets under consideration for future investment products.
Summary
- Grayscale named HYPE, TON, TRX and ENA among digital assets under consideration this quarter today.
- The asset manager also filed with the SEC to launch a spot HYPE ETF.
- Zcash surged over 30% after reports linked Grayscale activity to renewed demand in markets.
The latest Q2 2026 list includes several large and emerging tokens, while a separate filing tied to Hyperliquid’s HYPE token has added more attention to the asset manager’s next product moves.
Grayscale said its latest Q2 2026 review covers digital assets it may include in future investment products. The company grouped the list under its crypto sector framework and said it plans to refresh the list as often as 15 days after each quarter ends.
The new watchlist includes CC, CELO, MNT, MON, TON, TRX, ENA, HYPE, JUP, KMNO, SYRUP, MORPHO and PENDLE. It also names other assets such as ROBO, FLOCK, GRASS, KAITO, KITE, VVV, VIRTUAL, WLD, GEOD, HNT, JTO, ZRO and W.
Grayscale said the list includes assets not yet held in its current product suite. It added that the list remains subject to change during the quarter as multi-asset funds reconstitute and as new single-asset products launch.
The company also named MegaETH, Nous Research and Poseidon with an asterisk. That suggests those projects remain under review but may not yet trade as standard liquid tokens in the same way as others on the list.
HYPE ETF filing adds new focus
Attention around the Grayscale update increased after reports said the firm filed with the US Securities and Exchange Commission for a spot HYPE ETF in March. The proposed fund would track Hyperliquid’s native token if regulators approve the product.
That filing places HYPE in two active discussions at the same time. It appears on Grayscale’s Q2 assets under consideration list, and it is also linked to a separate exchange-traded fund proposal.

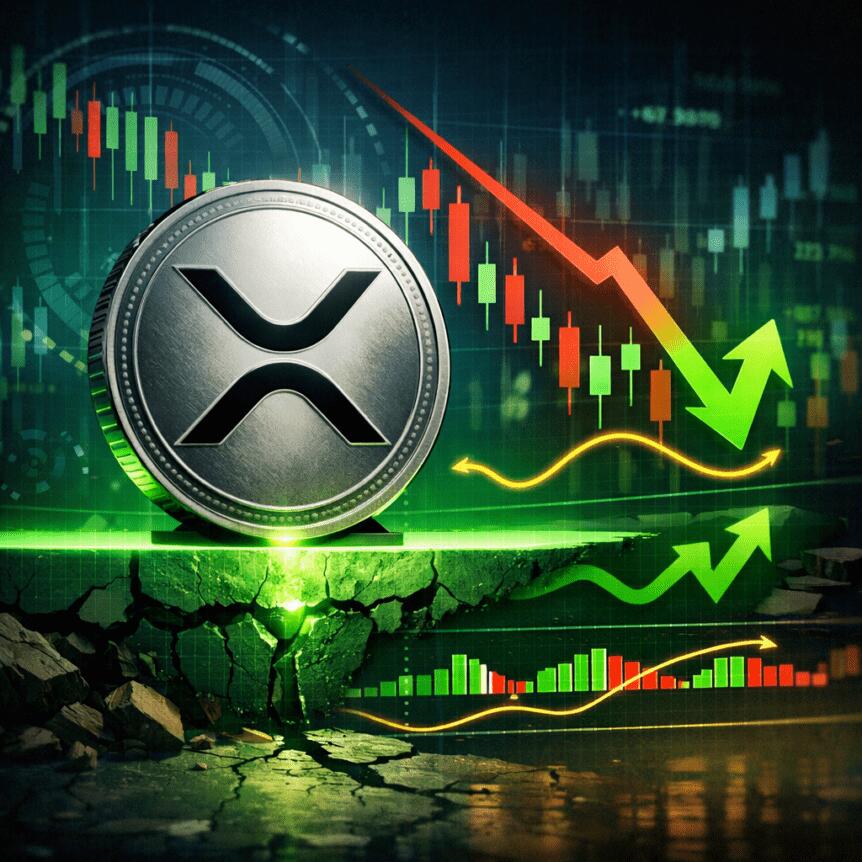
XRP’s price action has been in an extended downtrend for eight months, but a convergence of on-chain signals is drawing attention to a potential bottoming narrative. The XRP/BTC pair’s RSI sits deep in the oversold zone, with readings around 24, a level that has historically aligned with macro bottoms and subsequent recoveries. Data tracked by TradingView, and summarized in recent coverage, suggest this could be more than a temporary squeeze for the cross-pair.
Beyond the RSI, on-chain analytics are flashing a similar signal. XRP’s MVRV Z-score, a gauge that compares market value to realized value, is hovering near zero—a cadence historically associated with accumulation phases and capitulation-driven bottoms. Glassnode’s metrics indicate that such coordinates often precede meaningful rallies, echoing a pattern seen in prior cycles in 2021, 2022 and again in 2024 before pronounced upside moves.
To place these signals in a market context, a Cointelegraph chart that overlays XRP/BTC price action against the broader market shows that the last bottom in XRP/BTC around this zone in June 2025 preceded a substantial rally: a 61% rebound in the XRP/BTC ratio and a 92% surge in XRP/USD to a multi-year high of roughly $3.66. The chart’s yellow bars emphasize how these zones have repeatedly acted as macro bottoms for the XRP/BTC pair.
Key takeaways
- RSI for XRP/BTC at about 24 signals an oversold condition that historically marks macro bottoms and the start of new uptrends.
- MVRV Z-score for XRP is near zero, a level that has preceded accumulation phases and subsequent rallies in multiple prior cycles.
- Glassnode heatmaps show a substantial cost-basis distribution around the $1.30 area, with about 1.73 billion XRP bought near that price band.
- The XRP/USD price must hold above a key support zone of $1.25–$1.30; losing this zone could open a path toward a lower demand area, including the $1.15 region and the 200-week moving average.
- Historical patterns suggest that bottoms from these levels have been followed by meaningful rallies, though macro conditions and market sentiment remain critical filters.
On-chain signals point to a potential bottoming process
From a technical standpoint, XRP’s recent price action is painting a familiar picture: a prolonged downtrend cooled by deep oversold momentum. The RSI reading in the XRP/BTC pair has rarely dropped further in recent cycles without a subsequent phase of consolidation before a bounce, and in this cycle, the indicator sits at levels that have historically preceded risk-off capitulation turning into a recovery phase. While RSI alone is not a predictor, when paired with the on-chain landscape, it reinforces a stance that selling pressure might be ebbing.
Complementing the RSI, the MVRV Z-score provides a more long-horizon perspective. The score near zero implies that many investors are near breakeven and may be less inclined to rush toward the exit. That dynamic can reduce downside pressure and enable a more stable base to form, a hallmark of accumulation zones that precede rallies. The last time XRP’s MVRV Z-score revisited these levels, similar to late-2024 and early-2025, the market accrued strength before resuming gains.
Analysts have tied these signals to a broader narrative about XRP’s cycle. An observed pattern from prior cycles shows that whenever these on-chain indicators align with oversold momentum, they often pave the way for a multi-month recovery in price. This is not a forecast but a lens through which traders are evaluating risk and opportunity at current levels.
“If this zone continues to hold, then a short-term bounce towards $1.45 can’t be ruled out.”
That perspective, voiced by a trader on X, reflects a plausible near-term pathway if the current support remains intact and buyers step in at the zone around $1.25–$1.30. The emphasis is on the zone’s integrity: a sustained hold here would be a signal that demand could reassert itself and push XRP toward higher ground, even before evaluating macro catalysts.
Support, resistance, and what could unfold next
From a price-structure standpoint, the immediate floor lies in the $1.25–$1.30 band. This zone has held since early February 2026 and has acted as a crucial pivot point for the bull-bear balance. If demand persists in defending this range, a measured rebound could unfold, potentially aiming toward the $1.45 area and beyond. Traders eyeing a return to higher levels would look for a continued rejection of shorts at these thresholds, coupled with improving on-chain signals and stabilizing price action.
However, a breach below the zone would raise the risk of a more extended downside move. The next line of defense sits near the $1.15 area, where the 200-week simple moving average has hovered. A break below this level could trigger a swift re-pricing, pushing XRP toward the bear-flag target around $0.80, a level that would reframe the risk-reward for bulls in the near term. In practice, this setup makes the $1.30 region a critical fulcrum for bulls and bears alike.
Beyond the immediate levels, market observers note that the long-run trajectory will hinge on a confluence of factors: the capacity of XRP to sustain on-chain health, macro risk appetite, and regulatory developments that could influence crypto liquidity and sentiment. The broader narrative of XRP’s cycle has historically shown that bottoms in this zone have not been isolated events; they have often coincided with stronger macro flows and renewed buying interest from longer-horizon holders.
On the price trajectory, the charted path hints at upside potential if the zone holds. Prior episodes have demonstrated that a bottom in this region can coincide with a shift in momentum and a fresh phase of accumulation, eventually leading to fresh highs once the market reasserts confidence. In this context, observers see the possibility of XRP moving toward the $1.70 level or higher if buyers maintain control and the macro environment remains favorable.
Context, history, and what anchors traders are watching
Historical context matters for investors seeking to gauge risk. The rally pattern that followed the June 2025 XRP/BTC bottom—characterized by a 61% improvement in the XRP/BTC ratio and a 92% surge in XRP/USD to a multi-year high—offers a concrete example of how a bottom can translate into meaningful upside within a relatively short timeframe. While past performance is not a guarantee of future results, the alignment of on-chain signals with price action in that period reinforces a cautious optimism among market participants.
Another anchor is the cost-basis distribution. Glassnode’s heatmap shows that roughly 1.73 billion XRP were accumulated near the $1.30 price level, suggesting a robust base of investors with meaningful exposure in that band. This concentration can provide a ballast to price during volatility but may also attract selling pressure if the price falters, given the number of coins purchased at or near the same level. The dynamics underscore the importance of the $1.25–$1.30 support as both a technical and a psychology-driven threshold.
For readers seeking corroboration, the broader narrative has drawn on a mix of price charts and on-chain metrics, including references to XRP’s performance in other cycles and the behavior of the XRP/USD and XRP/BTC cross-pairs. Notably, Cointelegraph has highlighted past instances where XRP’s bottom against Bitcoin in that zone preceded sharp rallies, illustrating how cross-market relationships can amplify a rally even when the USD price remains at modest levels. These data points provide a framework for assessing risk in the current environment, rather than a single-point forecast.
What to watch next
Investors should keep a close eye on whether XRP can sustain the $1.25–$1.30 support zone in the near term. A stable hold would bolster the case for a bounce and could draw in momentum traders seeking a breakout above the immediate overheads. Conversely, a break below $1.15, with a potential retest of the 200-week moving average, would shift the outlook toward a more cautious stance and raise the odds of revisiting the lower $0.80 region.
In addition to price actions, market participants should monitor the evolving on-chain narrative around MVRV Z-scores and holder cost bases. A continued alignment between on-chain metrics and price strength would be a meaningful signal that the market is re-accumulating effectively. As always, macro conditions—liquidity, risk appetite, and regulatory clarity—will shape the pace and duration of any nascent upturn.
Readers should watch for further developments in XRP’s cross-market dynamics, including how the XRP/BTC pair behaves around the current consolidation range and whether the broader crypto market conditions provide the catalysts needed for a sustained move higher. If the zone holds and macro sentiment improves, a path toward higher levels—potentially toward the $1.70 area or beyond—could emerge as part of a broader re-pricing of risk in the months ahead.

TLDR:
- WLFI token dropped to new lows following plans to unlock tokens for early holders, raising supply concerns.
- The project is managing about $150M in stablecoin loans, increasing pressure on collateral stability.
- Reports claim billions in WLFI were used as collateral to borrow $75M within a concentrated liquidity setup.
- High pool utilization near 93% may limit withdrawals, raising concerns about liquidity access for users.
World Liberty Financial’s WLFI token has dropped to new lows amid concerns around liquidity use and governance decisions.
The decline follows reports of a planned token unlock for early holders while the project manages about $150 million in stablecoin loans.
WLFI Token Pressure Grows Amid Unlock Plans
A recent update shared on X by Coin Bureau stated that the WLFI token reached fresh lows. The drop came after the project signaled plans to unlock tokens for early holders. At the same time, it continues to defend a large stablecoin borrowing position.
The proposed unlock has raised concerns about added selling pressure. Early holders gaining access to tokens may increase circulating supply. As a result, market participants are closely watching price stability.
At the same time, the project is managing around $150 million in stablecoin loans. This creates a balancing act between maintaining collateral value and handling liquidity needs. If token prices weaken further, the position could face added stress.
The timing of the unlock proposal has drawn attention. Market conditions remain fragile, and liquidity levels appear tight. This combination has kept traders cautious as the situation develops.
Lending Activity and Liquidity Concerns Surface
Additional discussion emerged from a widely shared thread by StarPlatinum. The post described how billions of WLFI tokens were reportedly used as collateral. Around $75 million in stablecoins was borrowed through a lending protocol.
The thread claimed that WLFI accounts for about 55% of the protocol’s liquidity. This concentration raises concerns about how withdrawals may function under pressure. With nearly 93% of the stablecoin pool already utilized, available liquidity appears limited.
The structure described suggests a closed system. Tokens are deposited, borrowed against, and supported within the same ecosystem. As long as token prices hold, positions remain stable. However, any sharp decline could strain the setup.
The thread also noted links between the lending platform and individuals connected to WLFI. This has raised questions about the relationship between borrowers and infrastructure. While no formal violations were confirmed, the overlap has drawn attention.
Further attention focused on reported fund movements. Over $40 million was said to have moved to Coinbase Prime shortly before a major announcement. The timing has led to speculation, though the team has denied wrongdoing.
These developments come as liquidity conditions tighten. Retail users may face delays if withdrawal demand rises. With most funds already deployed, flexibility within the system appears limited.
Market participants continue to monitor both price action and protocol health. The combination of token unlock plans and lending exposure remains a key focus. Any changes in collateral value or liquidity could influence the next phase.
For now, the WLFI token remains under pressure. Traders are assessing risk levels while waiting for further clarity from the project. The coming updates may shape how the market responds in the short term.

Crypto World
Ethereum Tokenized Treasury Funds Surge Past $22.5B as Institutional Adoption Accelerates
TLDR:
- Tokenized treasury funds on Ethereum exceed $22.5B, dominating 71.9% of blockchain fund markets globally.
- JPMorgan, BlackRock, and Franklin Templeton expand on-chain funds, increasing institutional capital flow.
- Market growth accelerated sharply after 2024, rising from $10B to over $20B within a short timeframe.
- Ethereum evolves into a key platform for tokenized money markets and short-term yield instruments.
Tokenized treasury funds on Ethereum have climbed past $22.5 billion, according to data shared by Token Terminal.
The chart tracks steady growth since 2021, with recent expansion tied to institutional activity and new on-chain money market products.
Institutional Capital Drives On-Chain Treasury Growth
A tweet from Etherealize noted that tokenized treasury products now dominate blockchain-based fund markets. Ethereum accounts for 71.9% of total tokenized fund assets across networks. The data places the network at the center of institutional-grade capital flows.
Recent entries from major financial firms support that trend. JPMorgan launched its MONY market fund on Ethereum in early 2026. It joined offerings from BlackRock and Franklin Templeton, both already active on-chain.
These products replicate traditional money market exposure using blockchain rails. They provide yield-bearing instruments accessible without brokerage accounts. As a result, they align with the needs of automated capital systems operating on-chain.
The chart shows a sharp rise in total value after these institutional entries. Assets moved from roughly $10 billion to above $20 billion within a short period. The upward move coincides with broader adoption of tokenized treasuries and short-duration instruments.
Moreover, the presence of established financial institutions signals a shift in how capital interacts with blockchain infrastructure. Traditional funds now operate within permissionless systems, expanding access to liquidity tools.
Market Structure Shifts From Experimentation to Expansion
The Token Terminal chart outlines a multi-year transition in tokenized fund adoption. Early activity between 2021 and 2022 remained limited, with total value declining below $1 billion. That phase reflected early testing and low institutional participation.
Conditions changed during late 2022 and 2023. The market formed a base between $0.5 billion and $2 billion. Gradual growth during that period indicated early infrastructure readiness for tokenized financial products.
Momentum accelerated through 2024 and early 2025. Total value broke past $5 billion, then $10 billion, marking a clear structural shift.
Growth during this stage followed a steeper trajectory, supported by increasing adoption of real-world asset tokenization.
By 2025, expansion entered a faster phase. The chart shows a move from $10 billion to over $20 billion, with a brief pullback near $18 billion. The recovery that followed pushed totals to approximately $22 billion.
Key structural levels appear across the timeline. The $10 billion mark acted as a major breakout point. Meanwhile, the $20 billion range serves as a psychological threshold tied to liquidity expansion.
The data also points to Ethereum’s evolving role in financial markets. The network now supports large-scale treasury operations, moving beyond its earlier use cases. This shift reflects growing demand for on-chain yield and capital efficiency.
At the same time, tokenized funds continue to expand across treasury bills and money market structures. These instruments offer stability while maintaining blockchain accessibility. As adoption grows, the chart suggests continued alignment between traditional finance and decentralized infrastructure.
TLDR:
- Ethereum trades between $2.1K and $2.3K as momentum indicators turn bullish after February’s sharp market correction.
- RSI climbs above 60 and MACD shows a bullish crossover, signaling improving momentum in Ethereum’s daily chart.
- CryptoQuant data shows ETH benefiting from capital inflows and tightening supply during the current market phase.
- Whale accumulation pace is slowing, suggesting the accumulation phase may be ending before a possible rally.
Ethereum is showing early recovery signs after months of decline, as recent data points to renewed market activity and stabilizing price action.
Analysts note a shift in momentum, although price remains within a tight range below key resistance levels.
Ethereum Shows Early Recovery as Momentum Indicators Turn Positive
CryptoQuant noted that Ethereum is currently benefiting from capital inflows, reduced supply pressure, and steady ecosystem growth. These combined factors are positioning ETH as relatively stronger during the current market phase.
At the same time, market data shows Ethereum rebounding from its February lows near the $2,000 level. Price action has since stabilized between $2,150 and $2,300, forming a consolidation range. The latest daily candle closed at $2,243.7, reflecting a modest gain of 2.46%.
Technical indicators are also shifting. The Relative Strength Index is now at 60.05, moving above the neutral 50 level. This change signals improving momentum after rebounding from oversold conditions seen earlier in the year.
In addition, the Moving Average Convergence Divergence indicator has turned positive. The MACD line remains above the signal line, while the histogram continues expanding in positive territory. This pattern reflects strengthening bullish momentum after a prolonged bearish phase.
Despite these developments, Ethereum remains below immediate resistance between $2,250 and $2,300. A sustained move above this zone is still required to confirm a broader recovery trend. Until then, the price continues to trade within a defined range.
Whale Activity Slows as Market Watches for Next Direction
While indicators suggest improving conditions, whale behavior is showing a different pace. According to CW, the rate of Ethereum accumulation by large holders is slowing. This shift may signal the end of the recent accumulation phase.
Historically, accumulation phases often precede upward price movements. However, they can also mark transition points where large holders begin distributing assets at higher levels. This creates uncertainty around the next market direction.
At the same time, Ethereum’s broader trend remains influenced by its earlier decline from near $5,000 in August 2025. The asset experienced consistently lower highs and lower lows before reaching its February bottom. That larger trend still frames current price action.
Support levels remain firm around $2,100, with the $2,000 level acting as a psychological floor. On the upside, resistance extends beyond $2,300 toward $2,800 and $3,000, where previous breakdowns occurred.
For now, Ethereum continues to move sideways within its current range. This phase reflects a balance between recovering demand and cautious market sentiment. Traders are closely watching for a breakout or rejection at nearby resistance.
As conditions evolve, Ethereum’s next move will likely depend on whether buyers can sustain momentum above current levels. Until then, consolidation remains the dominant structure in the short term.
TLDR:
- Japan proposes classifying crypto assets under financial law to align them with traditional market regulations.
- A flat 20% crypto tax replaces higher rates, while allowing traders to carry losses forward for three years.
- Insider trading rules will now apply to crypto, aiming to improve fairness and transparency in trading activity.
- Banks may soon offer crypto custody services, while new rules could support the launch of spot crypto ETFs.
Japan is moving to reshape its crypto sector through a new legal framework that places digital assets under financial regulation.
The proposed bill introduces trading rules, tax changes, and institutional access, marking a shift in how the country manages crypto markets.
New Legal Structure for Crypto Markets
Japan’s Financial Services Agency has submitted a bill that classifies cryptocurrencies as financial instruments. This move places digital assets under the Financial Instruments and Exchange Act. As a result, crypto trading will follow rules similar to traditional financial markets.
The update gained wider attention after a post shared by Crypto Patel on X outlined the key changes. The tweet described new restrictions, disclosure rules, and tax adjustments tied to the proposed legislation. It also pointed to broader institutional participation in crypto markets.
One major update involves a ban on insider trading related to cryptocurrencies. This rule aligns crypto markets with existing financial regulations that govern stocks and other assets. It aims to reduce unfair trading advantages and increase trust among participants.
At the same time, the bill requires disclosures for 105 tokens, including Bitcoin and Ethereum. These disclosures are expected to improve transparency and provide clearer information for investors. Market participants will have access to standardized data, which may support more informed decisions.
The classification of crypto as a financial instrument also signals stricter oversight. Exchanges and related service providers may need to adjust operations to meet regulatory standards. This includes compliance measures tied to reporting and investor protection rules.
Tax Reform and Institutional Access
The proposed framework introduces a flat 20% tax on crypto gains, replacing rates that previously reached up to 55%. This change simplifies the tax structure and aligns it more closely with traditional investment taxation.
In addition, traders will be allowed to carry forward losses for up to three years. This provision offers flexibility for those managing volatile portfolios. It also brings crypto taxation closer to systems used in equity markets.
Another key point from the shared tweet is the potential for banks to hold and custody cryptocurrencies. If approved, this would allow financial institutions to directly engage with digital assets. It may also expand services available to both retail and institutional clients.
The bill also opens the possibility for more spot crypto exchange-traded funds. These products could provide regulated exposure to digital assets through traditional investment channels. This development may attract new participants who prefer structured financial products.
Taken together, these changes show a coordinated effort to integrate crypto into Japan’s financial system. Regulatory clarity, tax adjustments, and institutional access are all addressed within the same framework.
The proposed law now awaits parliamentary review, where further discussions may shape its final form. Market participants are closely watching the process as Japan refines its approach to digital asset regulation.

A planned $1.6 billion SPAC merger between Dynamix Corporation (DYNX) and crypto firm The Ether Machine has been terminated, over unfavorable market conditions, The Ether Machine said Friday.
The agreement, first unveiled in July 2025, aimed to take ether (ETH) treasury firm The Ether Machine public on Nasdaq under the ticker ETHM.
The company is designed to act as an Ethereum treasury and yield vehicle, generating returns through staking and decentralized finance strategies while holding large reserves of ether. It currently holds 496,712 ETH worth more than $1.1 billion, according to CoinGecko data.
Initially, the deal stood out for its scale. It included a $1.5 billion fully committed PIPE financing deal, described as the largest all-common-stock raise of its kind since 2021, alongside roughly $170 million held in Dynamix’s trust account.
The combined company was expected to launch with more than 400,000 ETH on its balance sheet, backed in part by a contribution from co-founder Andrew Keys.
The merger has now been called off due to what the companies described as unfavorable market conditions. According to The Ether Machine, the two firms “mutually agreed to terminate” the deal. As part of the termination agreement, Dynamix will receive a $50 million payment within 15 days, according to a filing with the U.S. Securities and Exchange Commission (SEC).
Crypto World
The crypto honeymoon is over for now as analysts warn of a major first-quarter profit squeeze


Crypto trading has cooled in early 2026, and Wall Street analysts are racing to adjust their forecasts before companies report first-quarter earnings.
New research from Barclays and Oppenheimer shows multiple analysts are reaching similar conclusions, a few weeks into the second quarter. Expectations are coming down across the sector as trading volumes weaken and earlier projections look too optimistic.
Barclays took the most direct step, downgrading Coinbase (COIN) and warning that “global crypto trading activity has declined to a level not seen since the end of 2023.” The bank added that “absent a resurgence in near-term crypto trading activity, we see profitability under pressure at Coinbase.”
The slowdown is visible in the data. Coinbase’s March trading volume marked “the lowest volume month since September 2024,” Barclays wrote, with April showing “no signs of improvement.” For the first quarter, the bank estimates volumes fell roughly 30% from the prior quarter.
Coinbase and other exchanges charge fees on each transaction they facilitate, meaning lower volumes will lead to less revenue.
The mechanics are straightforward. When markets turn quiet, many traders step back. A retail user who once traded weekly during a rally may stop altogether when prices flatten. Multiply that behavior across millions of accounts, and exchange volumes drop quickly.
That matters because transaction fees remain the main revenue driver for most crypto platforms. Barclays underscored this risk, saying its forecast for Coinbase’s adjusted EBITDA is about 24% below the Street, driven largely by weaker spot trading and retail activity.
Crypto prices have pulled back in the first quarter, with the average price of major tokens falling sharply quarter-over-quarter. Bitcoin lost over 22% of its value in the first quarter of this year, while ether was down 29%.
Oppenheimer struck a similar tone but kept a more upbeat stance on Coinbase. The firm said it is cutting its forecasts due to softer crypto prices and lower trading activity in the first quarter, driven in part by broader economic uncertainty. It also noted that current Wall Street estimates still do not fully reflect the drop in trading volumes during that period.
That lag is now being corrected.
Across the industry, analysts are revising models downward to reflect a quieter market.
Oppenheimer cut its Coinbase volume estimate to $211 billion for the quarter, down from $244 billion previously, and now expects total revenue of $1.48 billion, below prior forecasts and consensus.
The reset is not limited to Coinbase. Oppenheimer said that Circle (CRCL) continues to expand the USDC stablecoin network, with stablecoin market cap and USDC transfer volume rising about 1% and 12% quarter over quarter, respectively.
Crypto platform Bullish (BLSH), the owner of CoinDesk, saw “strong on platform activity” tied to volatility in February, though spot volumes still missed expectations. As a result, Rosenblatt downgraded BLSH earlier this week while Compass Point downgraded CRCL — to “neutral” and “sell,” respectively.
Even these pockets of strength highlight the broader issue: the core business of crypto trading is slowing.
Efforts to diversify revenue streams are underway but may take time to offset the downturn. Coinbase’s push into becoming what it calls an “everything exchange” includes derivatives, tokenized assets and new markets. Barclays was skeptical, writing that the strategy is “likely to take a long time to pay off” and that it sees “little ‘right to win’ in new asset classes like equities.”
Stablecoins, often seen as a steadier revenue stream, also face uncertainty. Barclays pointed to ongoing debate in Washington over regulation, noting that the status of stablecoin rewards “remains in question.” At the same time, Oppenheimer sees near-term support from new use cases, saying “increased prediction market activity could support USDC growth.”
Still, those areas remain secondary to trading.
The broader takeaway is that analysts are moving preemptively. With earnings season approaching, firms are lowering estimates now rather than risk being caught off guard by weak results later.
Coinbase reports second-quarter earnings on May 7 and Bullish reports on April 23. Circle has not yet announced a date.
TLDR:
- The S&P 500 gained 7.6% over seven sessions, marking its longest winning streak since October 2025.
- Similar rallies since the 1950s occurred only nine times, showing how rare such strong momentum phases are.
- Historical data shows the index rose in 8 of 9 cases one month later, averaging a 4.4% return.
- Over three months, markets advanced in most cases, delivering an average gain of 10.2% after similar rallies.
The US stock market has recorded a rare seven-day winning streak, with major indices recovering most recent losses.
Data shows the rally ranks among the strongest seen in decades, drawing attention to historical trends that often follow similar moves.
Historic Winning Streak Signals Strong Market Momentum
According to a recent post by The Kobeissi Letter on X, the S&P 500 closed higher for seven straight sessions. This marks its longest winning streak since October 2025.
During this period, the index advanced by 7.6%, nearly reversing losses linked to earlier geopolitical tensions.
The Nasdaq Composite has mirrored this performance. It also logged a seven-day streak, its longest since August 2025. The synchronized move across major indices reflects broad-based buying activity rather than isolated sector gains.
Carson Investment Research data, shared within the same post, places this rally in a wider historical context. Since the 1950s, similar seven-day runs with gains above 7.0% have occurred only nine times. Such occurrences remain rare, which often draws attention from market participants tracking historical patterns.
The recovery comes after a period of volatility tied to global uncertainty. Over recent sessions, equities have shown steady upward movement. This has helped restore confidence levels seen before the earlier decline.
Historical Data Points to Continued Uptrend
Past performance following similar rallies offers additional context. Data shows that in eight of the nine previous cases, the S&P 500 moved higher over the next month. On average, returns reached 4.4% during that timeframe.
The trend also extends into a longer horizon. Over three months, the index recorded gains in seven instances. The average return during those periods stood at 10.2%, based on the same dataset.
These figures, cited in The Kobeissi Letter’s post, present a consistent pattern. Strong short-term rallies have often been followed by continued upward movement in the months that follow.
While each market cycle differs, the historical record remains a reference point for tracking momentum. The current rally, based on available data, aligns with previous periods of sustained growth.
At the same time, markets continue to respond to evolving macro conditions. Recent price action shows that buyers have regained control after earlier selling pressure. This shift has supported the ongoing recovery across key indices.
TLDR:
- March CPI rose 0.9% MoM, driven largely by a sharp surge in energy and gasoline prices
- Core CPI remained steady at 0.2%, showing limited inflation spread beyond volatile sectors
- Energy prices jumped 10.9%, with gasoline rising 21.2%, dominating overall inflation movement
- Stable core data supports a cautious Fed stance as markets await clearer signals in April data
The latest U.S. inflation data for March showed a sharp monthly increase, driven mainly by rising energy prices. While headline figures moved higher, core inflation remained stable, suggesting price pressures have not fully spread across the broader economy.
Energy Drives Sharp Monthly Inflation Increase
Recent data shared by analyst Darkfost on X pointed to a strong rise in March inflation readings. Headline CPI rose 0.9% month-over-month, compared to 0.3% in February. This figure also came slightly above expectations of 0.8%.
Yearly, CPI reached 3.3%, up from 2.4% previously. The reading also came just above the forecast of 3.2%. This marks the fastest monthly increase since June 2022, signaling a sudden pickup in price levels.
The primary driver behind this increase was energy. Energy prices climbed 10.9% during the month. Gasoline prices alone surged by 21.2%, accounting for most of the upward movement.
At the same time, food prices showed no change during the period. This contrast indicates that the rise in inflation was not broad-based. Instead, it remained concentrated in a single sector.
This pattern suggests that external factors, including ongoing geopolitical tensions, are influencing energy costs. As a result, inflation readings for March reflect a reaction to those conditions rather than a widespread shift across all categories.
Core Inflation Signals Limited Broader Pressure
Core CPI, which excludes food and energy, remained relatively stable during March. It increased by 0.2% month-over-month, unchanged from February. This was also below the forecast of 0.3%.
Every year, core CPI came in at 2.6%, slightly above the previous 2.5%. However, it remained below expectations of 2.7%. These figures indicate that underlying inflation trends are not accelerating at the same pace as headline numbers.
This gap between headline and core data suggests that inflation has not deeply spread across the economy. Instead, it remains tied to energy-related movements, which can often be volatile and short-term.
According to the analysis shared in the tweet, this distinction is important for assessing future policy direction. If inflation remains concentrated in energy, it may not require immediate action from policymakers.
As a result, attention now shifts to upcoming data releases. April’s CPI figures are expected to provide further clarity on whether price pressures begin to extend beyond energy.
For now, the Federal Reserve is likely to maintain its current stance. A wait-and-see approach remains consistent with recent behavior, especially given the mixed signals within the data.
The coming months will determine whether inflation stabilizes or begins to spread more widely. Until then, markets will continue to monitor energy trends and their influence on overall price movements.


Emirates Global Aluminium (EGA), the Middle East’s biggest aluminium producer, has paused some of its supply contracts.
Bloomberg reports this happened after Iranian missiles and drones damaged its main Al Taweelah smelter on March 28.
Gulf Aluminium Crisis Deepens
Force majeure is a legal term (French for “superior force”) that refers to unforeseeable, extraordinary events beyond a party’s control, such as wars, natural disasters, or pandemics, that prevent a party from fulfilling a contract.
When a company “declares force majeure,” it’s essentially telling its customers: “Something catastrophic happened that we couldn’t predict or prevent, so we legally cannot deliver what we promised, and we shouldn’t be held liable for it.”
“The force majeure on some contracts was outlined in documents seen by Bloomberg News,” the outlet reported.
Al Taweelah, located in Abu Dhabi’s Khalifa Economic Zone, ranks among the world’s largest smelters. The Iranian strikes inflicted damage that EGA says could take up to 12 months to repair.
The move signals a prolonged disruption to a facility that produced 1.6 million tonnes of cast metal in 2025. The attack came in retaliation for US and Israeli attacks on Iranian industrial infrastructure.
“Metal solidified inside the smelting circuits, causing significant damage. The company has said restoration could take up to 12 months,” Drop Site reported.
Follow us on X to get the latest news as it happens
EGA is not alone. Aluminium Bahrain (Alba) shut down three aluminium smelting lines in early March after the closure of the Strait of Hormuz halted shipments. It was also a target of the Iranian strike.
Meanwhile, Qatar’s Qatalum was also forced to halt operations in March after QatarEnergy suspended LNG production following strikes on its energy infrastructure. Together, Gulf producers represent about 9% of global primary aluminium output.
“Aluminium is used in everything from airplanes to food packaging and solar panels, meaning disruptions ripple far beyond the metals market. This is no longer just an energy crisis, it is an industrial one,” Global Markets Investor wrote.
Why This Matters Beyond Commodities
Wood Mackenzie estimates the Middle East conflict could remove 3 to 3.5 million tonnes of aluminium output in 2026 from a global market that produced just under 74 million tonnes last year. London Metal Exchange aluminium prices have surged past $3,500 per tonne, approaching four-year highs.
Goldman Sachs has warned prices could reach $3,600 if regional production losses persist, while Kpler analysts say further escalation could push prices toward $4,000.
The West Point Modern War Institute described aluminium as a “foundational material” for defense and industrial infrastructure, noting that the US depends on Middle Eastern sources for 22% of its aluminium imports. LME warehouse inventories have fallen roughly 60% since May, leaving minimal buffers against further shocks.
For the broader economy already rattled by surging oil prices, disrupted shipping lanes, and mounting crises tied to the Iran conflict, the aluminium squeeze adds another layer of inflationary pressure. The supply crunch compounds cost pressures on industries from aerospace to automotive manufacturing that rely on Gulf-sourced premium aluminium.
As discussions continue, all eyes remain on whether the ceasefire holds and the Strait of Hormuz reopens fully. The outcome will determine how deep the aluminium deficit grows and how far prices climb in the months ahead.
Subscribe to our YouTube channel to watch leaders and journalists provide expert insights
The post Iran War Triggers Aluminium Supply Crisis in the Gulf appeared first on BeInCrypto.
Alexander Zverev shows his frustration against Jannik Sinner with angry complaint to box in Monte-Carlo SF

Meta’s Superintelligence Labs debuts first product Muse Spark

Phone + $500 = Make as Money as you want – Mark Cuban #markcuban


-

 Business6 days ago
Three Gulf funds agree to back Paramount’s $81 billion takeover of Warner, WSJ reports
-

 Sports7 days ago
India men’s 4x400m and mixed 4x100m relay teams register big progress | Other Sports News
-

 Politics23 hours ago
US brings back mandatory military draft registration
-

 Fashion24 hours ago
Weekend Open Thread: Veronica Beard
-

 Tech4 days ago
How Long Can You Drive With Expired Registration? What Florida Law Says
-

 Business6 days ago
No Jackpot Winner, Prize to Climb to $231 Million
-

 Fashion5 days ago
Massimo Dutti Offers Inspiration for Your Summer Mood Board
-
 Sports1 day ago
Man United discover Nico Schlotterbeck transfer fee as defender reaches Dortmund agreement
-

 Fashion4 days ago
Let’s Discuss: DEI in 2026
-

 Crypto World3 days ago
Bitcoin recovers as US and Iran Agree a Ceasefire Deal
-

 Crypto World2 days ago
Canary Capital Files SEC Registration for PEPE ETF
-

 Politics2 days ago
Malcolm In The Middle OG Turned Down ‘Buckets Of Money’ To Appear In Reboot
-

 Business21 hours ago
Tesla Model Y Tops China Auto Sales in March 2026 With 39,827 Registrations, Beating Cheaper EVs and Gas Cars
-

 Business7 days ago
Akebia Therapeutics, Inc. (AKBA) Discusses Pipeline Progress and Strategic Focus on Kidney Disease Treatments at R&D Day – Slideshow
-

 Business1 day ago
OpenAI Halts Stargate UK Data Centre Project Over Energy Costs and Copyright Row
-

 Tech5 days ago
Haier is betting big that your next TV purchase will be one of these
-

 Tech5 days ago
Gamer Restores the Original PlayStation Portal From Two Decades Ago
-

 Tech5 days ago
Samsung just gave up on its own Messages app
-

 Business1 hour ago
Ireland Fuel Protests Enter Day 5 as Blockades Spark Shortages and Government Prepares Support Package
-

 Tech5 days ago
The Xiaomi 17 Ultra has some impressive add-ons that make snapping photos really fun
You must be logged in to post a comment Login