

Crypto World
Harvard Picks ETH USD After Trimming Bitcoin ETF Exposure

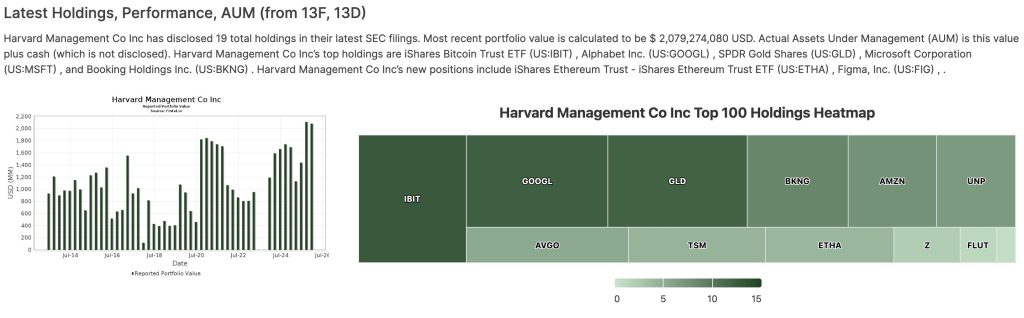
Harvard, one of the world’s most prestigious Universities, just trimmed its Bitcoin ETF position by roughly $72M and rotated the capital into Ethereum.
SEC filings show the Univertisities $57Bn endowment cut its stake in BlackRock’s IBIT in Q4 2025, while initiating an $86.8M position in iShares Ethereum Trust (ETHA).
— That Martini Guy ₿ (@MartiniGuyYT) February 16, 2026
 CHECK THIS
Harvard just moved from Bitcoin to Ethereum
The prestigious US university sold about 21% of its Bitcoin ETF and used some of that cash to buy $87 million in an Ethereum ETF pic.twitter.com/3vf02zyGzH
This move plays into the growing sentiment in the market that ETH USD represents a stronger conviction play in 2026, driven by continued network upgrades and consistent institutional adoption from some of the world’s biggest firms.
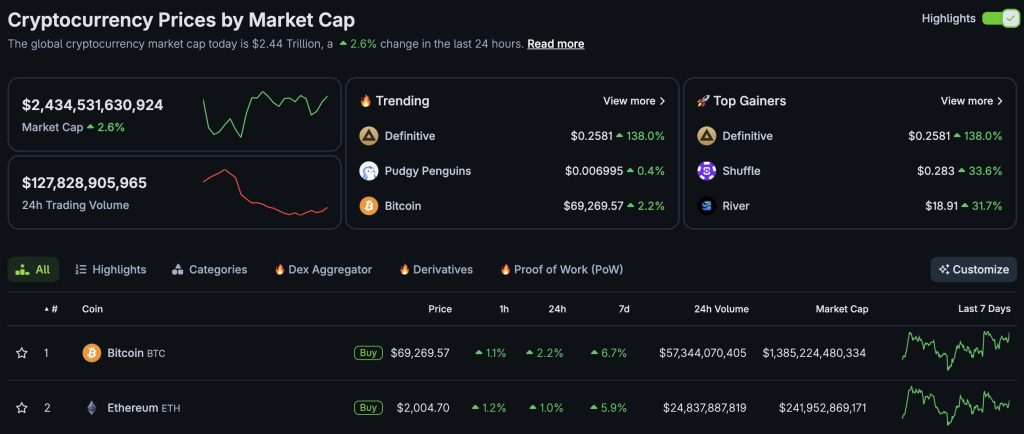
It comes as the total crypto market cap climbed 2.6% overnight and is back above $2.4 trillion, with Bitcoin price and Ethereum USD reclaiming key levels at $69,000 and $2,000, respectively.
Q4 Filing Shows $72M Bitcoin ETF Trim, $86.8M Ethereum Add
The changes from America’s most prestigious University were disclosed in an SEC Form 13F filed on February 13, covering the quarter ended December 31, 2025.
Harvard Management Company cut its IBIT stake to 5,353,612 shares, valued at $265.8M at year-end prices. That’s down from the prior quarter, equating to roughly $72M in net sales based on IBIT’s December 31 close of $49.65.
At the same time, the endowment initiated a 3.87M-share position in ETHA, valued at $86.8M. It’s Harvard’s first disclosed allocation to an Ethereum ETF since US spot ETH products launched in mid-2024.
Bitcoin remains the largest single disclosed equity holding in the University’s 13F portfolio, still larger than positions in Google, Microsoft, or Amazon, highlighting the University’s firm belief in Bitcoin’s long-term prospects and now in Ethereum’s.
EXPLORE: Best Crypto Presales to buy in 2026
What Does Harvard’s Rotation from Bitcoin ETF to Ethereum Signal for Institutions and Everyday Investors?
The main takeaway is simple: Harvard is rotating from its Bitcoin ETF exposure and into Ethereum USD. It is yet another institution betting on ETH being the stronger play for the foreseeable future.
However, another angle with this story is diversification within crypto, not away from one particular asset. Even after the trim, combined exposure sits at $352.6M.
You don’t have to be an ETH bull or BTC maxi to acknowledge that it’s a meaningful crypto allocation for a conservative endowment, regardless of your allegiance, and this comes from someone who is a huge Ethereum maxi.
The structure also matters. Crypto now represents about 12.8% of Harvard’s reportable US equity holdings. That’s not experimental sizing; it highlights the University’s firm belief in digital assets.
Why is Ethereum Being Seen as the Golden Ticket in 2026?
— Blockchain Daily News (@blckchaindaily) March 2, 2026
BREAKING: BITMINE BOUGHT 50,928 ETH LAST WEEK AT $1,976; HOLDS 4,473,587 ETH; TOTAL ASSETS $9.9B AS OF MAR 1, 2026 pic.twitter.com/CLH1CrCyCY
Meanwhile, institutional Ethereum interest is building elsewhere. Public companies are adding ETH to treasuries, as seen in BitMine’s recent allocation, where shares jumped after the firm expanded its ETH holdings.
On-chain data also shows large holders accumulating during drawdowns, according to recent analysis of whale and RWA flows.
Fidelity, a $5.9 trillion asset manager, also recently launched its own stablecoin on Ethereum, one of many TradFi giants that have chosen the Vitalik Buterin-led network for their products.
This is the broader trend right now: Bitcoin as a macro reserve asset and Ethereum as the number one growth-layer infrastructure.
Bitcoin Price and Ethereum USD Price Levels: Key Zones After Q4 Volatility
Bitcoin is currently trading near $69,300 after a sharp retracement from its $126,000 October 2025 high. The $60,000–$62,000 zone remains structural support and has remained intact so far. However, a loss of that magnitude could quickly bring $52,000 into view.
On the upside, $72,000 is the first significant resistance. Reclaim that with volume, and the market likely moves toward $80,000 next. No follow-through, and it will likely spell a period of the Bitcoin price staying range-bound for some time.
Ethereum USD, meanwhile, trades just over $2,000 after a roughly -30% correction in Q4. The $1,800 level is the line in the sand. It has held throughout all of this ongoing volatility, and if $2,000 can hold, $2,400 is back on the table.
DISCOVER: Next Crypto to Explode in 2026
The post Harvard Picks ETH USD After Trimming Bitcoin ETF Exposure appeared first on Cryptonews.


Institutional capital just returned to Bitcoin (BTC) with a vengeance, with ETFs and treasure companies helping to snap a volatility streak that had tested industry supporters’ conviction.
In a coordinated surge of demand, US Bitcoin ETFs and MicroStrategy combined to absorb over $1.7 billion in supply within a single week. No retail hype cycle. Just size moving in.
This aggressive institutional buying hits the market at a critical technical juncture. After months of chop, the sudden injection of liquidity signals a potential regime change for the asset class. However, price action remains compressed, raising the stakes for the next major resistance test.
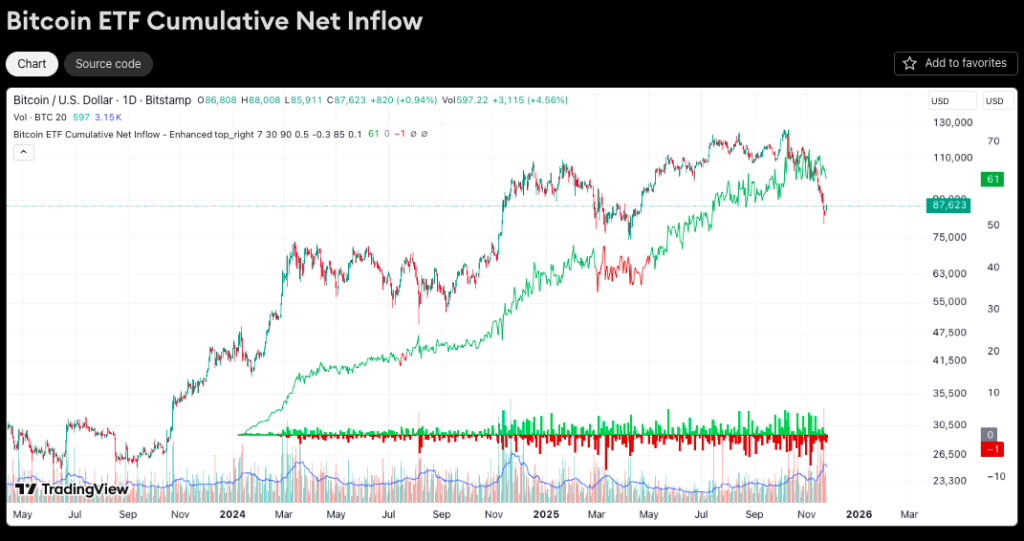
- US Bitcoin ETFs recorded $1.1 billion in net inflows over barely three trading sessions, with BlackRock’s IBIT capturing 57% of total volume.
- MicroStrategy acquired an additional 3,015 BTC for $155 million, bringing its total corporate treasury holdings to 193,000 BTC.
- Bitcoin supply issuance is now being outpaced by demand, yet price must clear $64,000 to validate the absorption.
Recent Inflows into Bitcoin ETFs: The Return of Billion-Dollar Demand
The shift in momentum was immediate and heavy. After weeks of bleeding capital and erratic performance, Bitcoin ETF inflows roared back, recording $1.1 billion in net buys over just three sessions.
On March 3 alone, $458.2 million entered the system, according to data shared by Bloomberg ETF analyst Eric Balchunas.
BlackRock IBIT led the charge, securing $263.2 million, more than 50% of the daily total. Fidelity’s FBTC followed with $94.8 million, showing a clear hierarchy in liquidity preferences.
This concentration matters. Institutional capital is flowing through specific, high-volume pipes rather than broad market speculation.
The sudden return of billion-dollar volume suggests that the outflow fatigue seen in February has resolved.
Supply mechanics are tightening. With the halving reducing daily miner issuance, a $450 million inflow day absorbs weeks of production in hours. If ETF buyers continue to absorb miner supply at this rate, the supply shock becomes mathematical. But if flows revert to the erratic pattern seen last month, the rally risks decoupling from fundamentals.
Discover: The next crypto to explode!
MicroStrategy BTC Acquisition: Relentless Accumulation
While ETFs dominated the flow data, MicroStrategy executed another massive treasury expansion to backstop the market. Michael Saylor confirmed the purchase of 3,015 BTC for approximately $155 million. The average entry price was $67,700.
This brings the company’s total stack to 720,737 BTC, acquired at an aggregate cost of roughly $39.5 billion, an average of just $54,765 per coin.
This is not passive exposure. It is a relentless accumulation strategy that disregards short-term volatility.
Much like other corporate treasuries aggressively adding crypto assets, MicroStrategy is removing floating supply permanently from exchanges.
And yet, no capitulation. Saylor’s continued buying at $51,000+ signals conviction that the current range is a floor, not a ceiling.
The “Saylor Effect” acts as a psychological backstop: even when prices chop, the largest corporate holder keeps buying. MicroStrategy BTC purchases are becoming a structural constant in a volatile market.
Bitcoin Price Analysis: The $64,000 Line in the Sand
The $1.7 billion in buy-side pressure has caused Bitcoin to leap 8.5% in the last 24 hours to trade around $71,000.
Jan van Eck, CEO of asset management firm VanEck, suggests the macro bottom is behind us, but the charts require confirmation.
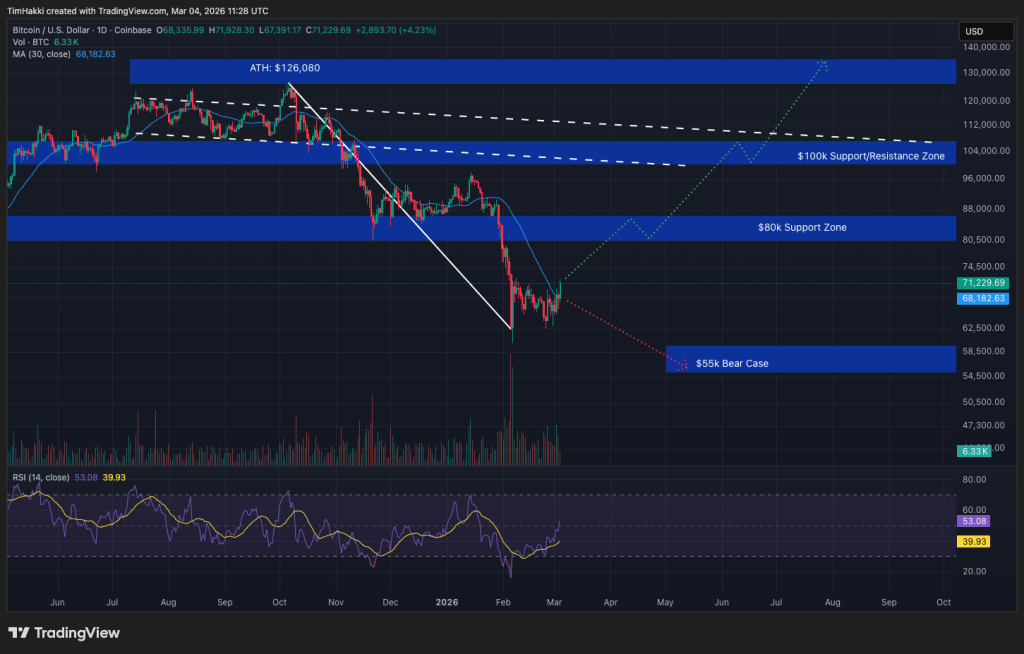
Lose $60,000, and the bullish thesis is invalidated, exposing the market to a drop toward the $50,000 to $55,000 zone, which Polymarket bettors, Standard Chartered analysts, and the CryptoQuant CEO suggest could be the market bottom.
Watch the daily net flow of BlackRock IBIT closely this week. If inflows sustain above $200 million daily while price reclaims $72,000, the consolidation phase will likely be far behind us.
Discover: The best crypto to buy today.
The post Institutional Accumulation: US Bitcoin ETFs and MicroStrategy Drive $1.2B Demand Surge appeared first on Cryptonews.

Bitcoin (CRYPTO: BTC) bulls are targeting a move back toward $80,000 in March, supported by a technical setup that has begun to show meaningful upside momentum. After a rally that pushed BTC above key levels, the asset retraced and then re-accelerated, signaling that demand is re-emerging as buyers step in around pivotal price zones. In recent trading, BTC rose more than 5% to around $71,900, a move that coincided with a breakout from what some analysts characterized as a bear pennant, though others see it as the early stages of a bullish symmetrical triangle. The pattern suggests a potential catalyst for a larger advance if buying interest remains firm and volume sustains its uptick.
The evolving chart pattern centers on a symmetrical triangle, formed as price makes lower highs and higher lows within a narrowing price range. In practice, the triangle’s widest cross-section spans roughly from $63,000 on the lower side to $71,000–$72,000 on the upper edge. A breakout above the upper boundary could unleash a measured move toward the $80,000 area, a target that also happens to align with BTC’s 100-day exponential moving average, a level many traders view as a significant longer-term gauge of trend health. The breakout’s credibility hinges on follow-through volume, with higher turnover often translating into increased conviction behind the move.
From a near-term perspective, the chain of moving averages presents both a challenge and an objective. The 50-day EMA sits near $74,400, posing a near-term hurdle. A rejection around that level would raise the odds of a pullback toward the 20-day EMA, which sits closer to $68,700, potentially reigniting short-term volatility. Still, if BTC can clear the 50-day EMA and maintain momentum, the path toward the broader target remains plausible, with the 100-day EMA acting as a guidepost for the longer-term trend.
Beyond pure price action, the market atmosphere is colored by a functional market mechanics element: an unfilled CME futures gap. That gap sits approximately in the $79,660–$81,210 zone, offering a magnet for price in the event of rebalancing between the spot market and the futures market. The dynamic arises because CME futures markets do not trade over the weekend, so when spot prices move during those periods, a gap can form that the futures market may revisit once trading resumes. Traders monitor this area closely as a potential catalyst zone where price could pause or accelerate in the days ahead.
On the speculative side, market-derived odds from prediction platforms have started tilting more decisively toward a bullish outcome for BTC in March. Polymarket has shifted toward pricing in a 40% probability that Bitcoin reaches $80,000 this month, up from 20% a day earlier. The odds for a price of $75,000 in March are even higher, around 70%, signaling a stronger collective belief among market participants in a constructive move in the near term. Conversely, the probabilities for a more pronounced downside in March have declined, suggesting traders are trimming expectations for deeper retracements.
Another data point enhancing the bulls’ case is the broader ETF narrative, which has been getting attention as institutions evaluate real-world demand versus supply pressures. Coin-media coverage has highlighted inflows into spot Bitcoin exchange-traded products as a factor supporting a steady bid around the $80,000 mark, with inflows and redemption dynamics shaping near-term price discovery. This context complements the technical setup, underscoring how demand dynamics interact with market mechanics to shape BTC’s trajectory in the weeks ahead.
Finally, a pattern is emerging that many traders watch closely: the accumulation and reallocation narratives that tend to re-emerge at critical price levels. An ongoing focus on the $80,000 region, supported by a history of CME gap fillings, adds another layer of potential momentum if price can sustain a breakout and clear immediate resistance. With Polymarket indicating growing odds for a March push and with the 100-day EMA aligned with the target, the stage appears set for a test of the upper triangle boundary and, if successful, a potential extension toward the $80k target in the coming weeks.
Why it matters
Bitcoin’s struggle to retake $80,000 has been a focal point for traders seeking signs of renewed momentum after a period of consolidation. A sustained breakout beyond the upper trendline would reaffirm a broader technical setup that has attracted attention from both technical analysts and derivative market participants. The alignment of the target with the 100-day EMA adds a level of significance because this moving average is widely watched as an indicator of the longer-run trend, not merely a short-term impulse. If price action confirms the breakout, it could attract additional buyers who are looking for a clearer signal of trend continuation rather than mere volatility spikes.
Moreover, the CME gap provides a practical reminder of how futures dynamics can accentuate price moves. Gaps are not guarantees, but they can act as magnets when market participants anticipate a return to a fair price after periods of dislocation. The $79,660–$81,210 zone has persisted for weeks, and a close above that area could signal renewed risk appetite and confidence in a new leg higher. In the same vein, the contemporaneous market sentiment reflected in Polymarket’s odds adds a qualitative dimension to the story: a shift in probability toward a higher price target implies traders are pricing in a more favorable near-term trajectory for BTC.
Finally, the conversation around spot Bitcoin ETFs adds a macro layer to the narrative. Inflows associated with these products can influence demand dynamics by providing institutional exposure that complements a rising risk-on environment. While not a guarantee of a specific price path, the presence of sustained demand from ETF products reinforces the underlying thesis that BTC could participate in a broader upswing if macro and liquidity conditions remain supportive.
What to watch next
- Watch for a daily close above the triangle’s upper boundary to confirm a breakout with sustained momentum.
- Monitor the 50-day EMA around $74,400 as the near-term hurdle; a clear hold above this level would strengthen the bullish thesis.
- Track the CME gap region near $79,660–$81,210 for signs of price reversion or continuation as futures reopens.
- Observe Polymarket’s updated odds for March to gauge whether market sentiment continues to tilt toward higher BTC prices.
- Assess whether price action in the coming sessions can stage a clean move toward the $80,000 target and test the 100-day EMA as a guiding benchmark.
Sources & verification
- Bitcoin price action and the breakout context: https://cointelegraph.com/news/bitcoin-price-nears-one-month-high-as-bulls-propel-btc-toward-72k
- CME gaps and their trading implications: https://cointelegraph.com/news/bitcoin-cme-gaps-how-to-trade-them
- Polymarket odds for BTC in March: https://polymarket.com/event/what-price-will-bitcoin-hit-in-march-2026
- Bitcoin accumulation wave and the $80k case: https://cointelegraph.com/news/bitcoin-accumulation-wave-puts-dollar80k-back-in-play-analyst
- ETF inflows context and market impact: https://cointelegraph.com/news/bitcoin-etf-225-million-inflows-blackrock–ibit-counters-selling

PI bulls have managed to defend their recent gains as they aim higher.
PI Network (PI) Price Predictions: Analysis
Key support levels: $0.15
Key resistance levels: $0.20
PI Breakout Continues
After the PI price broke above its downtrend, buyers managed to defend the price above $0.15 and push it higher despite a recent pullback. This shows bulls are determined to stop the downtrend and begin recovering some of the most recent losses.
As long as the support at 15 cents holds, PI’s price action is bullish, which opens the way to test the resistance at 20 cents. If that breaks later as well, the price could spike higher fast and aim for 30 cents next.
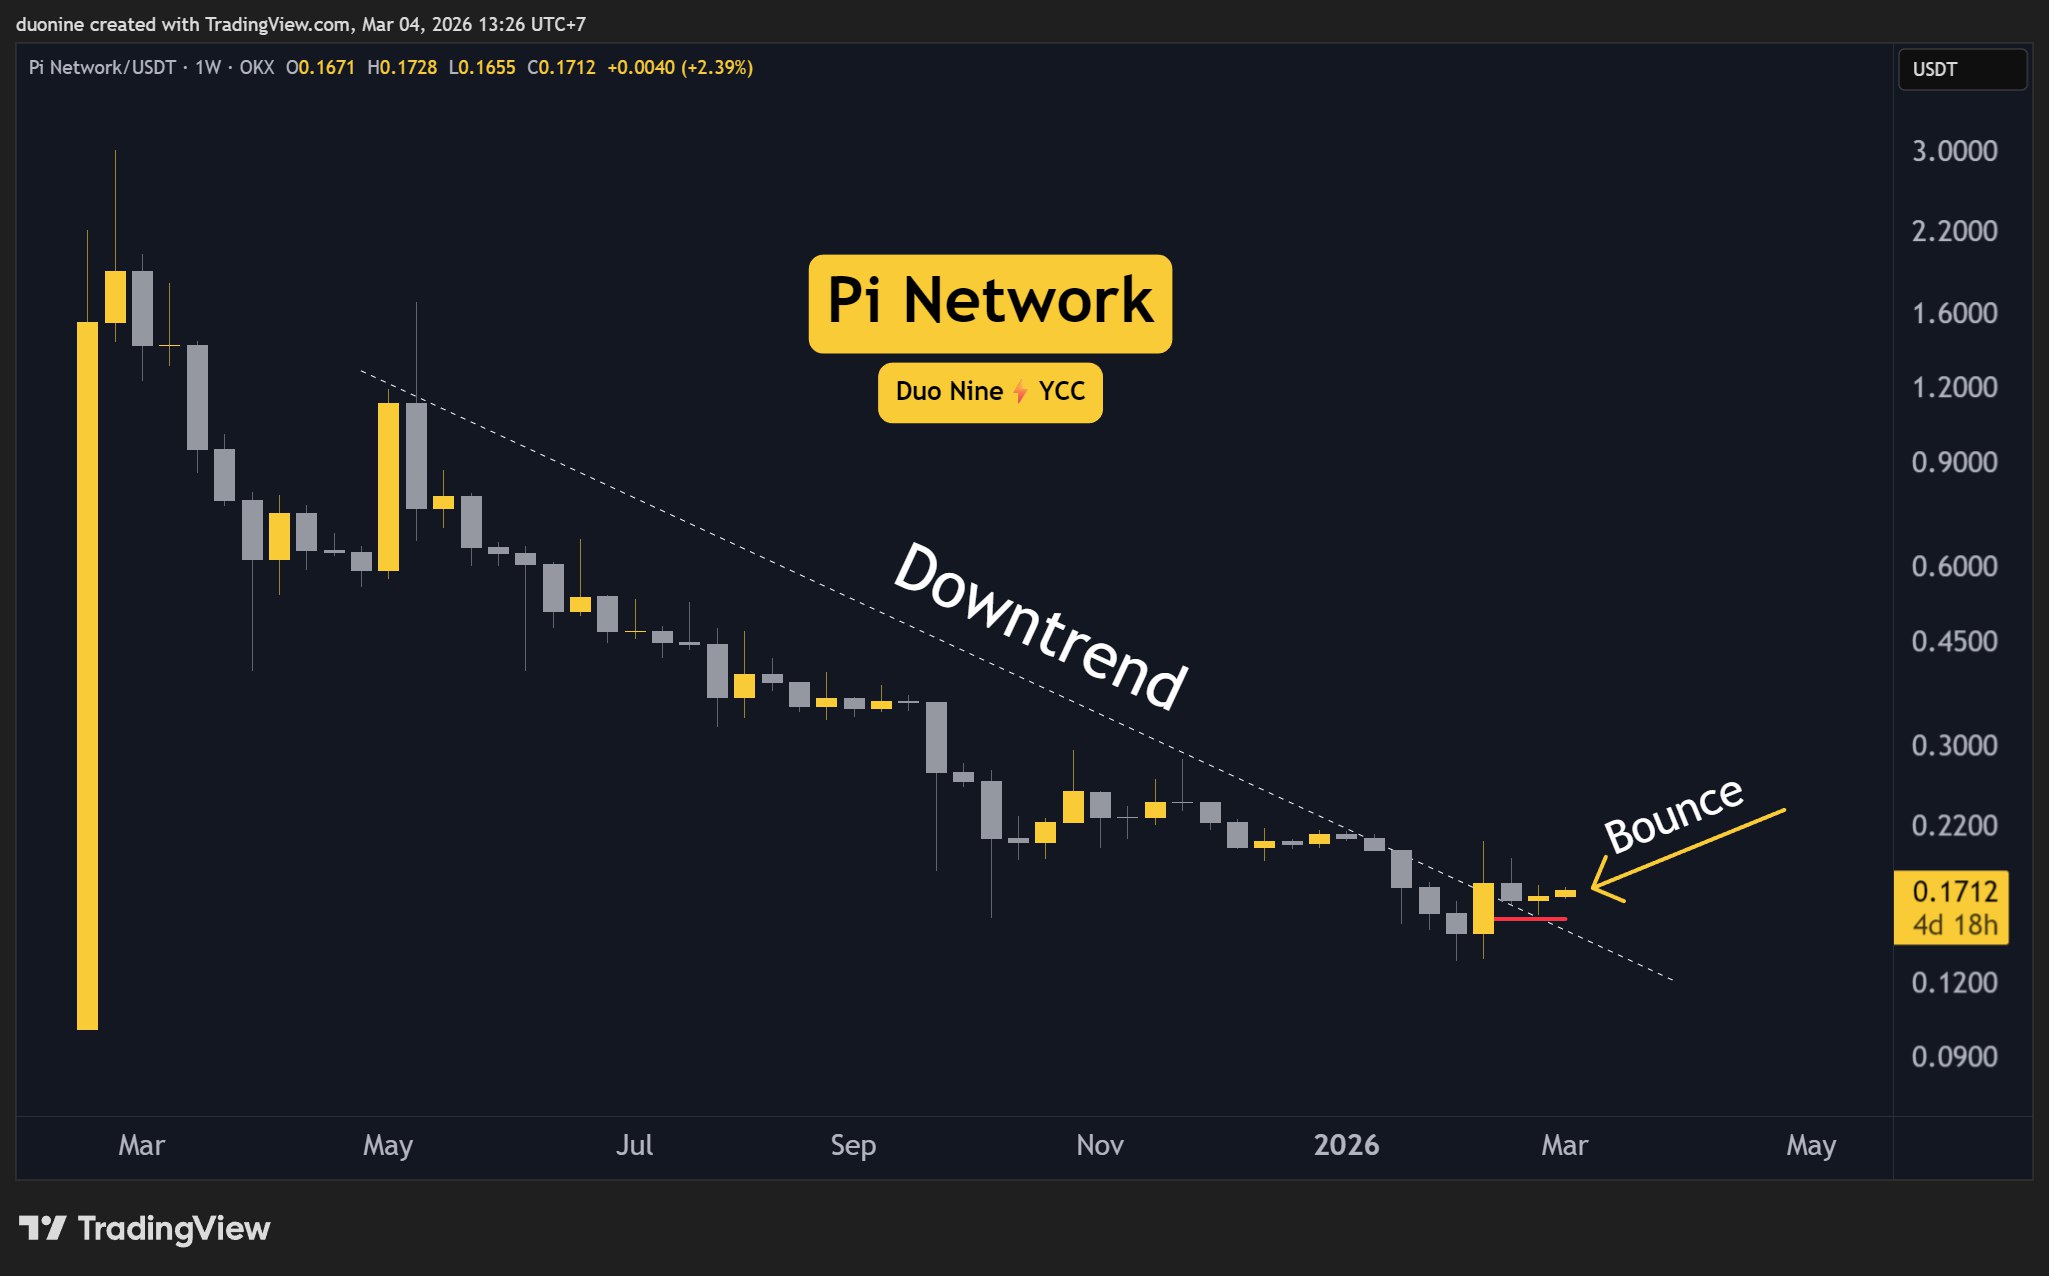
Pullback was Succesful
The recent pullback bounced exactly off the breakout trendline, confirming a bullish bias. Moreover, PI has been green in the past two weeks, which increases confidence in the continuation of this price action.
Since sellers dominated for months in a row, it would not be surprising to see this cryptocurrency finally have a sustained relief rally as it aims to reclaim a price above 20 cents and beyond.
You may also like:

Spike in Buy Volume Confirms Reversal
The spike in buy volume on 15th February was significant and confirmed a major bullish reversal. The fact that this was followed by sustained buy pressure and higher lows demonstrates that bulls are returning. The only unknown is how long they can sustain this.
For this reason, watch closely how the price reacts at the 20-cent resistance, since that will be a decisive level for where PI goes next. Hopefully, buyers can turn it into a support that will allow them to aim much higher.

Binance Free $600 (CryptoPotato Exclusive): Use this link to register a new account and receive $600 exclusive welcome offer on Binance (full details).
LIMITED OFFER for CryptoPotato readers at Bybit: Use this link to register and open a $500 FREE position on any coin!
Disclaimer: Information found on CryptoPotato is those of writers quoted. It does not represent the opinions of CryptoPotato on whether to buy, sell, or hold any investments. You are advised to conduct your own research before making any investment decisions. Use provided information at your own risk. See Disclaimer for more information.
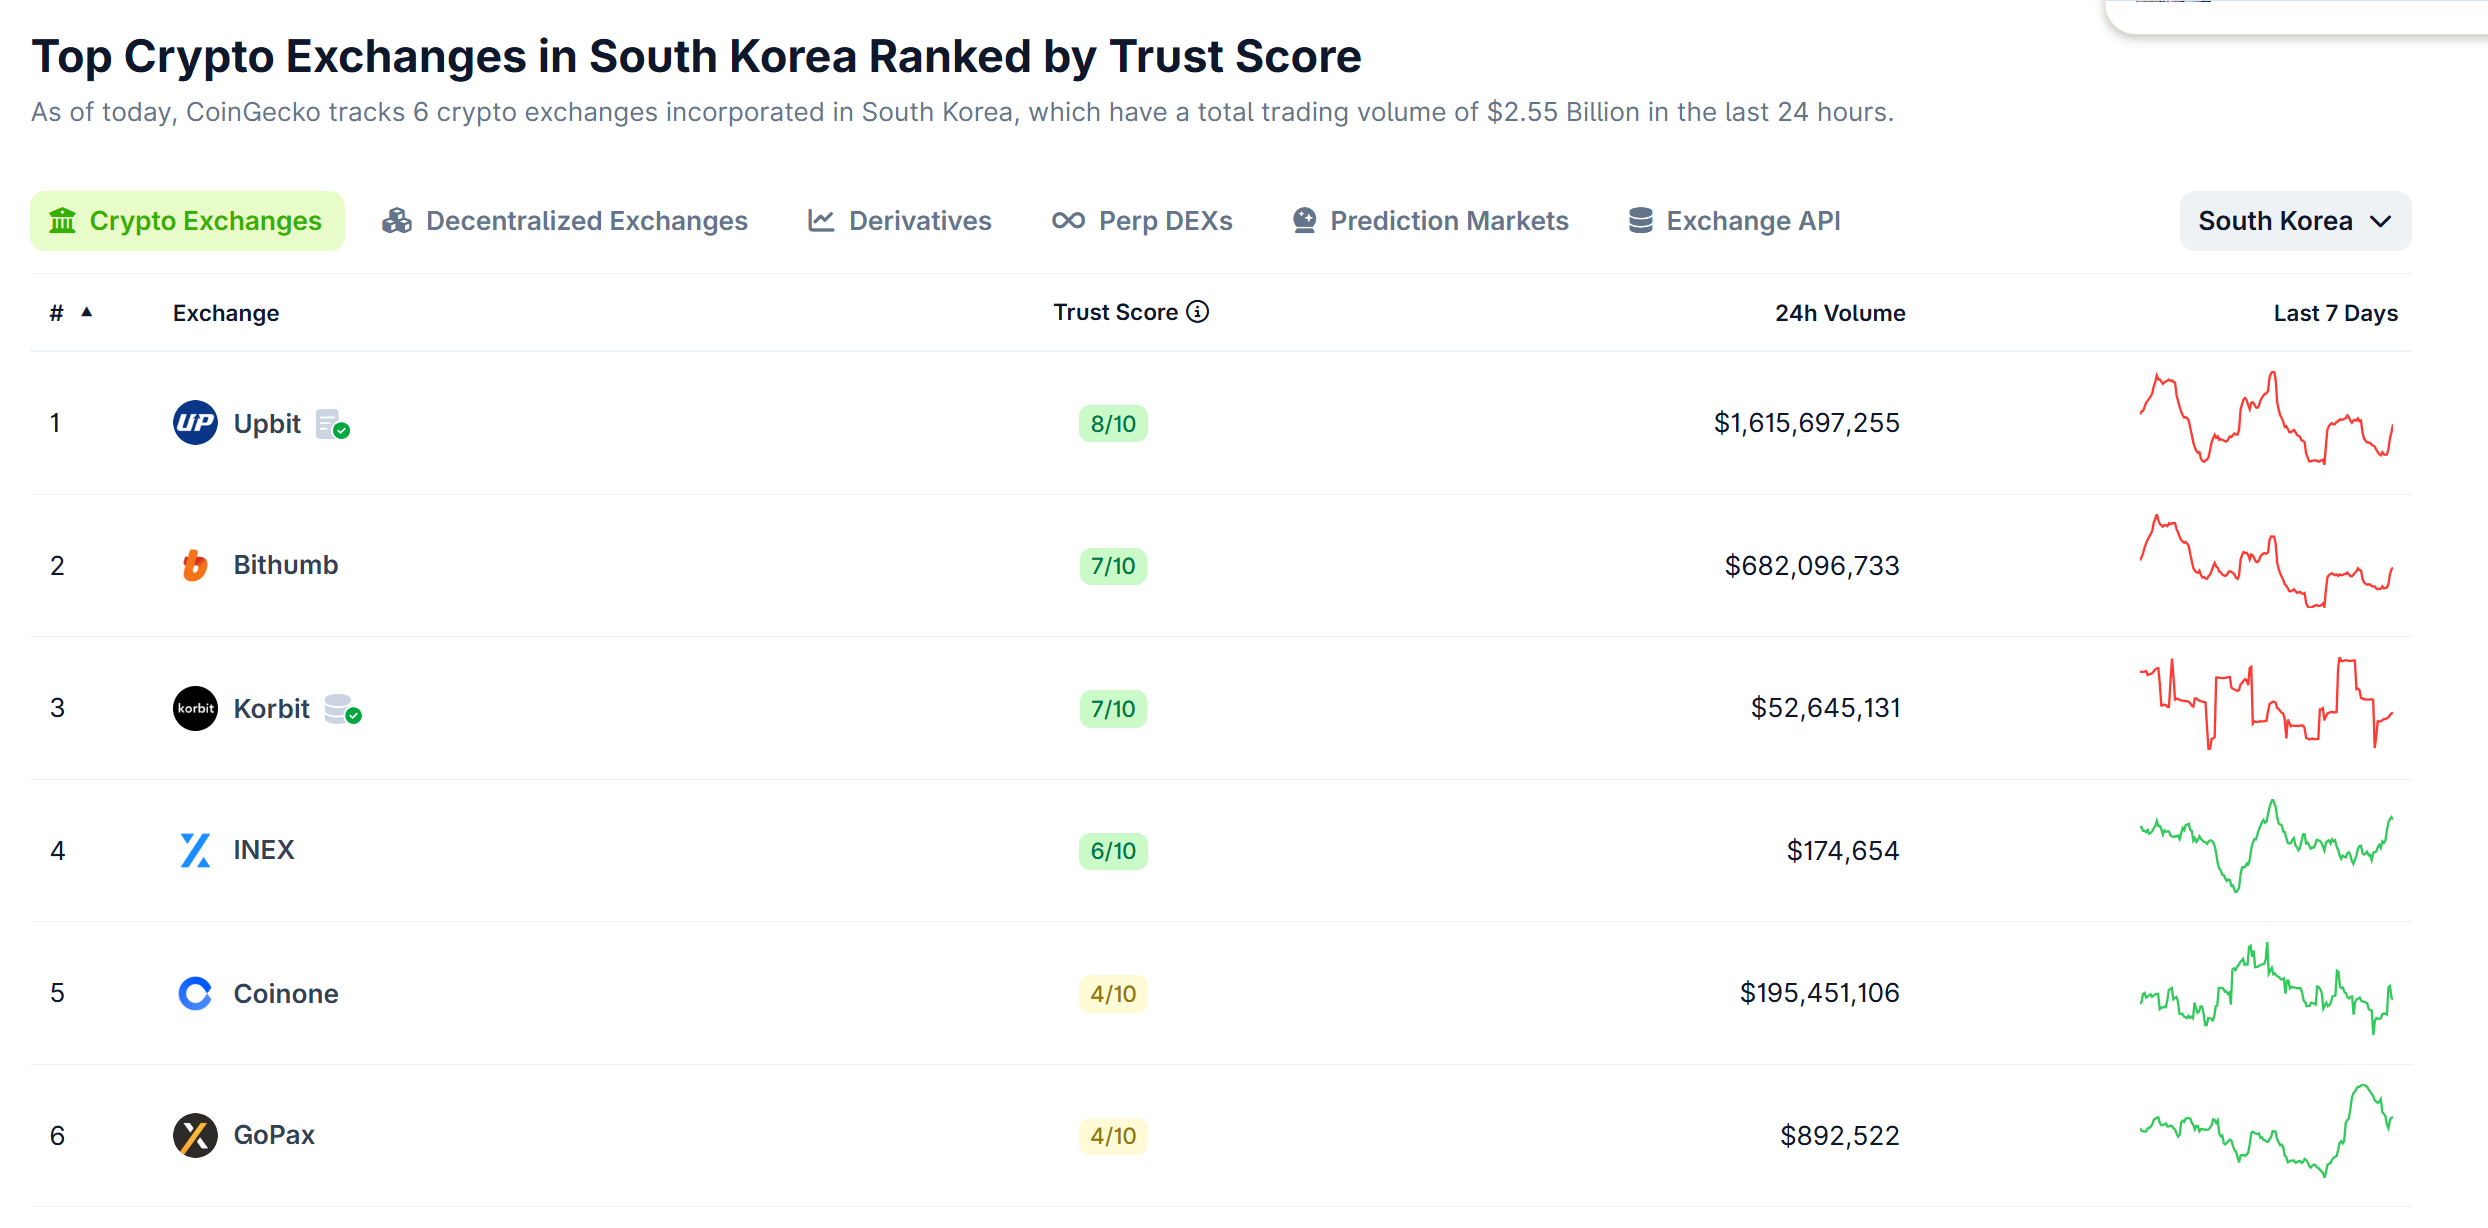
South Korea’s government and ruling party have reportedly agreed on a plan to cap the ownership stakes of major shareholders in domestic crypto exchanges at 20%.
The Democratic Party of Korea’s digital asset task force and the Financial Services Commission (FSC) agreed to set the maximum shareholding limit at 20% after discussions, according to a Wednesday report by local media outlet Herald Economy.
However, regulators may allow exceptions of up to 34% for new businesses through an enforcement decree. The threshold references the Commercial Act’s 33.3% veto threshold in general shareholders’ meetings, per the report.
Under the proposal, exchanges would reportedly have three years from the law’s enforcement to adjust their ownership structures. Smaller exchanges may receive an additional three-year grace period. Larger platforms like Upbit and Bithumb, which together control roughly 90% of the local market, would be required to reduce major shareholder stakes within the initial three-year period.
Related: Korea halts trading as key indexes drop 10% on Middle East crisis
Major Korean exchanges exceed proposed ownership cap
Current ownership levels across South Korea’s major exchanges exceed the proposed cap. Upbit chairman Song Chi-hyung holds about 25.52%, while Bithumb Holdings owns roughly 73.56% of Bithumb. Coinone chairman Cha Myung-hoon controls about 53.44%, Mirae Asset Consulting is set to hold around 92.06% of Korbit following an acquisition, and Binance owns about 67.45% of GOPAX.

The proposal, which has received some backing among regulators, faces a lengthy legislative process. A member of the National Assembly is expected to introduce the bill, though the sponsor has not yet been determined. Passage may prove challenging, as some lawmakers, including members of the ruling party, have raised concerns about restricting ownership in the sector.
An industry insider warned that the measure could have broader implications for competition. “This is unprecedented worldwide and has low global consistency. If it is excessively introduced, it could have serious negative effects such as limited competition, slowed innovation, and strengthened barriers to entry,” they reportedly told the outlet.
Related: South Korea orders cross-agency probe after repeated crypto custody failures
South Korea tightens crypto licensing rules
In late January, South Korea’s National Assembly approved changes to the country’s crypto licensing framework, introducing stricter entry requirements for virtual asset service providers (VASPs). The updated rules allow authorities to examine executives and major shareholders for a wider range of potential violations, including drug trafficking, tax evasion, fair-trade breaches and serious economic crimes.
In February, Democratic Party lawmaker Kim Seung-won also announced plans to draft amendments to the Capital Market and Financial Investment Business Act and the Act on the Protection of Virtual Asset Users that would mandate disclosure from individuals who provide investment advice or encourage trading of financial products or virtual assets.
Magazine: Bitcoin may take 7 years to upgrade to post-quantum — BIP-360 co-author

Quick Overview
- Bank of America upgraded Tesla from Hold to Buy, setting a $460 price target.
- Analysts describe Tesla as “the current leader in consumer autonomy.”
- BofA estimates Tesla’s Optimus humanoid robot division at more than $30 billion and its Energy division at $90 billion.
- Analyst sentiment remains cautious: just 44% rate Tesla as a Buy, trailing the 55% S&P 500 average.
- Shares gained 2% in early Wednesday trading but still trade 13% below year-to-date levels.
Tesla (TSLA) shares climbed during early Wednesday trading after Bank of America resumed coverage with a Buy recommendation and established a $460 price objective, pushing shares approximately 2% higher to $400.27.
The positive call follows a challenging period for the electric vehicle maker. Following a strong fourth-quarter earnings report on January 28, Tesla shares had declined 9%, and entered Wednesday’s trading down 13% year-to-date.
Analyst Alex Perry from BofA identified Tesla as “the current leader in consumer autonomy,” highlighting the company’s Full Self-Driving technology as the cornerstone for what analysts anticipate will evolve into a robotaxi operation.
Tesla’s FSD subscription costs $99 monthly and can manage the majority of everyday driving tasks for vehicle owners. Bank of America views this consumer technology as the stepping stone toward a comprehensive autonomous transportation network.
The company rolled out robotaxi service in Austin, Texas last June, with expansion planned for nine additional cities during the first half of 2026.
Wall Street’s consensus price target for Tesla stands at $427. Bank of America’s $460 forecast exceeds this average, indicating a more optimistic outlook compared to broader analyst sentiment.
Despite the recent upgrade, overall analyst opinion on Tesla remains divided. Only 44% of analysts tracking the stock maintain Buy ratings — significantly lower than the approximately 55% Buy-rating average across S&P 500 constituents.
Tesla trades at a P/E multiple of 363, and InvestingPro’s Fair Value model indicates the shares appear overvalued at present prices. Nevertheless, five analysts have recently increased their earnings projections for the next reporting period.
Humanoid Robotics and Energy Divisions Command Substantial Valuations
Bank of America provided a detailed breakdown of Tesla’s business segments. The investment bank assigns a valuation exceeding $30 billion to Tesla’s Optimus humanoid robot division, representing approximately 2% of the company’s $1.47 trillion market capitalization.
Optimus robots are projected to initially serve manufacturing environments, with potential to displace a portion of the roughly 13 million manufacturing positions in the United States, before eventually entering residential markets.
The Energy division, encompassing residential Powerwall battery systems and Megapack installations for utilities and data centers, received a $90 billion valuation from BofA, constituting 6% of Tesla’s overall enterprise value.
Latest Company Developments to Monitor
Not all recent news has favored Tesla. GLJ Research maintained its Sell recommendation, expressing skepticism regarding the commercial feasibility of the Optimus initiative.
Additionally, a federal judge denied Tesla’s motion to reverse a $243 million jury award connected to a fatal 2019 Autopilot accident, determining that evidence strongly validated the jury’s initial conclusion.
On a more positive note, Tesla recorded a 55% year-over-year increase in French vehicle registrations, suggesting some market stabilization in Europe following two consecutive years of declining sales. Norwegian markets also demonstrated growth.
Heading into Wednesday’s session, Tesla shares had gained 44% over the trailing twelve months, despite facing downward pressure throughout the current year.


- Solana price touched $90 as Bitcoin broke to above $71,000 on Wednesday.
- Bulls could eye $100 and higher if BTC explodes further.
- Solana’s outlook hinges on sustained ETF inflows and resolution in geopolitical tensions.
Solana is trading above $90 as of March 4, 2026, with the price seeing slight gains amid an impressive intraday bounce for Bitcoin (BTC).
As BTC trades above $71,000, broader optimism across crypto suggests the psychological $100 level is likely for SOL.
Momentum has currently put the altcoin on the cusp of a key pattern breakout, with Solana’s resilience across the ETFs market crucial to buy-side appeal.
Solana gains amid BTC, ETH uptick
Solana’s price action has closely aligned with gains in leading cryptocurrencies, Bitcoin (BTC) and Ethereum (ETH).
On Wednesday, Bitcoin retested recent highs above $71k, bolstered by sustained institutional interest despite the war in Iran.
Ethereum also pushed higher, with slight gains putting bulls above the $2,000 mark.
Meanwhile, the Solana price rose 6% to hit intraday highs above the $90 mark.
SOL has not traded above $100 since breaking below the psychological level in early February.
Renewed bearishness amid the Iran war threatened to send bulls bleeding below recent support levels.
However, Bitcoin has sprung above its key supply wall as buyers resurface, and optimism in the cryptocurrency market sees SOL trade in the same direction.
Could an upward breakout take prices past the $100 mark?
Solana price outlook: what next for bulls?
Technically, SOL continues to trade in a downward channel formed since its September 2025 peak above $250.
However, price is tracking an ascending triangle pattern on the daily chart formed since the bounce from the low of $67 on February 6, 2026.
Buyers have found it difficult to break above a key resistance line around $90-$92.
If the altcoin sees a decisive breakout above this mark, it could pave the way for bulls to target $100 and potentially higher.

Momentum indicators like the Relative Strength Index and Moving Average Convergence Divergence support the bullish setup.
The RSI hovers around 50 on the daily chart, suggesting bulls may have room for additional gains, while the MACD continues to signal upside momentum with an expanding histogram.
If bulls negotiate immediate resistance and break higher, the 50-day simple moving average (SMA) at $101 and the 100-day SMA at $116 will be the next hurdles before a potential retest of $150.
However, upside potential remains constrained by the broader descending resistance line tracing back from Solana’s peak in 2025.
A failure to breach $100 might see SOL retrace to major year-to-date support near $77.
The last time Solana traded below $80 was in December 2023 when it was trading in the $60-$105 range.
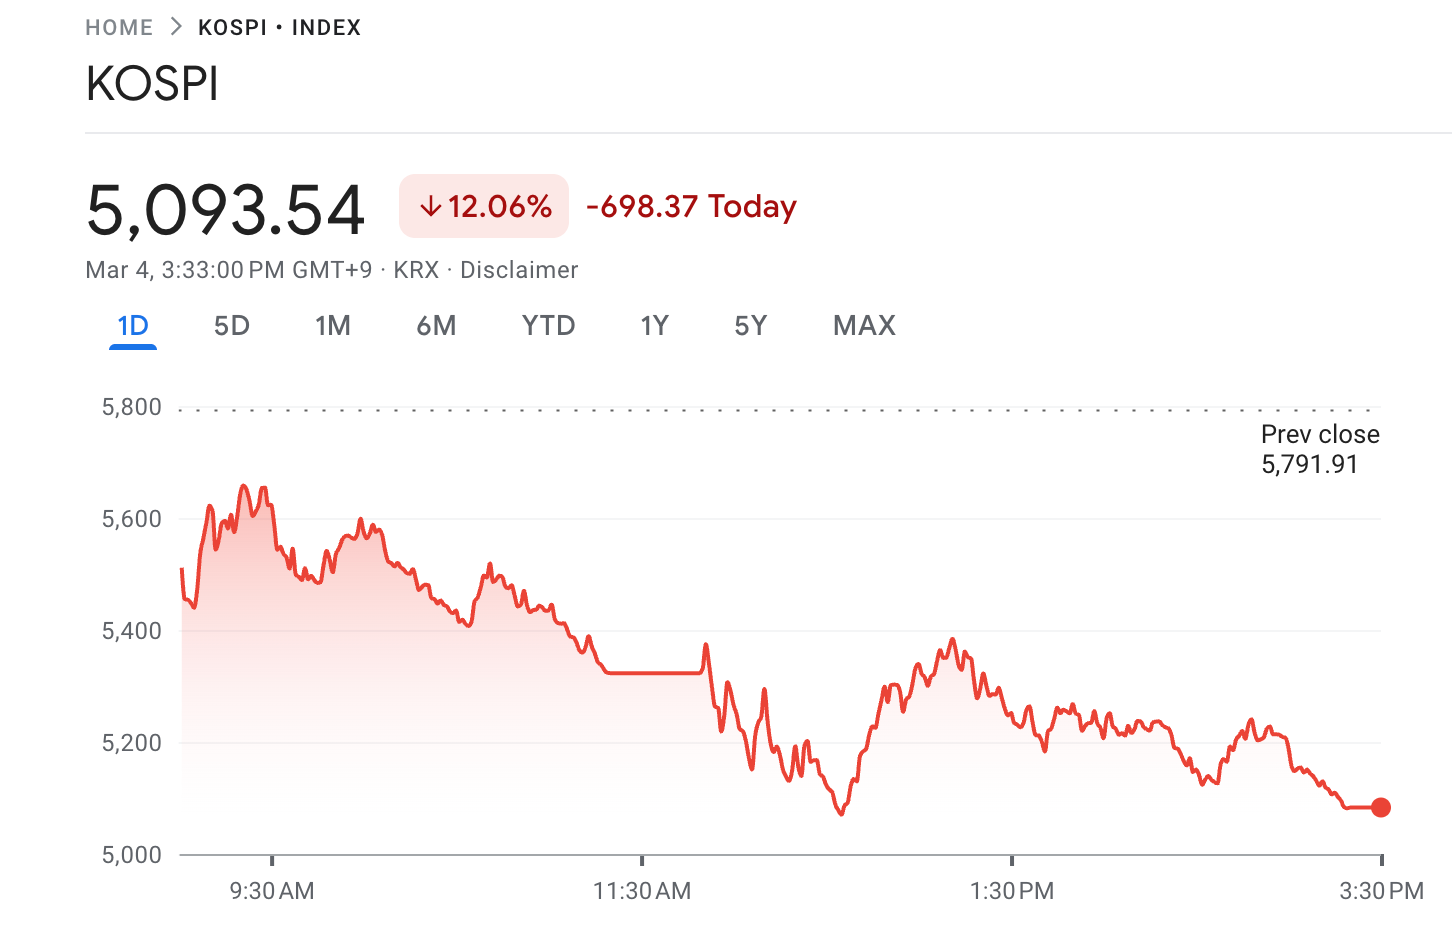
South Korea’s benchmark stock index posted its steepest single-day decline on record, as geopolitical tensions from the widening US-Israel-Iran conflict rattled markets.
Despite the dip in equities, traders focused on fresh crypto exchange listings, with newly listed tokens posting double-digit gains even as broader market sentiment deteriorated sharply.
Korean Stock Market Under Pressure Amid Geopolitical Tensions
According to Google Finance data, the Korea Composite Stock Price Index (KOSPI) plunged more than 12% on Wednesday. In addition, Korea Securities Dealers Automated Quotations (KOSDAQ) saw losses exceeding 10%.
“Seoul KOSPI officially ends down 12.06%, biggest daily percentage loss on record,” market analyst David Scutt posted.
Follow us on X to get the latest news as it happens
Channel News Asia reported that the Korean Stock Exchange imposed a temporary trading halt on Wednesday morning after both the KOSPI and KOSDAQ indices dropped by more than 8%.
Besides South Korea, Japan, Hong Kong, and China’s stock markets dipped on Wednesday, driven largely by escalating global tensions. The ongoing crisis has led to a sharp spike in oil prices. Meanwhile, the closure of the Strait of Hormuz has further heightened concerns.
Asian economies are especially vulnerable to disruptions in energy supplies from the Middle East. Many of them rely heavily on crude oil imports from Gulf states.
Japan and South Korea are particularly exposed. 87% of Japan’s and 81% of South Korea’s total energy consumption comes from imported fossil fuels.
Why KOSPI’s Performance Matters For Crypto
The latest decline in the KOSPI follows a 7.2% drop on Tuesday, marking its worst two-day performance in decades. The index is now approaching the 5,000 level, a threshold that carries symbolic significance beyond being just a round number.
During this election, President Lee Jae-myung outlined his “KOSPI 5,000” vision and pledged to boost the stock market.
“I don’t think Kospi 5000 is that difficult. If you believe in me, you should take a greater interest in the stock market,” he said.
Notably, on the final trading day before the June 3 presidential election, the KOSPI closed at 2,698.97. Over the next eight months, it surged by approximately 85%, crossing the 5,000 mark for the first time in January 2026.
The stock market rally had real consequences for crypto. As equities rose, liquidity from Korean retail investors shifted away from crypto, with many moving their funds into stocks.
BeInCrypto reported in November that crypto trading volumes had dropped by over 80%. Moreover, according to the Bank of Korea’s Financial Stability Report, the turnover in Korea’s crypto market reached 157%, compared to the global figure of 112%, as retail investors increasingly sought short-term profits.
Crypto Listings Defy Broader Market Turmoil
This drop in equities sharply contrasts with developments in South Korea’s digital asset sector. While stocks fell, new altcoins on South Korean exchanges saw strong demand.
CoinGecko highlighted that Definitive Finance’s EDGE token posted strong gains after its Upbit listing.
Furthermore, Centrifuge’s CFG token rallied 21.6% following its listing on Bithumb. The performance of these tokens suggests South Korean crypto investors may still have an appetite for digital assets, even when traditional markets suffer.
However, it remains unclear if this enthusiasm is sustainable. Exchange listings often drive initial excitement and volume that can inflate prices, regardless of broader market sentiment.
The main question is whether these gains reflect a true shift from stocks to crypto, or if they’re simply driven by short-term speculation. Moreover, if the KOSPI selloff deepens and Korean retail sentiment turns decisively negative, capital that had rotated into equities may not automatically return to crypto. A sustained risk-off mood could suppress inflows across both asset classes.


Ripple Prime, also known as Hidden Road Partners CIV and now a wholly owned subsidiary of Ripple, appeared in a directory of a DTCC subsidiary with a “first trade date” of March 2. Mistaken members of the XRP community quickly declared the listing as proof that massive settlement volumes are migrating to the XRP Ledger (XRPL).
They haven’t.
The Depository Trust Clearing Corporation (DTCC) has approximately $100 trillion in assets under custody and processes $4 quadrillion worth of annual transaction settlements.
Its numbers were so impressive that they fooled fans of Ripple into thinking that its blockchain could benefit from these financial flows.
Even XRPL co-creator David Schwartz praised the news.
Instead, the DTCC subsidiary National Securities Clearing Corporation’s (NSCC) listing of Ripple Prime in its Market Participant Identifier (MPID) directory simply means that a very mundane authorization has been granted that doesn’t involve the XRPL settling DTCC transactions.
The DTCC notice assigns Hidden Road the executing broker MPID “HRFI” under clearing broker “PERS” with numeric code “0443.” That code belongs to Pershing LLC, the BNY Mellon subsidiary that handles custody, settlement, and clearing for hundreds of smaller broker-dealers.
By order of operations, Ripple Prime/Hidden Road executes OTC trades, then Pershing clears and settles them through NSCC. XRPL plays no role in those clearing or settlement transactions.
Moreover, the execution approval covers OTC products eligible for NSCC which are, as its name suggests, National Securities Clearing transactions. The DTCC notice shows OTC approval only for Ripple Prime and shows no checkmarks for standard corporates, municipals, or unit investment trusts.
Dozens of firms go through this exact onboarding process every month. On the same notice, NSCC added directory updates for Paralel Distributors, US Bancorp Fund Services, and several others alongside Ripple Prime.
What Ripple actually said versus what fans heard
When Ripple announced its $1.25 billion acquisition of Hidden Road in April 2025, the press release stated, “Hidden Road will, in turn, migrate its post-trade activity across XRPL to streamline operations and lower costs.”
The future tense of the verb “will” indicated aspiration, not a current operation.
That deal closed in October 2025, and although Hidden Road has rebranded to Ripple Prime and gained an enviable directory listing with NSCC, it’s not yet settling any DTCC trades on XRPL.
Moreover, it doesn’t have that authorization.
Ten months later, Hidden Road’s own website still describes the company as a “global credit network for institutions” offering prime brokerage, clearing, and financing across traditional and digital assets.
Aside from a single mention on its Ripple acquisition press release, its website otherwise makes zero mention of XRPL on its website.
Read more: Years of hype but still no deal: SWIFT sidesteps XRP again
Wild exaggerations about the role of XRPL with the DTCC
An XRP influencer with more than 270,000 followers posted that “Ripple Prime’s role in bridging TradFi and DeFi will likely move post-trade volume to the XRPL,” earning 580,000 impressions.
Crypto outlets including CoinGape, CryptoNinjas, and others ran headlines declaring Ripple Prime would “move post-trade activity to XRPL via NSCC link.”
Hidden Road will process “quadrillions” through DTCC, wrote several mistaken XRP fans.
Unfortunately, a directory listing is not an on-chain milestone.
In summary, a soon-to-be Ripple subsidiary has FINRA broker-dealer approval and now shows up in the NSCC MPID directory to execute OTC trades with Pershing as its clearing broker.
Although Ripple Prime has the regulatory scaffolding to operate as an executing broker in US securities markets, that doesn’t mean that any transactions from DTCC will necessarily create demand for ledger space on the XRPL.
The timeline from Ripple for actually routing Ripple Prime’s post-trade flows onto permanent ledgers in the XRPL blockchain remains conveniently unspecified.
Got a tip? Send us an email securely via Protos Leaks. For more informed news, follow us on X, Bluesky, and Google News, or subscribe to our YouTube channel.


Vitalik Buterin has sparked debate within the crypto community after outlining a vision for Ethereum as part of a broader ecosystem of what he calls “sanctuary technologies,” open-source systems designed to preserve freedom, privacy and resilience in an increasingly unstable world.
Summary
- Buterin argues Ethereum should focus on shaping structural digital infrastructure, not taking positions on specific political events.
- His praise of Starlink as a “liberating technology” sparked criticism but was framed as support for pluralistic alternatives, not centralized control.
- The debate underscores growing tension over whether Ethereum should remain neutral infrastructure or adopt a more activist posture.
Ethereum’s Vitalik Buterin faces backlash over vision for ‘sanctuary tech’
In a series of posts on X, Buterin acknowledged growing concerns about government and corporate surveillance, geopolitical conflict, social media degradation, and the concentration of power in artificial intelligence systems.
He also admitted that Ethereum has played only a limited role in meaningfully improving people’s lives on those fronts.
Rather than pivoting Ethereum toward direct political engagement, Buterin argued the network should focus on building neutral digital infrastructure, a shared, ownerless “space” where people can coordinate, transact and organize without centralized control.
He described Ethereum’s role as shaping the structural properties of the digital world, not intervening in specific political disputes.
After one user accused him of contradicting earlier comments about keeping Ethereum independent of his personal politics, Buterin clarified that he sees two ways of influencing global events: altering systemic structures in ways that promote broadly desirable outcomes, and taking positions on specific real-world situations.
He argued that Ethereum as a community should focus on the former, while individual contributors remain free to hold personal views.
The discussion intensified when Buterin listed Starlink among examples of liberating technologies, alongside encrypted messaging platform Signal and community-driven moderation systems. Critics questioned whether praising a company linked to Elon Musk conflicted with crypto’s decentralization ethos.
Buterin responded that the goal is not to oppose Starlink, but to encourage the creation of many alternative systems — ideally open-source and interoperable — to prevent any single entity from holding dominant control.
“The answer is being pro ten more orgs building their own Starlink-like systems,” he wrote.
The exchange highlights a broader tension within Ethereum: whether it should remain a neutral financial and coordination layer, or adopt a more explicit political posture amid global instability. Buterin rejected the idea that Ethereum should “hunker down” and focus solely on finance, arguing that financial sovereignty alone cannot address deeper societal concerns.
Instead, he framed Ethereum as one component of a larger resilience stack, an infrastructure that reduces the risk of “total victory” by any centralized power. The objective, he said, is not world domination through blockchain, but “de-totalization”: building digital islands of stability in a chaotic era.


Head of Product Nikita Bier announced that X is revising its Creator Revenue Sharing policies to penalize users who post AI-generated videos depicting armed conflict without clear disclosure.
Summary
- X will suspend creators from revenue sharing for 90 days if they post AI-generated war videos without disclosure.
- Repeat violations will lead to permanent removal from the monetization program.
- Enforcement may be triggered through Community Notes or AI-detection signals embedded in content metadata.
Post AI war videos without a label? X will cut your pay
In a post on the platform, Bier said that effective immediately, creators who share AI-generated war-related videos without labeling them as synthetic will be suspended from the revenue-sharing program for 90 days.
Repeat violations will result in permanent removal from monetization eligibility.
The move comes amid heightened global tensions and growing concerns about the use of generative AI tools to create realistic but misleading battlefield footage. Bier said that during times of war, access to authentic information is critical, and that AI technologies now make it “trivial” to produce deceptive content that can distort public understanding.
Under the updated policy, enforcement will be triggered if a post receives a Community Note identifying it as AI-generated, or if metadata and other technical signals indicate the use of generative AI tools. The company said it will continue refining its detection systems and moderation policies to maintain trust on the platform.
The announcement reflects a broader industry struggle to balance open expression with the risks posed by increasingly sophisticated AI media tools. Platforms worldwide have faced pressure from governments and civil society groups to prevent manipulated war footage and deepfakes from spreading during geopolitical crises.
X’s updated monetization rules focus specifically on revenue eligibility rather than account bans, signaling an effort to deter misleading content by targeting financial incentives tied to virality and engagement.

This “Always” Happens When Gold Beats Bitcoin

Private sector adds 63,000 jobs in February: ADP

Institutional Accumulation: US Bitcoin ETFs and MicroStrategy Drive $1.2B Demand Surge


-

 Politics6 days ago
ITV enters Gaza with IDF amid ongoing genocide
-

 Politics1 day ago
Alan Cumming Brands Baftas Ceremony A ‘Triggering S**tshow’
-

 Fashion5 days ago
Weekend Open Thread: Iris Top
-

 Tech3 days ago
Unihertz’s Titan 2 Elite Arrives Just as Physical Keyboards Refuse to Fade Away
-

 NewsBeat7 days ago
Cuba says its forces have killed four on US-registered speedboat | World News
-
Sports4 days ago
The Vikings Need a Duck
-
 NewsBeat4 days ago
Dubai flights cancelled as Brit told airspace closed ’10 minutes after boarding’
-
 NewsBeat7 days ago
Manchester Central Mosque issues statement as it imposes new measures ‘with immediate effect’ after armed men enter
-

 NewsBeat3 days ago
‘Significant’ damage to boarded-up Horden house after fire
-
 NewsBeat4 days ago
The empty pub on busy Cambridge road that has been boarded up for years
-

 NewsBeat4 days ago
Abusive parents will now be treated like sex offenders and placed on a ‘child cruelty register’ | News UK
-

 Business6 days ago
Discord Pushes Implementation of Global Age Checks to Second Half of 2026
-

 Entertainment2 days ago
Baby Gear Guide: Strollers, Car Seats
-

 Business6 days ago
Only 4% of women globally reside in countries that offer almost complete legal equality
-
 Tech5 days ago
NASA Reveals Identity of Astronaut Who Suffered Medical Incident Aboard ISS
-
Politics4 days ago
FIFA hypocrisy after Israel murder over 400 Palestinian footballers
-
 NewsBeat3 days ago
Emirates confirms when flights will resume amid Dubai airport chaos
-

 Crypto World6 days ago
From Crypto Treasury to RWA: ETHZilla Retreats and Relaunches as Forum Markets on Nasdaq
-

 NewsBeat2 days ago
Is it acceptable to comment on the appearance of strangers in public? Readers discuss
-

 Tech3 days ago
Viral ad shows aged Musk, Altman, and Bezos using jobless humans to power AI