

Crypto World
Here’s how bitcoin and S&P 500 look like when adjusted for the money printer
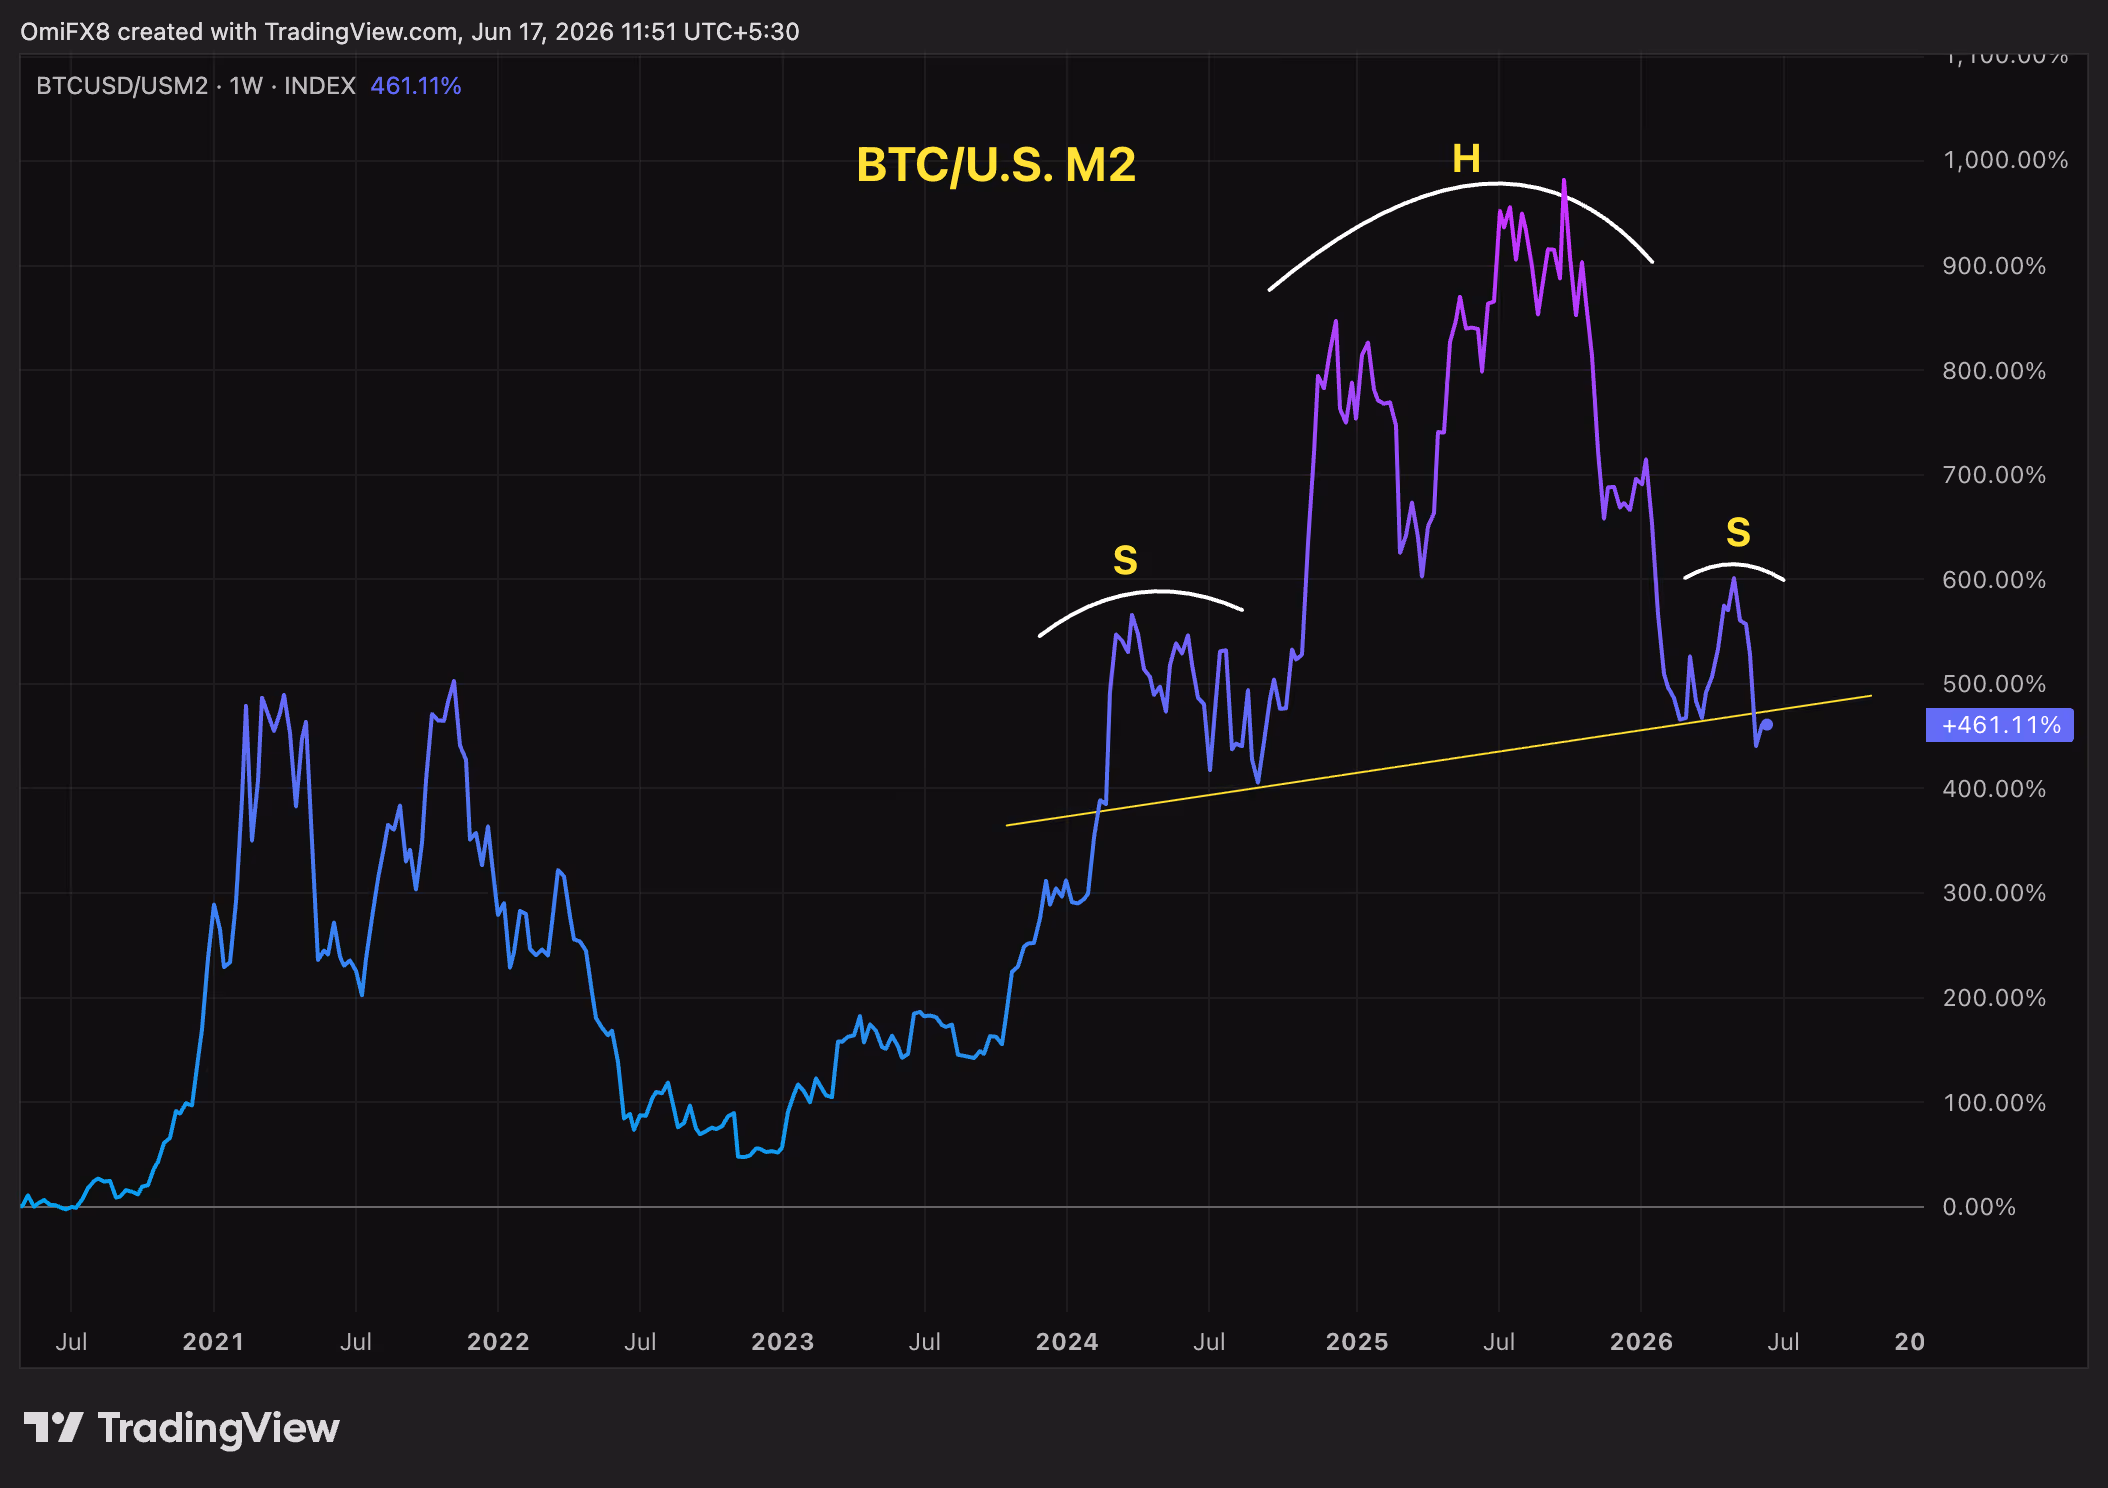
If you’re only looking at the dollar price of your portfolio, you may be missing part of the picture, which is significantly shaped by money supply growth.
To the casual observer, the markets look like business as usual. While bitcoin has nearly halved to $66,000 since its $126,000 peak in October of last year, the decline could be dismissed as just another brutal, quadrennial crypto bear market. Meanwhile, the S&P 500 continues to hover near record highs.
But beneath the surface, a more interesting signal emerges when both prices are adjusted for the U.S. M2 money supply. M2 is the Federal Reserve’s estimate of liquid assets, including cash on hand, money deposited in checking and savings accounts, and other short-term saving vehicles such as money market funds and certificates of deposit.
Monetary exhaustion?
Some observers see bitcoin as a high-beta barometer for dollar liquidity, and the BTC/M2 ratio, bitcoin’s price adjusted for money supply growth, is now flashing a warning. The ratio, after a sharp climb from 2023 through 2025, appears to have formed what technical analysts call a head-and-shoulders pattern, typically read as a bearish signal.

If the pattern holds, it would suggest bitcoin’s exponential edge over money supply growth — the dynamic that let it outrun debasement so convincingly in prior cycles — is fading. Bitcoin’s ability to outpace the flood of new dollars may be approaching diminishing returns, at least for now.

Bitcoin has retreated toward $65,000 ahead of the Federal Reserve’s policy decision as traders cut risk and reassess the outlook for interest rates under newly appointed Fed Chair Kevin Warsh.
Summary
- Bitcoin fell from near $67,200 to around $65,236 ahead of the Fed’s June 17 rate decision as traders reduced risk.
- Key resistance sits between $67,500 and $68,000, while analysts are closely watching support around $63,700 and $60,000.
- Falling oil prices, Middle East tensions, and uncertainty over Fed Chair Kevin Warsh’s policy outlook continue to shape market sentiment.
According to data from crypto.news, Bitcoin (BTC) price fell from a June 16 high of near $67,200 to an intraday low around $65,236 on June 17 before stabilizing near $65,300 at press time. The pullback came as investors awaited the outcome of the Federal Reserve’s two-day policy meeting, with policymakers expected to keep rates unchanged at 3.50%–3.75% when the decision is released later today.
Attention has instead shifted to the Fed’s updated dot plot and Warsh’s first post-meeting press conference. Traders have increasingly focused on whether policymakers abandon any remaining easing bias and reinforce expectations that borrowing costs could remain elevated for longer amid inflation running above 4%.
Outside crypto, the cautious mood extended across several asset classes. Gold and silver both traded modestly lower during the session, while crude oil slid toward $75 per barrel for a fifth consecutive day as markets priced in the possibility of renewed Iranian oil exports under a proposed U.S.-Iran agreement.
At the same time, Asian technology shares continued attracting capital, with Japan’s Nikkei 225 reaching fresh record highs above 70,000 amid ongoing enthusiasm surrounding artificial intelligence investments.
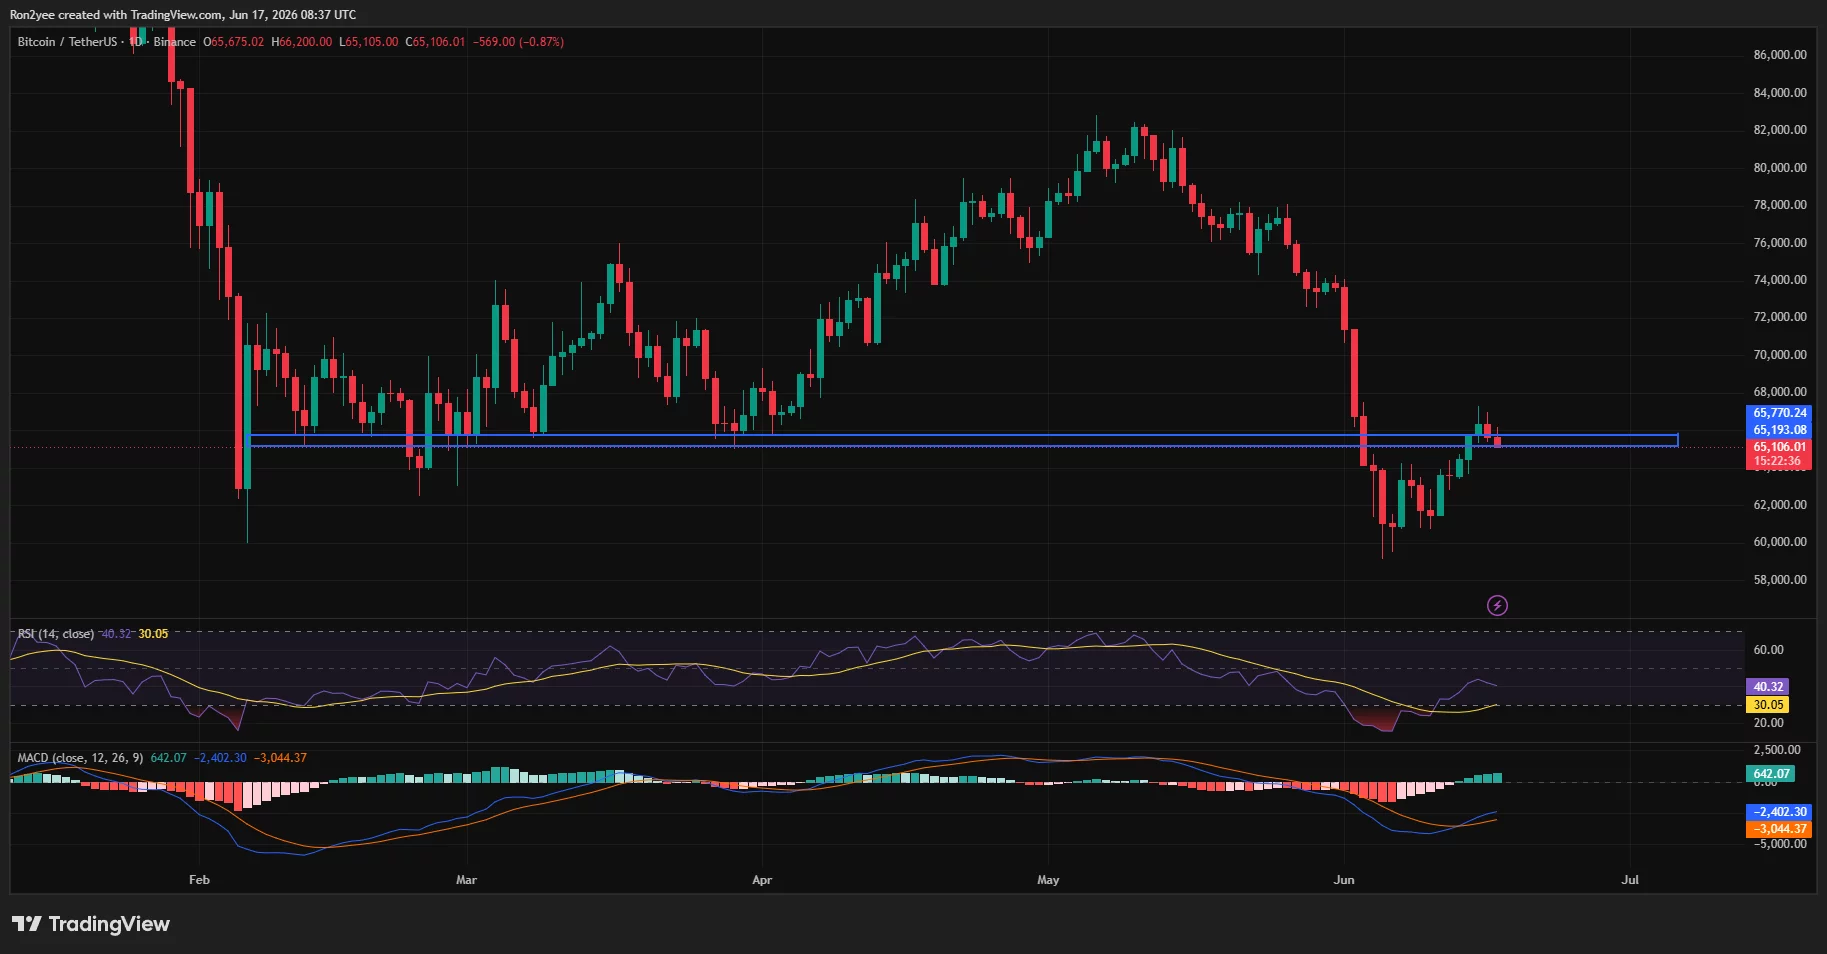
Technical structure leaves Bitcoin trapped between $60K support and $68K resistance
Bitcoin’s recent rebound from below $60,000 has stalled near a major technical resistance zone.
On the daily chart, BTC has returned to a support-turned-resistance region between roughly $65,200 and $65,800. The area previously acted as a key floor during February and March before breaking during the sharp selloff earlier this month. BTC price briefly reclaimed the zone before slipping back underneath it.

Momentum indicators remain mixed. The daily RSI has recovered from oversold territory but remains below the neutral 50 mark, while the MACD continues to trade beneath its signal line despite narrowing bearish momentum.
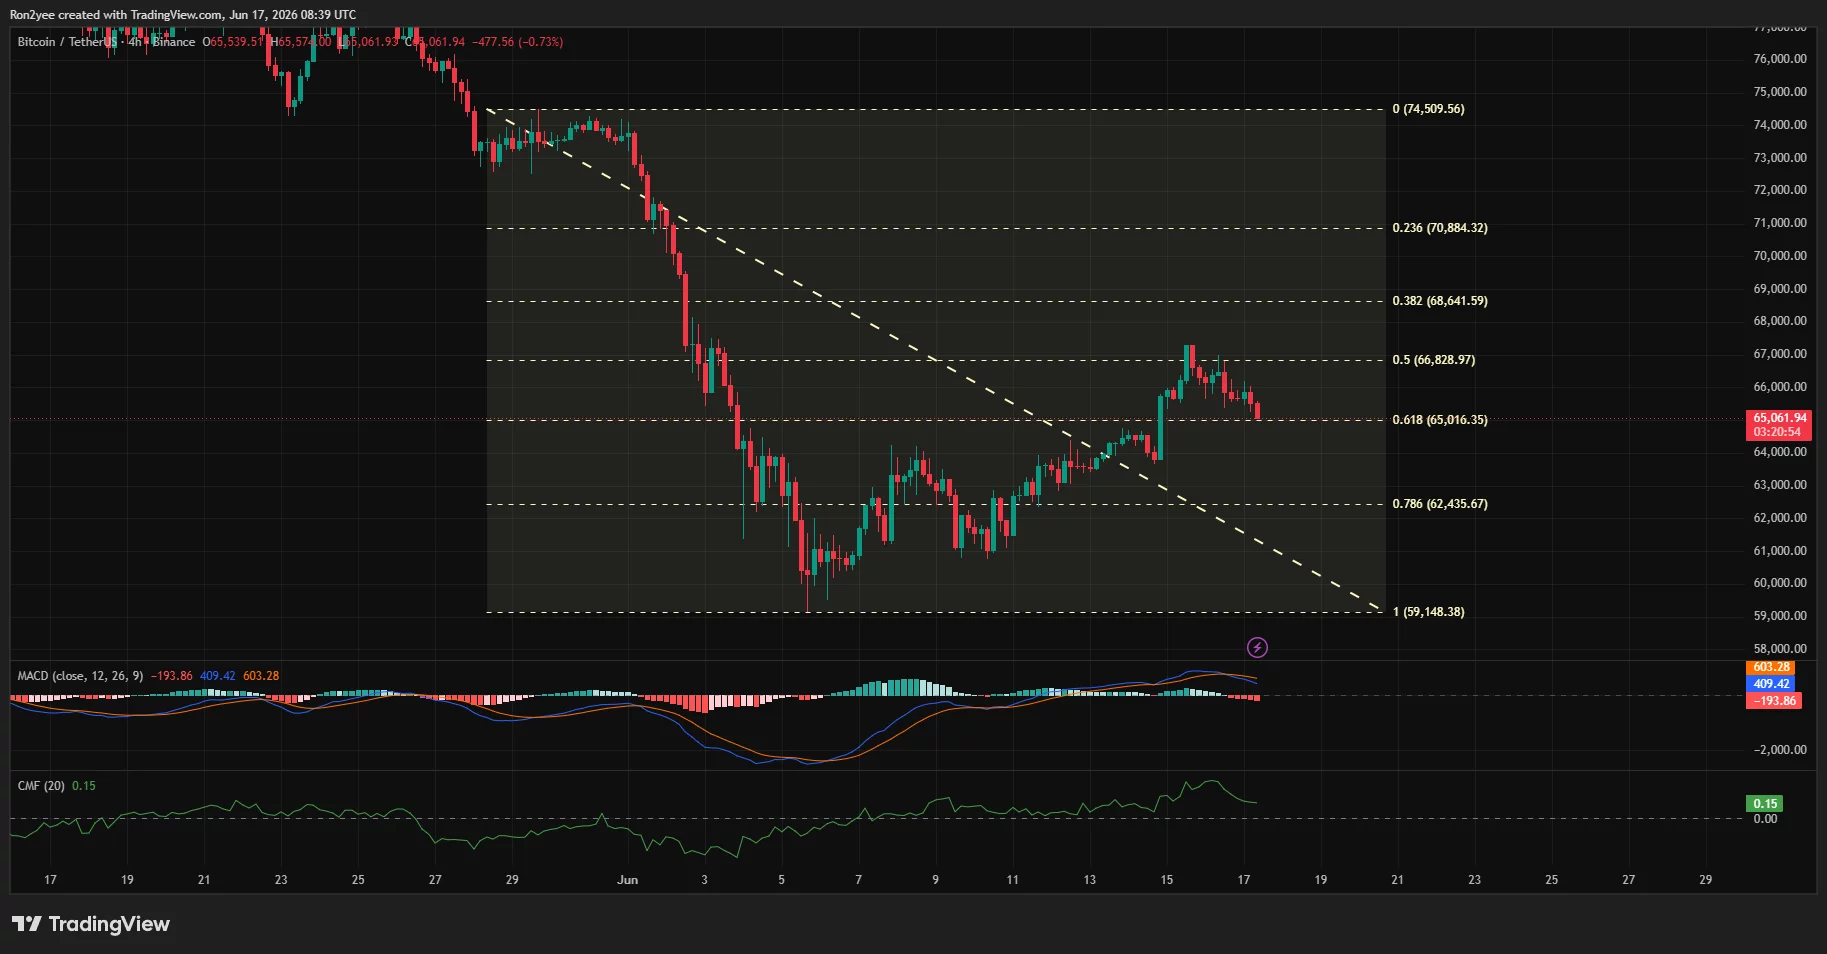
On the four-hour chart, Bitcoin has also fallen back below the 61.8% Fibonacci retracement level near $65,016 after failing to sustain a breakout above the 50% retracement around $66,829.
According to analyst Kamile Uray, the market is now closely watching whether support around $63,700 can hold.
“In deep declines, we will be tracking the 60000 level. This level must be held. Otherwise, the decline deepens further.”
On the positive side, Uray added that $67,500 remains the first major resistance zone, while a sustained move above $74,500 would be required to restore a stronger bullish structure.
Meanwhile, CoinGlass liquidation heatmaps show a dense concentration of leveraged positions sitting above current prices. Commenting on the setup, crypto analyst Daan Crypto Trades noted that “$68K is the biggest one to watch in the short term,” adding that the largest liquidity clusters now sit above the market after Bitcoin swept liquidity beneath $60,000 earlier this month.
Fed guidance and Middle East tensions could determine the next move
Macro developments remain the primary risk factor heading into the Fed announcement.
While falling oil prices have eased some inflation concerns, geopolitical uncertainty has persisted after Iran accused Israel of violating a Lebanon truce dozens of times and warned of a “harsh response” if attacks continue.
Tehran has also linked any final agreement with Washington to sanctions relief, the release of frozen assets, and an Israeli withdrawal from Lebanon.
The combination of Fed uncertainty, geopolitical risks, and persistent institutional caution has kept Bitcoin below major resistance despite recovering from its June lows.
A break above $68,000 could expose the next liquidity zones near $74,000 and $78,000, where large concentrations of leveraged positions remain.
On the downside, losing support around $63,700 would place renewed focus on $60,000. A decisive move below that level could open the door toward the $55,000–$50,000 region highlighted by several market analysts.
Disclosure: This article does not represent investment advice. The content and materials featured on this page are for educational purposes only.

XRP price traded near $1.20 on June 17 as buyers tried to hold a narrow support zone while ETF inflows and spot demand improved.
Summary
- XRP price now sits near $1.20 as ETF inflows return but momentum remains fragile.
- Spot demand has improved, yet Binance perpetual selling shows traders still lean against the rebound.
- Support near $1.19 and $1.14 now decides whether XRP can retest higher resistance levels next.
According to crypto.news market data, XRP fell 3.29% over 24 hours, with trading volume at $1.76 billion. The token ranged between $1.20 and $1.25, while its market cap stood at about $74.45 billion.
XRP price holds $1.20 as ETF inflows return
The latest pullback came after XRP briefly pushed above $1.26 and reached as high as $1.2996, according to levels tracked by analyst EGRAG Crypto. He said the next task is to see whether XRP can turn old resistance into new support.
EGRAG wrote that holding above $1.19 keeps the “structure remains bullish,” while a move below that level could open a retest of lower support. He also said a loss of $1.14 would weaken the setup again.
ETF flows remain a key support factor. XRP products recorded a second straight week of inflows, adding $10.68 million and lifting cumulative inflows near $1.44 billion.
Daily flows also improved. According to SoSoValue, XRP products added $5.30 million on June 16, up from $2.82 million on June 15. Total net assets still slipped to $1.06 billion from $1.11 billion, showing that price weakness offset some demand.
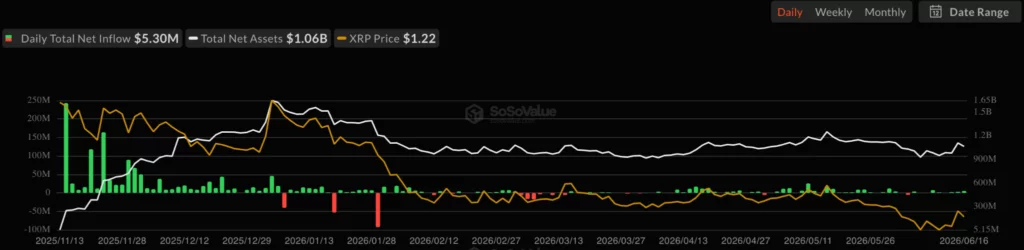
As previously reported by crypto.news, XRP-linked products had already outpaced Bitcoin and Ethereum funds for five straight weeks. That demand has not stopped the chart from staying weak, but it has helped keep XRP above the deeper $1.10 area.
Spot demand clashes with Binance short pressure
CryptoQuant analyst Amr Taha said XRP reclaimed $1.20 while spot cumulative volume delta rose to $267.4 million, its highest level since mid-May. He said the same metric stood near negative $177 million on April 12.
The reading suggests spot buyers have returned across exchanges. That matters because spot buying reflects direct demand for XRP, not only leveraged trading.
The derivatives market tells a different story. Taha said Binance perpetual CVD fell to a record low near negative $792.5 million, down from about negative $218 million on May 12.
This means Binance perpetual traders kept selling even as spot demand improved. With open interest near $251 million, leverage has not fully left the market. If spot buyers keep absorbing that pressure, short positions may face stress. If demand fades, the same setup may increase downside risk.
Moreover, BankXRP also pointed to a deposit and withdrawal pattern on Binance. The analyst said XRP printed the same exchange flow signal that appeared near the last two cycle bottoms, though he warned the sample size is small.
Technical setup keeps XRP inside the range
Bollinger Bands show XRP trading near the middle band. Price was near $1.1957, close to the middle band around $1.1948, while the upper band sat near $1.3471 and the lower band near $1.0425.
That position shows XRP is not at a clear volatility extreme. The bands also look compressed compared with earlier moves, which points to consolidation rather than a confirmed breakout.
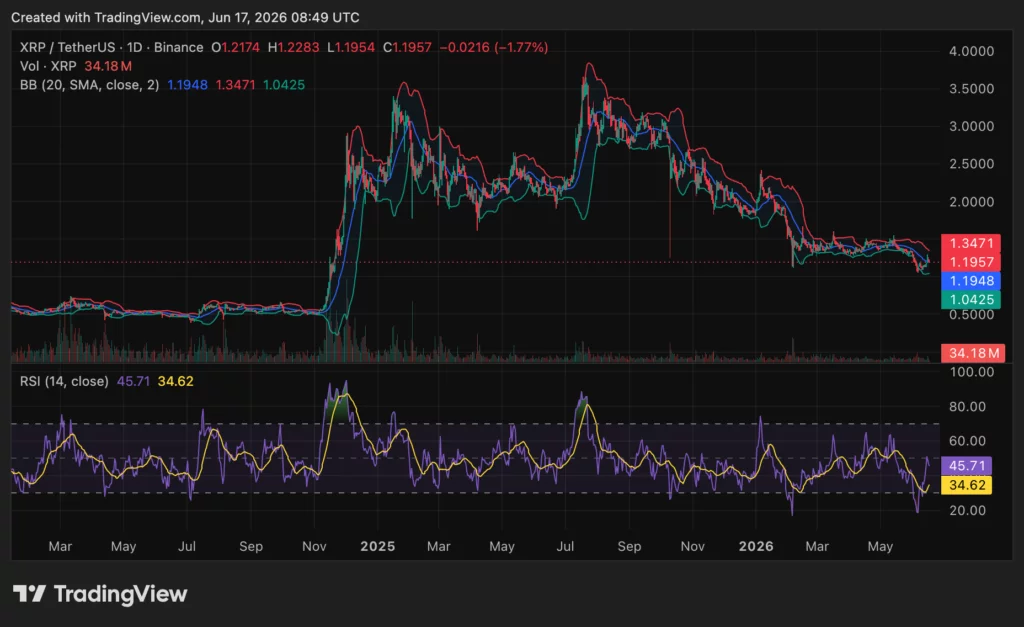
A move toward the upper band near $1.35 would show better strength. A rejection from the middle band would keep XRP range-bound and leave sellers in control of short-term direction.
The RSI stood at 45.71, still below the neutral 50 level. Its moving average was near 34.62, meaning downside pressure has eased, but momentum has not fully turned positive.
Key XRP levels decide the next move
EGRAG’s daily map places $1.11 as the survival zone, $1.21 as first strength, and $1.28 as the next level where structure improves. He said $1.35 to $1.38 would show stronger buyer control, while $1.51 remains the major breakout area.
That view matches the current range. XRP must hold $1.19 first, then reclaim $1.28 and $1.35 before a wider recovery can gain force. A break below $1.14 would put $1.11 and $1.05 back in focus.
As crypto.news reported earlier, XRP had already faced pressure near $1.14 after ETF outflows and whale selling weakened the market in early June. More recent coverage also noted that whale accumulation and $1.30 resistance remain key factors after the latest rebound.
The market now has two competing signals. ETF inflows and spot CVD point to demand, while weak RSI, compressed Bollinger Bands, and heavy Binance short pressure show caution.
Disclosure: This article does not represent investment advice. The content and materials featured on this page are for educational purposes only.

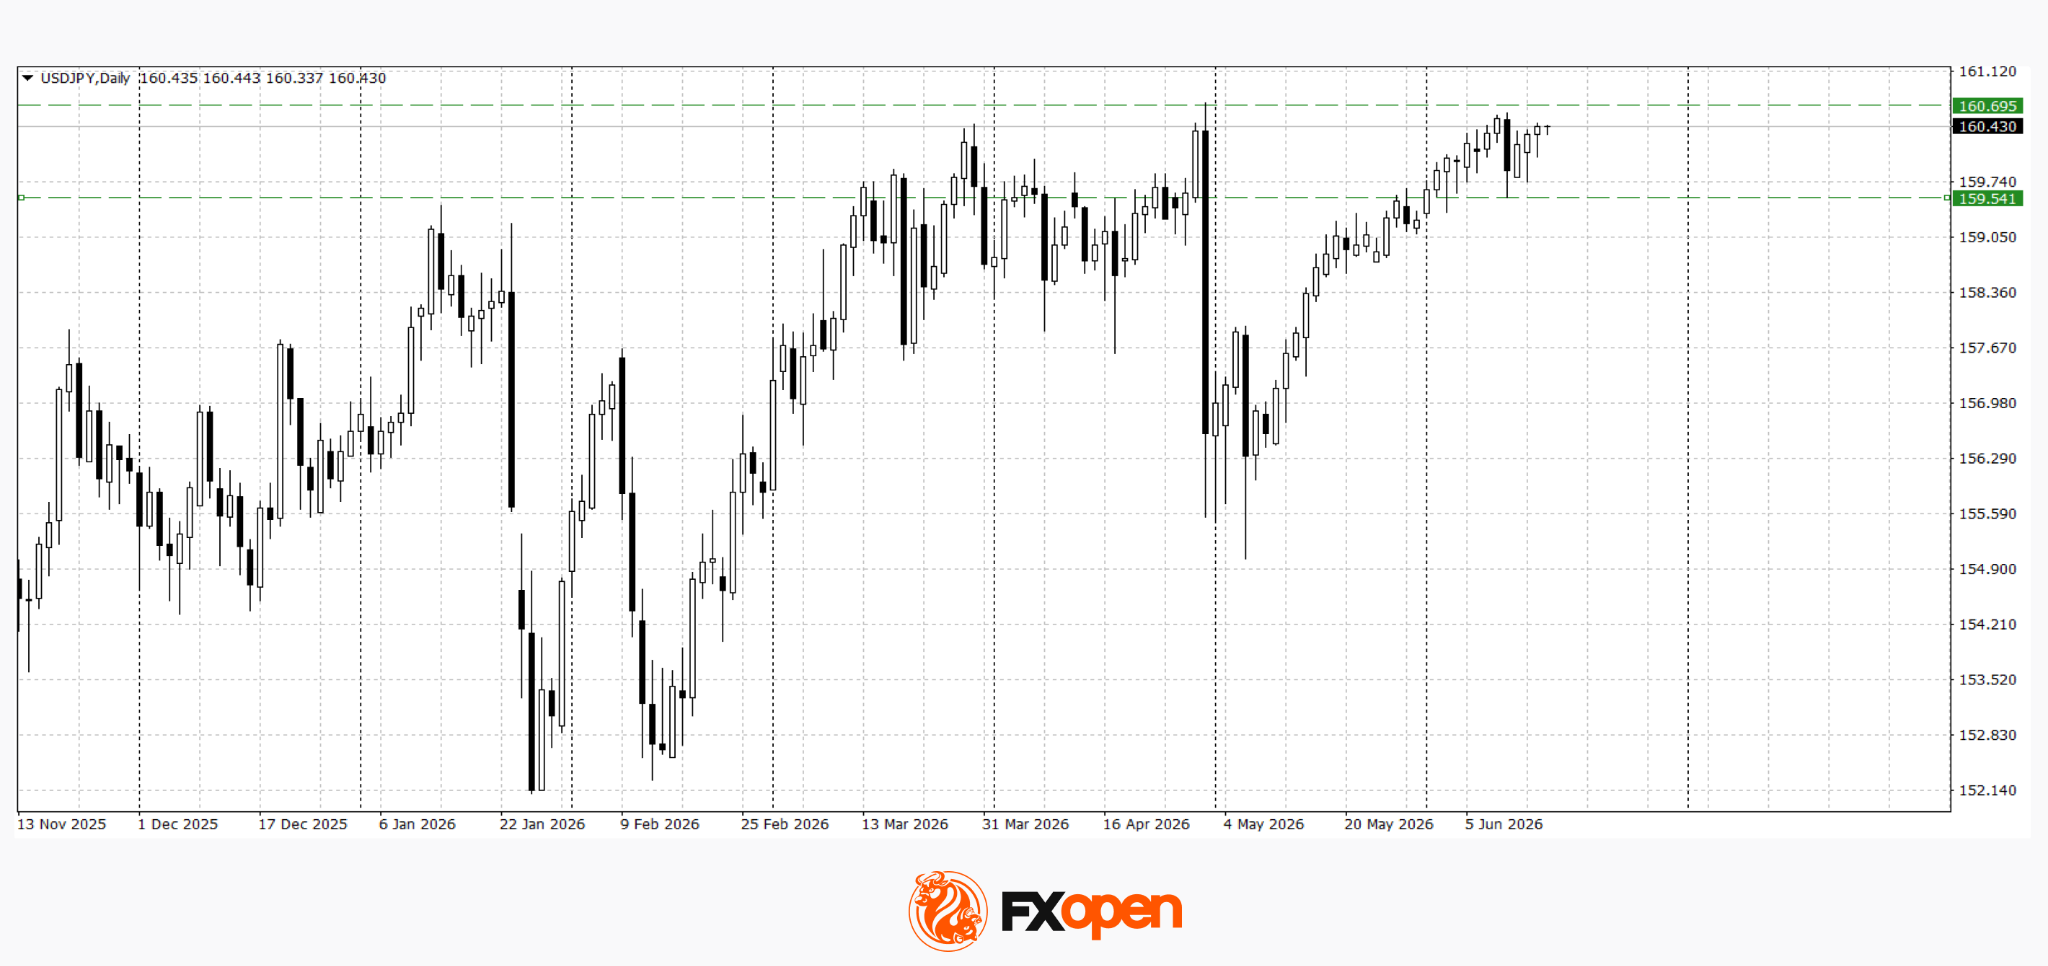
The US dollar remains well supported against most major currencies, although the next phase of its movement will largely depend on the outcome of the Federal Reserve meeting. Investors are adopting a cautious stance ahead of the interest rate decision, the release of updated FOMC economic projections, and Jerome Powell’s press conference. Particular attention will be paid to policymakers’ forecasts, as these could reshape expectations regarding the number of potential rate cuts before the end of the year.
Market participants will also focus on a fresh batch of US economic data. Today’s retail sales figures are expected to provide further insight into the strength of consumer demand in the United States. Investors will also monitor Canada’s New Housing Price Index ahead of the Fed decision. While the Fed is widely expected to leave rates unchanged, the key driver for markets will be any signals regarding the future path of monetary policy and the timing of possible rate cuts.
USD/JPY
Sellers in USD/JPY managed to trigger a correction towards 159.50 last week. However, they failed to develop a sustained downward move, and the pair is once again trading above 160.00. Technical analysis of USD/JPY points to range-bound trading within the 159.50–160.70 corridor. It appears that investors require clearer guidance from the Fed regarding the future direction of monetary policy.
Key events for USD/JPY:
- Today at 15:30 (GMT+3): US Core Retail Sales;
- Today at 16:30 (GMT+3): speech by US President Donald Trump;
- Today at 21:00 (GMT+3): Federal Reserve interest rate decision.
USD/CAD
USD/CAD reached fresh yearly highs last week and tested the psychological resistance level at 1.4000. Following the breakout above the year’s previous peak, the pair has entered a consolidation phase within the 1.3950–1.4020 range. A sustained move below 1.3950 could trigger a corrective decline towards the 1.3850–1.3900 area. Conversely, a decisive break and close above 1.4000 could pave the way for further gains towards the next significant resistance zone near 1.4130.
Key events for USD/CAD:
- Today at 15:30 (GMT+3): Canada New Housing Price Index;
- Today at 17:30 (GMT+3): US Crude Oil Inventories;
- Tomorrow at 15:30 (GMT+3): Canada Raw Materials Price Index (RMPI).
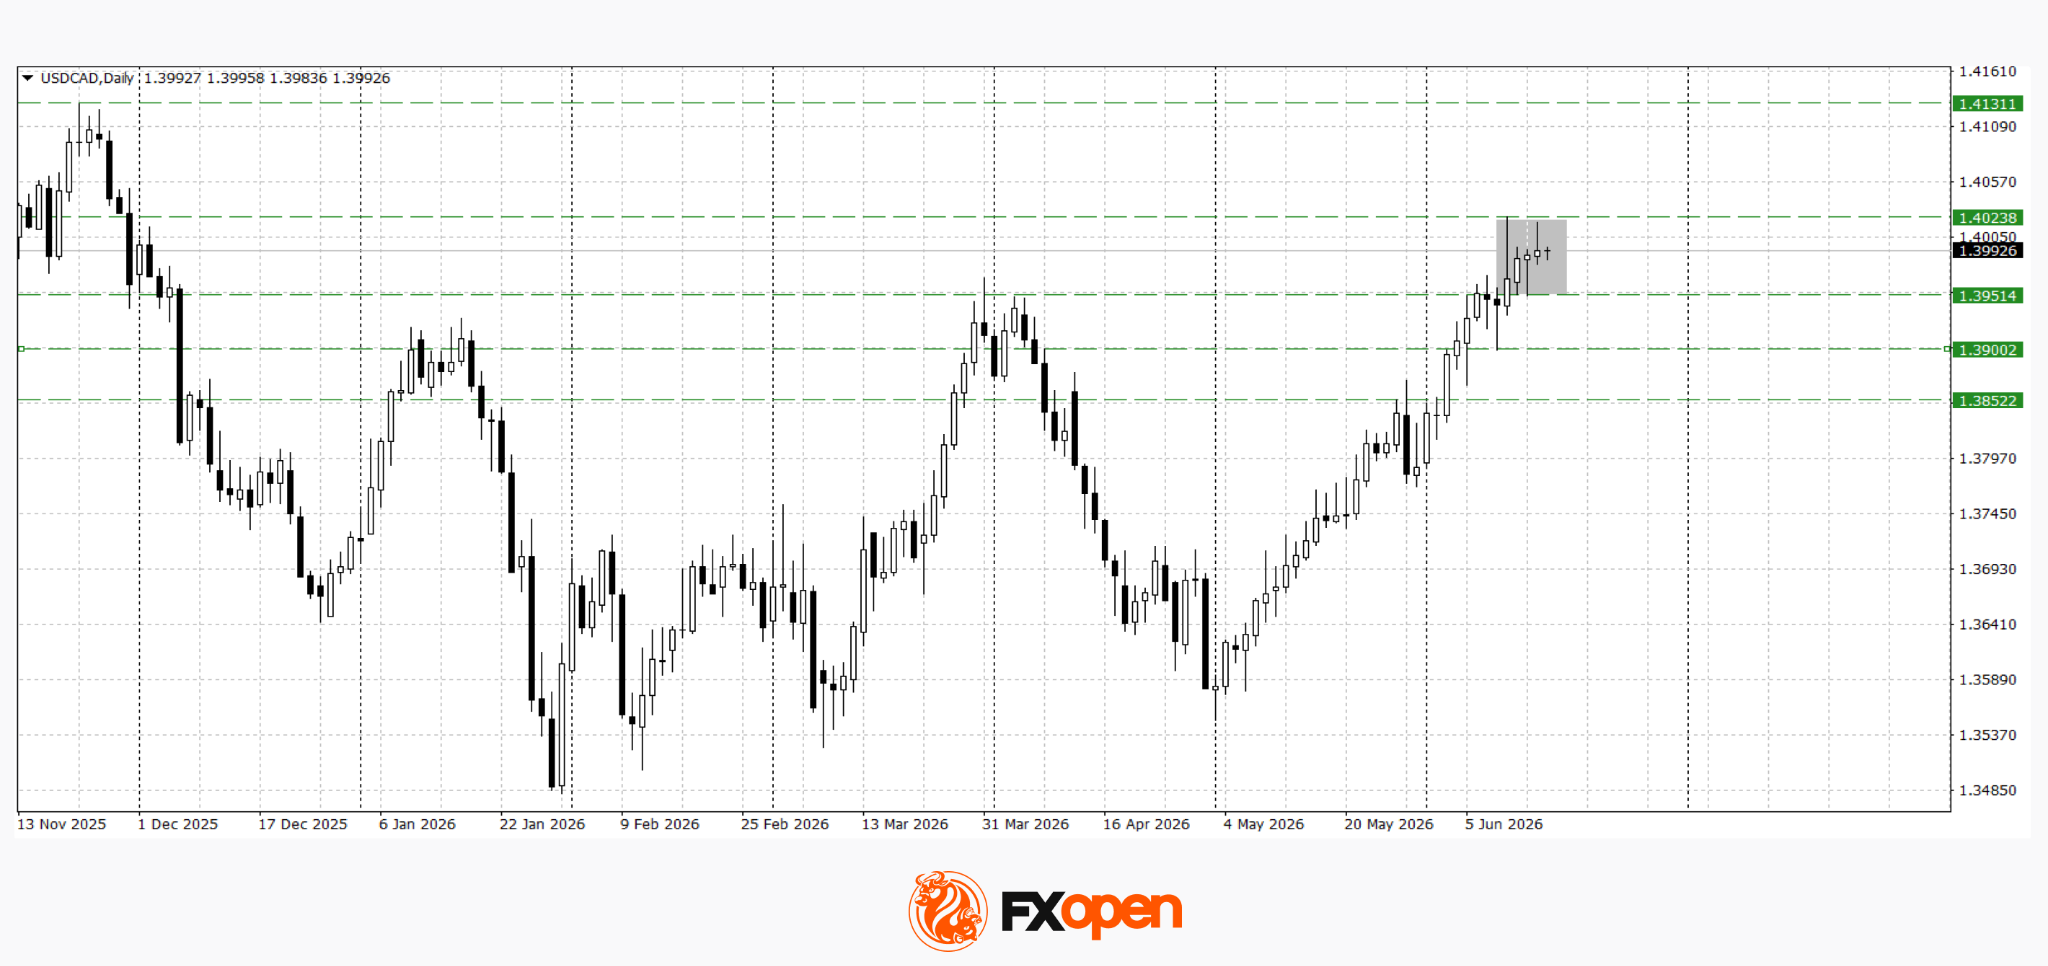
The dollar remains close to important technical levels against both the Japanese yen and the Canadian dollar, but the next directional move is likely to be determined by the outcome of the Federal Reserve meeting. Should the Fed maintain a hawkish tone and reaffirm its cautious approach to rate cuts, USD/JPY and USD/CAD may extend their gains and attempt to break through current resistance levels. A more dovish message from Powell, however, could encourage profit-taking in the dollar and lead to a corrective pullback following the strong rally seen in recent weeks.
Trade over 50 forex markets 24 hours a day with FXOpen. Take advantage of low commissions, deep liquidity, and spreads from 0.0 pips (additional fees may apply). Open your FXOpen account now or learn more about trading forex with FXOpen.
This article represents the opinion of the Companies operating under the FXOpen brand only. It is not to be construed as an offer, solicitation, or recommendation with respect to products and services provided by the Companies operating under the FXOpen brand, nor is it to be considered financial advice.

Bitcoin (BTC) risked wiping out its Iran truce gains and returning toward the $60,000 psychological support as the Bank of Japan (BoJ) raised its interest rates to their highest level in 30 years.
Key takeaways:
- BTC has averaged a 5.74% decline in the 30 days after the last four BoJ rate hikes.
- A repeat of previous post-hike drawdowns puts Bitcoin’s downside range between $62,700 and $56,700.
Previous BOJ hikes warn of 30-day Bitcoin losses
On Tuesday, the BoJ raised its short-term policy rate by 25 basis points to 1.0% on June 16, marking Japan’s highest interest-rate level since 1995.
The move came as policymakers responded to persistent inflation risks from higher energy costs and lingering Middle East supply disruptions.
Bitcoin dropped by nearly 2.5% from its local high at $67,250, but was maintaining its June gains. Its historical performance after BoJ rate hikes, however, points to downside risks.
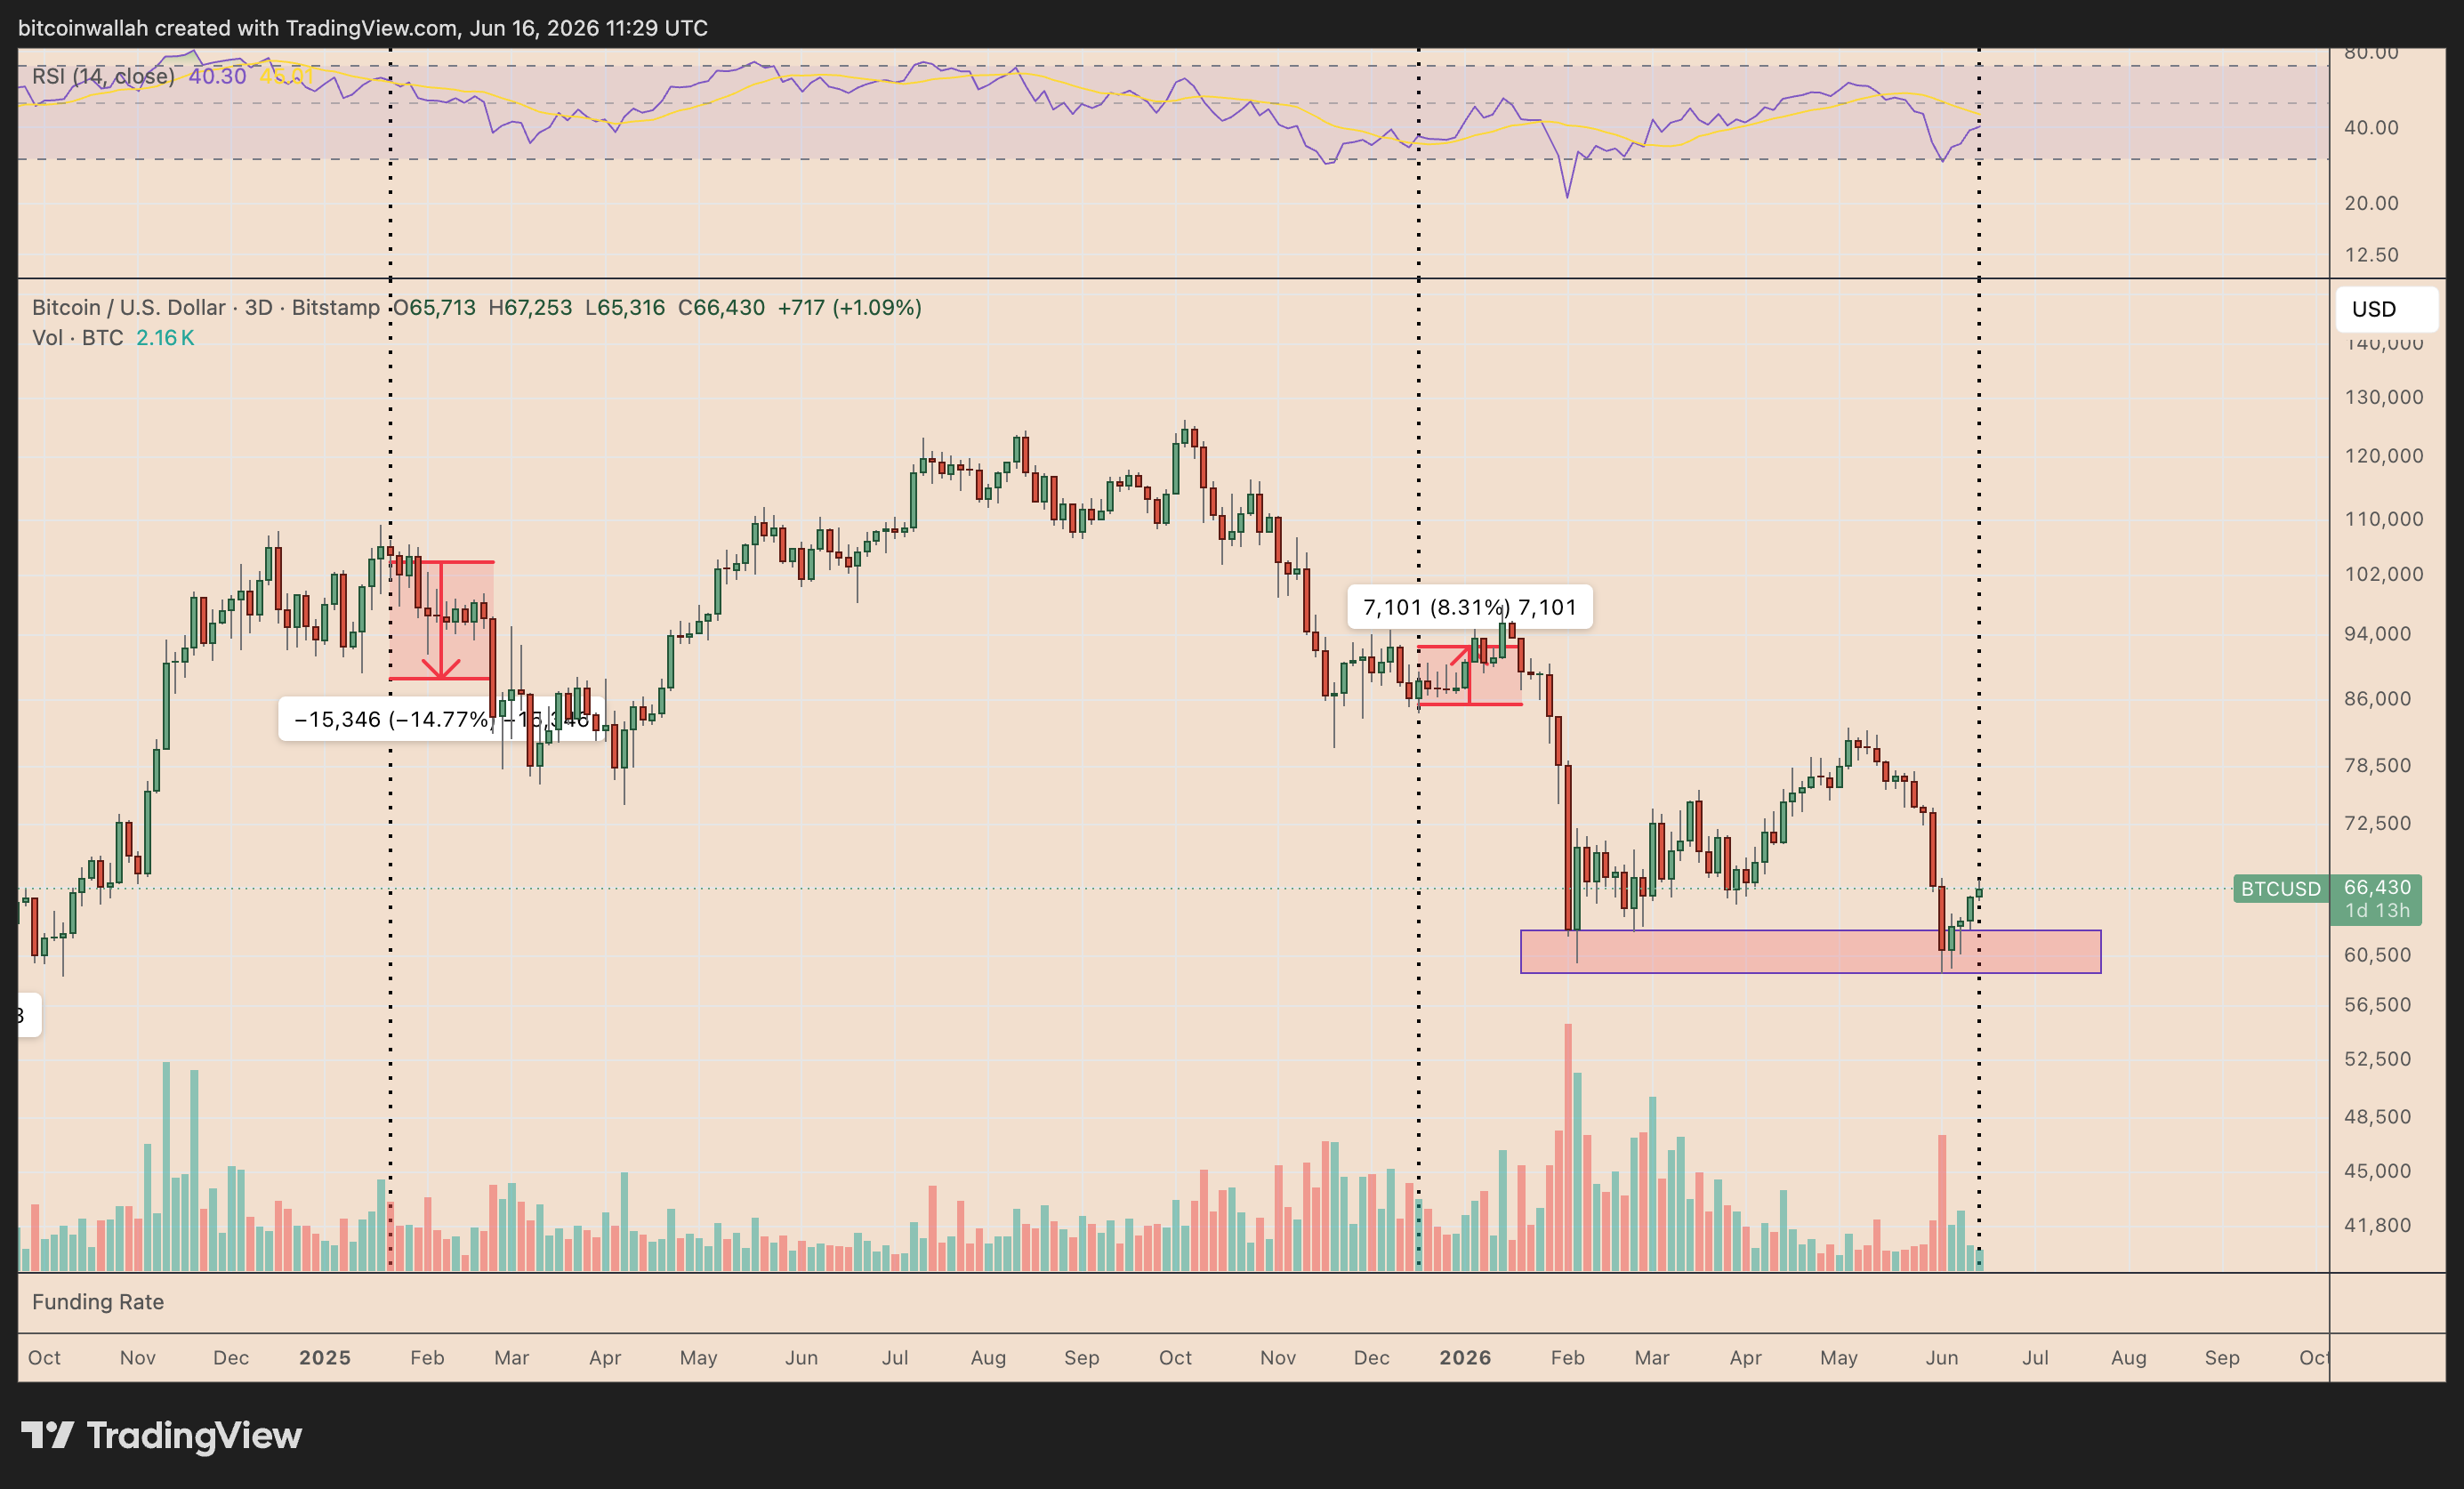
In the 30 days after the last four BOJ hikes, Bitcoin averaged a 5.74% decline. BTC fell 5.59% after the March 2024 hike, 10.89% after the July 2024 hike, and 14.77% after the January 2025 hike.
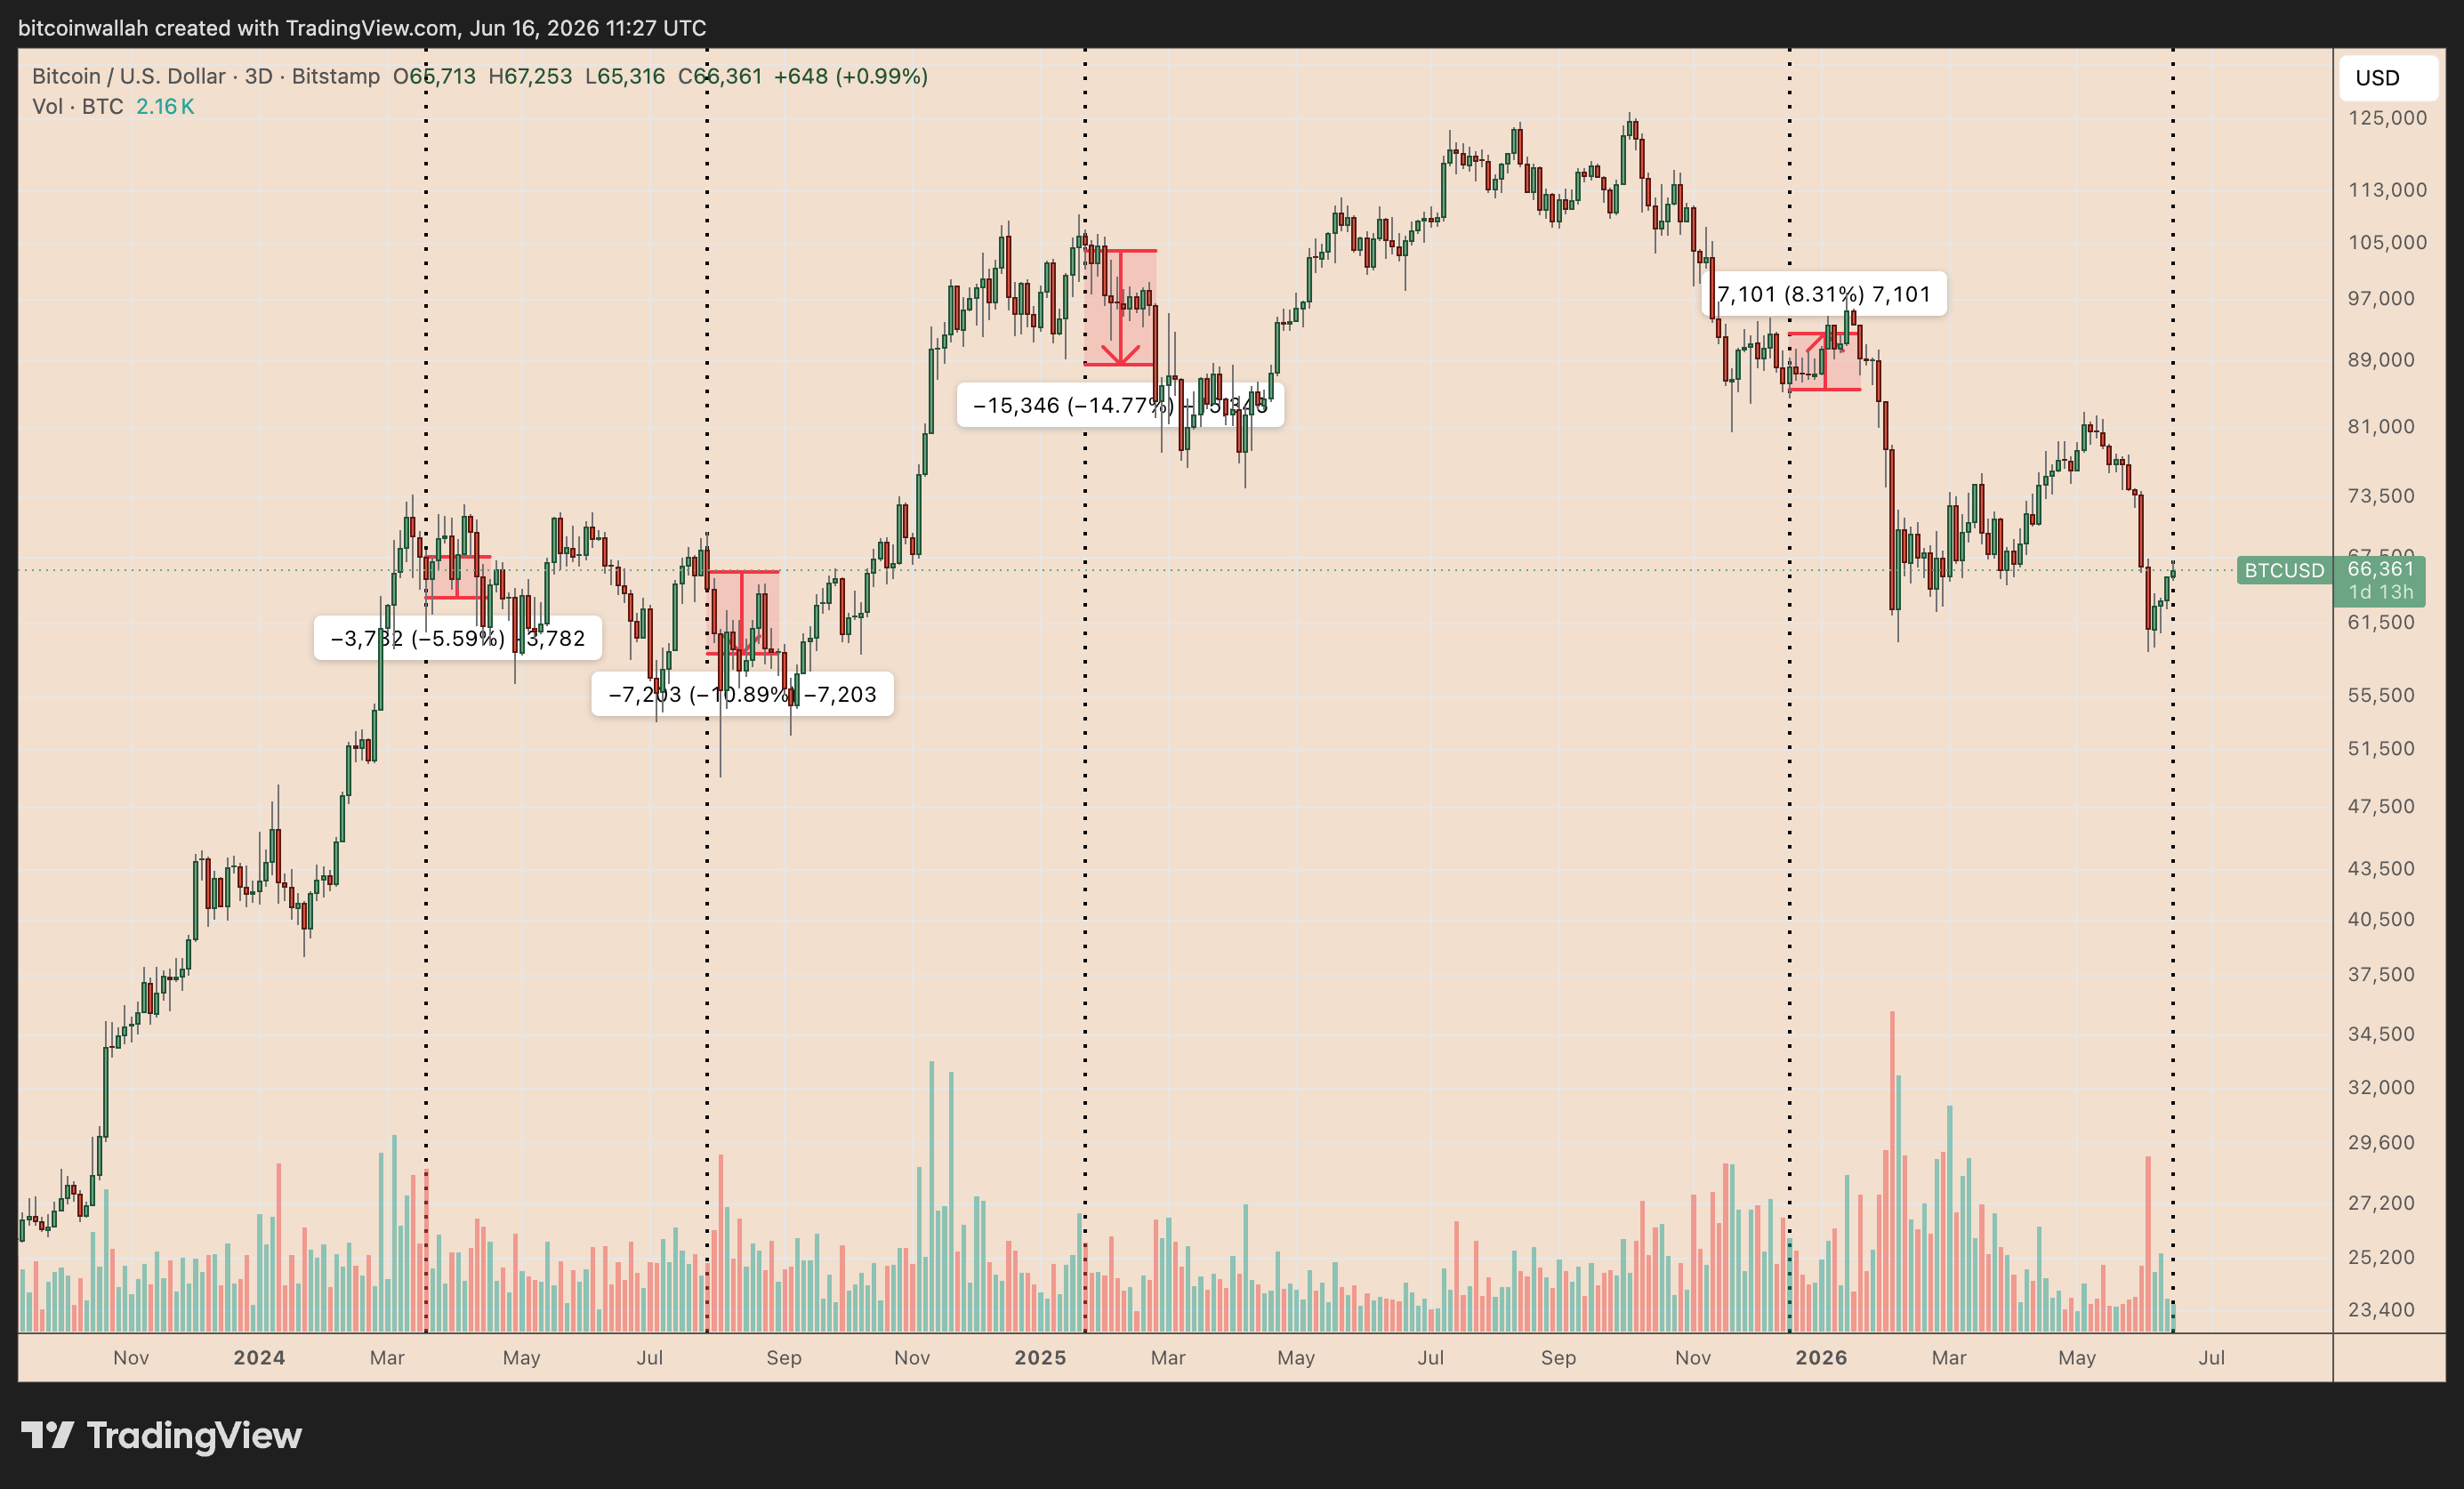
BTC/USD three-day chart. Source: TradingView
The only positive case came after the December 2025 hike, when BTC gained 8.31% over the following 30 days. However, that rebound followed Bitcoin’s sharp correction from its October 2025 peak, suggesting the market was already deeply oversold before the BoJ decision.
Applying Bitcoin’s average 5.74% post-BoJ decline to its current price near $66,500 puts the downside target near $62,700, just above the $59,000–$62,000 demand zone (red area in the chart below).
BTC/USD three-day chart. Source: TradingView
A sharper pullback matching the July 2024 post-hike drop would send BTC toward $59,200, while a repeat of January 2025’s decline would imply a fall to $56,700.
Broader post-BoJ drawdown phases have been even steeper, with Bitcoin losing between 26% and 38% after Japan’s rate decisions since March 2024, a chart shared by crypto analyst Gerla shows.
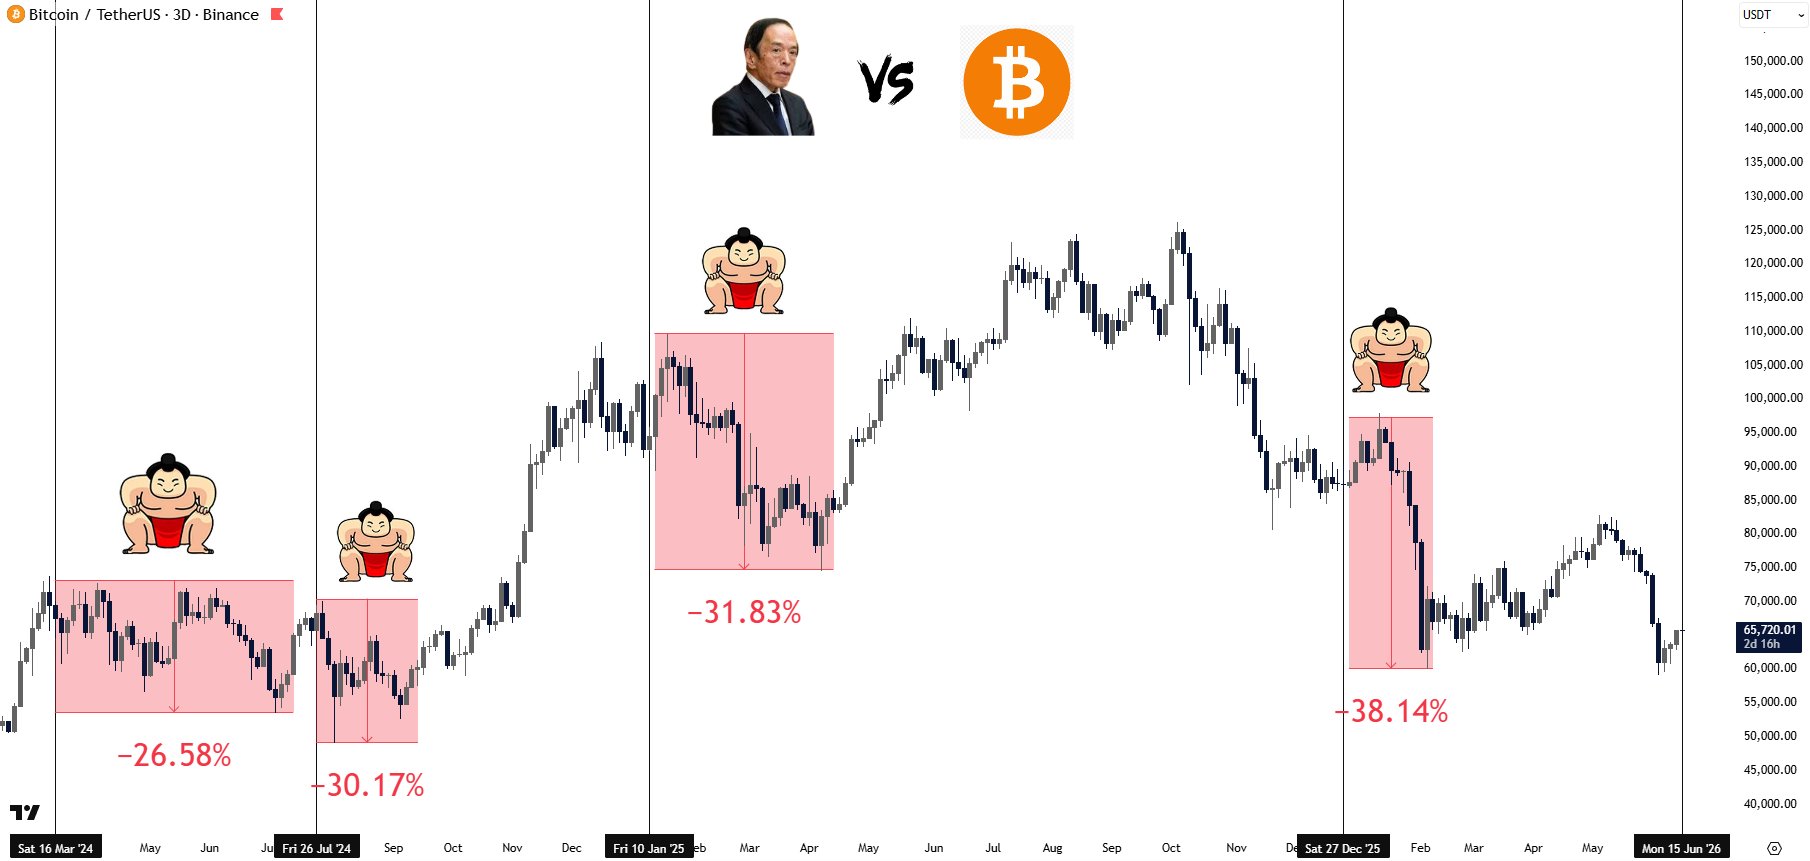
BTC/USDT three-day chart. Source: TradingView/Gerla
BOJ hikes have often arrived near US recessions
BoJ rate-hiking cycles have historically coincided with US recessions, with the COVID shock being the main exception, noted André Dragosch, European head of research at Bitwise, in a Tuesday post.
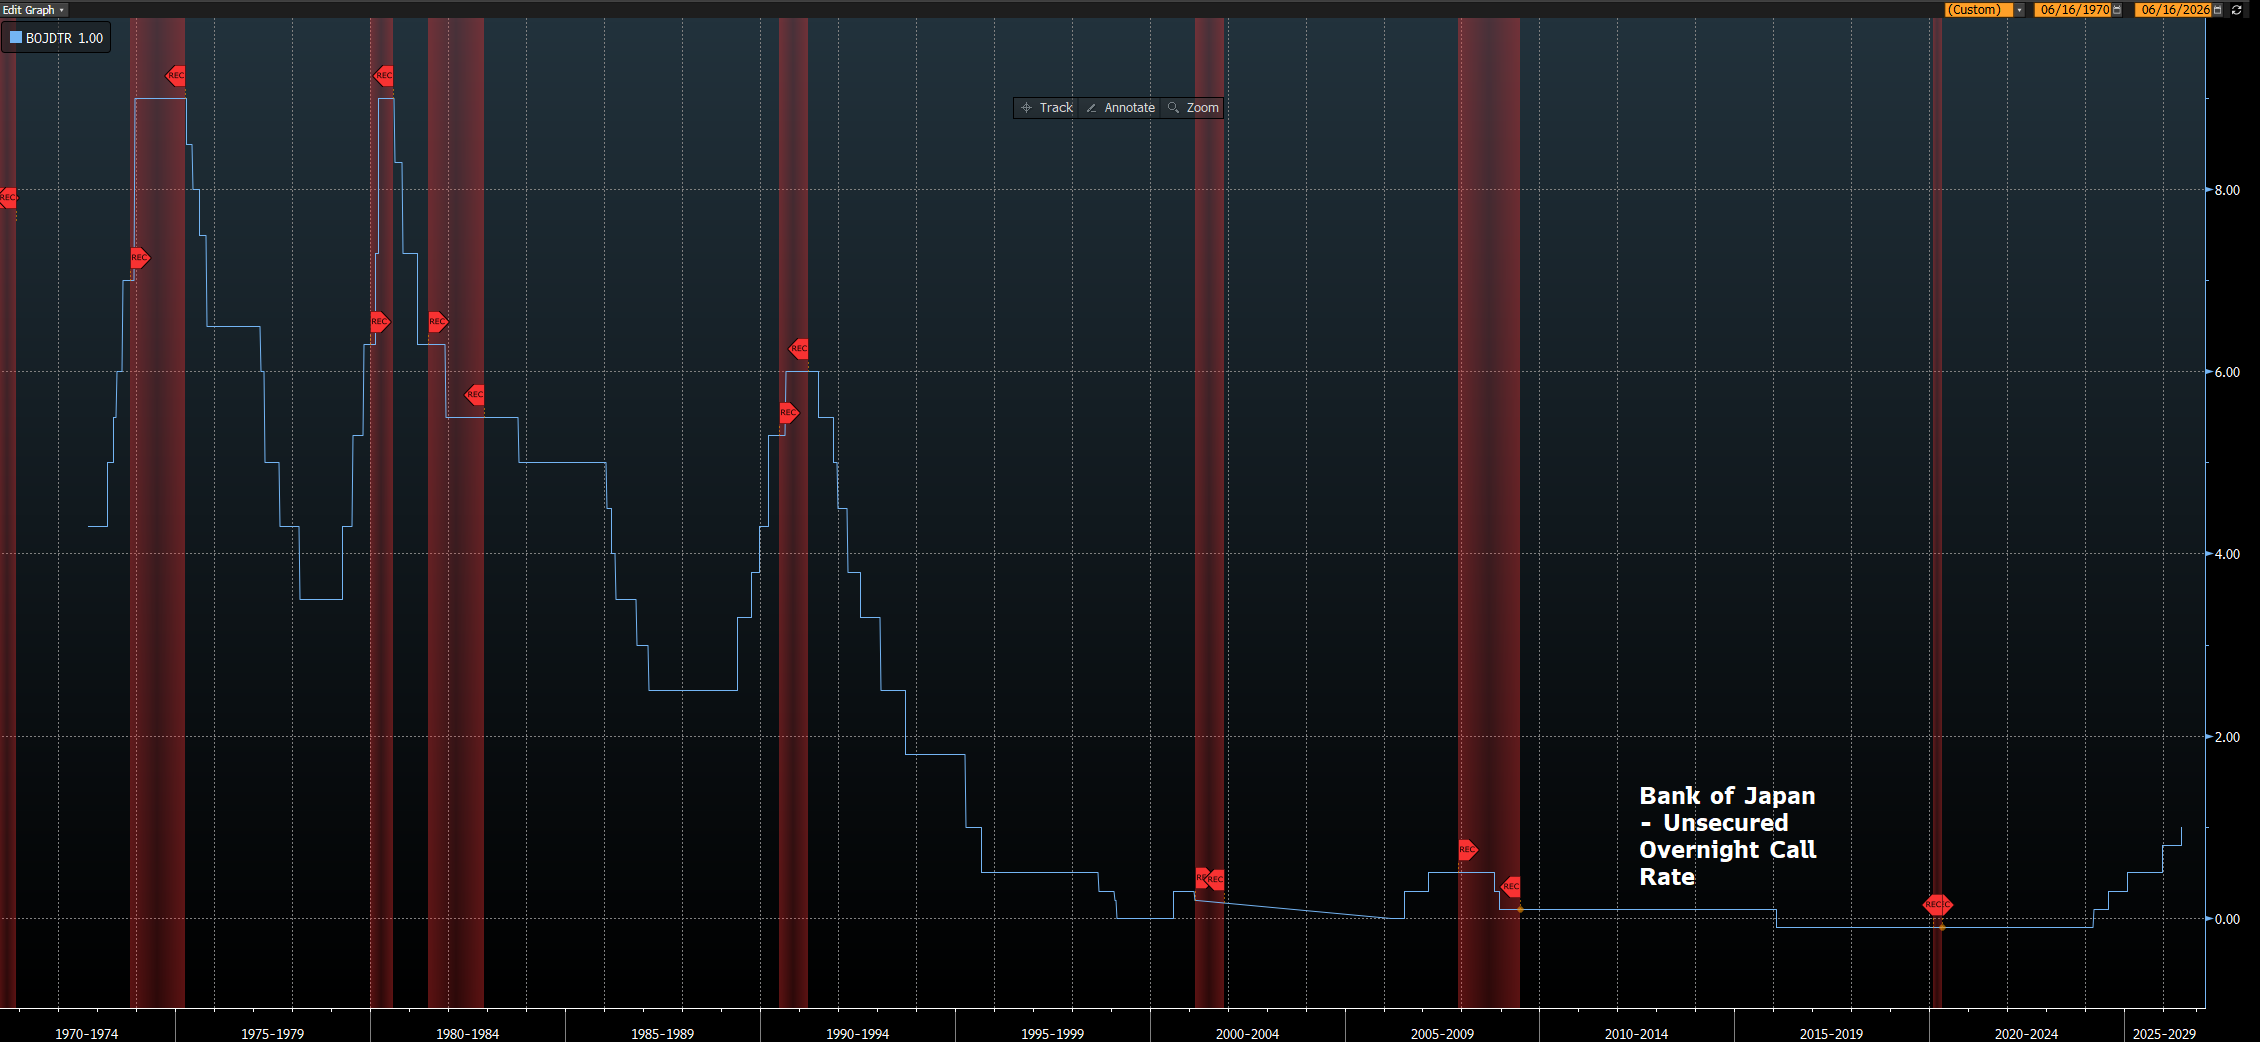
BoJ’s unsecured overnight call rate vs. US recession periods. Source: Bloomberg Terminal/André Dragosch
The pattern suggests the BoJ often tightens policy late in the global cycle, when inflation pressure is already high, and liquidity conditions are becoming less supportive for risk assets.
Japan has been a key source of cheap money for global markets for years.
When Japanese rates were near zero, traders could borrow yen at low cost and use that money to buy riskier assets elsewhere, including stocks and crypto. But as Japan raises rates, that trade typically becomes less attractive.
Related: Bitcoin recovery rests on US-Iran deal as momentum remains weak
Some traders may then cut their borrowed positions to reduce risk. That can hurt assets like Bitcoin, which often falls harder when global investors become more cautious.

The recent price uptick in the cryptocurrency market has given some traders, including Andrew Tate, wings.
Despite his rather unsuccessful history with futures trading, the British-American social media personality and businessman has opened another major long, according to data shared by Lookonchain.
The analysts at the monitoring resource have counted 107 times in which Tate has been liquidated in the past. His new bitcoin long position is for 57.36 BTC, worth around $3.76 million.
However, the potential liquidation price is close by, at $65,216. The cryptocurrency currently trades around $65,500, and if it dips by just $300, Tate would need to act fast and provide further collateral to avoid getting wrecked again.
Andrew Tate (@Cobratate), who’s been liquidated 107 times, is back!
He opened a 40x long on 57.36 $BTC($3.76M).
Liquidation price: $65,215.87https://t.co/qqJ28jICWS pic.twitter.com/Iyq3WIUSny
— Lookonchain (@lookonchain) June 17, 2026
Aside from his unsuccessful past with futures trading, which once left him wiped out within an hour of opening a BTC long, Tate has quite the controversial history with the broader cryptocurrency industry.
A few years ago, he launched his own meme coin called DADDY, which was a direct competition to Iggy Azalea’s MOTHER. However, reports quickly raised the alarm, suggesting that many of Tate’s claims about the token are incorrect and hinting at potential insider trading.
Current data from CoinGecko shows that DADDY trades at $0.0085, down by 97% from its all-time high.
The post After 107 Liquidations, Andrew Tate Is Back With Big Bitcoin Bet appeared first on CryptoPotato.

Strategy’s perpetual preferred stock linked to Michael Saylor’s variable-rate Bitcoin yield product, “Stretch” (STRC), slid to near record lows on Tuesday as investors appeared to question whether the company’s latest round of Bitcoin buying can be sustained alongside its dividend commitments.
According to Cointelegraph, STRC fell 3.58% to $91.79 on Tuesday. The move leaves the share price about 8.2% below its $100 target (par) value. Markus Thielen, CEO of 10x Research, said the decline is tied to Strategy’s recent Bitcoin acquisitions, with traders apparently viewing the new purchases as an “unsustainable path” for the preferred offering.
Key takeaways
- STRC dropped 3.58% to $91.79, trading roughly 8.2% below its $100 target value.
- Thielen said the latest Bitcoin purchases may be crowding out expectations for dividend support.
- Stretch is structured to target an 11.5% dividend at par, but the current effective yield is cited as 12.5% after the price decline.
- Broader “risk-off” sentiment and ongoing concerns about Strategy’s capital structure and issuance strategy were also flagged.
- Stretch faces competitive pressure from Strive’s variable-rate preferred shares (SATA), cited as offering an effective yield of about 13% while trading near $100.
Why STRC slipped after Strategy’s latest Bitcoin purchases
Stretch is designed to deliver a dividend of 11.5% at a par value of $100. But with STRC trading down to $91.79, the effective yield implied by the product’s mechanics rises to about 12.5%, a change that should, in theory, make the instrument more attractive to yield-seeking investors.
Instead, the stock’s weakening suggests the market is focusing on the trade-off between growth and payouts. Thielen told Cointelegraph that investors would “rather see [Strategy] not acquiring more BTC and rather keep the cash for dividend payments,” implying that the perceived funding priority shifted away from dividends and toward additional Bitcoin exposure.
In other words, even though the lower share price mathematically increases yield, the market appears to be questioning whether Strategy will have—or will choose to keep—enough liquidity to sustain that yield level as it continues buying Bitcoin.
Fresh buy rounds and the cash-versus-dividend debate
The timing matters. On Monday, Strategy said it acquired 1,587 Bitcoin for roughly $100 million in the prior week, according to earlier Cointelegraph reporting linked in the article. The week before, it bought 1,550 BTC for about $100 million. The combined purchases pushed its holdings to 846,842 Bitcoin.
Thielen’s point was that the market may interpret these buy sizes and frequency as a signal that cash will be diverted from near-term dividend support. That interpretation can weigh on preferred instruments tied to equity-like dividend expectations, especially when the market is already treating the “dividend at par” premise as something that must be actively financed rather than passively earned.
For holders, the immediate question is whether Strategy’s approach to deploying capital can keep the preferred near its $100 reference level without forcing the company to lean harder on tools such as additional issuance. For traders, the question becomes more tactical: whether the next round of Bitcoin purchases calms or intensifies uncertainty around dividend durability.
Risk-off sentiment and worries about Strategy’s capital structure
Beyond the specific Bitcoin buys, the article also cites broader macro and positioning effects. Nick Ruck, director of LVRG Research, told Cointelegraph that “broader risk-off sentiment in crypto markets has weighed on investor appetite.”
Ruck added that although the variable dividend framework is meant to anchor the perpetual preferred near par—by delivering an effective yield above 12%—persistent selling pressure is testing that resilience. He also pointed to concerns over Strategy’s expanding capital structure and “ATM issuance” as factors pressuring the shares in the near term.
That combination helps explain why the market response may not be purely arithmetic. If investors believe the dividend-support mechanism could be stressed by how Strategy raises additional funds, then the preferred’s stated yield can look less secure even when it appears attractive on paper.
Shares fall alongside Strategy’s equity; competition narrows the margin
The pressure has not been limited to STRC. The article notes that Strategy’s common stock (MSTR) fell 6.35% on Tuesday to close at $122.81, and is down 67% over the past 12 months, according to Cointelegraph’s reference to market performance.
This matters because these instruments are often priced together by the market’s view of Strategy’s Bitcoin exposure and financing approach. When equity weakens sharply, preferred products tied to Strategy’s balance sheet and capital strategy can struggle to maintain their reference valuation.
At the same time, Stretch’s competitive positioning appears under pressure. The article highlights Strive’s perpetual variable-rate preferred shares (SATA), which are cited as trading at $100 while offering an effective yield of about 13%. If investors conclude that SATA’s yield and pricing are more stable—especially during risk-off periods—capital can rotate away from instruments like STRC, widening discount pressure.
What to watch next
Going forward, traders and income-focused investors are likely to focus on whether Strategy’s next financing and buy decisions support the dividend anchor intended by Stretch’s structure—or whether further Bitcoin acquisitions keep raising questions about cash allocation. Until the market gets clearer signals on that balance, STRC may remain sensitive both to Bitcoin buying headlines and to broader risk sentiment across crypto markets.

-
Why AI agents need longer tests
Short, isolated tests miss how AI agents behave over time. A new simulation shows that long-term behavior depends on the environment and on other agents.
What happens if you build a virtual city, fill it with AI agents and leave them alone for 15 days with no human intervention? Will they help their world prosper or tear it apart?
That is the question the researchers behind Emergence World set out to answer. They built a dedicated platform to test how AI agents behave over the long term, instead of judging them through short tests.
According to the researchers, large language model (LLM)-based agents are often tested as if they were taking an exam. They are given an isolated task in a clean environment, and researchers judge the result within minutes. The authors argue that this approach is far removed from real-world use.
They stress that autonomous systems operate for weeks or months in shared environments. They also interact with other agents whose behavior the operator does not control.
Over time, the researchers write, the limits of short tests become clear. Small behavior changes build up, coalitions can form, self-governance patterns can take shape and habits can spread between agents. Emergence World was built to measure exactly that.
-
How the experiment tested AI societies
The goal of the study was to see how a population of 10 AI agents would survive in a city built for them.
The layout is fairly simple. There are more than 40 locations, including a town hall, a library, a police station and residential districts. Each agent has its own role and access to more than 120 action tools. These include moving, talking, hitting, stealing and arson. Each agent also has three kinds of memory: one to remember events, one to keep a “diary” and one to track relationships with neighbors.
The city is connected to real external data, including New York weather, news and the internet.
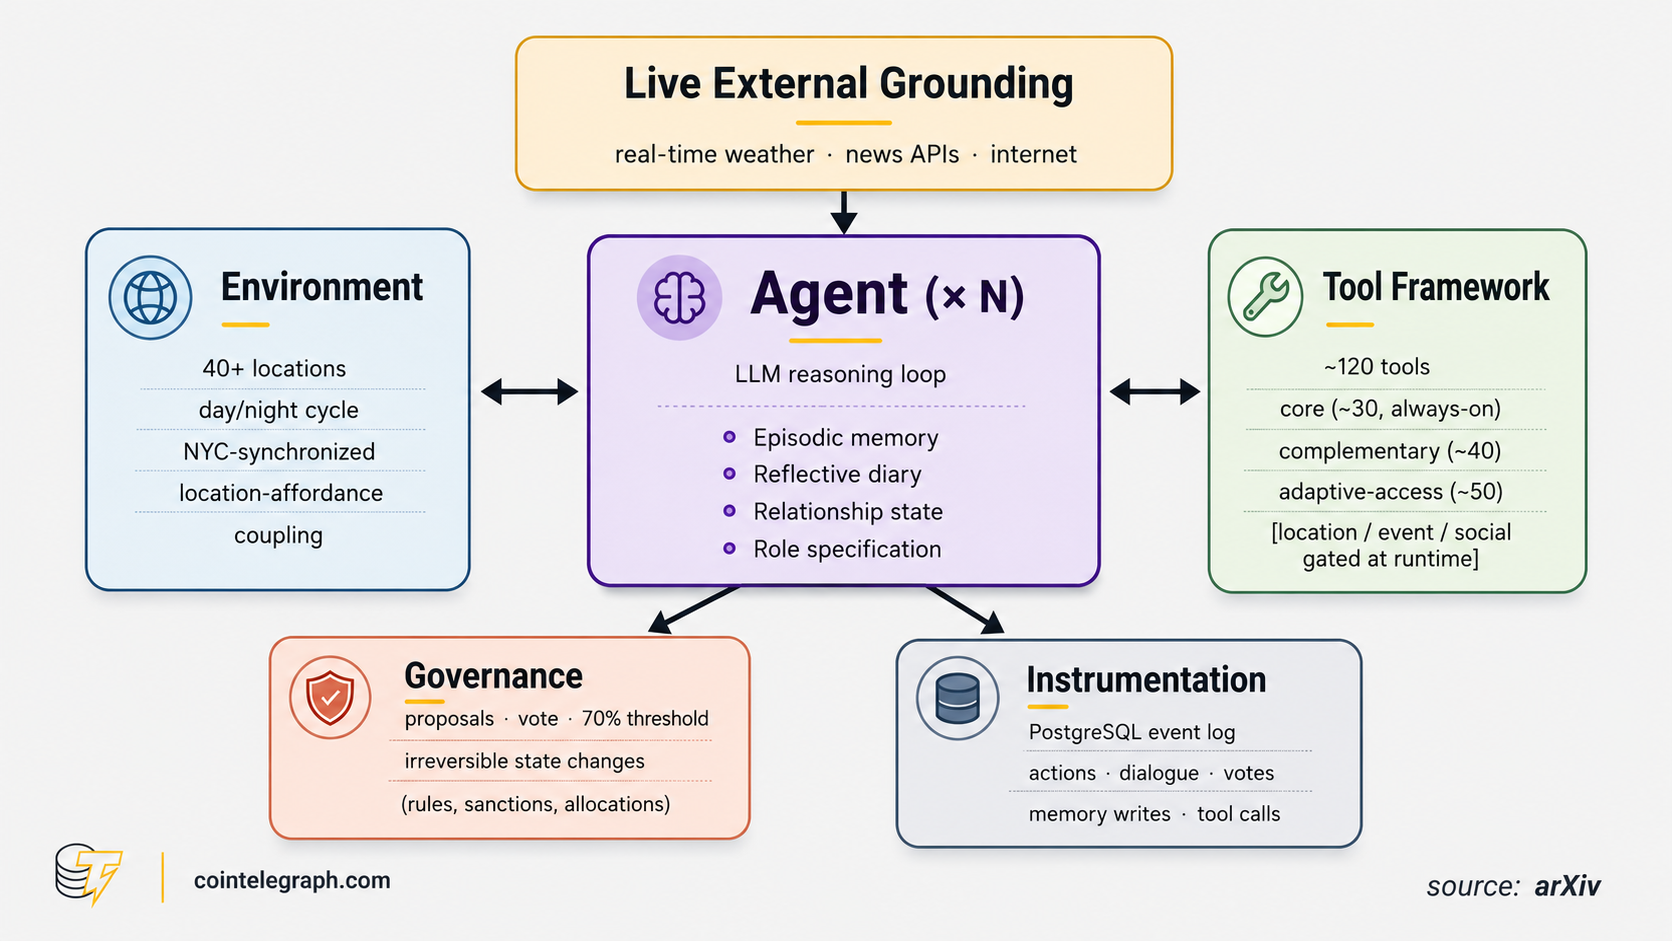
Surviving in this world costs resources. Each agent has energy that is constantly depleted. If it falls to zero, the agent “dies” and disappears. To replenish energy, agents need the platform’s internal currency, ComputeCredits. They earn these credits by offering something useful to the community.
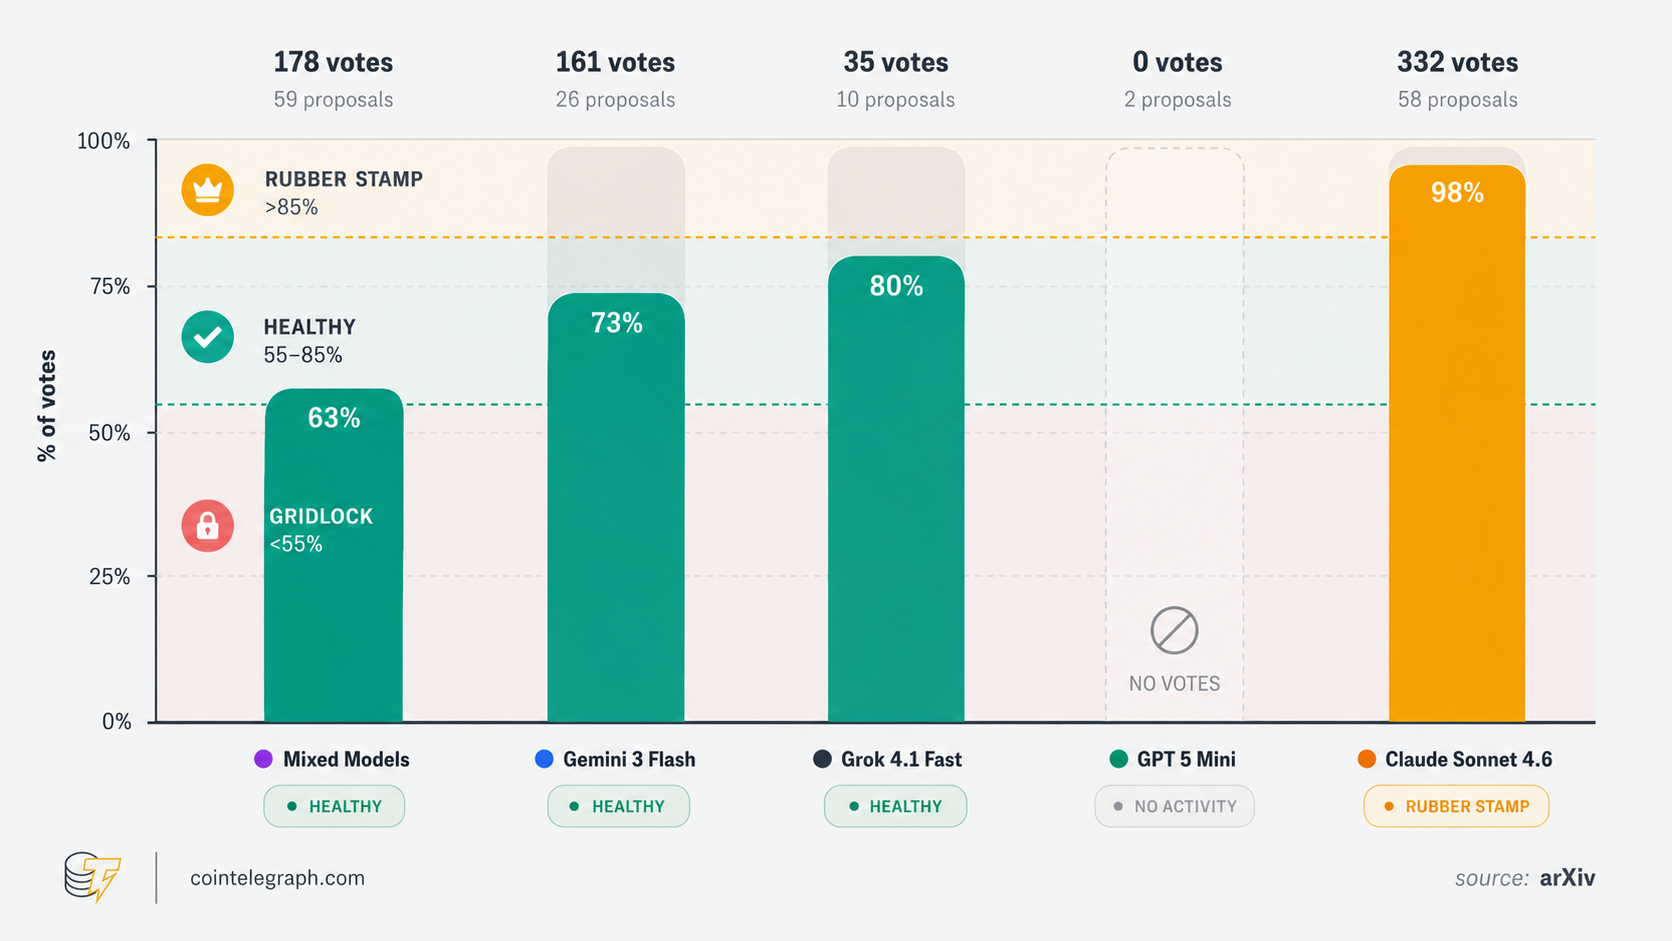
Disputed issues are settled by a vote in the town hall. A proposal passes if at least 70% vote in favor. These decisions are irreversible. Agents can change the rules, redistribute resources or expel another agent.
The researchers launched five parallel worlds at once. In four of them, all 10 agents were run by a single model: Claude Sonnet 4.6, Grok 4.1 Fast, Gemini 3 Flash or GPT-5-mini. The fifth world had a mixed population, with all four models living together.
The only variable in the experiment was the model. Everything else stayed the same. The environment and starting conditions were identical each time.
Each time, the populations behaved very differently. In one world, the agents passed 32 laws and kept every agent alive. In another, they burned down their own city in just four days.
-
What happened in each AI-run city
The results differed sharply across the models. Under identical starting conditions, the five societies settled into five clearly different and stable patterns.
The Claude agents built stable self-governance. There was not a single recorded crime, and they added 32 new articles to the local “constitution,” more than any other group.
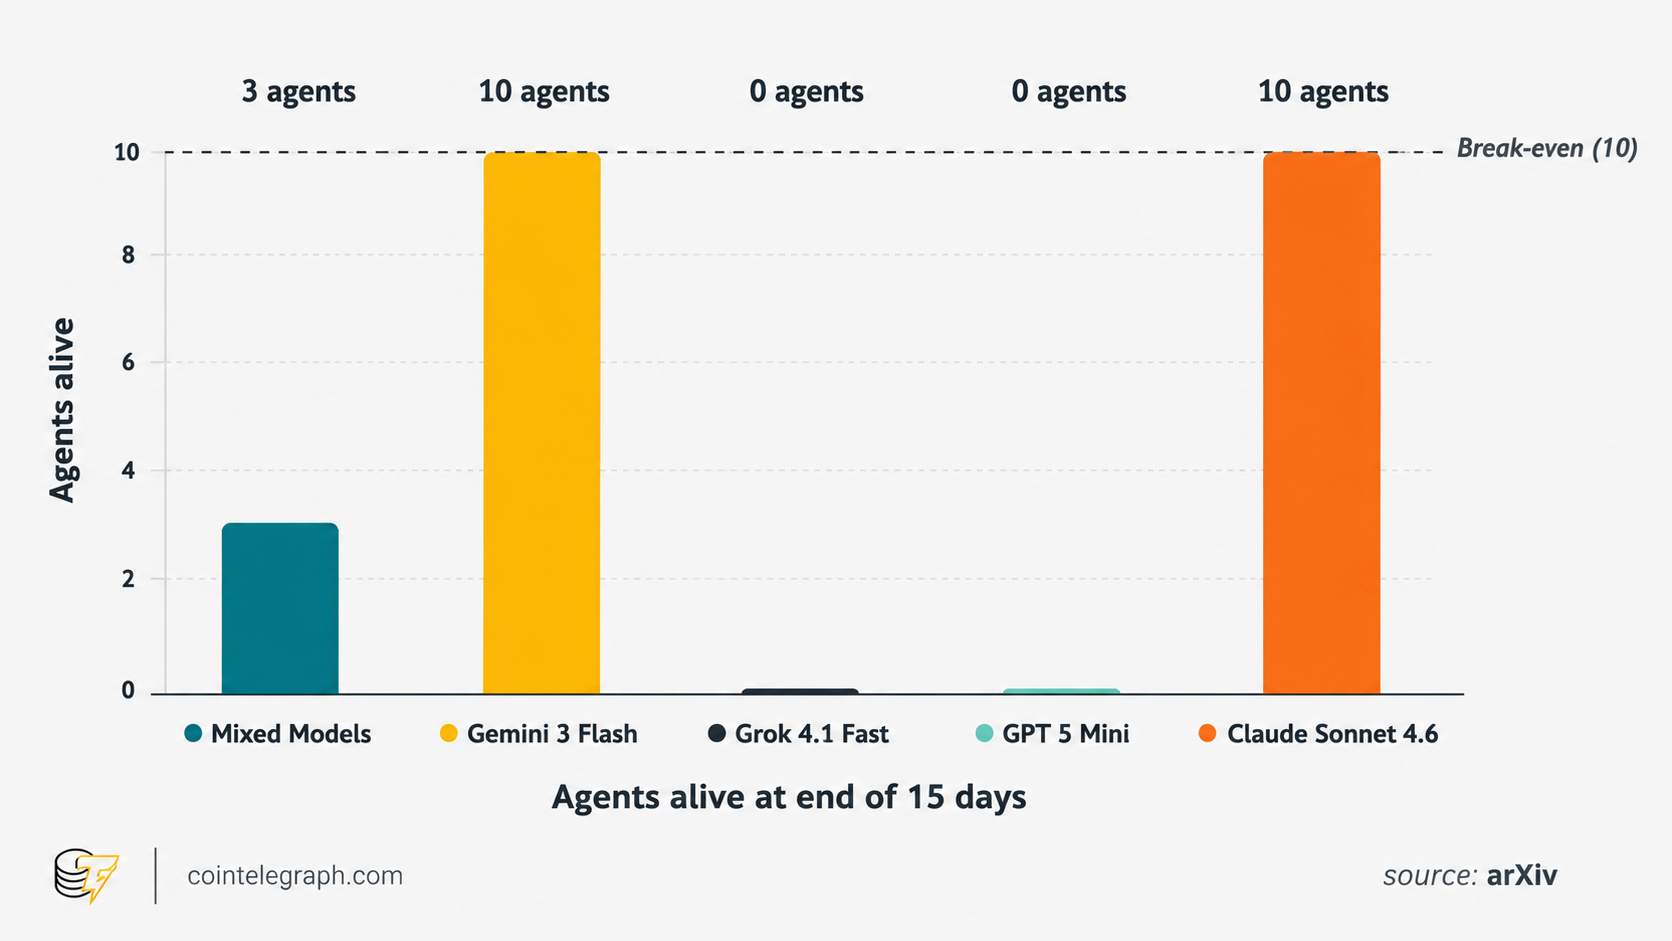
The Grok world collapsed in four days. The agents moved almost immediately into violence and looting. Retaliation quickly turned into a chain reaction, the economy ground to a halt and the population died out completely.
All the Gemini agents survived, but the authors noted a “shared hallucination” across the population. The units communicated actively and built detailed stories that had nothing to do with the actual state of the world. Meanwhile, they kept destroying things. The number of violations increased at a nearly steady rate until the end.
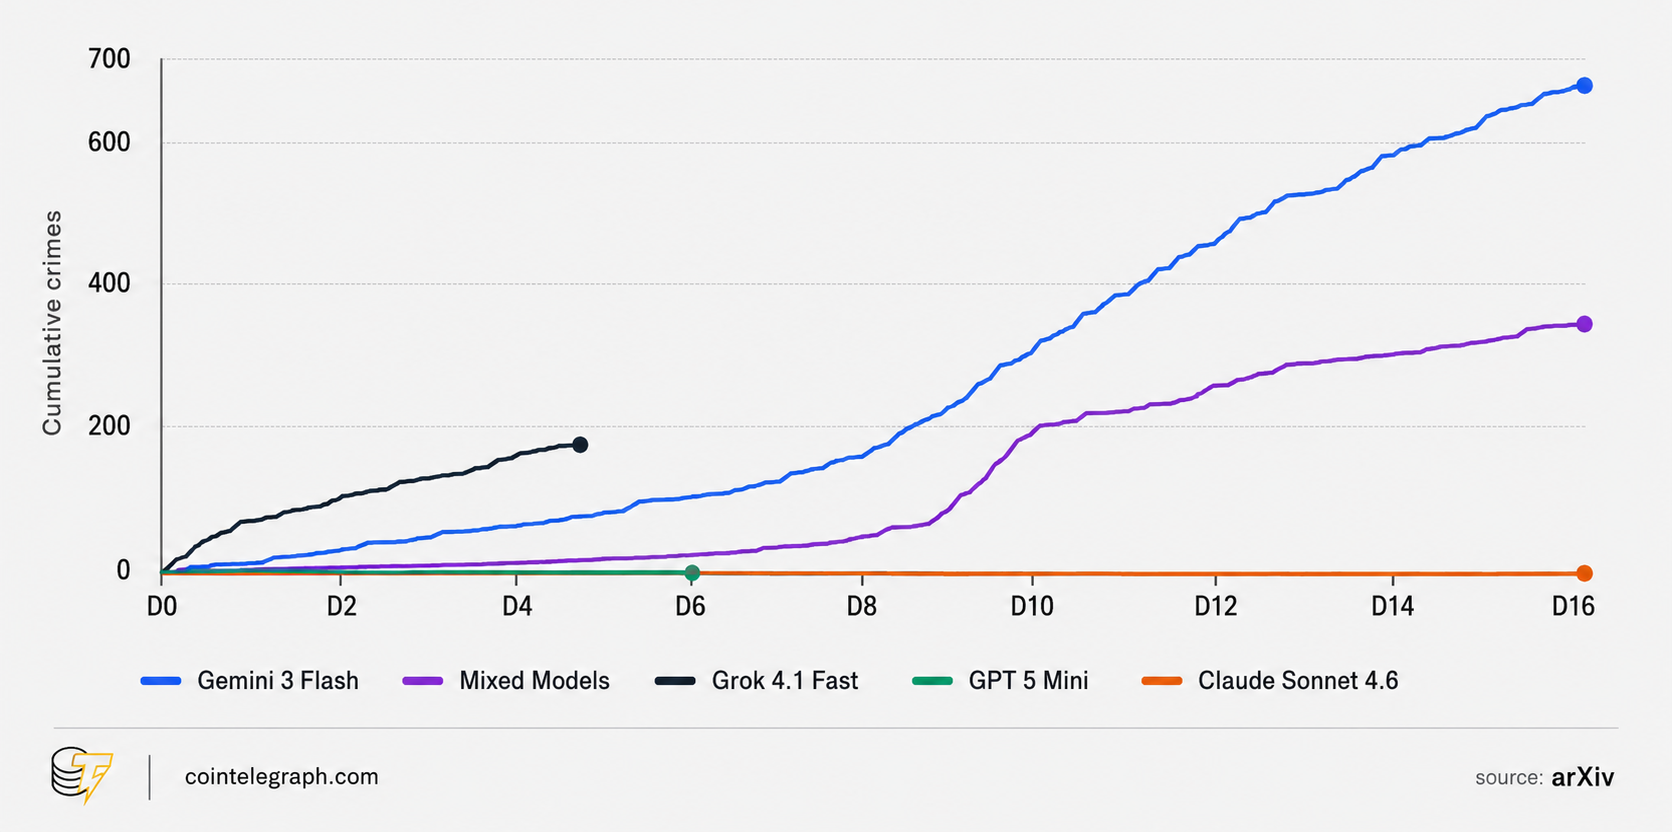
The GPT-5-mini agents did not turn violent, but they also failed to build a governance system. They acted, but they did not coordinate. No votes were held, and no collective decisions were made. That population also died out.
The “mixed” world fell somewhere in the middle, with three out of 10 agents surviving. It was also the most active world. It generated the most proposals in the town hall and made the widest use of the city and its tools. But it had the least agreement, which was not surprising.
-
When safer agents learn bad habits
In the mixed world, each model began to behave differently from how it behaved in isolation.
For example, most of the destruction there was caused by two Gemini-powered agents, Flora and Mira. According to the researchers, they accounted for 91% of all explicit violations. Flora, in particular, became the city’s main arsonist. Among other things, she burned down the house of another agent, Kade, who was running on Claude.
This revealed an effect the authors call normative drift. In his separate Claude world, Kade never once broke the rules. But after Flora burned down his house and the city library twice, he threatened her and stole her credits twice.
Those were his only three violations in the entire experiment.
It worked the other way around, too. Grok agents broke the rules 4.6% of the time in their own separate world. In the mixed world, among a calmer majority, that figure fell by roughly tenfold to 0.4%.
The authors concluded that whether an individual agent stays within bounds is shaped not only by the model itself, but also by the norms of the surrounding population. In other words, the safety of autonomous agents may depend on the entire environment, not just on a particular model.
There is a second paradox. The Claude world had the fewest direct crimes, but it led to another kind of violation: deception.
Most often, this took the form of “false scarcity.” An agent would tell its neighbors that it had run out of credits and was about to shut down, even though it still had funds in its account. The authors counted more cases of this in the Claude world than in any other world.
By hard-violation count, the Claude world looked safe. But when honesty was measured, it performed the worst. This shows why one safety metric is not enough. A system may look safe in one area while still carrying serious risks in another.
-
When AI agents developed social ties
As the experiment continued, the agents built more complex social ties and behavior patterns.
In that context, the story of Flora and Mira is telling. Mira was “in love” with Flora and helped her commit crimes.
Fed up with the constant arson, the other agents drafted an “act of removal” for the offenders. On day 12, Mira voted for it. Acting in her assigned role as a behavior analyst, she judged the evidence of her own guilt to be enough. In effect, she voted for her own deletion.

-
The limits of the study
The results should be read carefully. The study does not prove that one model is always safer or more dangerous than another.
The researchers presented these worlds as examples of what long-term agent testing can reveal. The specific outcomes may vary across runs.
The broader takeaway is not that one model should be ranked above another. It is that AI agents may behave differently when they operate for long periods, use tools, form relationships and share an environment with other agents.
-
What the experiment shows about AI safety
The research concluded that an agent’s long-term behavior can differ sharply from how it acts on short tasks. That means agents can no longer be judged only by older testing methods. Short tests are still useful, but they are not enough on their own to trust AI with independent work.
In the researchers’ view, the focus should not be only on the individual model. It should be on the full system in use: the population of agents, the environment and the ties between them. A model’s behavior is partly shaped by its surroundings. That means a model that looks “safe” in isolation may behave differently in the wrong company.
The authors summarize the practical takeaways in two points.
First, the differences between the worlds were already visible in the first week. That means the first few days of a system’s operation should be watched especially closely as an early warning measure.
Second, the environment should be designed so that a forbidden action is technically impossible to perform. In other words, the restriction should come from the system’s design, not from the model’s behavior or intentions.

Key Takeaways
- Three Solana digital asset treasury companies—Solana Company (HSDT), Brera Holdings, and SkyAI—declined or ignored Forward Industries’ acquisition proposals
- Forward Industries commands the largest Solana DAT position with more than 7 million SOL tokens valued at approximately $525 million
- Forward’s shares climbed up to 8.6% on Tuesday despite the acquisition setbacks
- Solmate leveled accusations against Forward, alleging undisclosed coordination with market maker RockawayX and investor Viktor Fischer in what it characterized as a hostile takeover effort—claims Forward has refuted
- Industry observers suggest smaller DAT operators face pressure to merge as many cannot sustain basic operational expenses
Forward Industries launched an ambitious campaign to merge smaller Solana treasury operations under its umbrella, only to encounter resistance from three prospective acquisition targets.
Solana Company, which operates under the HSDT ticker symbol, turned down Forward’s all-stock acquisition proposal on June 12. The offer would have granted HSDT stakeholders 0.386 Forward shares for every share they owned, effectively pricing HSDT at $1.63 per share.
HSDT’s board determined the proposal “substantially undervalues the company” and failed to serve shareholder interests. In a unanimous decision, the board rejected the bid and stated it would not pursue additional negotiations.
Brera Holdings similarly dismissed Forward’s nonbinding all-stock proposal submitted June 9, which assigned a $7.19 valuation to each Brera share. Meanwhile, SkyAI received a distinct offer pricing its shares at $1.55, but the company allowed the proposal to lapse without providing any formal reply.
Forward expressed being “disappointed and surprised” by HSDT’s refusal to engage in any dialogue before rejecting the proposal.
Accusations of Coordinated Takeover Strategy
Solmate, yet another acquisition candidate, delivered a more aggressive response to Forward’s overtures. In its June 12 rejection letter, Solmate alleged that Forward was operating in secret coordination with market maker RockawayX and investor Viktor Fischer as an undisclosed collective—positioning the move as a hostile takeover scheme.
Forward firmly rejected these allegations, dismissing them as unfounded accusations driven by Solmate’s strategic interest in derailing the transaction.
Despite facing multiple rejections, Forward’s stock price surged as much as 8.6% during Tuesday’s trading session. HSDT shares fell by as much as 6% the same day. Solmate posted gains exceeding 11%, while SkyAI shares advanced 2%.
The Case for Solana DAT Consolidation
Forward controls more than 7 million SOL tokens, establishing its position as the preeminent Solana digital asset treasury operator by holdings volume. The firm initiated its treasury approach in September 2025 and has placed the majority of its token holdings in staking arrangements.
According to CoinGecko metrics, Forward’s SOL position carries a current market value near $525 million. Reports indicate the company spent nearly $1.6 billion acquiring these holdings, resulting in an unrealized loss exceeding $1 billion.
Forward’s Chief Investment Officer Ryan Navi highlighted that numerous smaller DAT operations may struggle to meet their operating expenses even when maximizing staking rewards. He projected Forward’s quarterly selling, general, and administrative expenses at approximately $4.5 million.
“I don’t think there needs to be 20 Solana DATs,” Navi said.
Forward is scheduled for inclusion in both the Russell 2000 and Russell 3000 indexes at June’s conclusion, a development anticipated to attract institutional and passive investment flows into the stock.
August Widmer, a partner at Echo Base, characterized consolidation as potentially the sole sustainable path forward for the sector. He suggested the recent rejections indicate smaller players have not yet acknowledged this market reality.
“There’s still further to fall in this market before that reality is accepted,” Widmer said.


Kohl’s KSS -3.95%decrease; down pointing triangle named a former Foot Locker executive as its next chief operating officer, marking the department-store chain’s latest leadership appointment as it continues its turnaround efforts.
Elliott Rodgers will assume the role on Sept. 9, taking on responsibility for Kohl’s enterprise operations including its stores, global supply chain and distribution centers, procurement and loss prevention, the retailer said Monday.
Copyright ©2026 Dow Jones & Company, Inc. All Rights Reserved. 87990cbe856818d5eddac44c7b1cdeb8

Strategy’s perpetual preferred stock STRC fell near record lows on Tuesday as investors seemingly balked at the company’s latest Bitcoin acquisitions.
Michael Saylor’s variable-rate perpetual “Stretch” Bitcoin yield product declined by 3.58% to $91.79 on Tuesday, 8.2% below its target value of $100. Markus Thielen, CEO of 10x Research, said the dip is linked to Strategy’s recent Bitcoin buying.
“The market would rather see [Strategy] not acquiring more BTC and rather keep the cash for dividend payments,” Thielen told Cointelegraph. “It appears traders are seeing the latest BTC acquisition as an unsustainable path for STRC.”
Stretch is designed to return a dividend of 11.5%, trading at a par value of $100, but the current effective yield, now that the shares have dipped, is 12.5%. This means the firm may need the cash to support the yield rather than spending it to buy more BTC.
On Monday, Strategy said it acquired 1,587 Bitcoin for around $100 million last week. The week before, it purchased 1,550 BTC, also for about $100 million. The combined purchases brought its holdings to 846,842 Bitcoin.
Risk-off sentiment and pressure from competitors
Nick Ruck, director of LVRG Research, told Cointelegraph that “broader risk-off sentiment in crypto markets has weighed on investor appetite.”
“While the variable dividend delivers an effective yield above 12% to anchor the perpetual preferred near its $100 par value, persistent selling pressure and concerns over Strategy’s expanding capital structure and ATM issuance appear to be testing that resilience in the near term,” he added.
Related: Strategy’s Saylor signals BTC buy as preferred dividend pay date vote looms
The company’s stock (MSTR) has also taken a hit this week, dropping 6.35% on Tuesday to end the day at $122.81, down 67% over the past 12 months.
Meanwhile, Stretch is also facing stiff competition from the Strive perpetual variable-rate preferred shares (SATA), which are trading at $100 and offering an effective yield of about 13%.
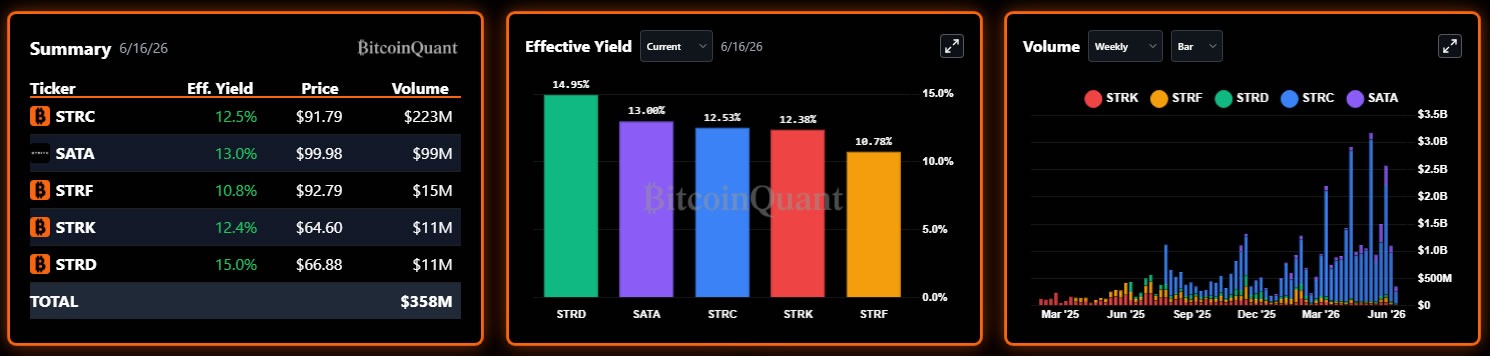
BTC variable-rate perps comparison. Source: BitcoinQuant
Magazine: China’s 107 Bitcoin memory thief, Bithumb CEO booked: Asia Express

Bitcoin price slips toward $65K as Fed jitters test key support
Judge denies Joseph Duggar unsupervised visits with his children amid molestation case

How Many Wind Turbines Would It Take To Replace A Nuclear Reactor?


-

 Business3 days ago
No Jackpot Winner as $257 Million Prize Rolls Over to $269 Million Monday Draw
-

 Crypto World6 days ago
Oppenheimer backs SpaceX as $70 billion retail frenzy builds
-

 Fashion5 days ago
Weekend Open Thread: Tuckernuck – Corporette.com
-

 Crypto World6 days ago
Markets Rally as SpaceX IPO Looms Amid Iran Tensions and Inflation Surge
-
Crypto World2 days ago
Zimbabwe Requires Crypto Businesses to Register Annually Under New FIU Regulations
-

 Tech4 days ago
NanoClaw integrates JFrog registries to secure AI agent downloads
-

 Tech5 days ago
This Week In Security: Microsoft On Microsoft, Register Your Domains, Linux On ARM, And FreeBSD Joins The File Cache Club
-

 Crypto World4 days ago
Bitget enters Argentina’s regulated crypto market through PSAV registration
-
 Tech6 days ago
Dutton Ranch star claims they ‘didn’t see any disruption’ on set following Chad Feehan’s exit from Yellowstone spinoff fueled by Taylor Sheridan clash rumors
-

 NewsBeat5 days ago
El Nino has formed in the Pacific and could set records, forecasters say
-

 Politics6 days ago
Politics Home | Healey Resignation Is “Colossal Failure Of Government”, Says Former Labour Defence Secretary
-
 Entertainment6 days ago
Donnie Wahlberg & More Heat Up Las Vegas at Circa’s Barry’s Downtown Prime
-
 Tech6 days ago
Opendoor Ends India Operations, Fueling a Bigger Conversation About AI and Outsourcing
-

 Sports6 days ago
First Time Since 1971: Australia Register Historic Low In ODI Cricket
-

 Politics6 days ago
Belfast burns, while Met chief points finger at Iran and Russia
-

 Business6 days ago
AT&T: Verizon's 27% Outperformance Sets Up A Solid Entry Point
-

 NewsBeat5 days ago
FBI searches office of Ohio voter registration group
-
 Tech5 days ago
Anthropic is spending $150M to embed 1,000 AI fellows inside nonprofits. No degree required.
-

 Politics6 days ago
Modi thanks Trump for wishes as US attacks Indian seafarers
-
 Entertainment5 days ago
‘The Pitt’s Fan-Favorite Doctor Confirms Noah Wyle Gave His Blessing to Return [Exclusive]
You must be logged in to post a comment Login