
Crypto World
How to Predict An October 10-Style Bitcoin Crash Early
Billion-dollar liquidation events are no longer rare in crypto markets. While these crashes often appear suddenly, on-chain data, leverage positioning, and technical signals usually reveal stress long before forced selling begins. This article examines whether reconstructing major historical events can help anticipate liquidation cascades.
Keep reading on for early signals and how to read them together. Throughout this piece, we analyze two major events: October 2025 (long liquidation cascade) and April 2025 (short squeeze), and trace the signals that appeared before both. The focus remains primarily on Bitcoin-specific metrics, as it still accounts for nearly 60% (59.21% at press time) of total market dominance.
October 10, 2025 — The Largest Long Liquidation Cascade Came With Signs
On October 10, 2025, more than $19 billion in leveraged positions were taken out, making it the largest liquidation event in crypto history. Although US–China tariff headlines are often cited as the trigger, market data show that structural weakness was around for weeks. The majority of these liquidations were long-biased, almost $17 billion.
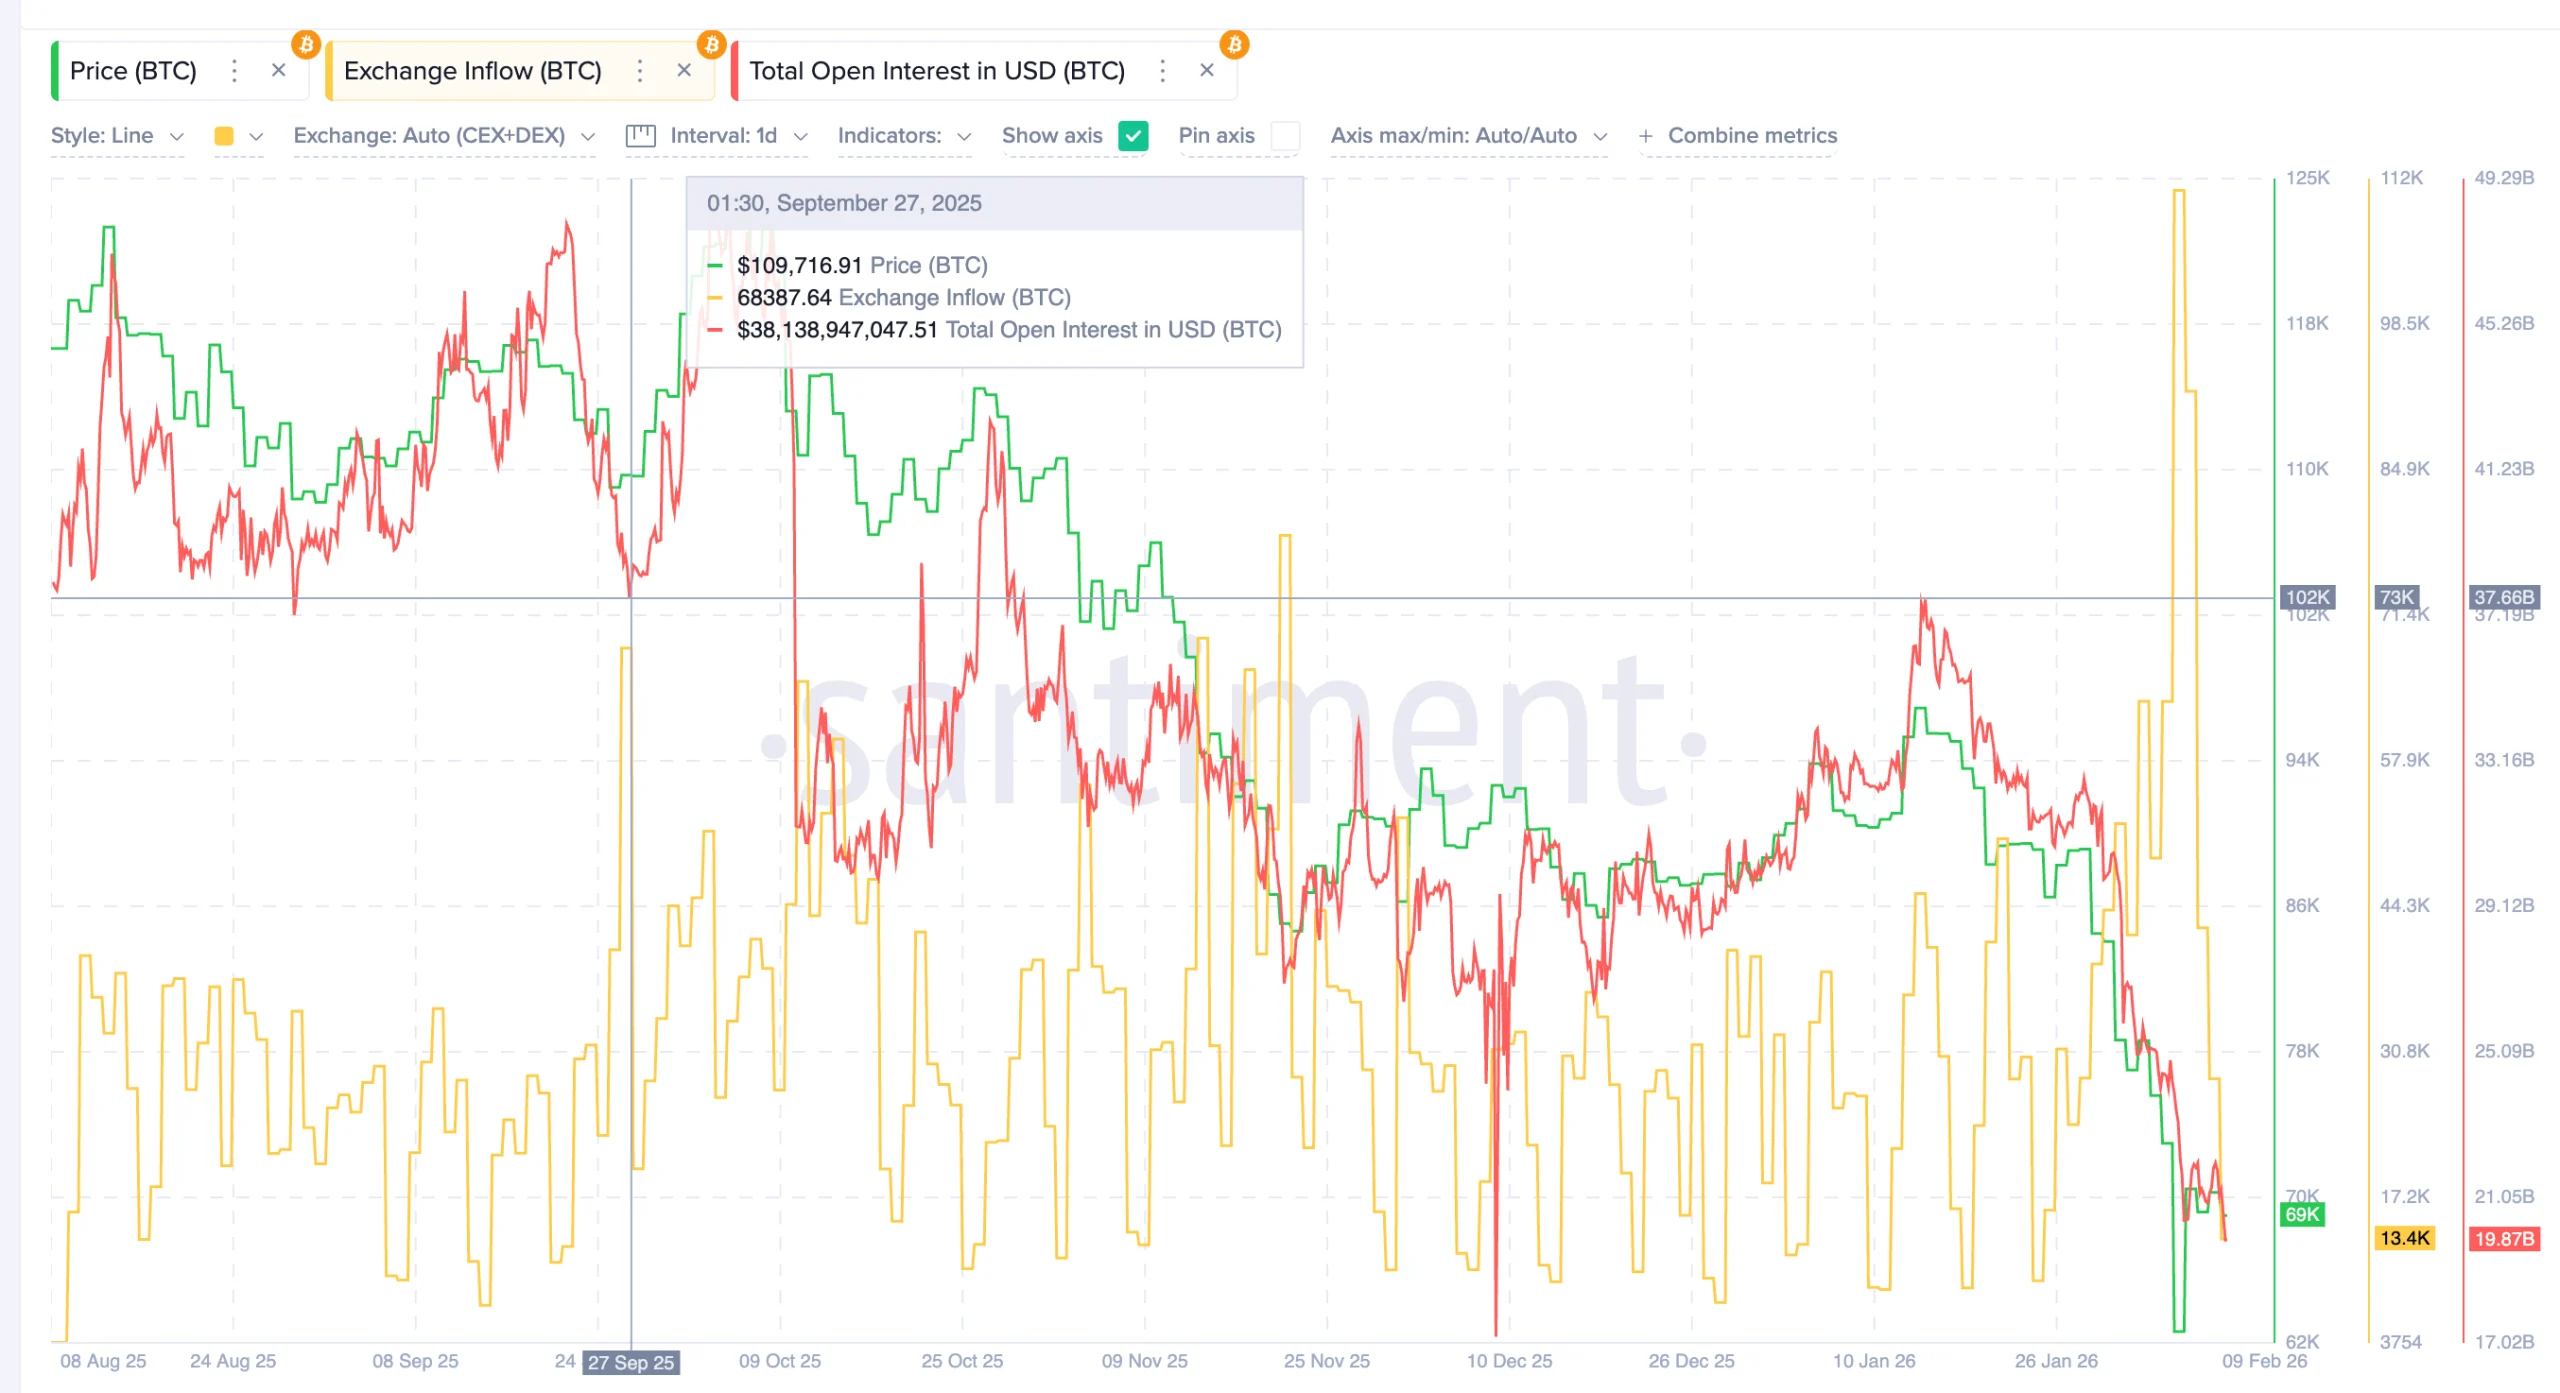
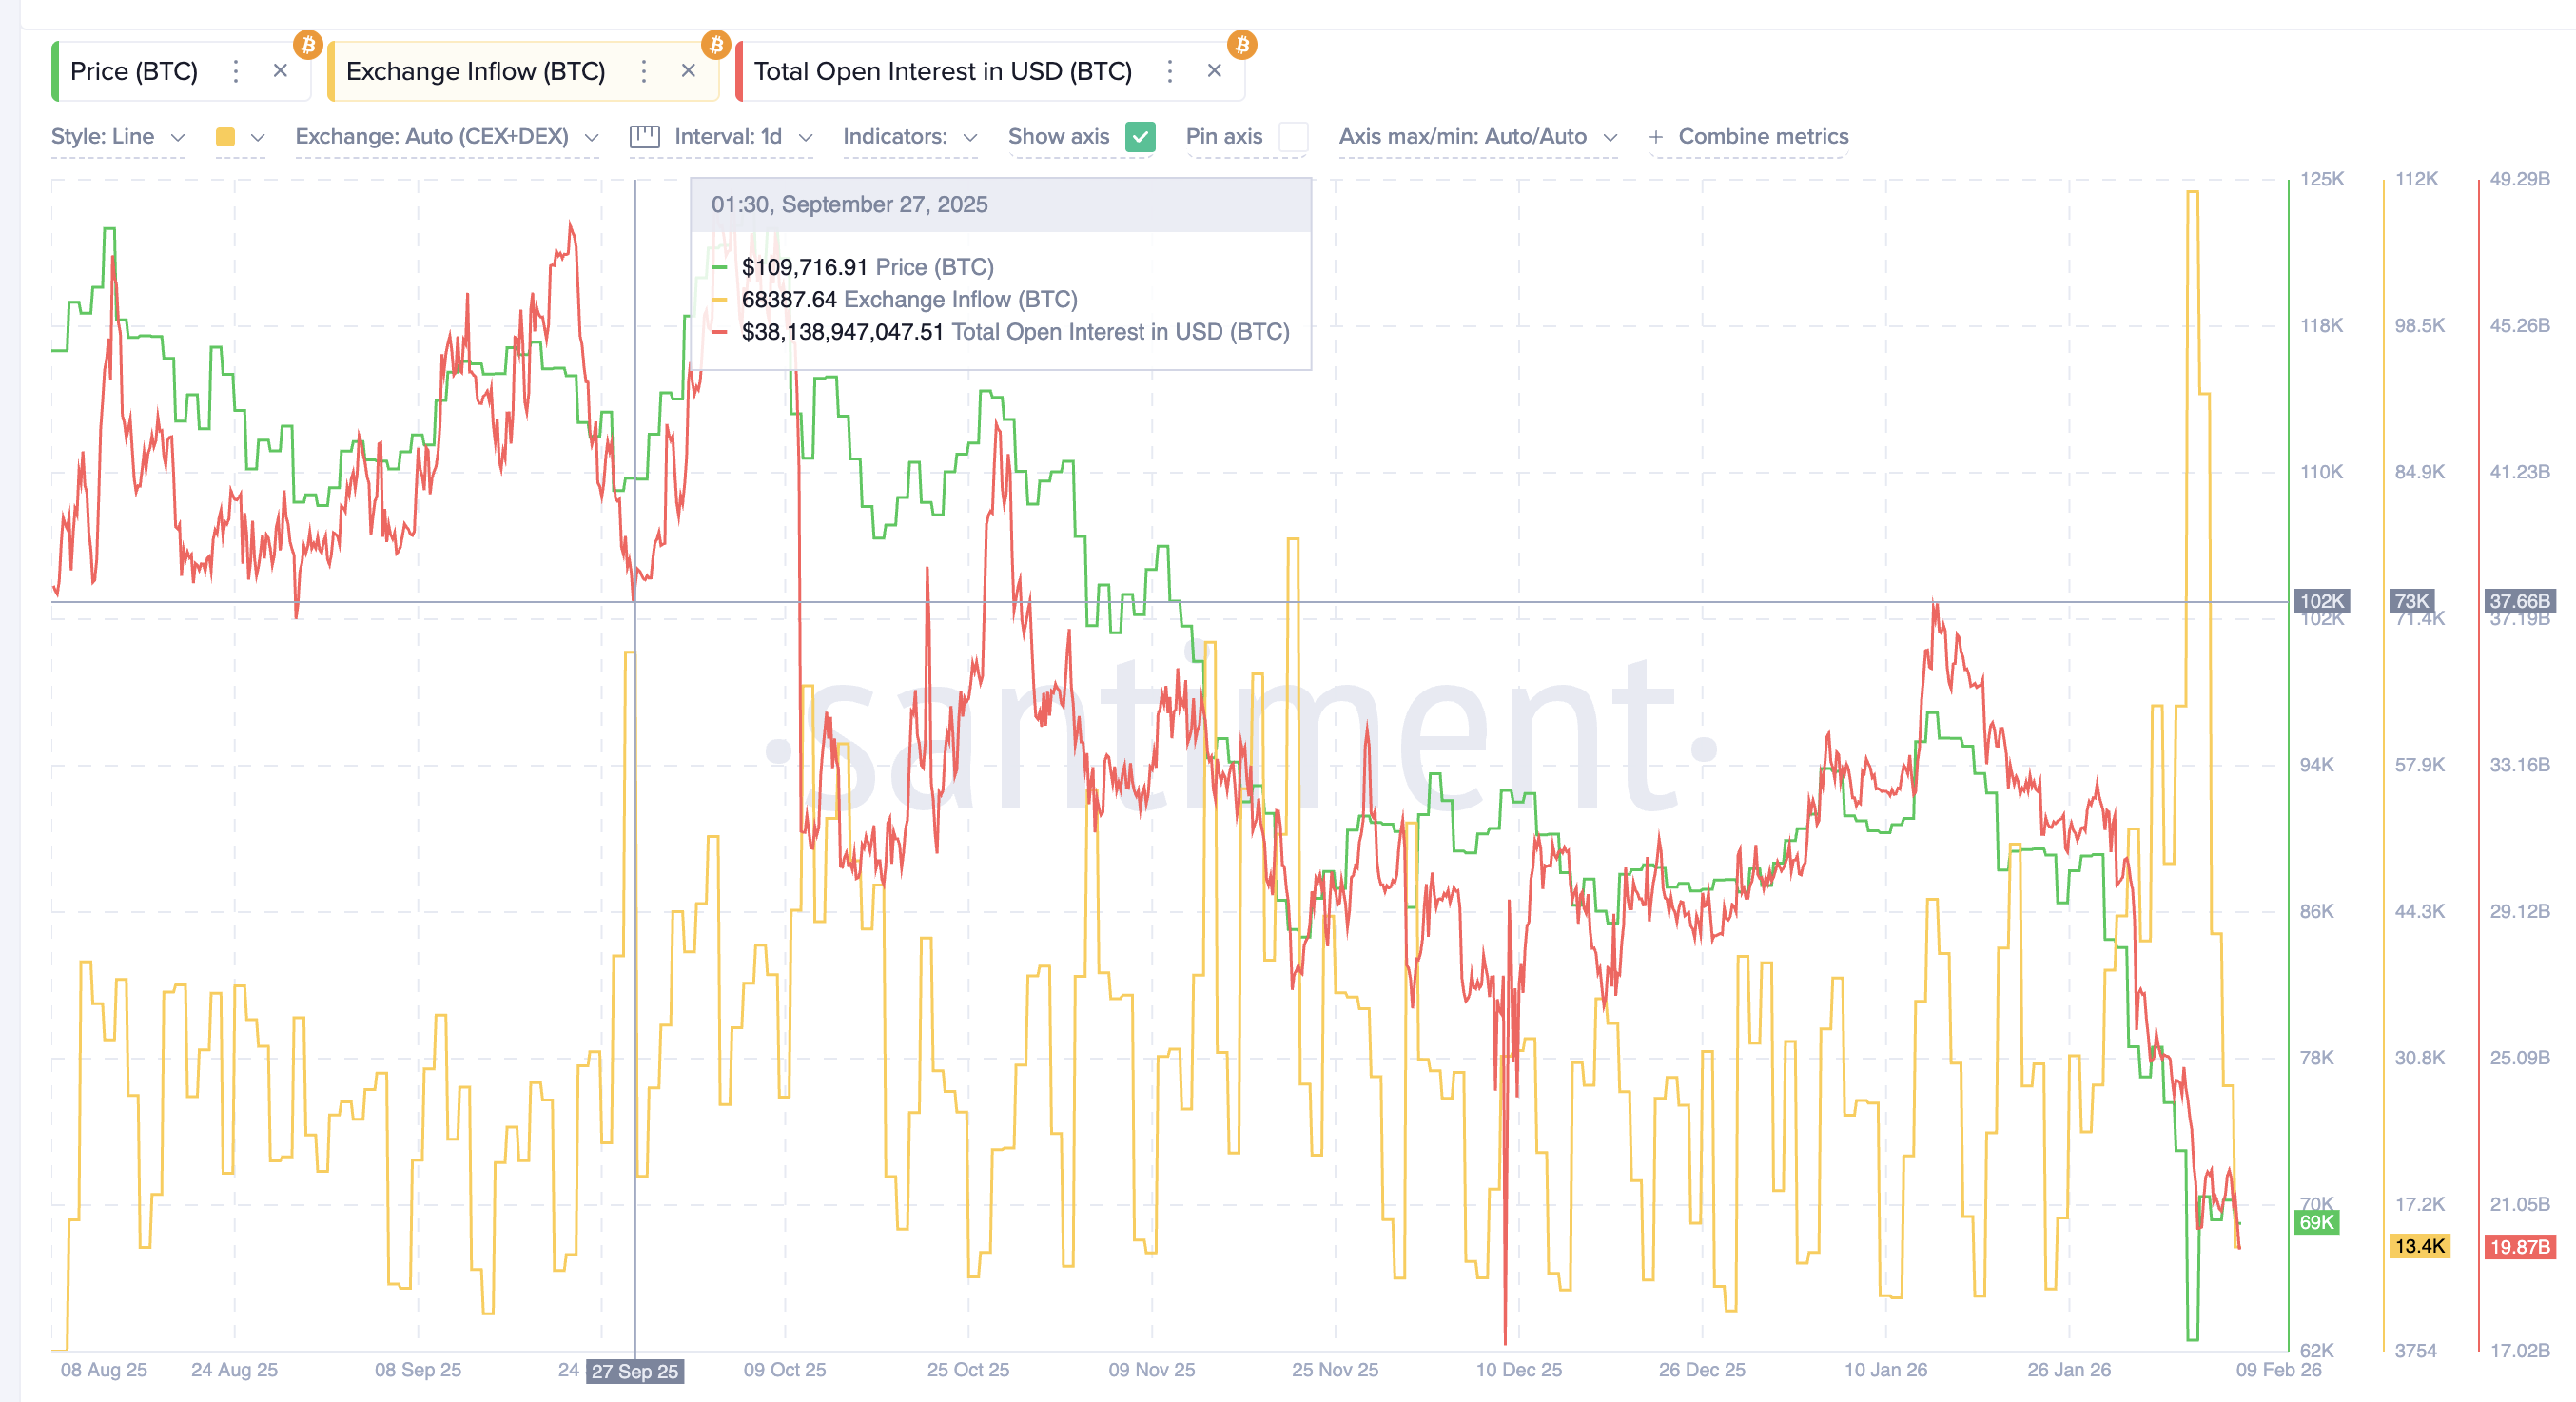
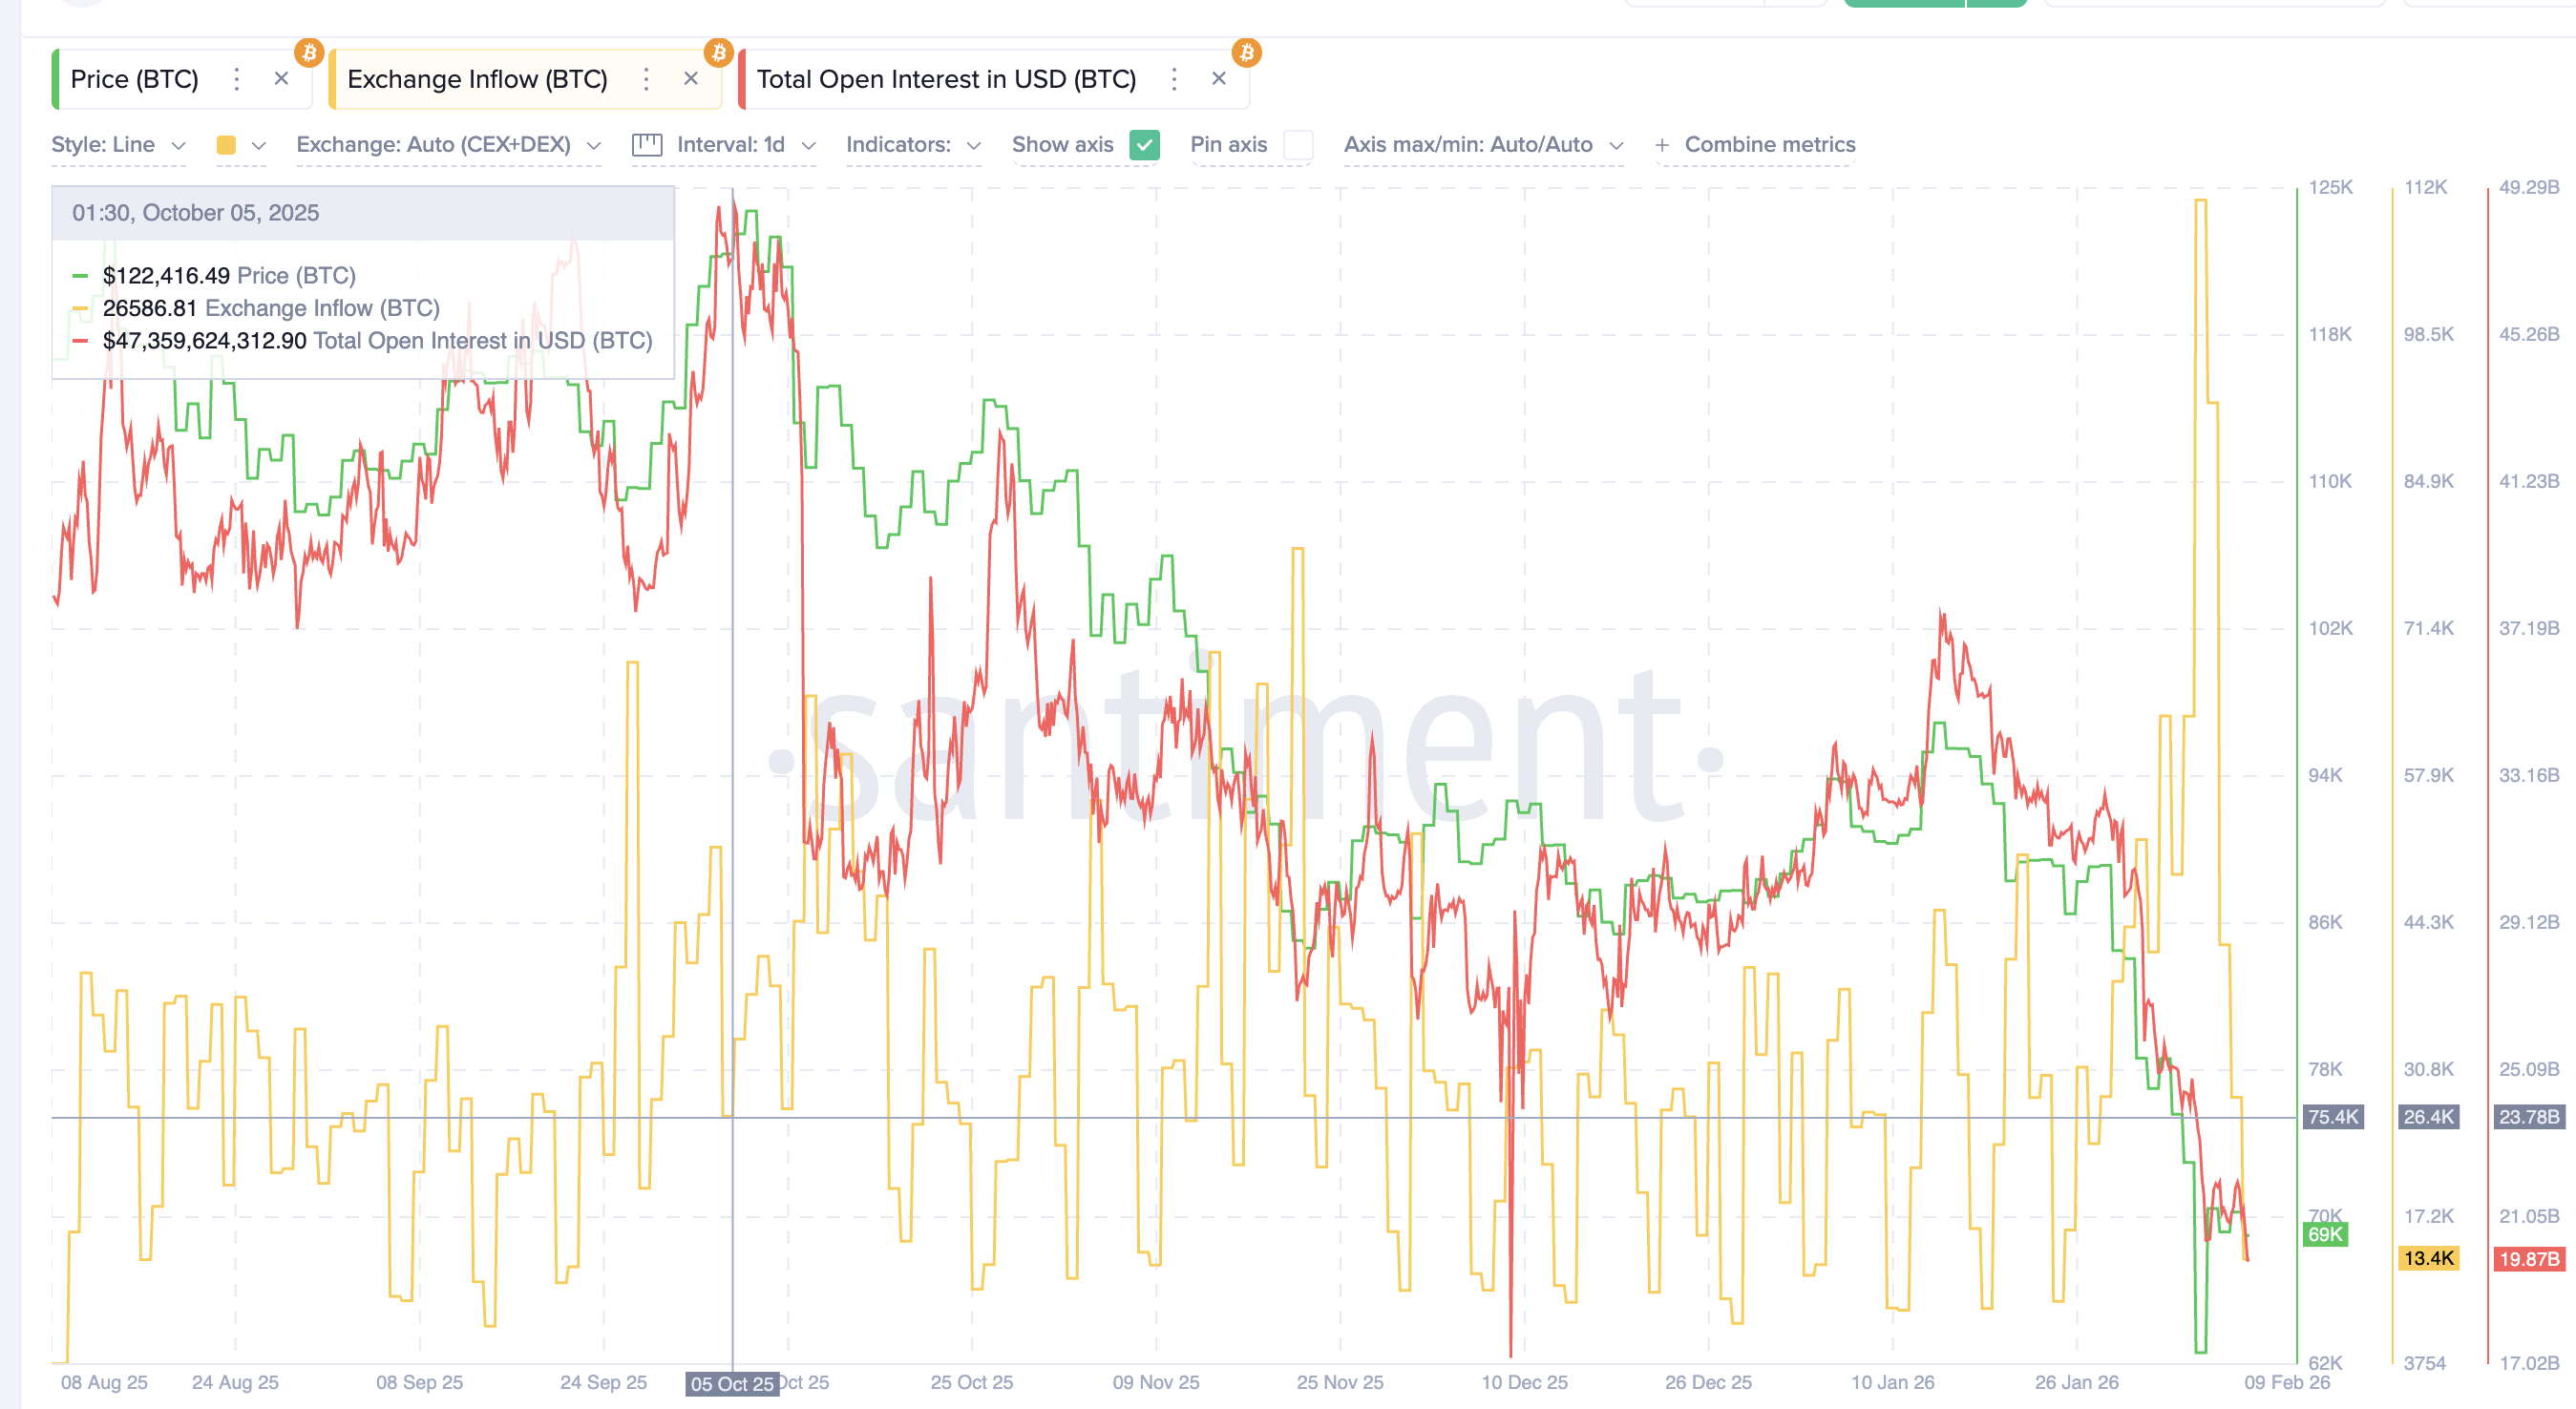
Price Extension and Leverage Expansion (Sep 27 → Oct 5)
Between September 27 and October 5, Bitcoin rallied from around $109,000 to above $122,000, eventually testing the $126,000 area. This rapid move strengthened bullish sentiment and encouraged aggressive long positioning.
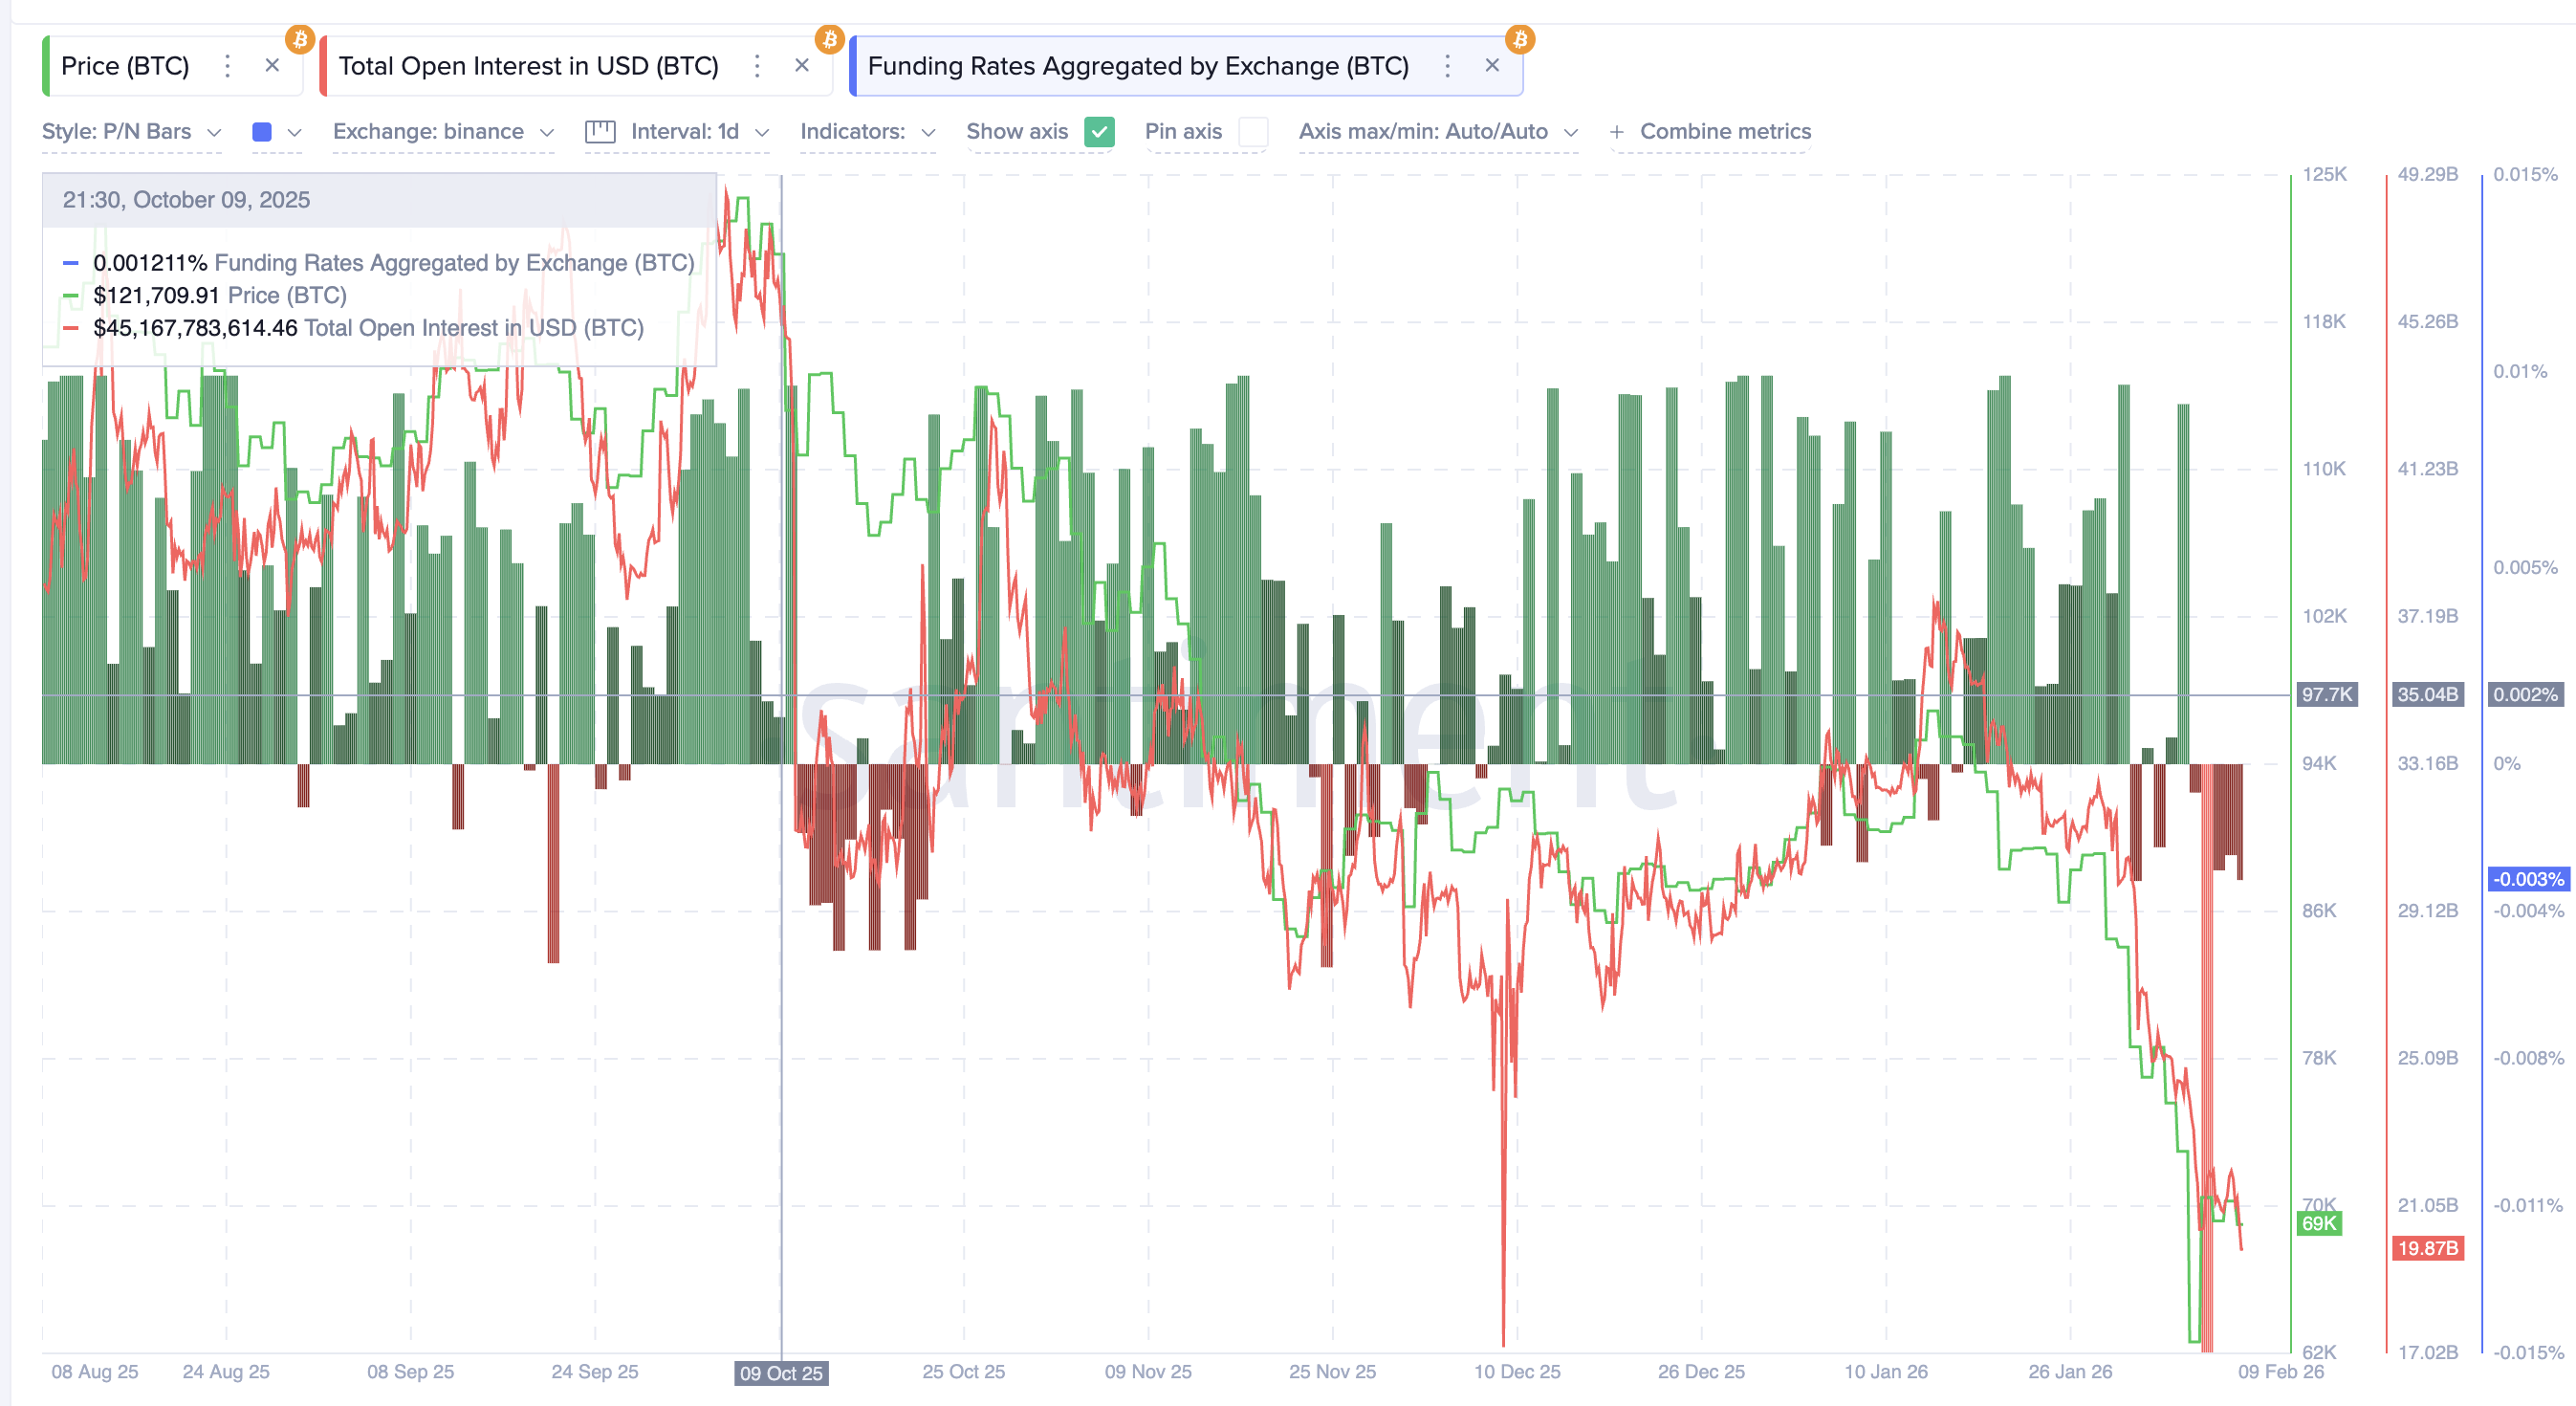
During the same period, open interest rose from roughly $38 billion to more than $47 billion. Leverage was expanding fast, indicating growing dependence on derivatives.
Want more token insights like this? Sign up for Editor Harsh Notariya’s Daily Crypto Newsletter here.
Gracy Chen, the CEO of Bitget, said modern market structure makes leverage far more synchronized than in earlier cycles.
Sponsored
Sponsored
“Positions are built and unwound faster, across more venues… leverage behaves more synchronously… When stress hits, the unwind is sharper, more correlated, and less forgiving,” she added.
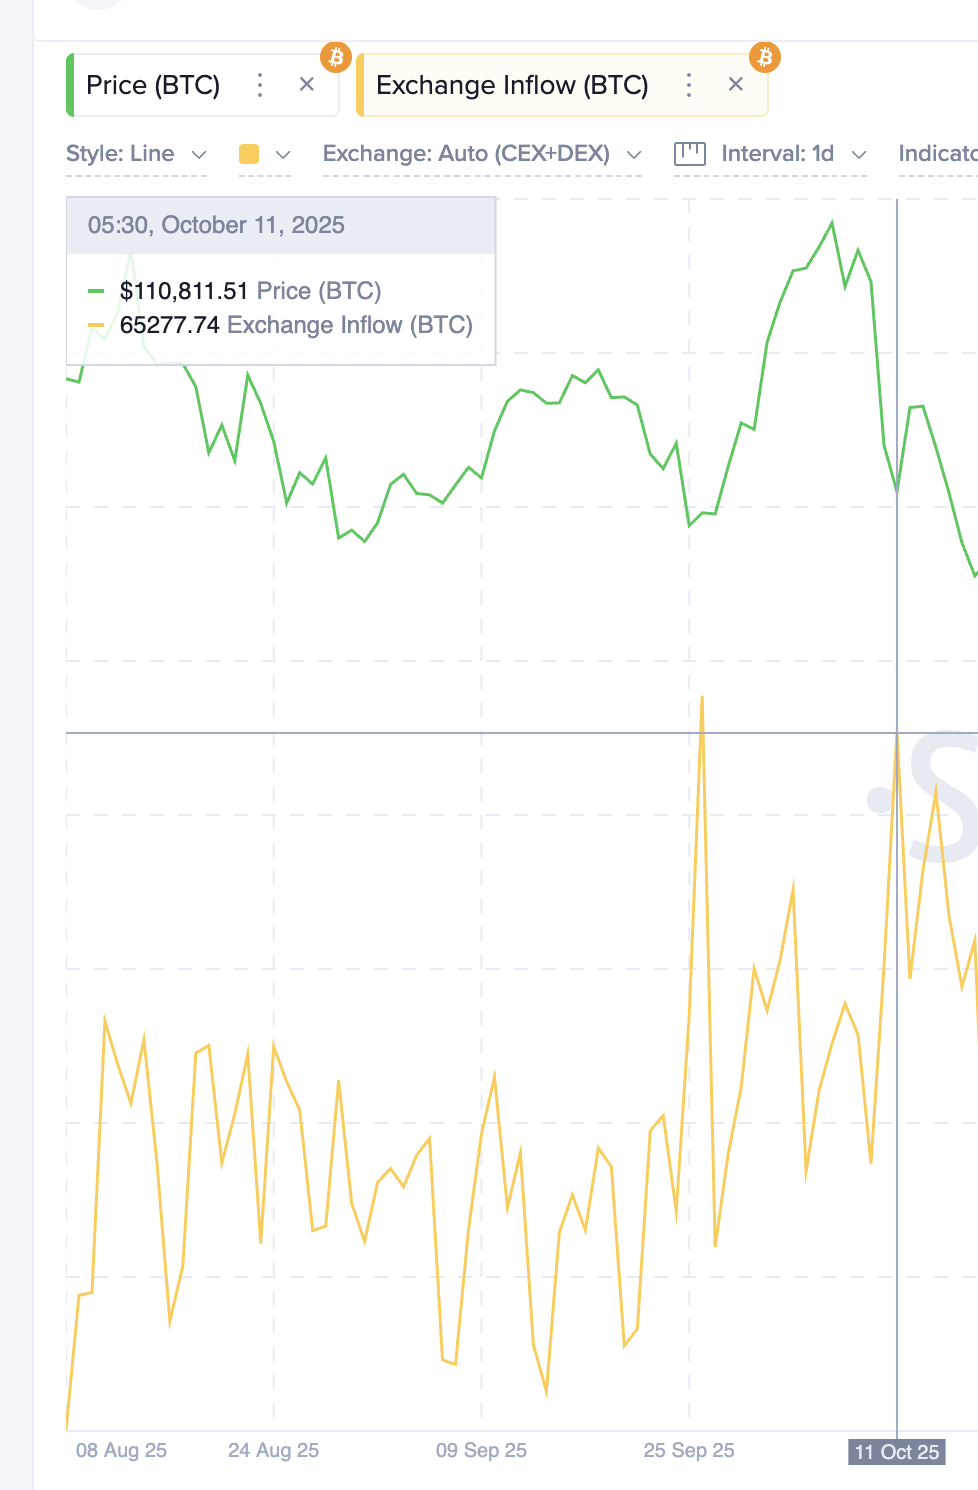
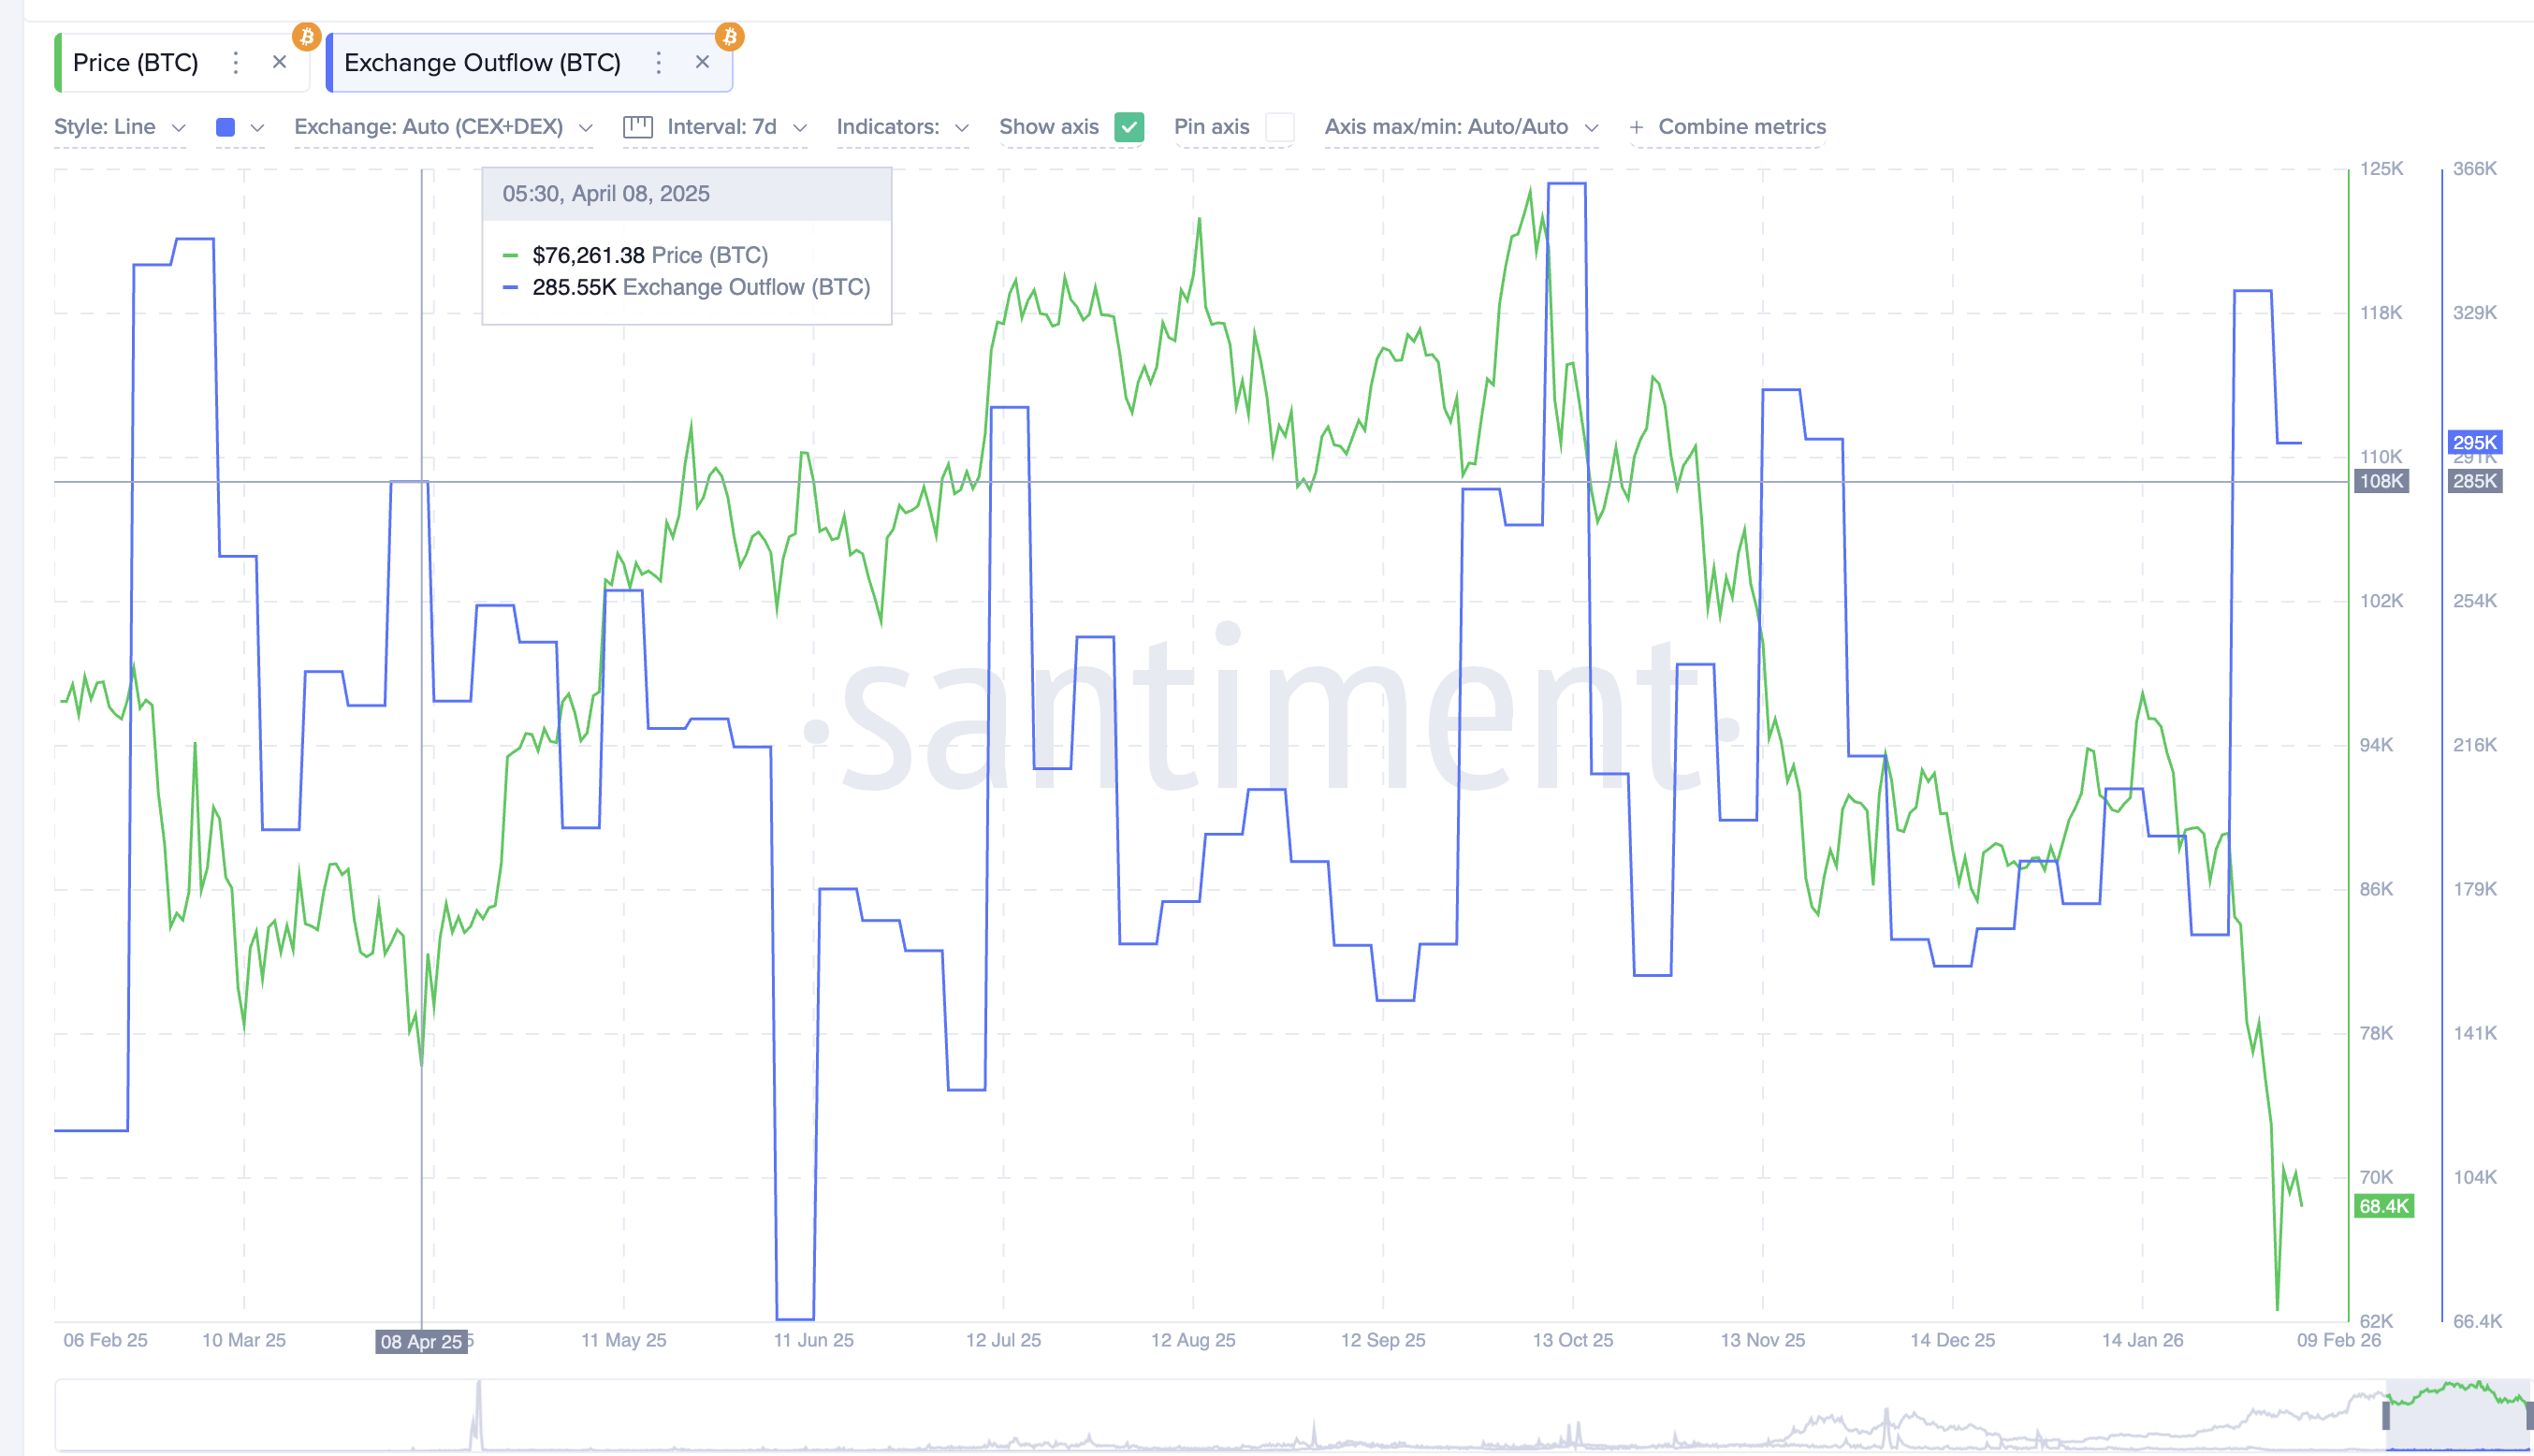
At the same time, exchange inflows fell from around 68,000 BTC to near 26,000 BTC. Holders were not selling into strength. Instead, supply stayed off exchanges while leveraged exposure increased.
This combination reflected a late-stage rally structure.
At this stage of the cycle, rising leverage or open interest, for that matter, not only increases trader risk. It also raises balance-sheet and liquidity pressure on exchanges, which must ensure they can process liquidations, withdrawals, and margin calls smoothly during sudden volatility.
When asked how platforms prepare for such periods, Chen, said risk management starts long before volatility erupts:
“Holding a strong BTC reserve is a risk management decision before it’s a market view… prioritize balance-sheet resilience… avoid being forced into reactive moves when volatility spikes…,” she said
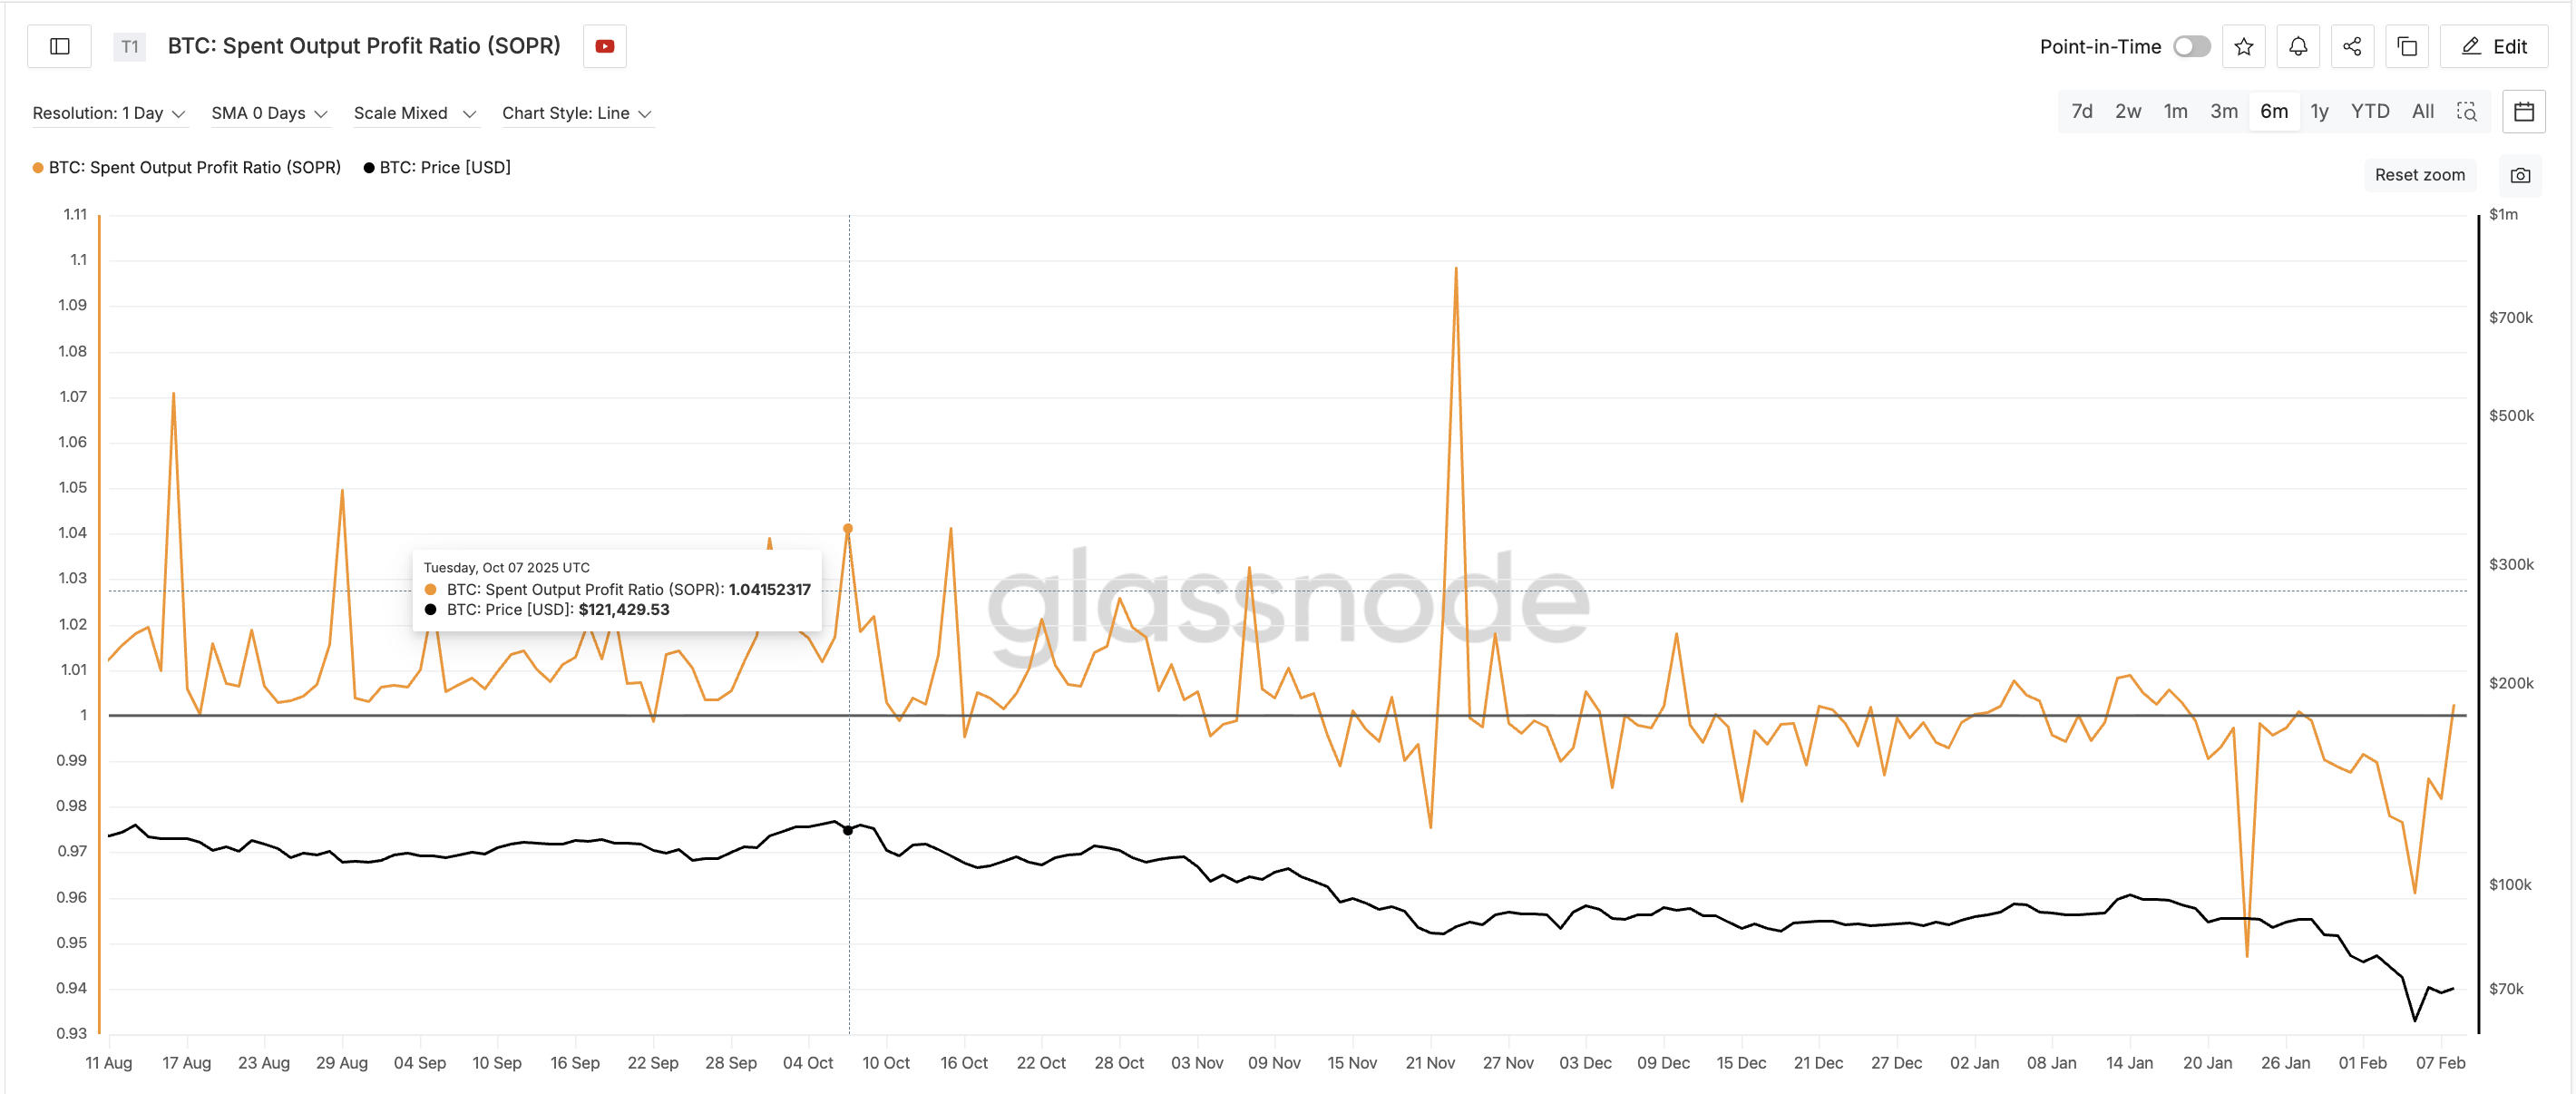
Profit-Taking Beneath the Surface (Late Sep → Early Oct)
On-chain profit data showed that distribution had already begun.
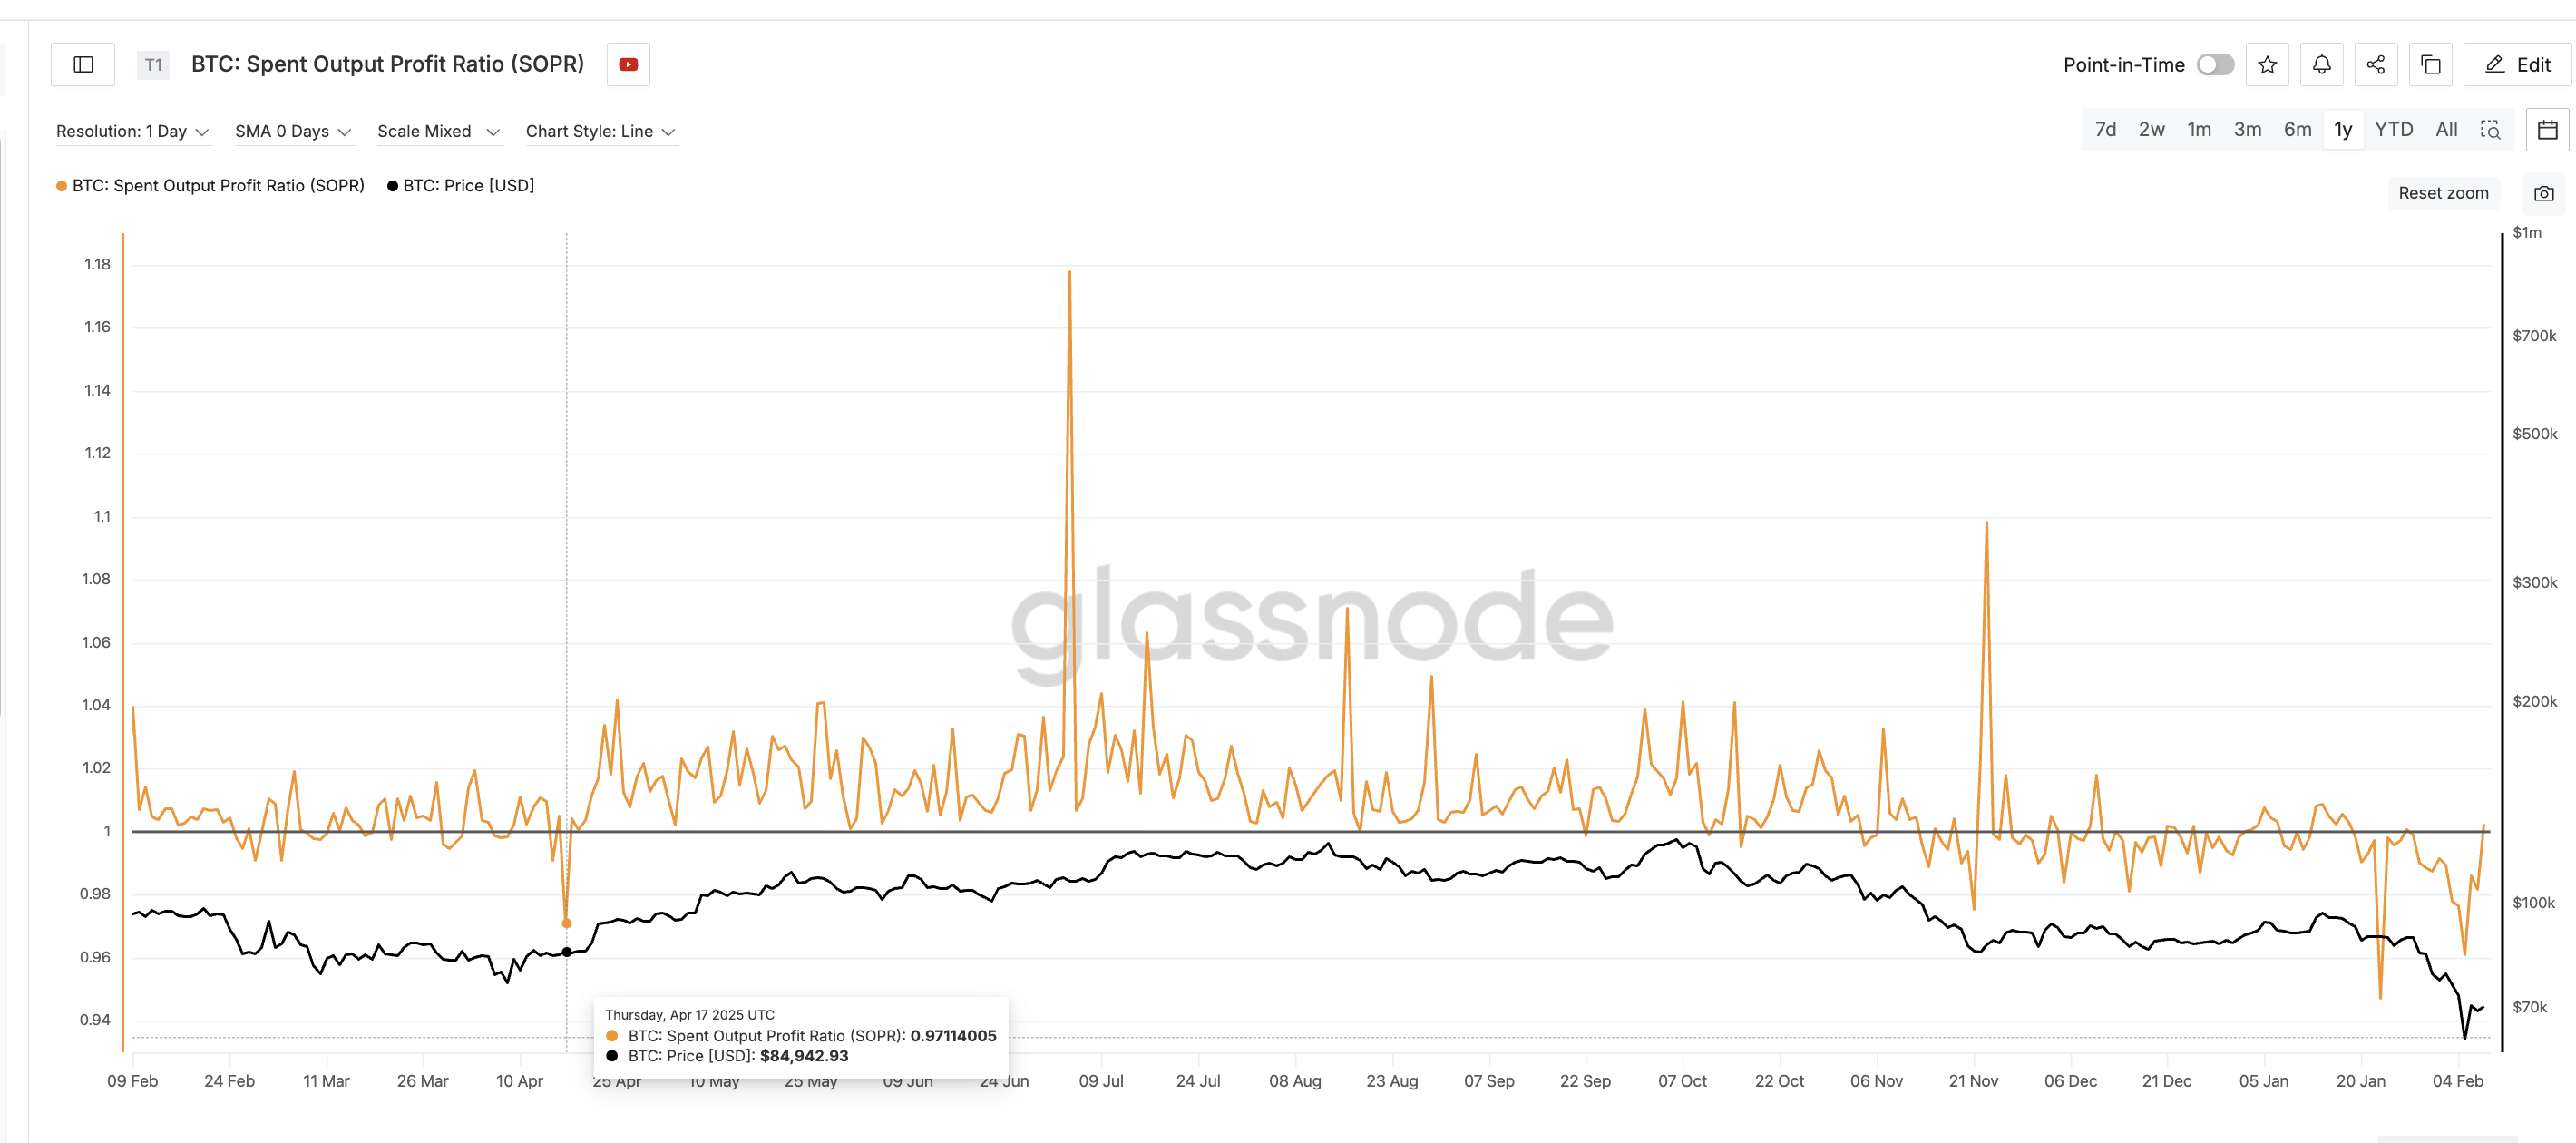
From late September into early October, Spent Output Profit Ratio (SOPR), which tracks whether coins are sold at profit or loss, went up from around 1.00 to roughly 1.04, with repeated spikes. This indicated that more coins were being sold at a profit.
Importantly, this happened while exchange inflows remained low. Early buyers (possibly already exchange-held supply) were quietly locking in gains without triggering visible selling pressure. And BTC was already at an all-time high during that time.
This pattern suggests a gradual transfer from early participants to late entrants, often seen near local tops.
Short-Term Holders Flip From Capitulation to Optimism (September 27 → Oct 6)
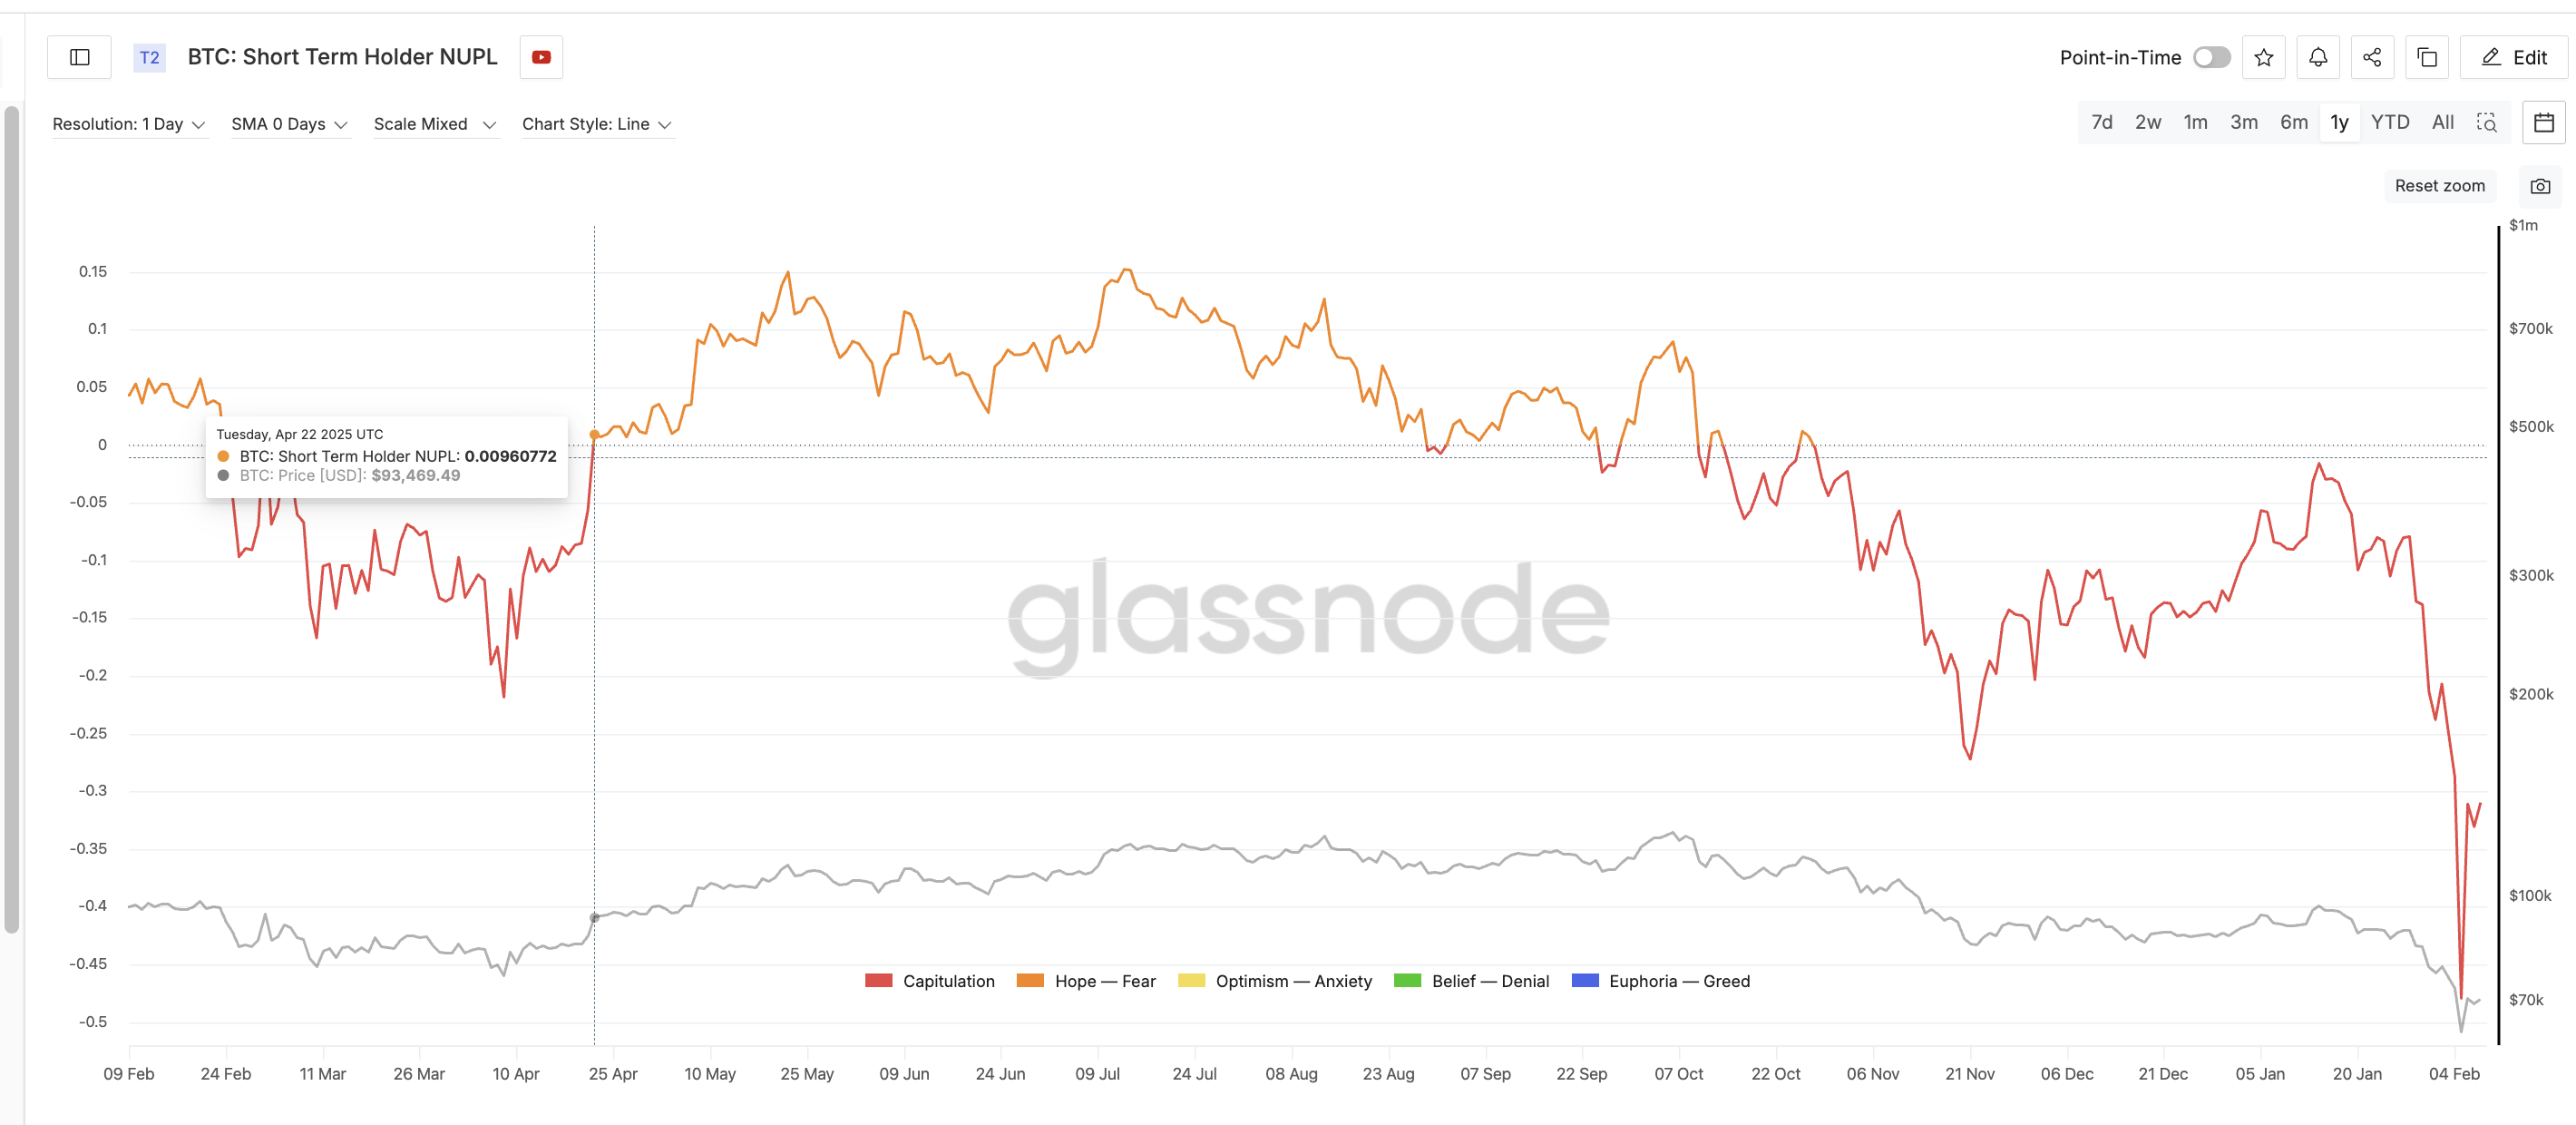
Short-term holder NUPL (Net Unrealized Profit/Loss), measuring paper profits or losses. provided one of the clearest warning signals. On September 27, STH-NUPL stood near -0.17, reflecting recent capitulation. By October 6, it had surged to around +0.09.
In less than ten days, recent buyers moved from heavy losses to clear profits.
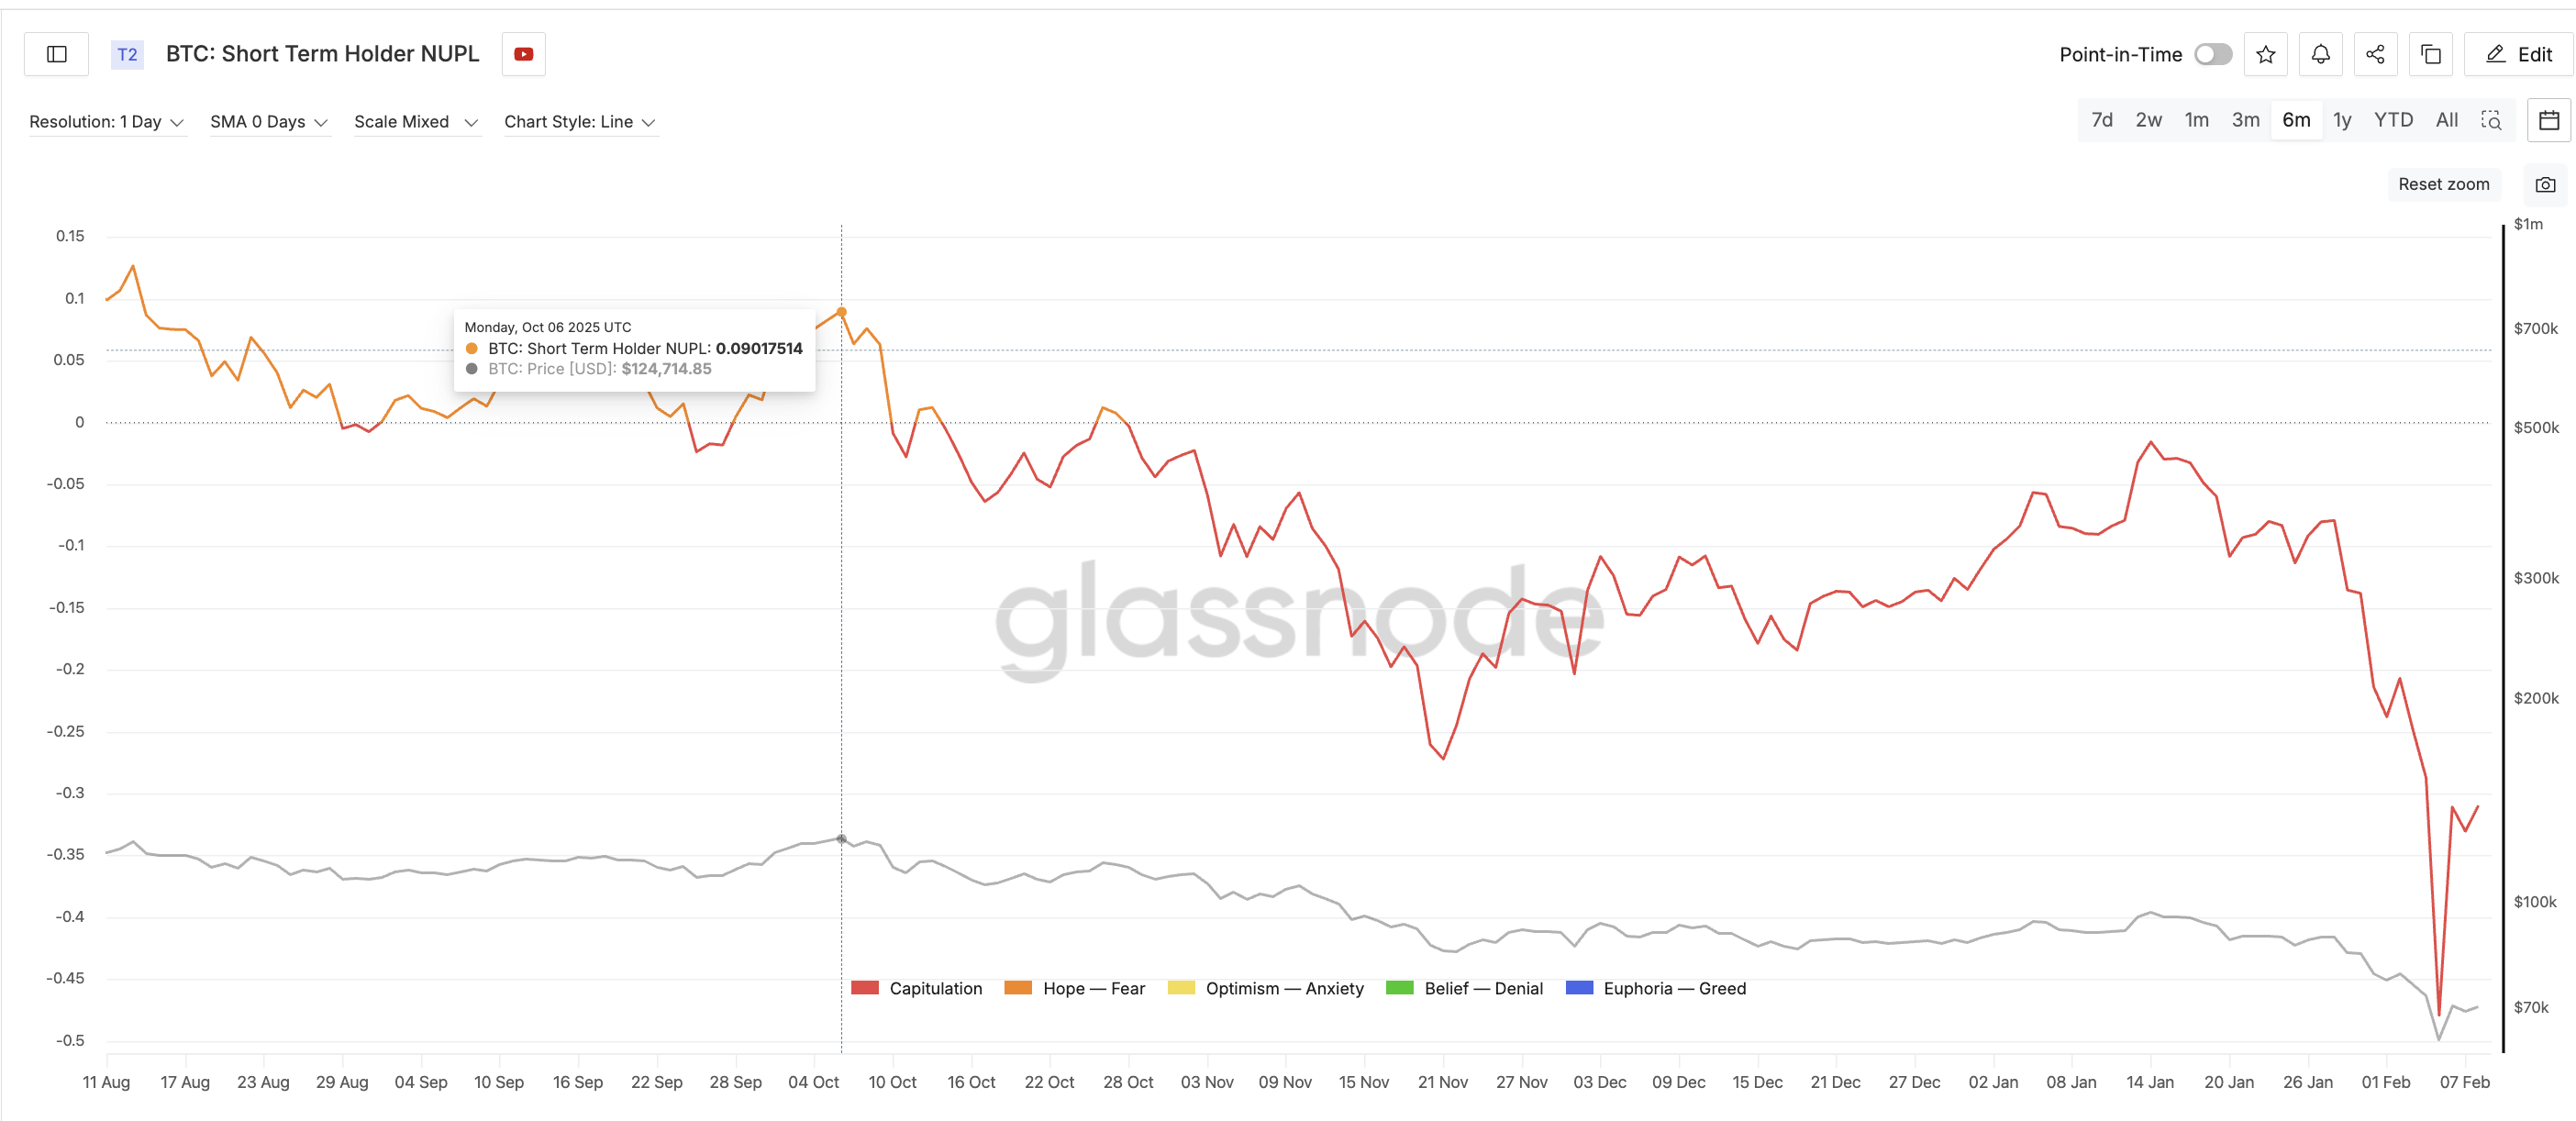
Such rapid transitions are dangerous. After emerging from losses, traders often become highly sensitive to pullbacks and eager to protect small gains, increasing the risk of sudden selling.
As sentiment improved, leverage continued rising. Open interest reached one of its highest levels on record while SOPR and NUPL began rolling over. BTC exchange inflows remained subdued, keeping risk concentrated in derivatives markets.
Instead of reducing exposure, traders increased it. This imbalance made the market structurally weak.
Momentum Weakens Ahead of the Breakdown (July → October)
Technical momentum had been deteriorating for months. From mid-July to early October, Bitcoin formed a clear bearish RSI divergence. Price made higher highs, while the Relative Strength Index, a momentum indicator, made lower highs.
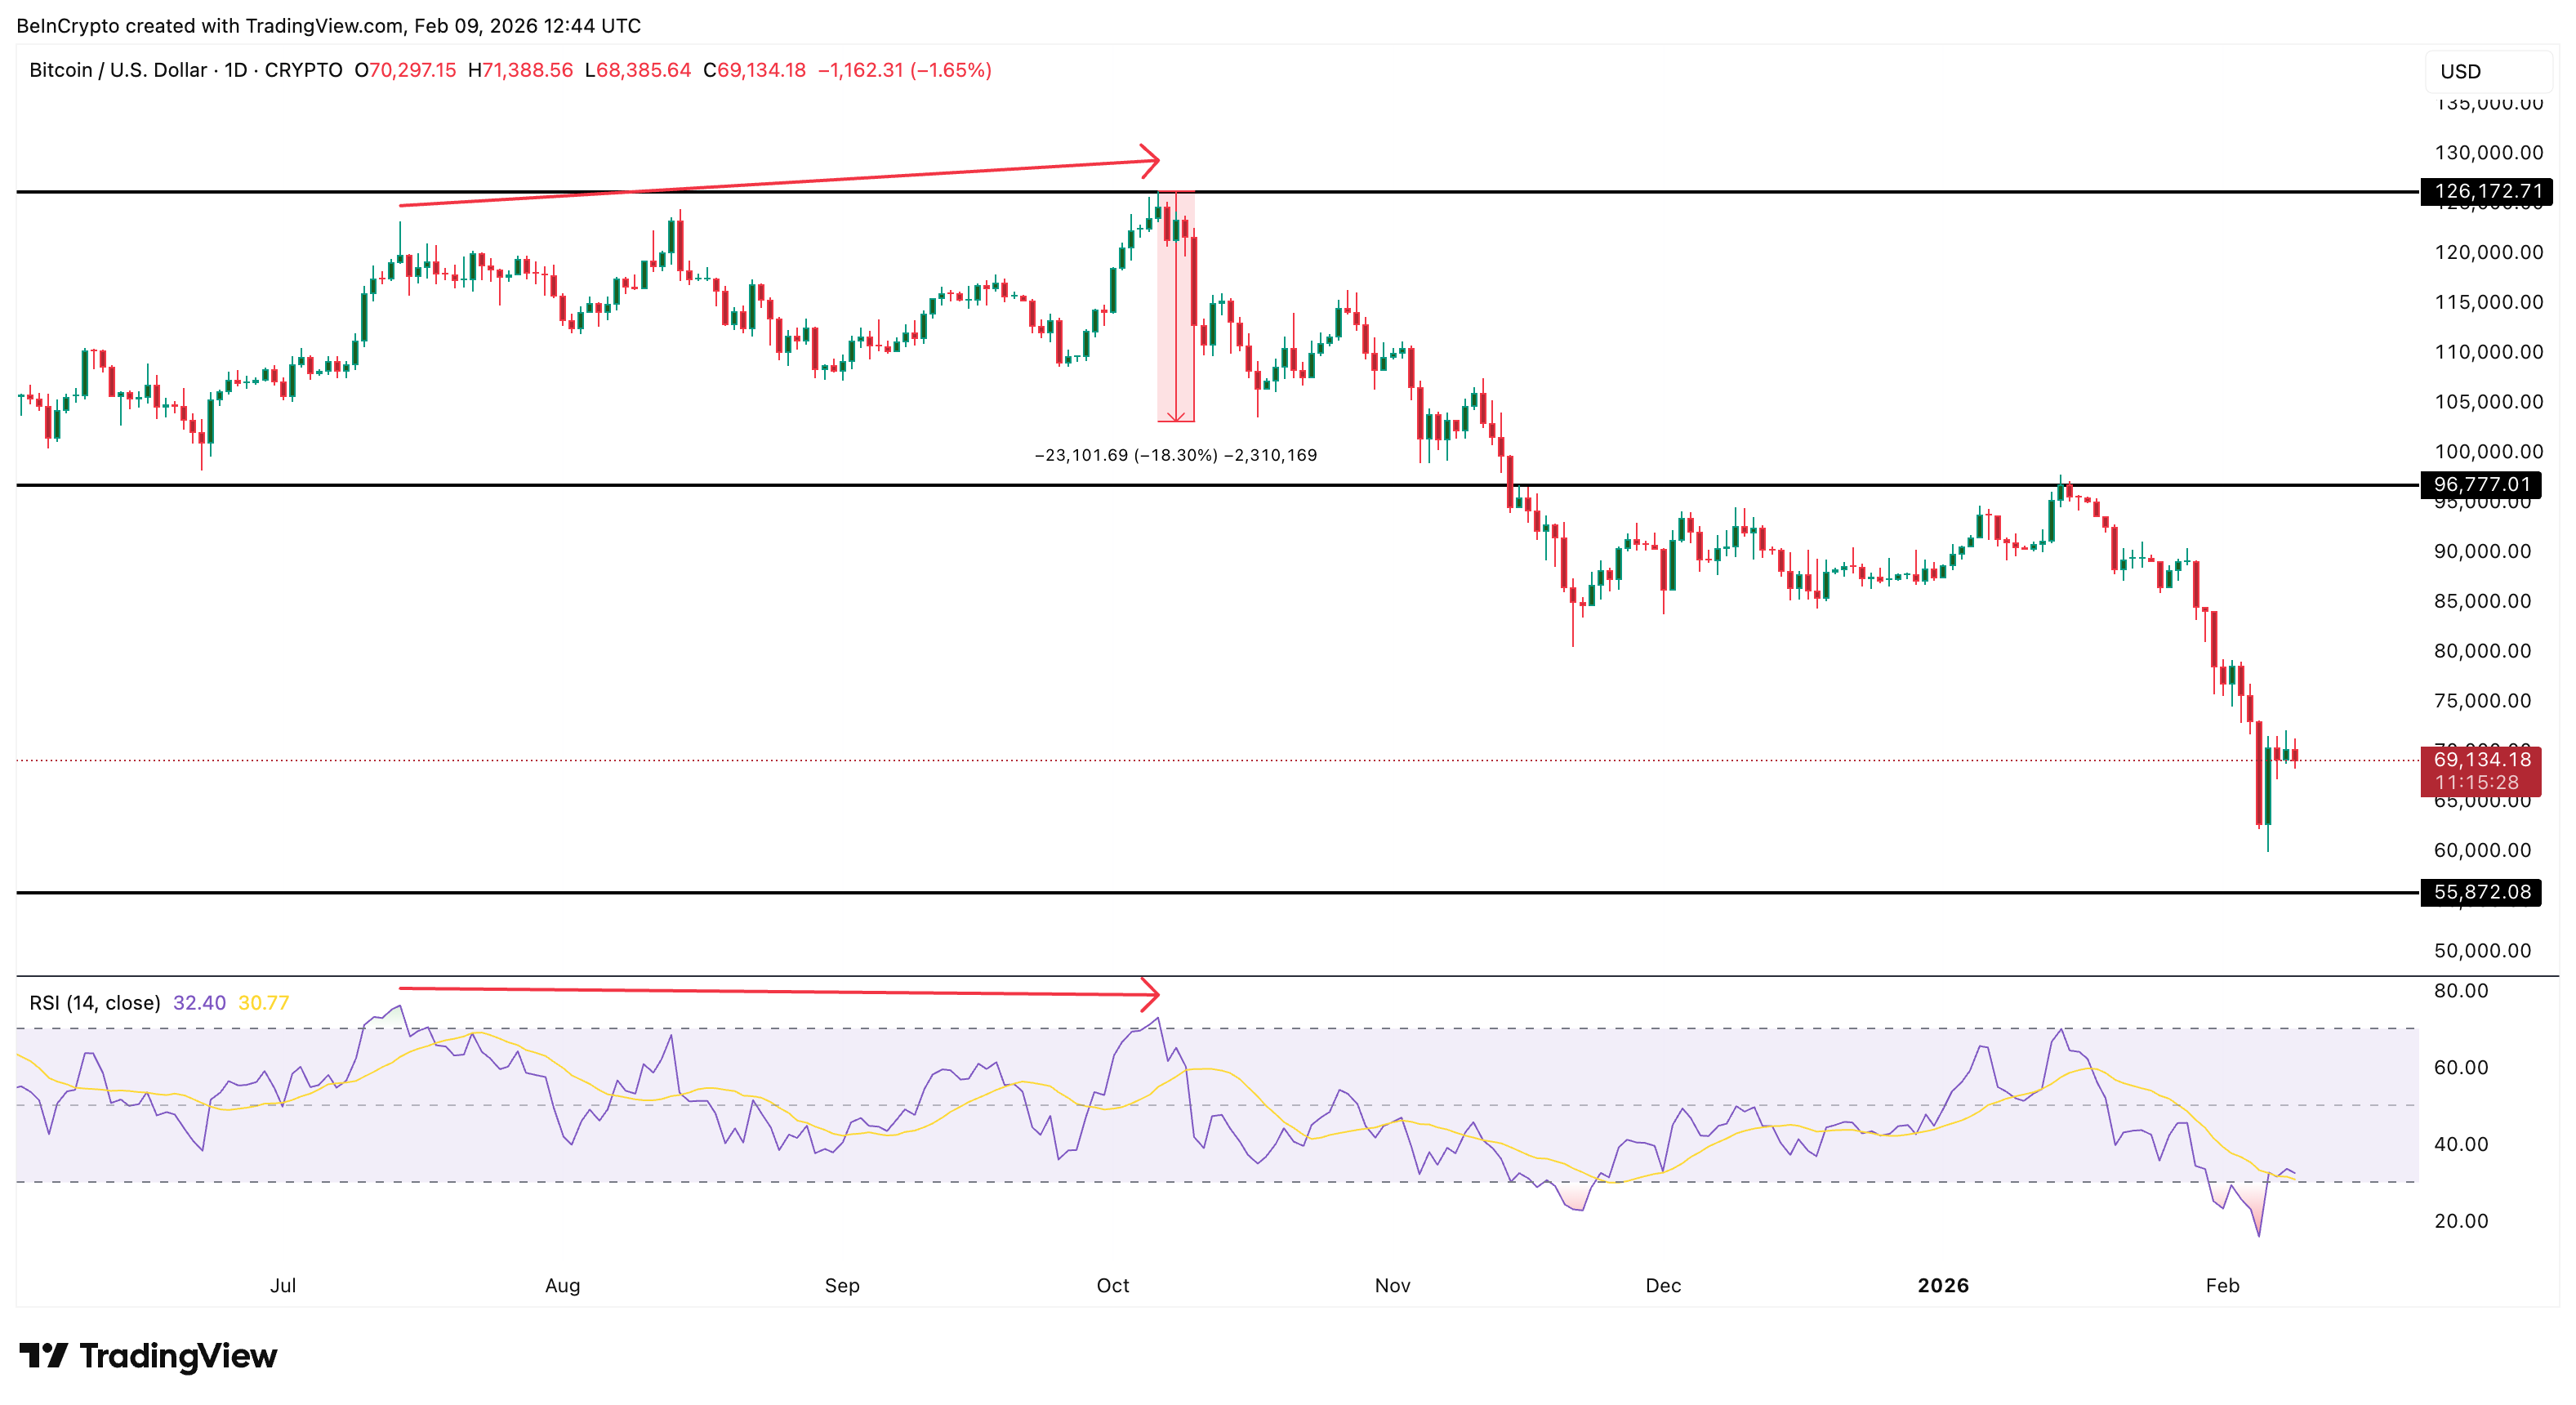
This signaled weakening demand beneath the surface. By early October, the rally was increasingly sustained by leverage rather than organic buying, and the momentum indicator proved it.
Defense Phase and Structural Breakdown (Oct 6 → Oct 9)
After October 6, price momentum faded, and support levels were tested. Despite this, open interest remained elevated, and funding rates, which reflect the cost of holding future positions, stayed positive. Traders were defending positions rather than exiting, possibly by adding margin.
Sponsored
Sponsored
Chen also mentioned that attempts to defend positions often amplify systemic risks:
“When positions approach liquidation, traders often add margin… Individually, that can make sense. Systemically, it increases fragility… Once those levels fail, the unwind is no longer gradual — it becomes a cascade,” she highlighted as the root cause for massive cascades.
More margin eventually led to a deeper crash.
October 10 — Trigger and Cascade
When tariff-related headlines emerged on October 10, the weak structure collapsed.
Price broke lower, leveraged positions moved into loss, and margin calls accelerated. Open interest fell sharply, and exchange inflows surged.
Forced short selling created a feedback loop, producing the largest liquidation cascade in crypto history.
Stephan Lutz, CEO of BitMEX, said liquidation cycles tend to appear repeatedly during periods of excessive risk-taking, in an exclusive quote to BeInCrypto:
“Normally, liquidations always come with cycles amid greedy times… they are good for market health…,” he mentioned.
Chen cautioned that liquidation data should not be mistaken for the root cause of crashes.
“Liquidations are… an accelerant, not the ignition… They tell you where risk was mispriced… how thin liquidity really was underneath, she said.”
Could This Long Liquidation Cascade Have Been Anticipated?
By early October, several long squeeze warning signs were already visible:
- Rapid price extension from late September
- Open interest near record levels
- Rising SOPR, indicating profit-taking
- STH-NUPL flipping positive in days
- Low exchange inflows concentrate risk in derivatives
- Long-term RSI divergence
Individually, these signals were not decisive. Together, they showed a market that was overleveraged, emotionally unstable, and structurally weak.
Lutz added that recent cascades have also exposed weaknesses in risk management.
“This cycle’s criticism isn’t much on leverage itself, but risk management and the lack of rigorous approach…”
The October 2025 collapse followed a clear sequence:
Sponsored
Sponsored
Price extension → Open interest expansion → Rising SOPR (selective profit-taking) → Rapid NUPL recovery (short-term optimism) → Long-term RSI divergence (weakening momentum) → Leverage defense through margin → External catalyst → Liquidation cascade
April 23, 2025 — How a Major Short Liquidation Cascade Came With Hints
On April 23, 2025, Bitcoin surged sharply, triggering more than $600 million in short liquidations in a single session. While the rally appeared sudden, on-chain and derivatives data show that a fragile market structure had been forming for weeks after the early-April sell-off.
Early Technical Reversal Without Confirmation (Late Feb → Early April)
Between late February and early April, Bitcoin continued making lower lows. However, on the 12-hour chart, the Relative Strength Index (RSI), a momentum indicator, formed a bullish divergence, with higher lows even as the price declined. This signaled that selling pressure was weakening.
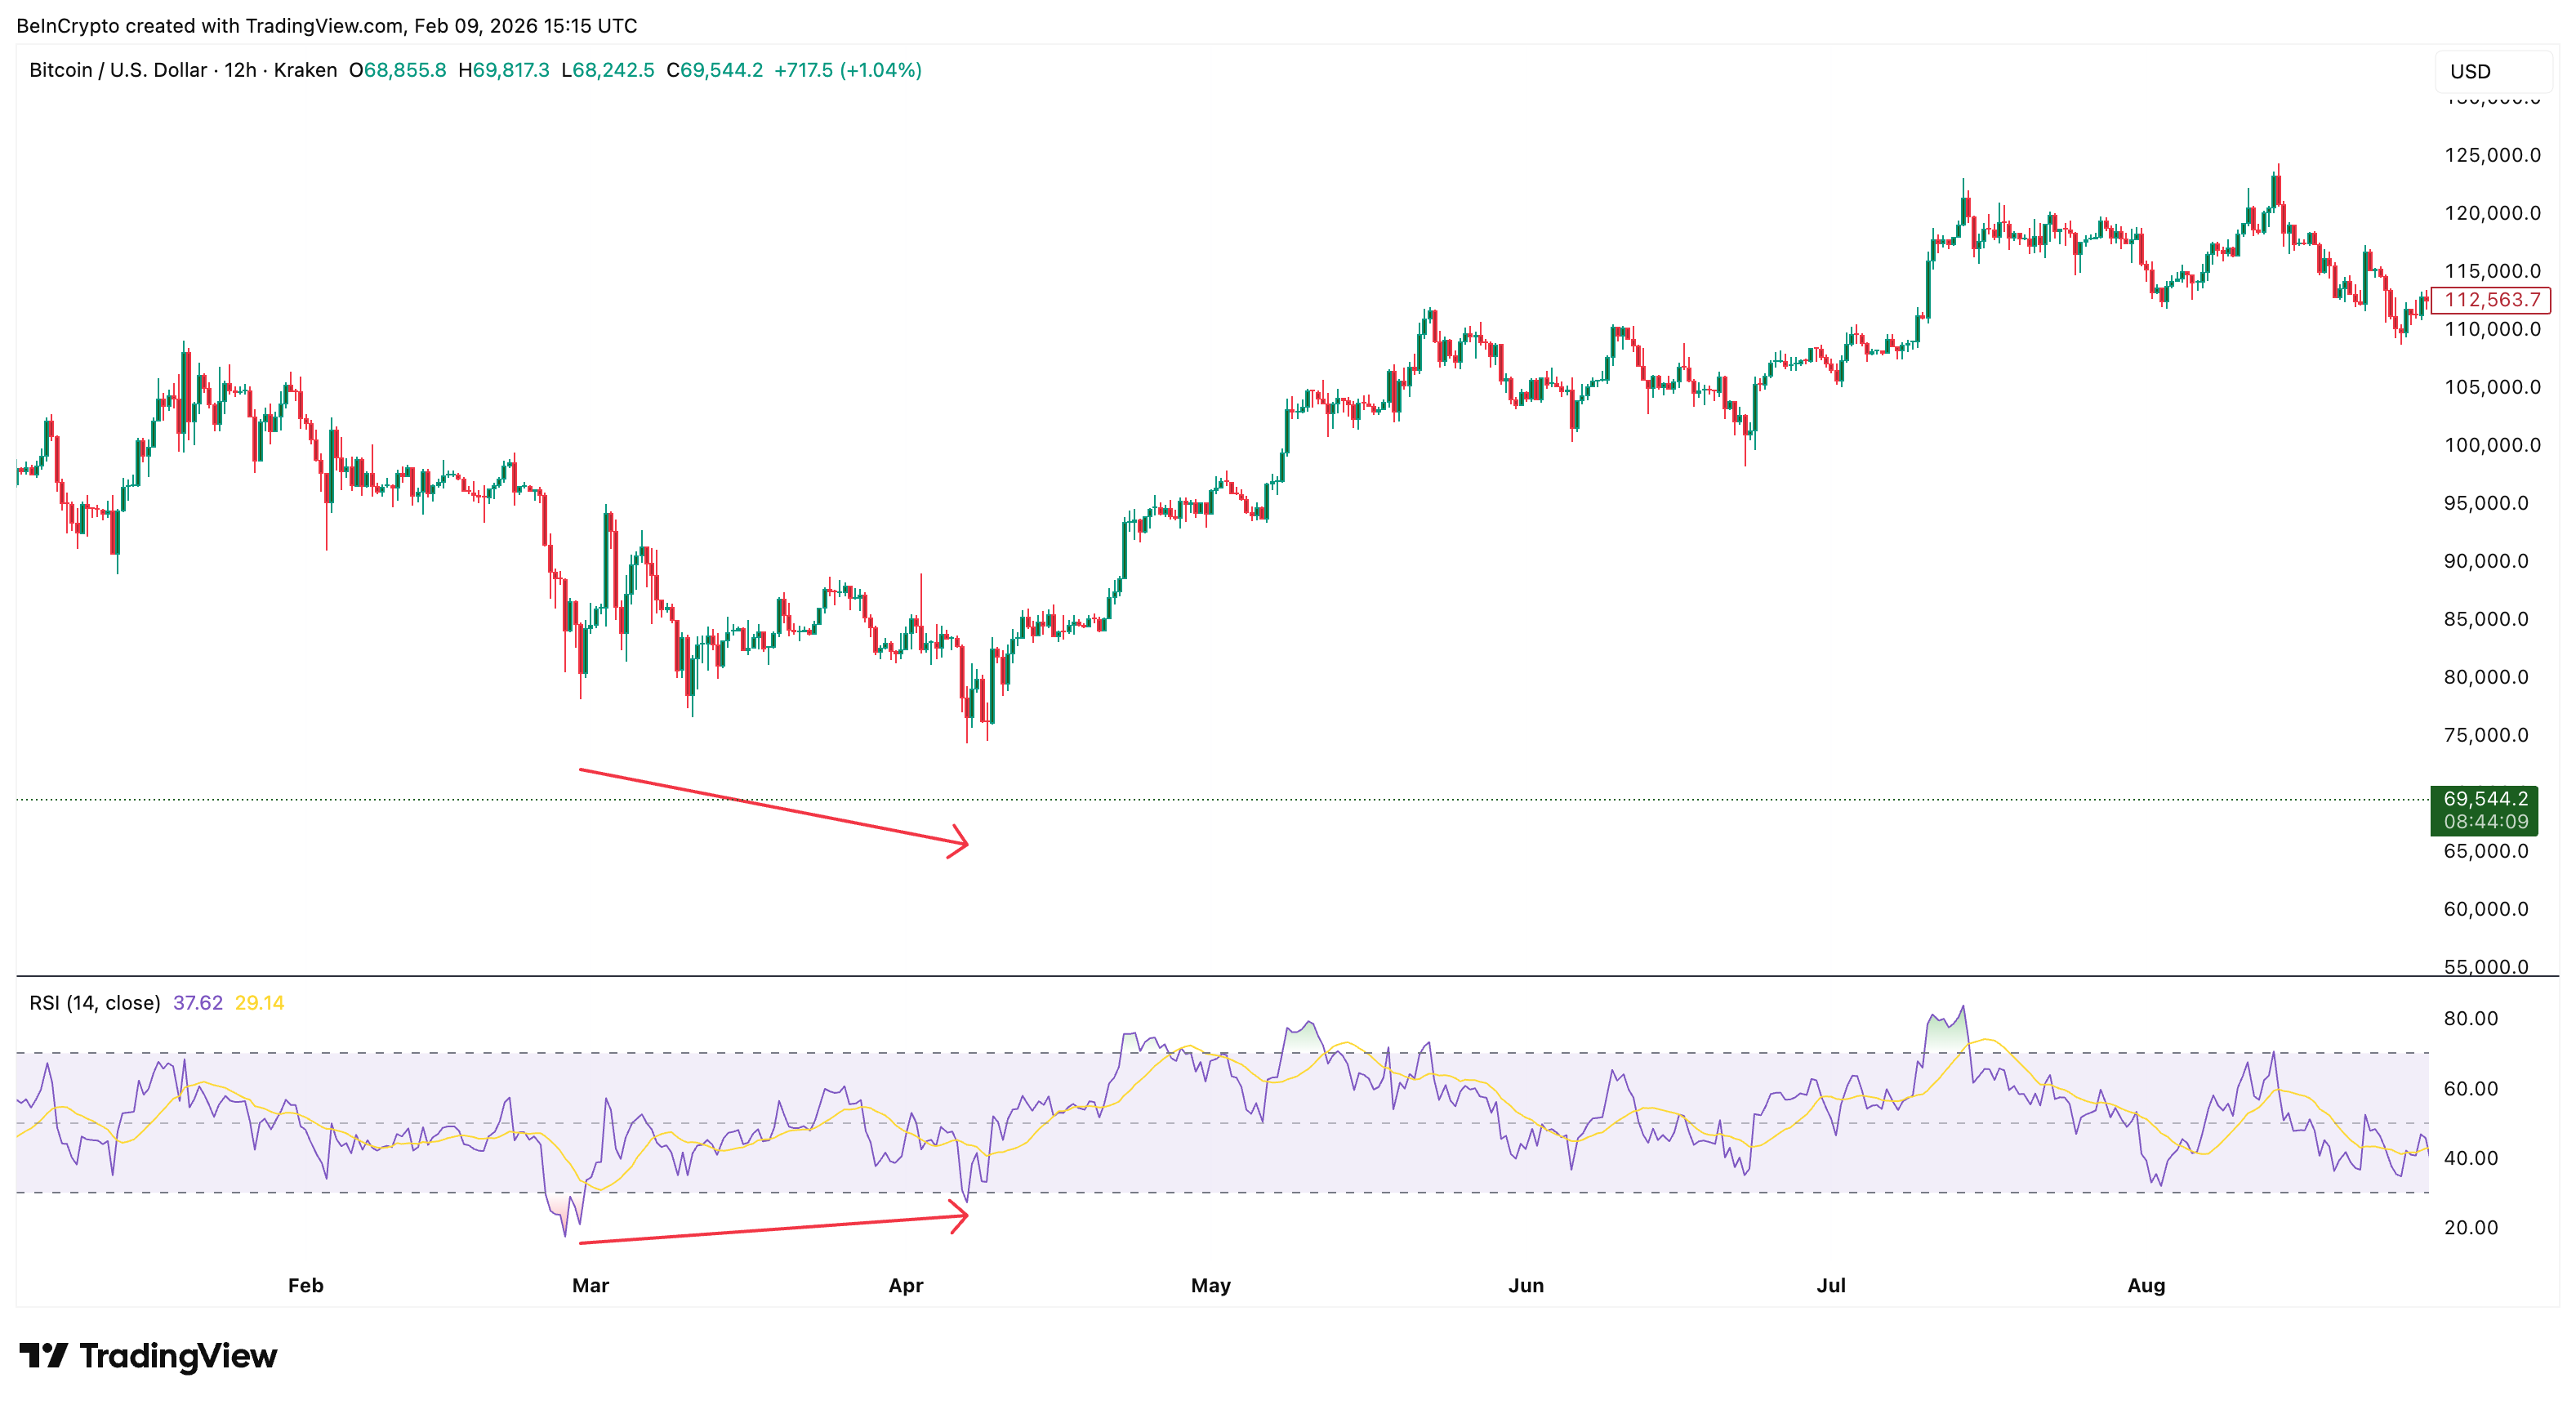
Despite this, exchange outflows, which measure coins leaving exchanges for storage, continued falling. Outflows dropped from around 348,000 BTC in early March to near 285,000 BTC by April 8.
This showed that dip buyers were hesitant and that accumulation remained limited. The technical reversal was largely ignored.
Bearish Positioning After the April 8 Low (Early → Mid April)
On April 8, Bitcoin formed a local bottom near $76,000. Instead of reducing risk, traders increased bearish exposure. Funding rates turned negative, indicating a strong short bias. At the same time, open interest, the total value of outstanding derivatives contracts, rose toward $4.16 billion (Bybit alone).
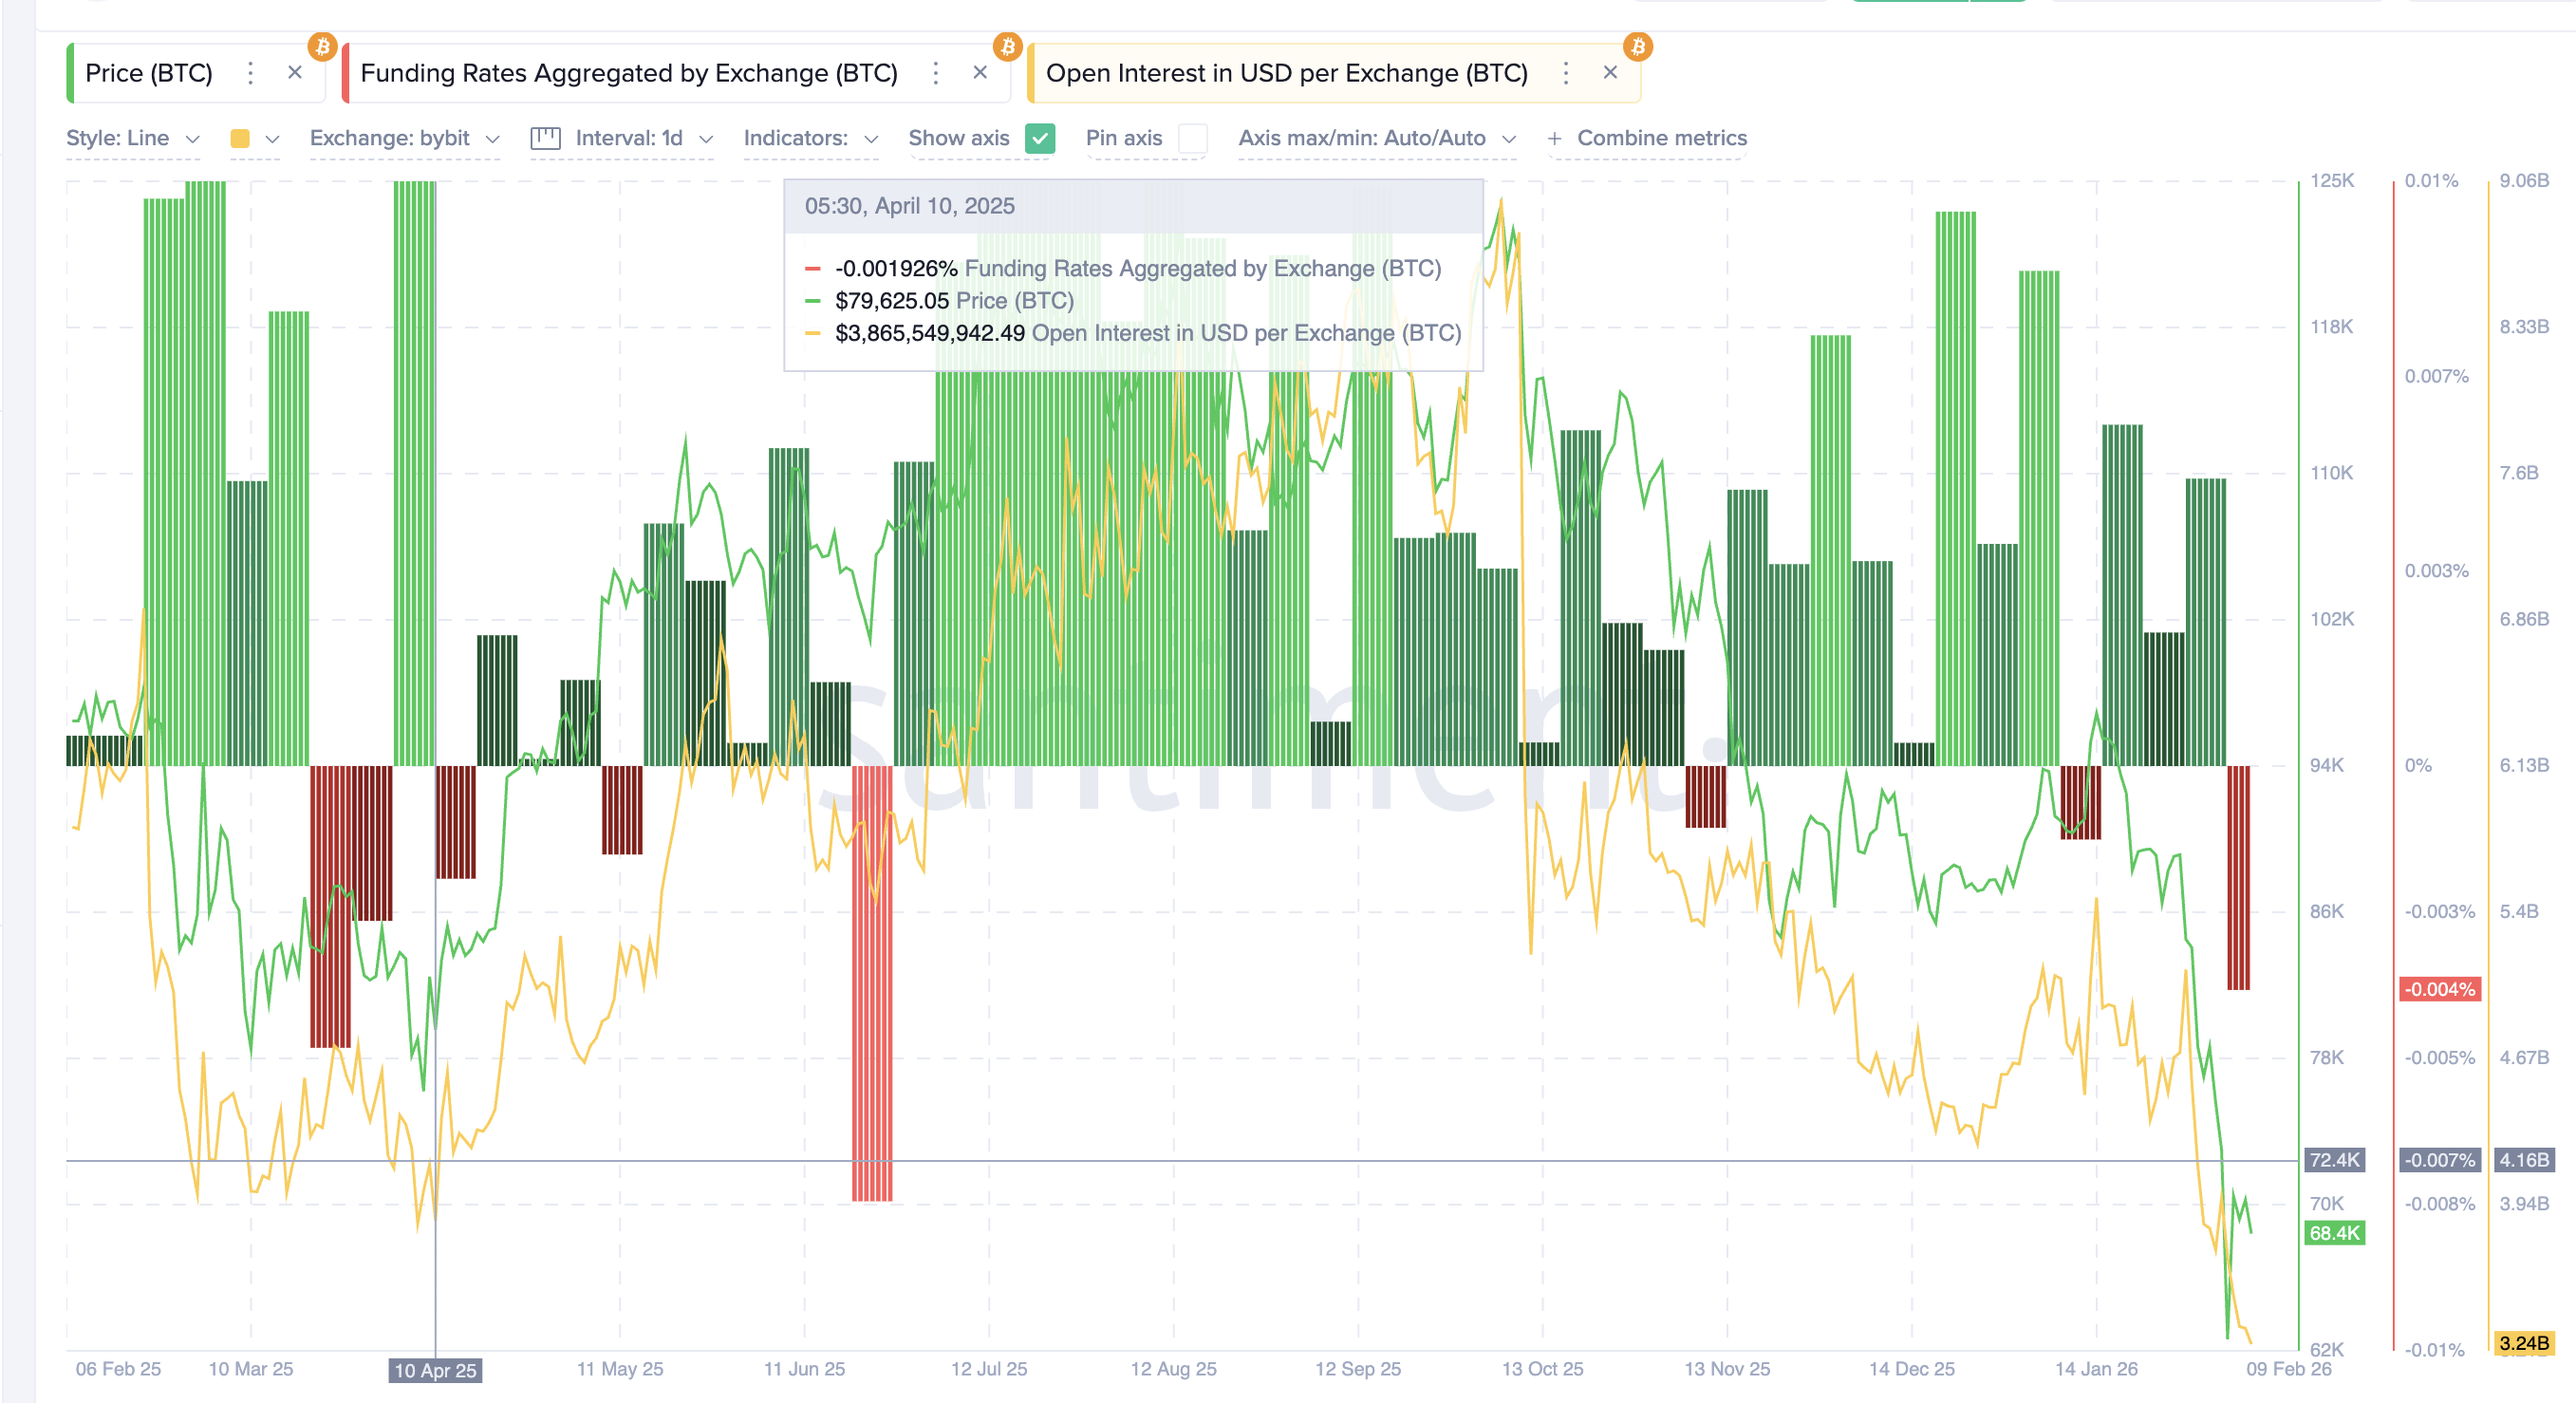
This showed that new leverage was being built primarily on the short side. Most traders expected the bounce to fail and prices to move lower.
Exchange outflows continued declining toward 227,000 BTC by mid-April, confirming that spot accumulation remained weak. Both retail and institutional participants stayed bearish.
Selling Exhaustion on Chain (April 8 → April 17)
On-chain data showed that selling pressure was fading.
The Spent Output Profit Ratio (SOPR) was near or below 1 and failed to sustain profit/loss spikes. This indicated that loss-driven selling was slowing, even when buying was not picking pace. That’s a classic bottom sign.
Short-term holder Net Unrealized Profit/Loss (STH-NUPL), which measures whether recent buyers are in profit or loss, remained in negative territory. It stayed in the capitulation zone with only shallow rebounds, reflecting low confidence and limited optimism.
Sponsored
Sponsored
Together, these signals showed exhaustion rather than renewed demand.
Compression and Structural Imbalance (Mid April)
By mid-April, Bitcoin entered a narrow trading range. Volatility declined, while open interest remained elevated and funding stayed mostly negative. Shorts were crowded, yet prices failed to break lower and began stabilizing instead.
With selling pressure fading (SOPR stabilizing) but no meaningful spot accumulation emerging (weak outflows), the market became increasingly dependent on derivatives positioning. Buyers remained hesitant, while bearish leverage continued rising against weakening downside momentum. This imbalance made the market structurally unstable.
April 23 — Trigger and Short Squeeze
By April 22–23, STH-NUPL moved back toward positive territory (shown earlier), showing that recent buyers had returned to small profits. Some holders were now able to sell into strength, while many traders still treated the rebound as temporary and added short exposure.
Notably, a similar NUPL rebound had appeared before the October 2025 long flush. The difference was context. In October, short-term holders turning profitable encouraged more long positioning as traders expected further upside. In April, the same return to small profits encouraged more short positioning, as traders in a corrective market viewed the rebound as temporary and bet on another decline.
This combination tightened liquidity and increased bearish positioning. When prices pushed higher, stop losses were triggered, short covering accelerated, and open interest dropped sharply. Forced buying created a feedback loop, and a positive tariff-related tweet helped, producing one of the largest short liquidation events of 2025.
Could This Short Squeeze Have Been Anticipated?
By mid-April, several warning signs were visible:
- Bullish RSI divergence from late February
- Persistently negative funding rates
- Rising open interest after the April low
- Weak exchange outflows and limited accumulation
- SOPR stabilizing near 1
- STH-NUPL stuck in capitulation
Individually, these signals appeared inconclusive. Together, they showed a market where shorts were crowded, selling was exhausted, and downside momentum was fading.
The April 2025 squeeze followed a clear sequence:
Momentum divergence → disbelief → short buildup → selling exhaustion (SOPR exhaustion) → price compression → positioning imbalance → short liquidation cascade.
Reflecting on repeated liquidation cycles, Chen said trader behavior remains remarkably consistent.
“Periods of low volatility trigger overconfidence… Liquidity is mistaken for stability… Volatility resets expectations… Each cycle clears excess leverage,” she added.
What These Case Studies Reveal About Future Liquidation Cascade Risk
The October 2025 and April 2025 events show that measurable changes in leverage and on-chain behavior led to the large liquidation cascades. Importantly, these cascades do not occur only at major market tops or bottoms. They form whenever leverage becomes concentrated and spot participation weakens, including during relief rallies and corrective bounces.
In both cases, these signals emerged 7–20 days before liquidation peaks.
In October 2025, Bitcoin rose from about $109,000 to $126,000 in nine days while open interest expanded from roughly $38 billion to over $47 billion. Exchange inflows fell below 30,000 BTC, SOPR rose above 1.04, and short-term holder NUPL moved from -0.17 to positive within ten days. This reflected rapid leverage growth and rising optimism near a local peak.
In April 2025, Bitcoin bottomed near $76,000 while funding stayed negative and open interest rebuilt toward $4.16 billion. Exchange outflows declined from around 348,000 BTC to near 227,000 BTC. SOPR remained near 1, and STH-NUPL stayed negative until just before the squeeze, showing selling exhaustion alongside growing short exposure.
Despite different market phases, both cascades shared three features. First, open interest increased while spot flows weakened. Second, funding remained strongly one-sided for several days. Third, short-term holder NUPL shifted rapidly shortly before forced liquidations. And finally, if a reversal or a bounce setup surfaces on the technical chart, the liquidation cascade tracking becomes clearer.
These patterns also appear during mid-trend pullbacks and relief rallies. When leverage expands faster than spot conviction and emotional positioning becomes one-sided, liquidation risk rises regardless of price direction. Tracking open interest, funding, exchange flows, SOPR, and NUPL together provides a consistent framework for identifying these vulnerable zones in real time.


eToro has secured a New York BitLicense and money transmission license, reopening crypto trading to New Yorkers and extending its US coverage to 48 states after a 2024 SEC settlement.
Summary
- eToro has secured both a New York BitLicense and a money transmission license, opening its crypto platform to residents of New York.
- The approvals mean eToro now offers cryptocurrency trading in 48 US states, following a $1.5 million settlement with the SEC in 2024.
- The company calls New York “the heart of the financial markets” and frames the move as a strategic milestone in its US expansion.
Online brokerage and social trading platform eToro has obtained a coveted New York BitLicense and a parallel money transmission license, clearing the way for residents of the state to trade cryptocurrencies on its platform for the first time. The twin approvals from the New York State Department of Financial Services (NYDFS) mean eToro’s crypto offering now reaches 48 US states, according to a report from Crowdfund Insider cited by ChainCatcher.
Announcing the launch, Andrew McCormick, head of eToro’s US division, said that “New York is the heart of the financial markets and a hub of innovation,” describing the expansion as “both a strategic milestone and a reflection of our commitment to responsibly advancing the next generation of financial market accessibility.” NYDFS’s BitLicense regime, introduced in 2015, remains one of the strictest state-level crypto frameworks in the US, with only a limited number of exchanges and custodians approved over the past decade, as repeatedly highlighted by outlets such as Bloomberg and the Financial Times.finance.
The New York green light comes roughly two years after eToro resolved an enforcement action with the US Securities and Exchange Commission. In 2024, the company agreed to pay a $1.5 million civil penalty to settle charges that it operated as an unregistered broker and clearing agency, and subsequently delisted most crypto assets from its US platform while it overhauled its compliance controls. That retrenchment mirrored a broader regulatory crackdown on offshore-style token menus, with major venues trimming their listings in response to SEC and CFTC pressure, as detailed in earlier reporting by Bloomberg and the Wall Street Journal on post-2022 enforcement trends.finance.
Since then, eToro has adopted a more conservative US stance, focusing on a narrower range of assets and building out its compliance and surveillance stack to meet NYDFS standards. By securing the BitLicense, the firm joins a small club of global exchanges able to serve New York retail customers, preserving a regulatory moat that rivals without state approval cannot easily cross. For US users, the expansion means a familiar social-trading interface will now sit alongside licensed incumbents in the country’s most tightly regulated crypto market, while for the industry it offers a template for how post-enforcement platforms can re-enter New York — provided they accept heavier oversight and a slimmer token set.
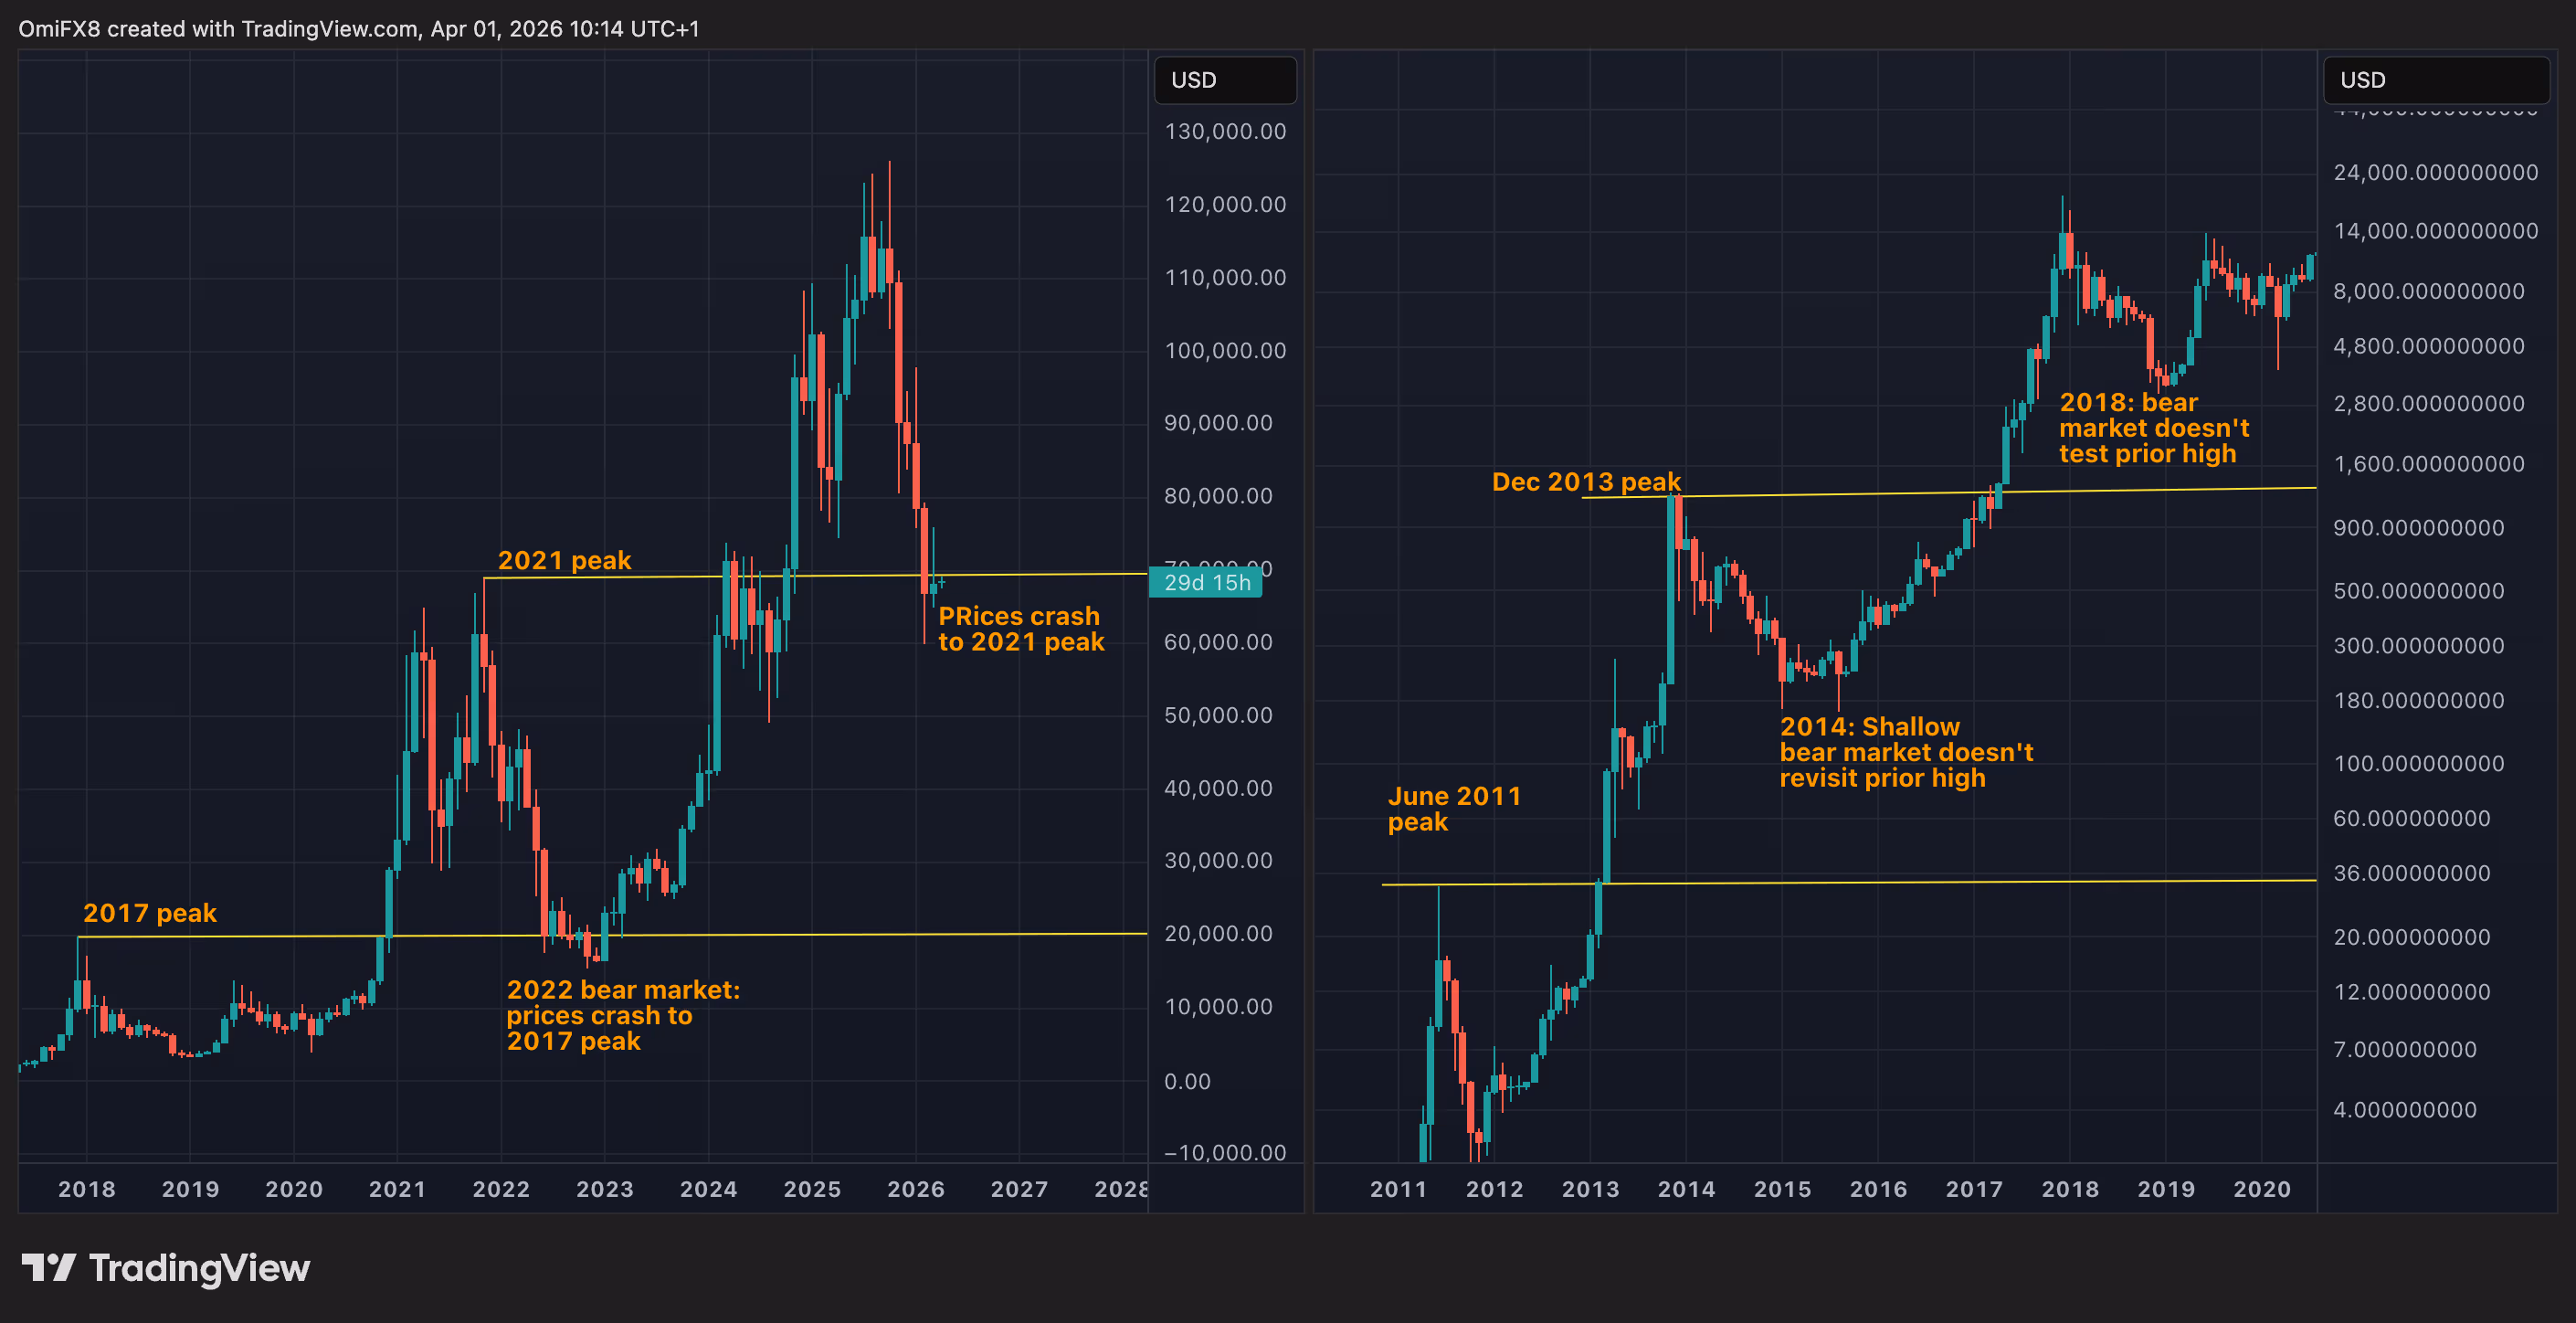
Since its inception, bitcoin has been like a daredevil climber scaling new heights, rarely looking back at the ledges it left behind. Its price seldom retraced to previous bull-market peaks, even during long, grueling bear markets.
But that pattern seems to have changed, suggesting that the market has matured, and the era of runaway, parabolic gains is behind us.
BTC trades near old peak
Bitcoin has been hovering around $70,000 since early February – well below the $126,000 peak of the 2023-2025 bull run.
That $70,000 mark is important because it was the record high in the 2019–2022 market cycle. In other words, this bear market has retraced all the way back to a previous summit.
This is unusual. In earlier bear markets, such as those in 2014 and 2018, bitcoin never returned to prior cycle highs. The exception was 2022, when prices dipped under the 2017 high of $20,000. At the time, analysts dismissed it as an anomaly, blaming crypto scams and massive deleveraging.
What makes the current retrace remarkable is that it’s happening without any extreme catalysts. The market has simply returned to a prior peak as part of the natural ebb of a bear cycle.

Slowing growth and the law of diminishing returns
Each new bull run isn’t generating the parabolic gains of the past. Pushing prices far beyond previous peaks is getting harder, which makes retraces to old highs more natural. In other words, previous peaks are no longer untouchable.
This is a clear example of the law of diminishing returns. As bitcoin becomes more expensive, moving prices higher requires ever-larger sums of capital. The days when modest inflows could trigger massive rallies are largely behind us, making price movements more measured and predictable.
Looking at historical growth highlights this trend:
- The 2013 peak was 38 times higher than 2011.
- The 2017 peak was 16 times higher than 2013.
- By 2021, the increase slowed to just 3 times the 2017 level.
- The 2025 peak of over $126K was less than twice the 2021 peak.
While prices are still rising, the pace of growth is steadily slowing.
Institutionalization and broader market participation
Part of this slowdown comes from the institutionalization of Bitcoin and the growth of the derivatives market. Traders now have structured ways to bet on volatility, timing, and market direction, not just price increases. This broader participation has tempered extreme swings.
This is very different from the pre-2020 era, when trading was largely limited to buying and selling on the spot market. Back then, only bullish believers of bitcoin actively participated, often jumping in at the first sign of a dip.
Behavioral patterns and what’s next
Old peaks often act as strong support levels due to a behavioral concept called anchoring bias, where traders fixate on previous highs as reference points.
Many who missed the initial breakout tend to buy when prices return to these familiar levels, fueling the next leg of a bull run. This behavioral tendency, combined with the self-reinforcing nature of support and resistance, helps explain why the recent downtrend has stalled around $70,000.
A strong bounce from this level could signal that the bear market has run its course, similar to late 2022, when the downtrend ended around $20,000.
However, if the law of diminishing returns is any guide, the next uptrend may be more measured and “tradfi-like,” rather than the frenzied rallies of the old speculative days.

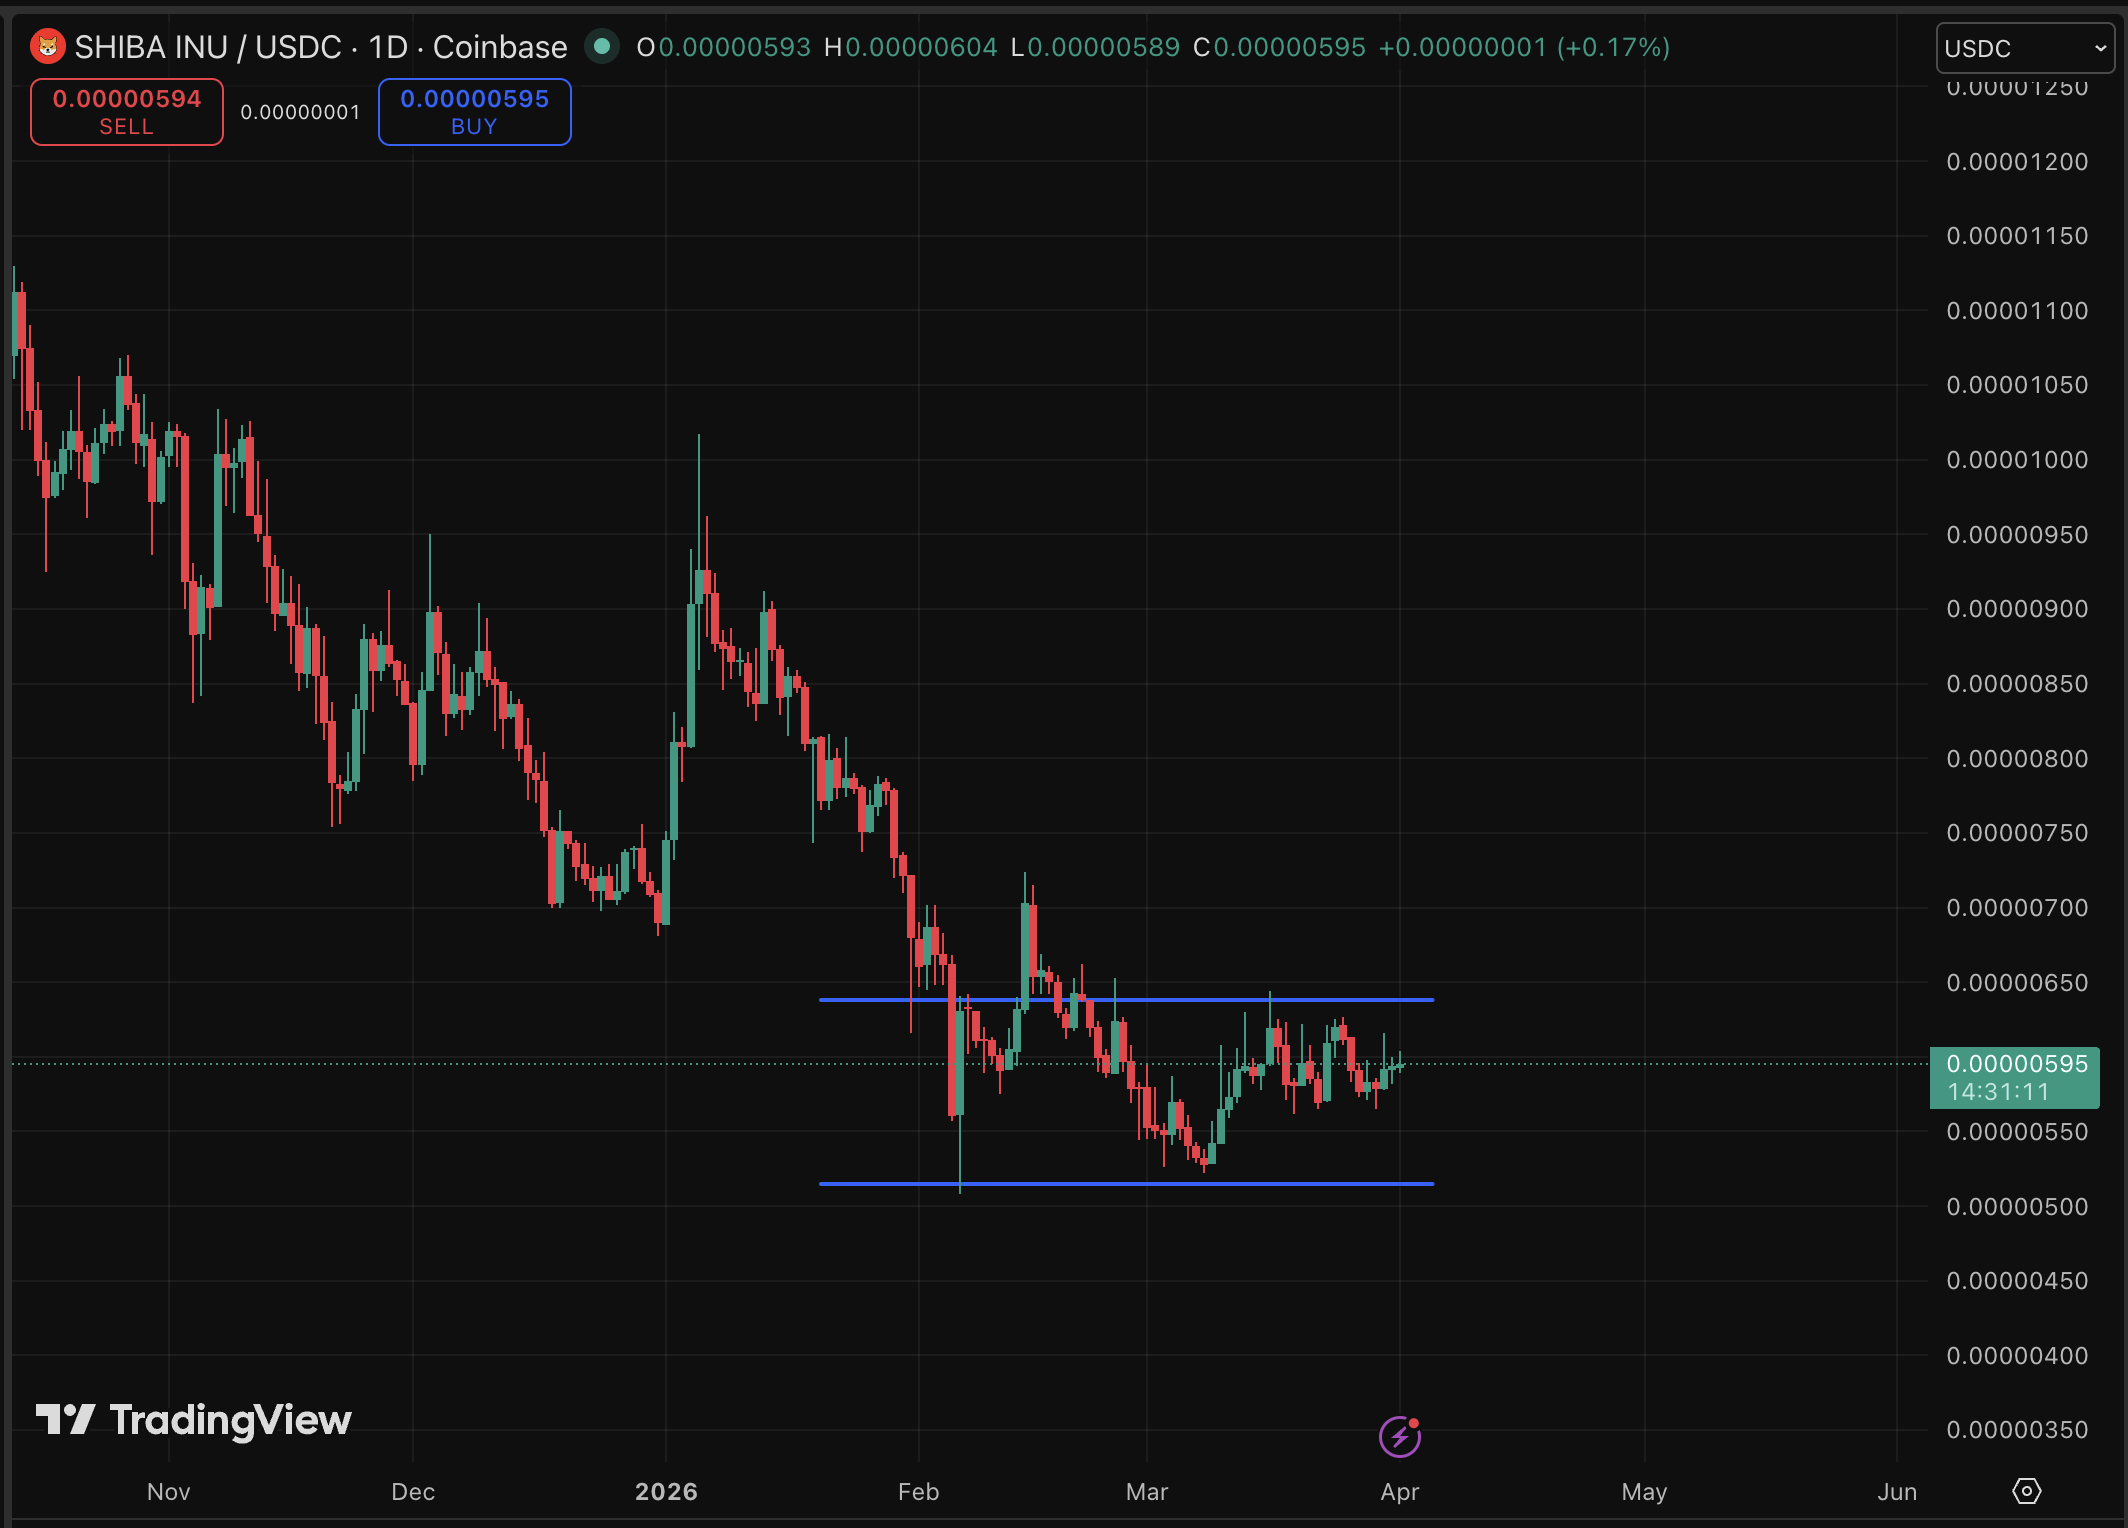
Shiba Inu is trading at $0.00000597, up 0.93% in the last 24 hours, a modest price bounce that masks a bruising -4.4% seven-day slide, and the prediction is not looking good. The dog coin that minted actual millionaires in 2021 is now fighting to hold a six-zero price handle.
The 24-hour rebound followed a technical defense of the $0.0000056 support zone after six consecutive red sessions. Trading activity surged 70%, accompanied by a positive buy-sell delta of 27.4 billion SHIB.
On-chain data confirmed net exchange outflows of 112–125 billion SHIB, stripping near-term selling pressure from the order book. That confluence, volume spike, positive delta, and exchange drain are historically the setup SHIB needs before a short-term leg higher.
But can SHIB print more millionaires at this level? Are memecoins’ communities no longer able to catapult a coin?
Discover: The best pre-launch token sales
Shiba Inu Price Prediction: Reclaim $0.000007 Before April Ends, or Dream Shattered?
Shiba Inu is consolidating just below the $0.000006 price resistance level, a line that has flipped from support to resistance over multiple sessions, dragging down bullish sentiment.
Key levels to track: support clusters at $0.0000056–$0.0000059, with resistance stacked at $0.0000060–$0.0000065 and a more meaningful ceiling near the historical $0.000018–$0.000020 range.
Three scenarios are currently in play:
- Bull case: SHIB flips $0.000006 with sustained volume, targets $0.0000065–$0.000007 within days. Exchange outflows accelerating would confirm this path.
- Base case: Price consolidates between $0.0000057–$0.0000062, grinding sideways as macro uncertainty limits conviction.
- Bear case: Failure to hold $0.0000056 opens a drop toward $0.0000050, invalidating the current rebound thesis entirely.
The 589 trillion SHIB still in circulation remains the structural ceiling on any millionaire-making moon run. People have noted SHIB’s sensitivity to external catalysts. The October 2024 Elon Musk effect pushed volume to $145 million in 48 hours, but that event is, by definition, unpredictable.
SHIB could deliver decent returns. Delivering millionaire returns from this market cap? That math gets harder every cycle.
Discover: The best crypto to diversify your portfolio with
Maxi Doge Targets Early Mover Upside as Shiba Inu Tests Key Levels
Here’s the uncomfortable reality SHIB holders face: at today’s price, the multiplier required to turn a $1,000 stake into a million dollars simply doesn’t exist at current valuations without a market cap that would rival entire national economies. It’s arithmetic.
Traders chasing the next generational meme coin trade are increasingly looking at earlier-stage projects where the supply-to-price math still works in their favor.
Maxi Doge ($MAXI) is one presale capturing that rotation. The project has raised more than $4.7 million at a current price of just $0.0002811. The concept leans hard into gym-bro meme culture with holder-only trading competitions, leaderboard rewards, and a Maxi Fund treasury dedicated to liquidity and partnerships.
Recent capital flows into the presale have drawn comparisons to early-stage SHIB momentum. Staking is live with a 66% APY bonus. For traders weighing SHIB’s structural ceiling against earlier-stage upside, researching Maxi Doge is worth the ten minutes.
This article is not financial advice. Crypto investments are highly volatile and speculative. Always conduct your own research before investing.
The post Shiba Inu Price Prediction: Time to Say Goodbye To Millionaire Dreams? appeared first on Cryptonews.
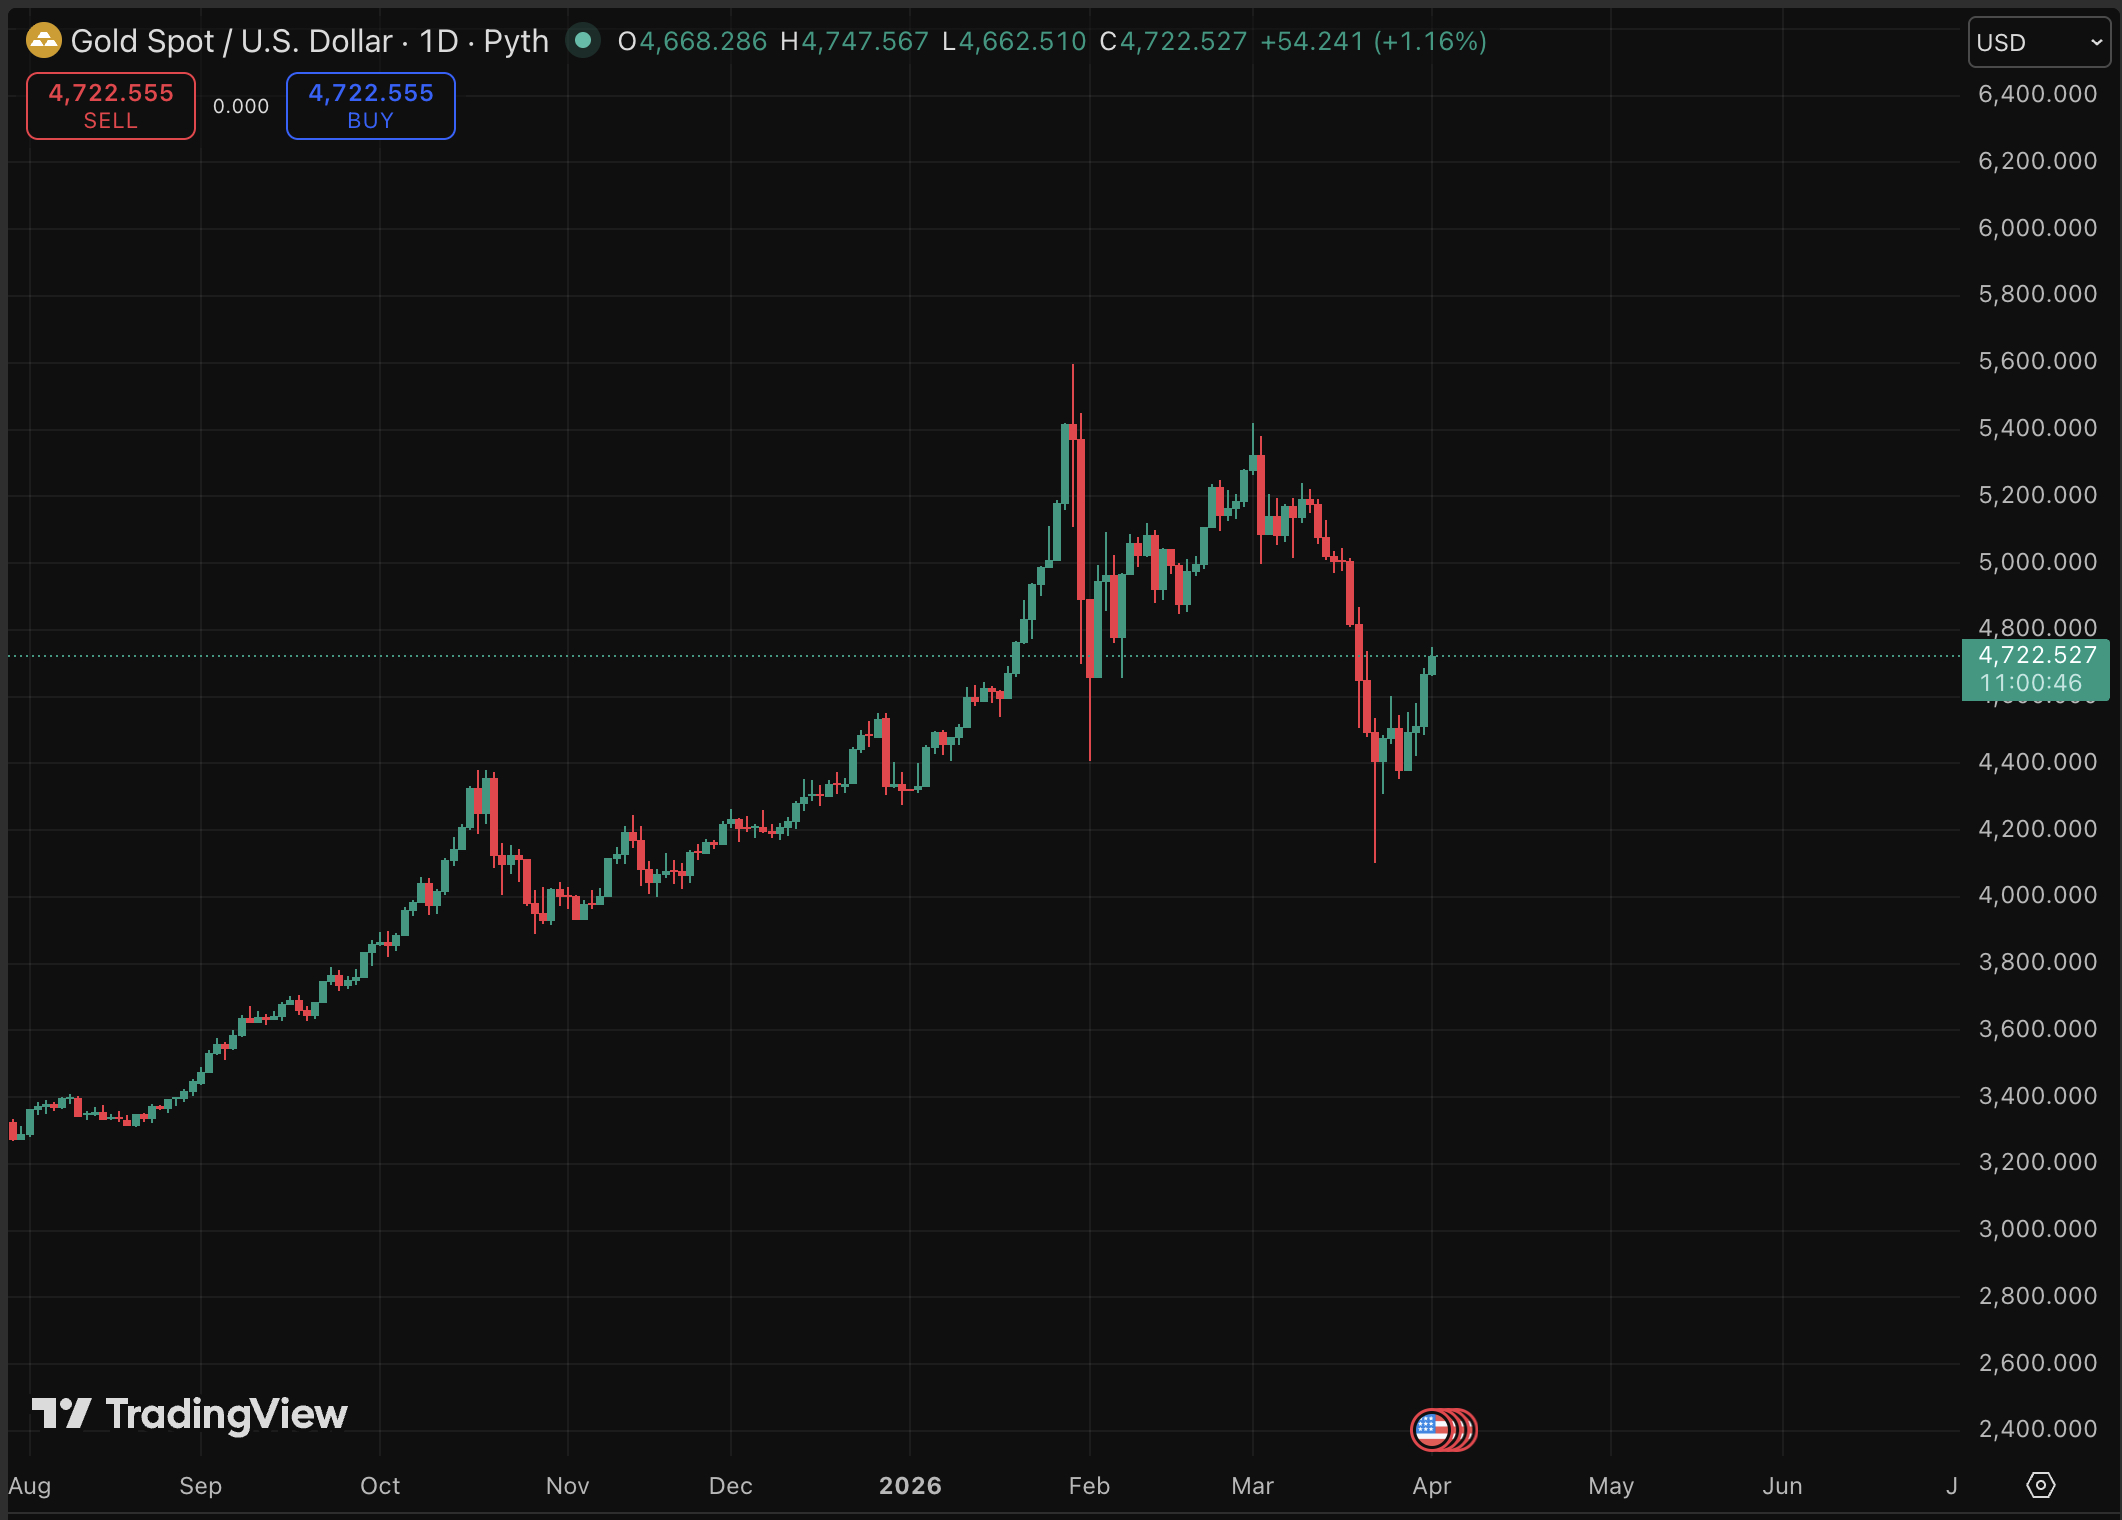
Gold is hemorrhaging value. Spot gold price climbed 2.2% to $4,687/oz, but that bounce barely registers against a 12% monthly collapse that has the metal on track for its worst monthly performance since October 2008, which resulted in a more grim-looking prediction.
The safe-haven narrative is cracking.
The catalyst yesterday was a Wall Street Journal report that President Donald Trump signaled willingness to end the U.S. military campaign against Iran, even if the Strait of Hormuz remains partially closed.
“Gold prices are bouncing in early Asia-Pacific trade after U.S. President Donald Trump told aides he is willing to end the U.S. military campaign against Iran… That triggered a risk-on response from financial markets,” said Ilya Spivak, head of global macro at Tastylive.
U.S. gold futures for April delivery gained 1.2% to $4,611.30 in tandem. The dollar eased, providing additional tailwind to greenback-denominated bullion.
Despite the daily reprieve, the macro structure driving gold’s rout remains intact, and Fed policy signals from Powell continue pointing toward a higher-for-longer rate environment that structurally penalizes non-yielding assets.
Discover: The best crypto to diversify your portfolio with
Gold Price Prediction: Can XAU Reclaim $5,000 Before the Fed Blinks?
Today’s relief rally puts spot gold close to $4,700, up 1.5% intraday. This figure looks strong in isolation against March’s 13% drawdown from prior highs above $5,000.
Spivak flagged a critical technical signal: “Gold has been stabilizing for about a week now, with a rally last Friday a particular standout. That came alongside a drop in Treasury yields that seems to suggest the markets are starting to see the Iran war as a recession risk.”
Falling yields reduce the opportunity cost of holding gold, that’s the bull mechanism. Quarterly gains still hold at approximately 5%, confirming the longer-term trend hasn’t broken.

For the gold price, if de-escalation holds, Treasury yields slide further, Fed language softens on inflation, gold can re-targets $4,800–$5,000 resistance recovery. Goldman Sachs maintains a $5,400/oz end-2026 target anchored by central bank accumulation and eventual easing.
However, if energy prices re-accelerate, the Fed signals no cuts through year-end, and Hormuz disruption deepens, a break below $4,300 opens the door to the low $4,000s.
Discover: The best pre-launch token sales
LiquidChain Targets Early Mover Upside as Gold Tests Key Resistance
Gold’s struggle to reclaim $5,000 raises an uncomfortable question for capital allocators: if the canonical safe haven is down 13% in a month, where does risk-adjusted opportunity actually live?
For us, watching macro dysfunction erode established stores of value, early-stage infrastructure plays with asymmetric upside are drawing renewed attention, particularly those solving real structural problems across fragmented liquidity markets.
A new layer emerges. Only a few see it first. — LiquidChain (@getliquidchain) March 24, 2026
The future is LiquidChain  ⟁https://t.co/vqvBcdSj94 pic.twitter.com/R7ZeZ0NPGl
LiquidChain ($LIQUID) is a Layer 3 infrastructure project positioning itself as the cross-chain liquidity layer — fusing Bitcoin, Ethereum, and Solana liquidity into a single execution environment. The architecture centers on four components: Unified Liquidity Layer, Single-Step Execution, Verifiable Settlement, and Deploy-Once Architecture, letting developers deploy once and access all three ecosystems simultaneously.
The presale is currently priced at $0.01445, with more than $630K raised to date, with more than 1700% APY in staking bonus.
For those looking for a gold alternative, research LiquidChain’s presale structure here.
This article is not financial advice. Conduct your own research before investing.
The post Gold Price Prediction: Worst Month in 17 Years fo Save Haven Rock appeared first on Cryptonews.

Jesse Spiro, the head of government affairs at stablecoin issuer Tether, will be chairing the organization of a crypto-backed Super political action committee (PAC) to “actively support candidates” in the 2026 US midterm elections and beyond.
In a Wednesday announcement, the Fellowship PAC, a committee that launched in August 2025 and later claimed to have raised “over $100 million” from undisclosed backers aligned with the crypto industry, said that Spiro would become chair ahead of its first political endorsements for the 2026 elections.
The PAC said that it would support candidates in favor of innovation, regulatory clarity for digital assets, and open markets.
”We have an opportunity to ensure the United States remains the global hub for builders, entrepreneurs, and technological progress,” said Spiro. “Fellowship PAC is committed to supporting leaders who understand what’s at stake and are willing to act.”

The addition of a crypto-aligned Super PAC with potentially hundreds of millions of dollars could be used to influence US elections. The Fairshake PAC, backed by Ripple Labs and Coinbase, spent more than $130 million on media buys in the 2024 elections, and reported having $193 million ahead of the 2026 midterms.
Related: Crypto awareness tops 80% among young people in UK: Coinbase survey
Fellowship filed a statement of organization with the US Federal Election Commission (FEC) on Aug. 7 and had reported no contributions or expenditures as of Dec. 31. Although the PAC has claimed to have more than $100 million in its war chest, it was unclear at the time of publication who may be responsible for funding the committee.
Cointelegraph did not receive an immediate response to requests for comment by the PAC.
Money from the crypto industry may already have been a factor in US state primaries, which kicked off in March. Although some of the industry-aligned candidates did not win their races in Illinois, there are more than seven months before the 2026 general election, giving PACs like Fairshake, Fellowship, and others the opportunity to sway voters.
A debate on stablecoin yield is still shadowing a congressional crypto bill
Tether, the issuer behind the largest stablecoin by market capitalization, USDt (USDT), is likely to be affected by legislation being considered by US lawmakers in the Senate.
The House of Representatives passed a digital asset market structure bill in July 2025 called the CLARITY Act, which has effectively been stalled in the Senate amid debate over stablecoin rewards, tokenized equities, ethics and other issues.
As of Wednesday, the Senate Banking Committee had not rescheduled a markup on the bill which it postponed in January. It’s unclear if or when the bill could head to the full chamber for a vote.

Crypto markets rose as oil prices retreated under $100 a barrel on growing expectations that the conflict could wind down within weeks.

Bitcoin 2026 Overview
Bitcoin traded near $68,000 as organizers confirmed a major addition to Bitcoin 2026. The event will host Afroman as a headline speaker and performer. The conference will take place April 27–29 in Las Vegas.
The announcement signals a growing overlap between culture and decentralized technology narratives. It also reflects Bitcoin’s expanding role beyond finance into expression and ownership debates. Organizers expect strong engagement from global attendees and industry participants.
The event will occur at The Venetian Resort and feature hundreds of speakers. More than 30,000 attendees are expected to participate across multiple stages. The program will combine education, entertainment, and industry networking.
Legal Victory Shapes Afroman’s Bitcoin 2026 Appearance
Afroman gained renewed attention after a legal battle tied to a police raid in 2022. Authorities searched his home but reportedly found no evidence of wrongdoing. He later used personal footage to create music and commentary about the incident.
The conflict grew when some of the officers took a defamation case against him asking for monetary damages. They asked, as well, to get rid of the artist’s content on public platforms. Despite that, the jury acquitted Afroman and put an end to the case. The result opened up more talk about the rights of creators and the need for public accountability. Afroman saw the verdict as a larger victory for freedom of speech. This viewpoint is in fact very similar to the core philosophy of Bitcoin. More and more, the culture around Bitcoin is making its way into art and expression. The supporters of Bitcoin, as a rule, underline the freedom, openness, and getting the full control over the personal content. Such principles have left their mark not only on the culture but also on the domain of arts. Consequently, in a bold step, the current events deliberately feature creators boldly confronting the authorities and institutions.
Afroman’s involvement reflects the shift in the ecosystem’s trajectory. His unique style is a fusion of music, humor, and insightful commentary on society. Such a message deeply resonates with an audience that supports decentralization of systems. Bitcoin event organizers keep identifying the events as technical gatherings only. They want to put the spotlight on real-life applications and cultural relevance. In this way, the appeal will be extended not only to the developers and financial players.
Exhibition and Global Conference Growth
The conference will feature Afroman’s American flag suit as part of a specially curated art exhibition. It is a protest and resistance symbol from his legal fight. It is also going to be auctioned on a special platform. The exhibition will present topics such as power, reaction, and artistic rebellion. It will feature works tied to Bitcoin’s short but impactful history. These elements aim to connect technology with human stories.
Bitcoin Conference continues to expand its global footprint. Earlier editions managed to draw tens of thousands of people from various regions. The next events are scheduled to cover Asia, Europe, and the Middle East. The Las Vegas meeting will act as a main center for the 2026 programs. It will unite developers, entrepreneurs, and artists. Such a blend further helps positioning Bitcoin as a financial and social movement.
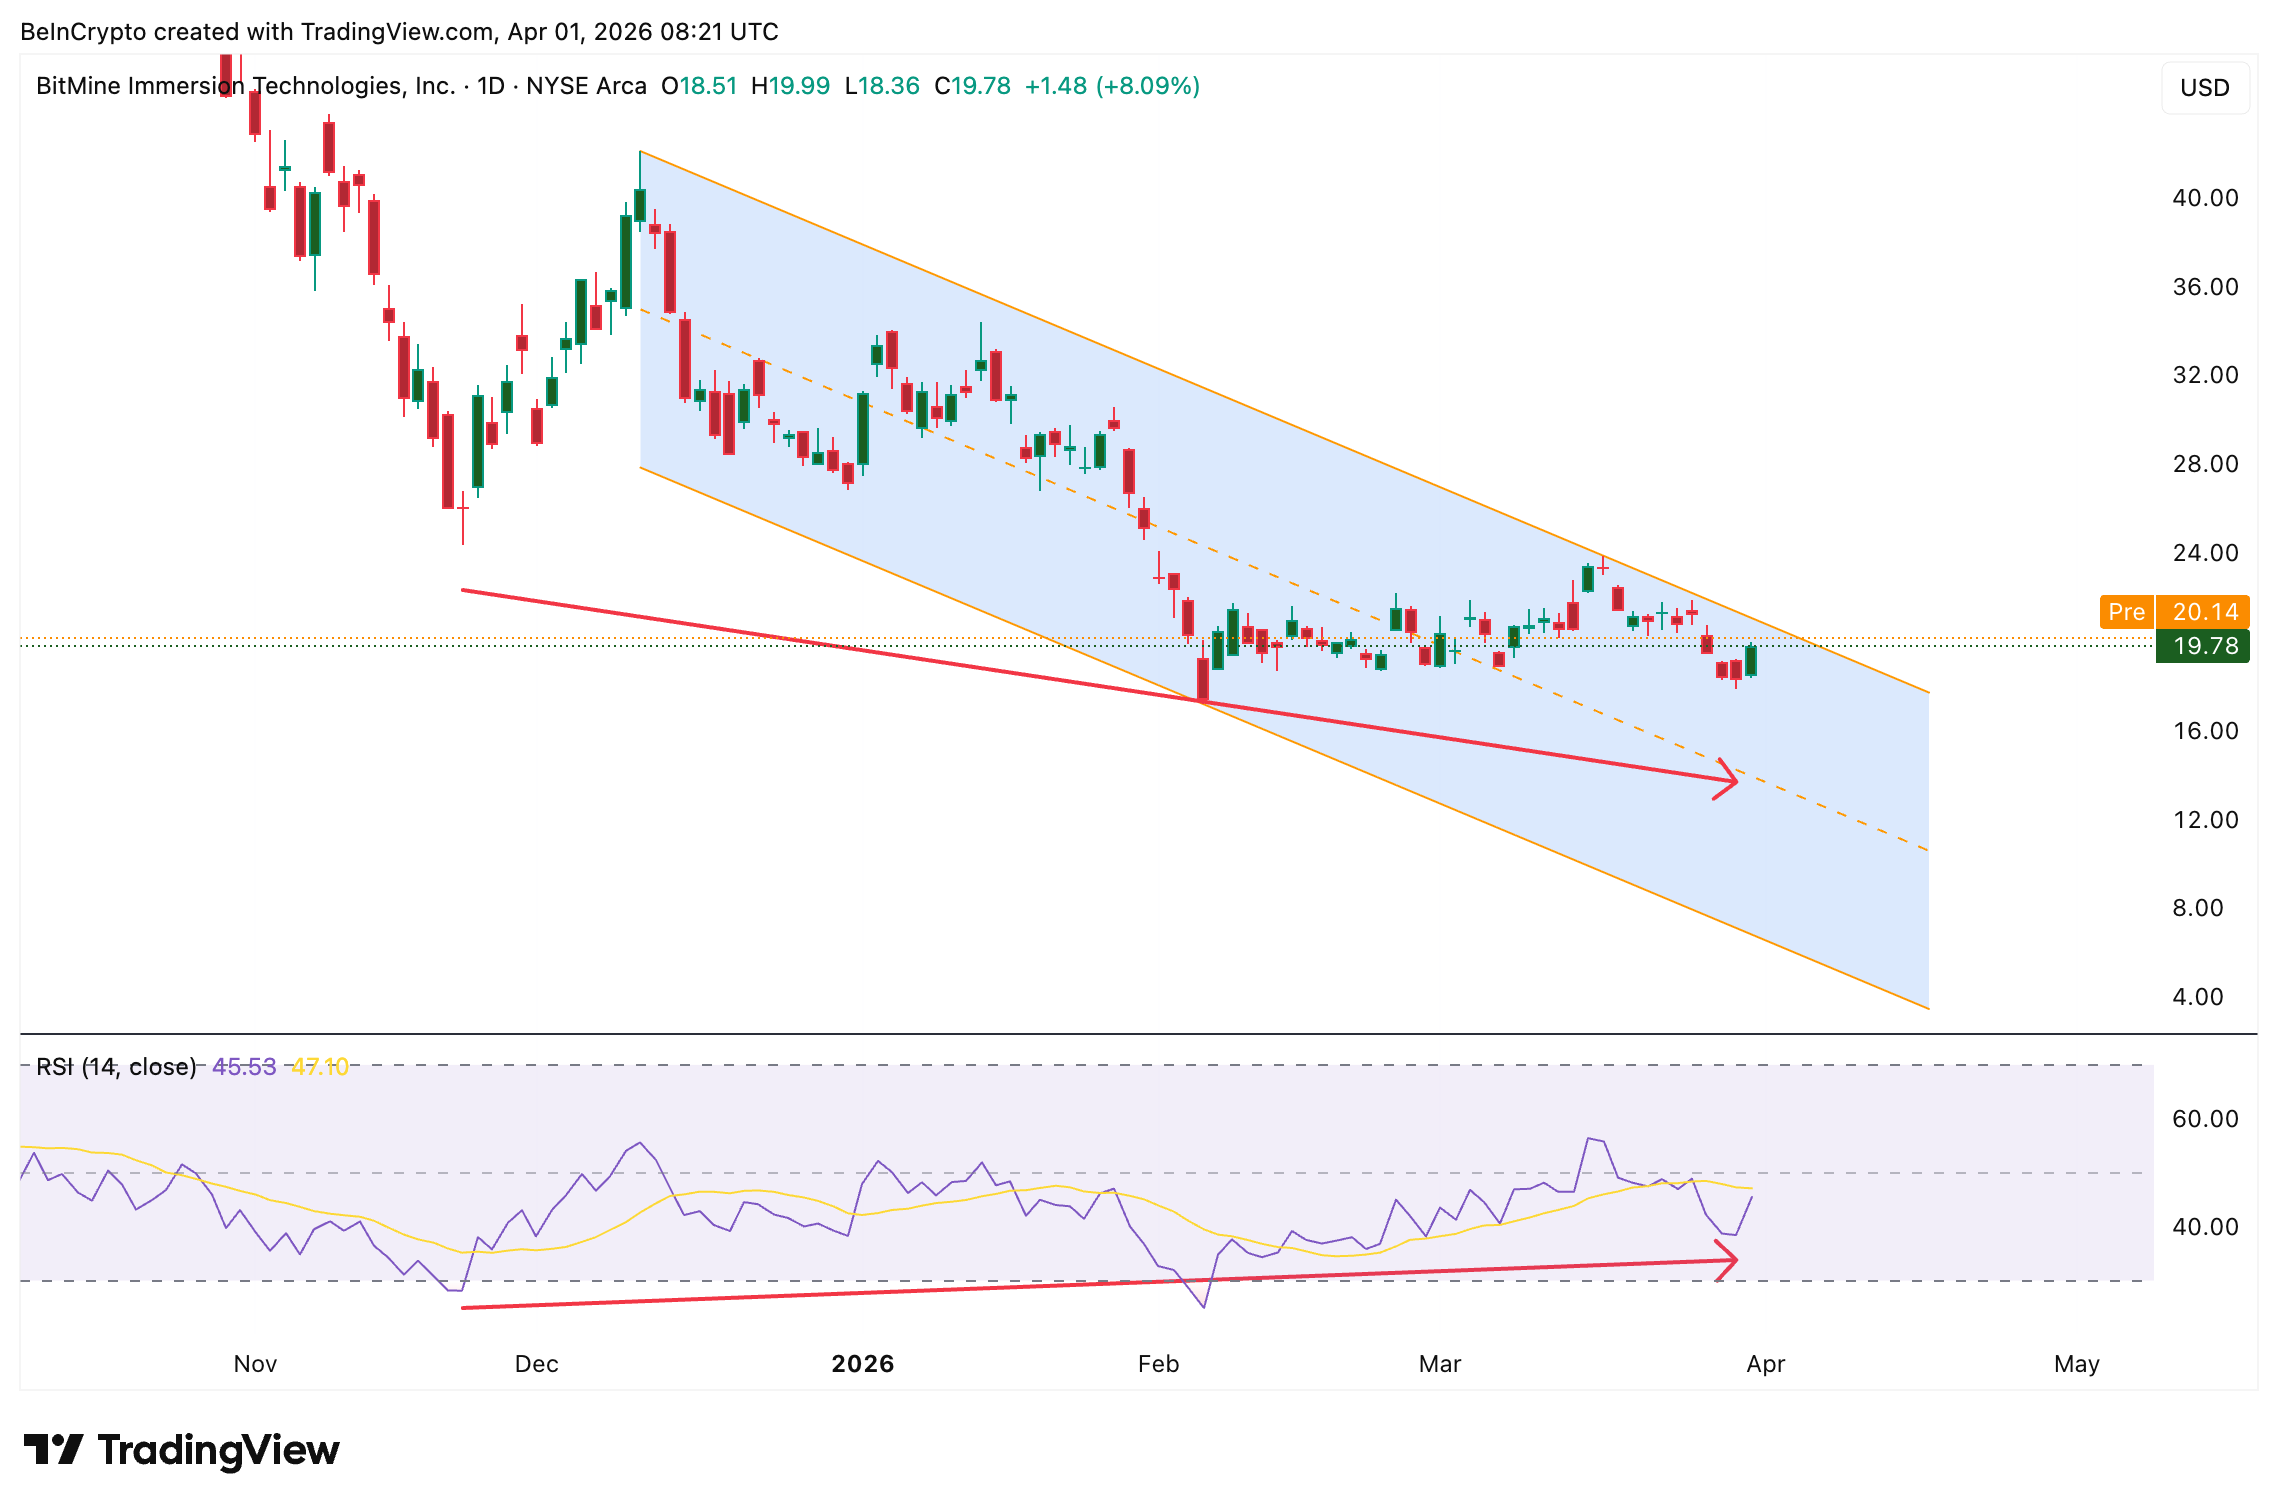
BitMine Immersion Technologies (BMNR) stock jumped 12% on March 31 to close at $19.78, its strongest single-session gain in a while, as a sharp shift in options positioning coincided with B. Riley raising its price target to $33 from $30.
The move pushed BitMine stock close to the upper trendline of a descending channel that has contained the price since early December. However, the nature of the rally and the absence of institutional buying pressure raise the question of whether this attempt will succeed where prior ones failed.
A Short Squeeze Drove the 12% Move, Not Fresh Buying
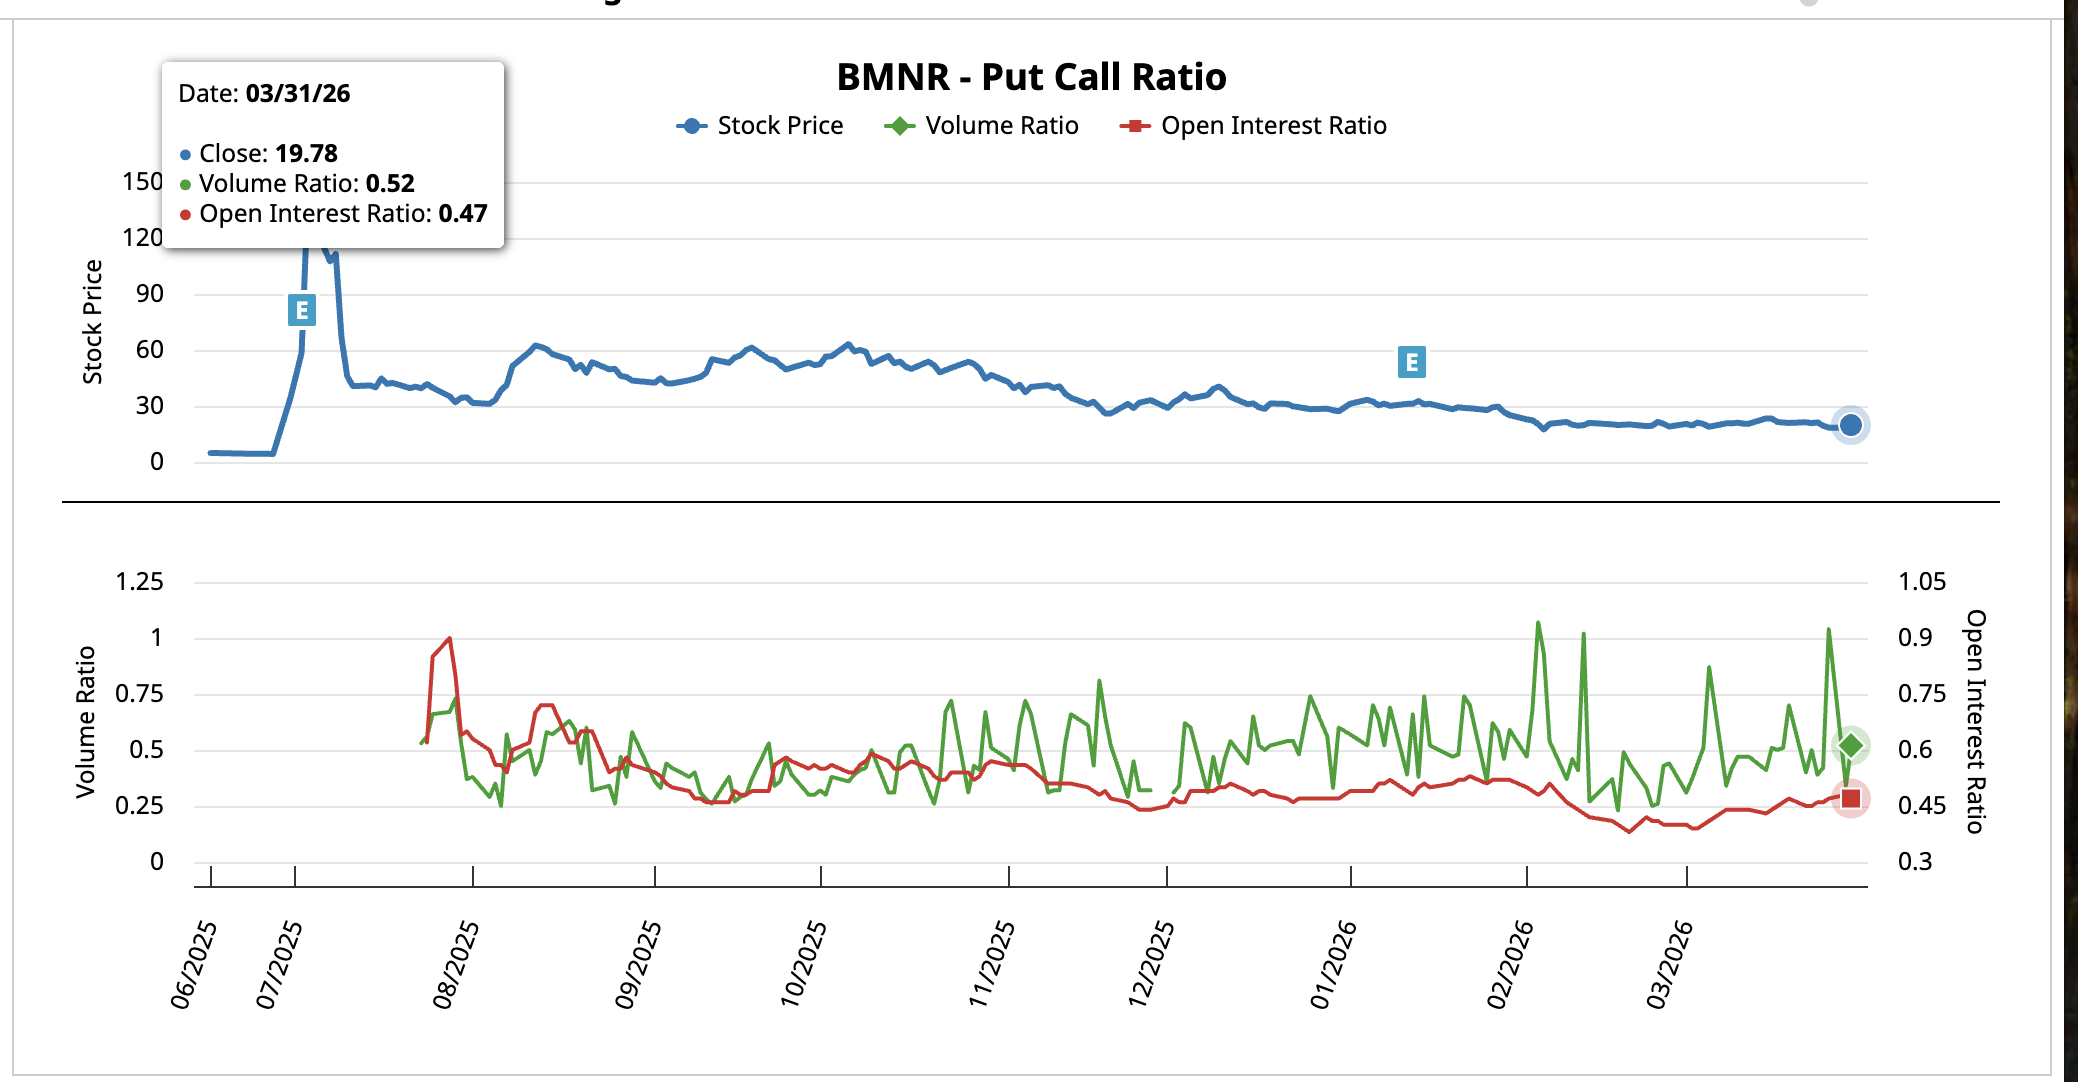
The put-call ratio, which compares bearish put option volume to bullish call option volume, tells the story of what happened between Friday and Monday.
On March 27, the volume ratio spiked to 1.04, meaning put trading exceeded call trading for the first time in weeks. The open interest ratio sat at 0.47. That is aggressive bearish positioning heading into the weekend. By March 31, the volume ratio had collapsed to 0.52 while the open interest ratio remained flat at 0.47.
Want more insights like this? Sign up for Editor Harsh Notariya’s Daily Crypto Newsletter here.
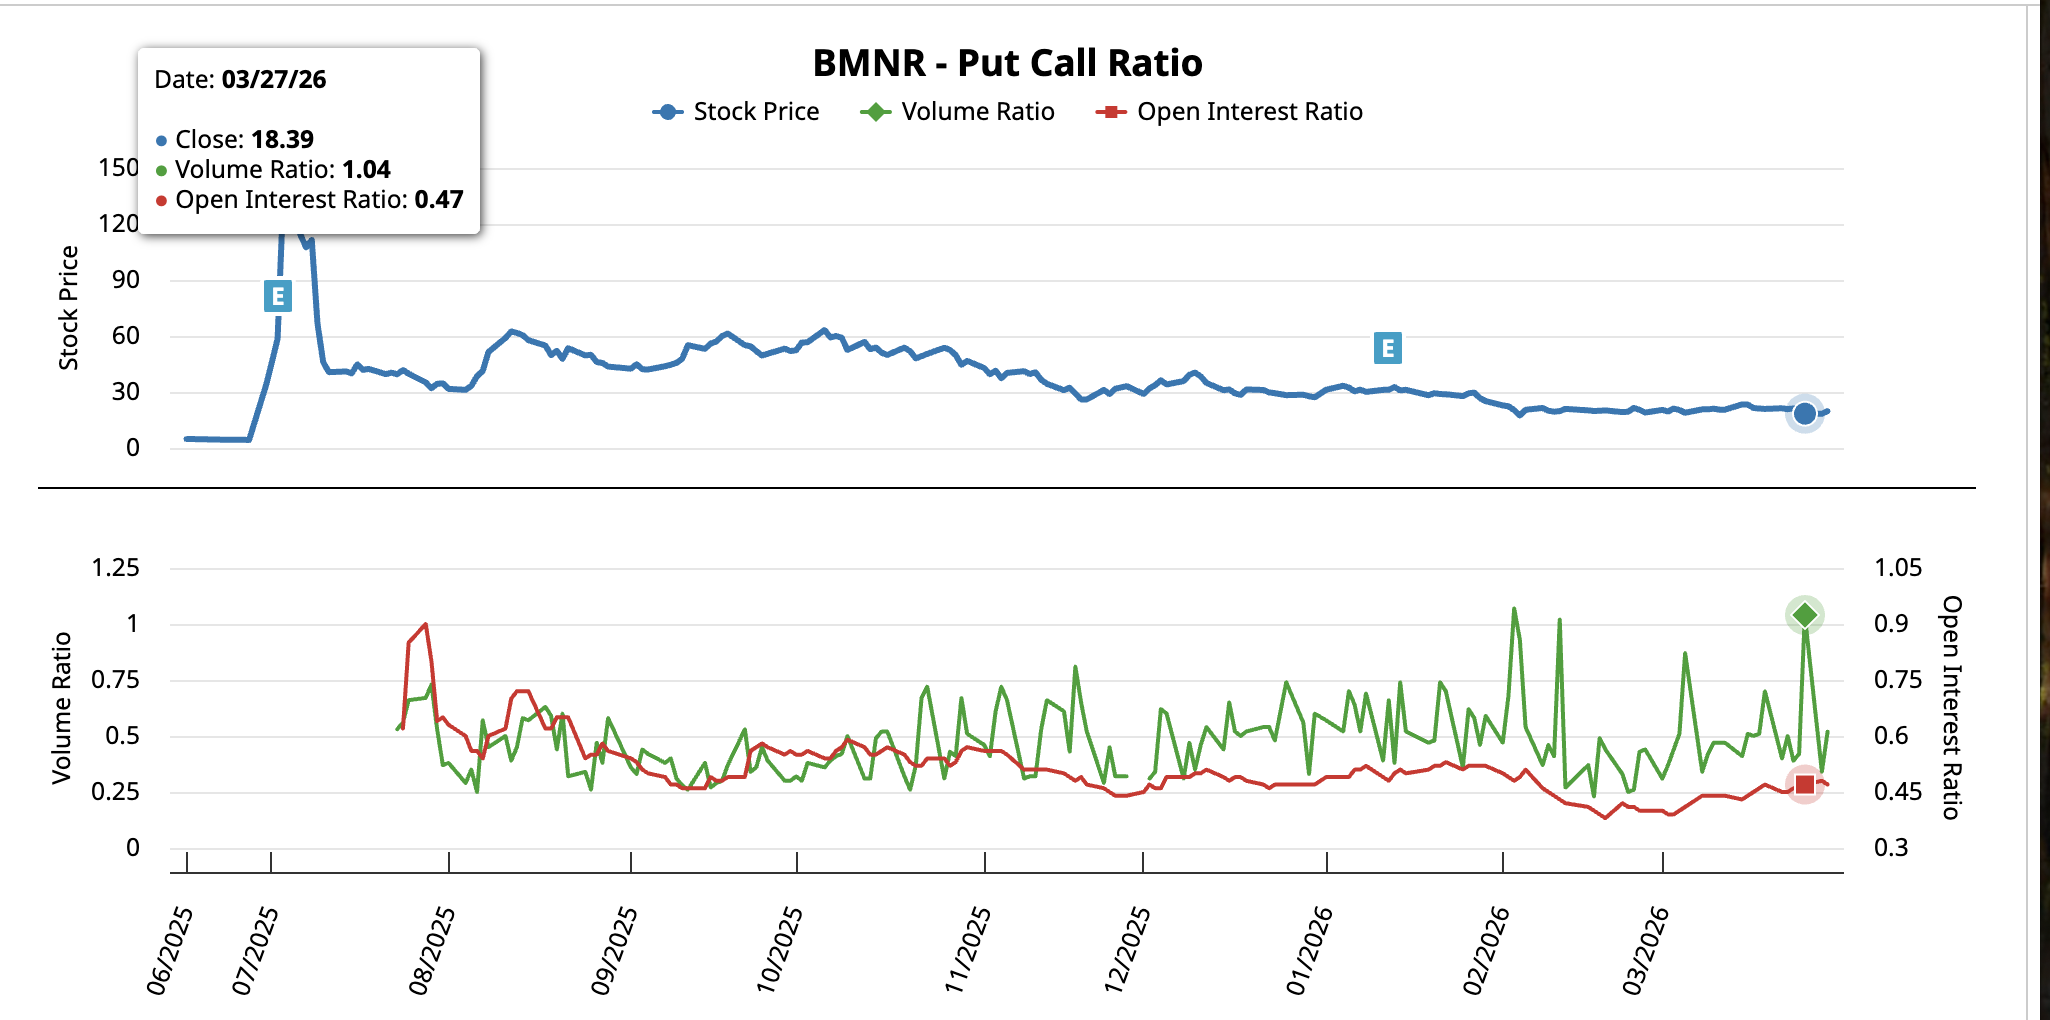
The unchanged open interest means no significant new positions were opened. The volume ratio collapse means existing bearish bets were being closed. That combination points to a classic short squeeze where traders covering put positions drove the BMNR stock price higher rather than new buyers entering with fresh conviction.
If the put-call ratio now rises again alongside rising open interest, it would signal new bearish positions being opened against the rally, which could stall the move on sentiment. However, the squeeze coincided with a fundamental catalyst that could extend the bounce.
ETH Treasury Growth and B. Riley’s $33 Target Support the Bull Case
BitMine added 71,179 ETH last week, its largest weekly purchase of 2026. That five-week buying streak pushed total holdings to 4.73 million ETH, representing 3.92% of Ethereum’s circulating supply. The company’s total crypto and cash treasury now stands at $10.7 billion, with approximately $177 million in annualized staking revenue.
B. Riley raised its BitMine stock price target to $33 from $30 on March 26, maintaining a Buy rating. The firm cited the launch of MAVAN, BitMine’s institutional-grade Ethereum staking platform, and noted that approximately 67% of holdings are already staked with potential annualized rewards of roughly $285 million at full deployment.
With Ethereum up 3.6% over the past 24 hours, the BitMine stock price has an external tailwind. ETH strength directly benefits BitMine’s treasury valuation and staking revenue outlook.
Yet the Chaikin Money Flow (CMF), a volume-weighted indicator that tracks institutional buying and selling pressure, remains below the zero line on the daily chart. Between February 23 and March 30, CMF trended lower alongside price.
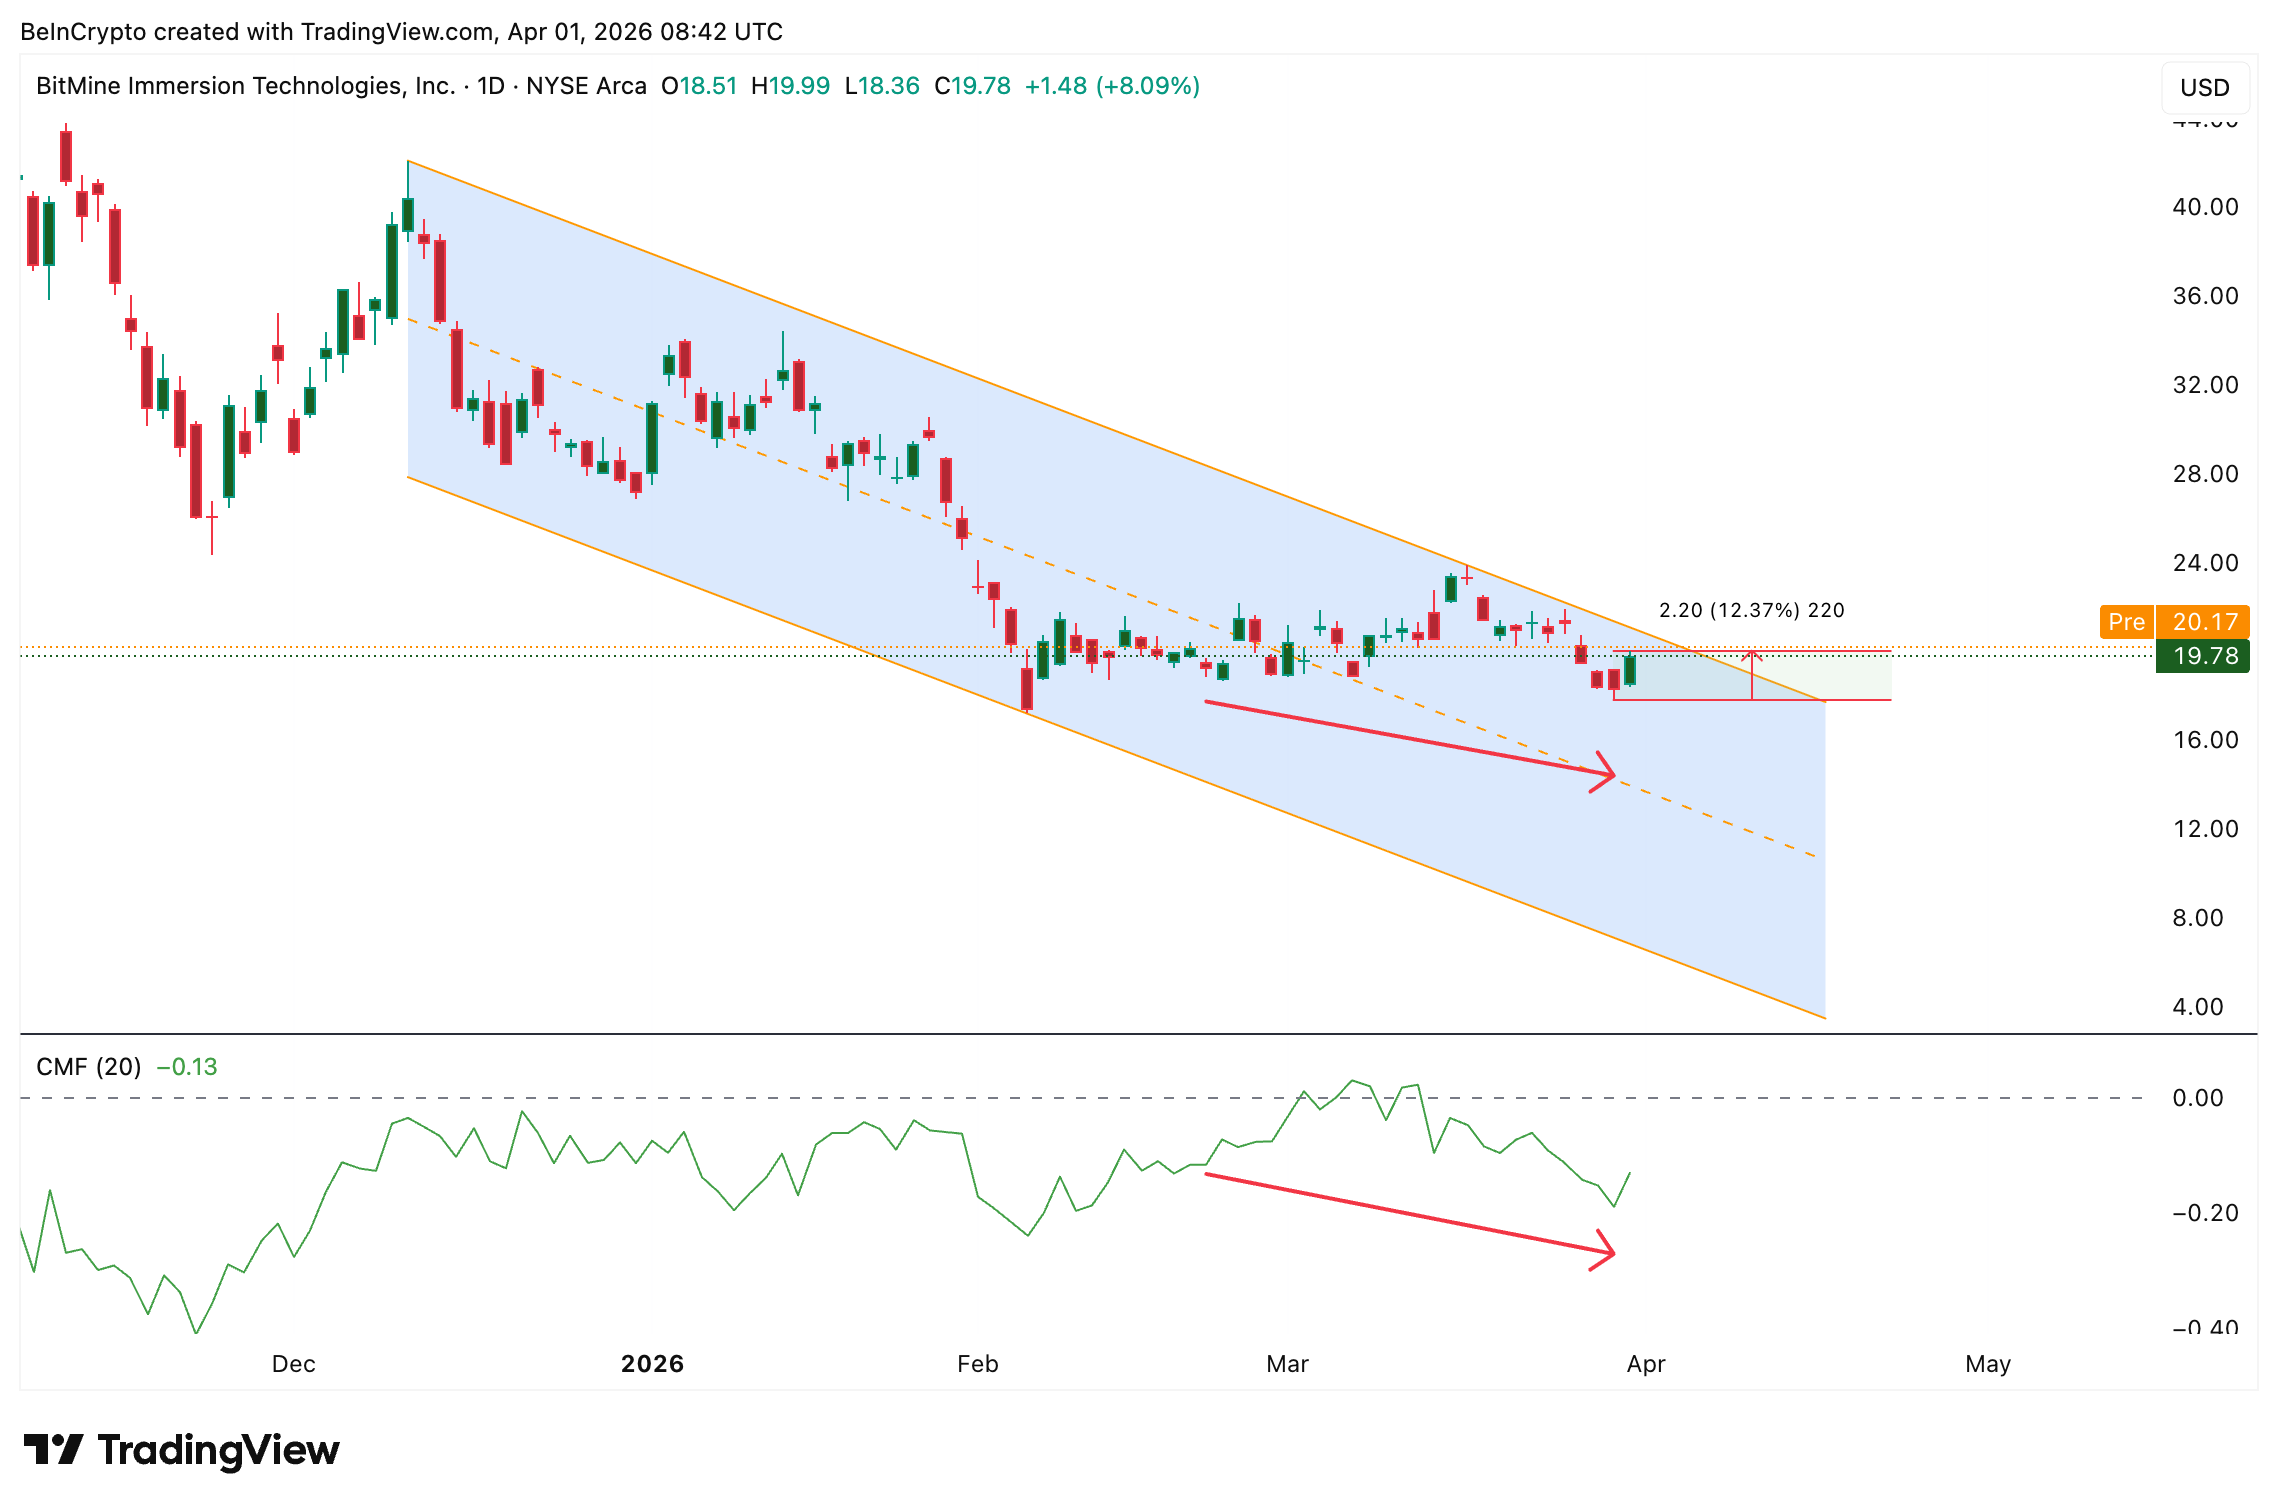
That pattern shows large money has not backed this rally with sustained buying. The bounce is running on short covering and Ethereum momentum rather than direct institutional accumulation into BMNR shares.
BitMine Stock Still Needs $21 to Confirm a Channel Breakout
Despite the short squeeze and fundamental tailwinds, the daily chart shows BitMine stock pressing against the same upper trendline of a descending channel that has rejected every breakout attempt since December. Early January and mid-March also saw a failed attempt out of this 4-month trap.
A bullish divergence on the Relative Strength Index (RSI), a momentum indicator, does support the case for a broader reversal now. Between November 21 and March 30, price trended lower while RSI printed a higher low. That divergence suggests selling momentum is weakening even as price continued to fall. Combined with the Ethereum tailwind and MAVAN catalyst, it gives bulls a technical reason to stay engaged.
However, a daily close above $21.22 (the $21 zone) is needed to confirm that the upper trendline has broken. That level aligns with the 0.5 Fibonacci level and would represent a 7% move from the current close. A push above $22.01 would strengthen the breakout case and open a path toward $24.56 and potentially $28.69. Beyond that sits B. Riley’s upgraded target.
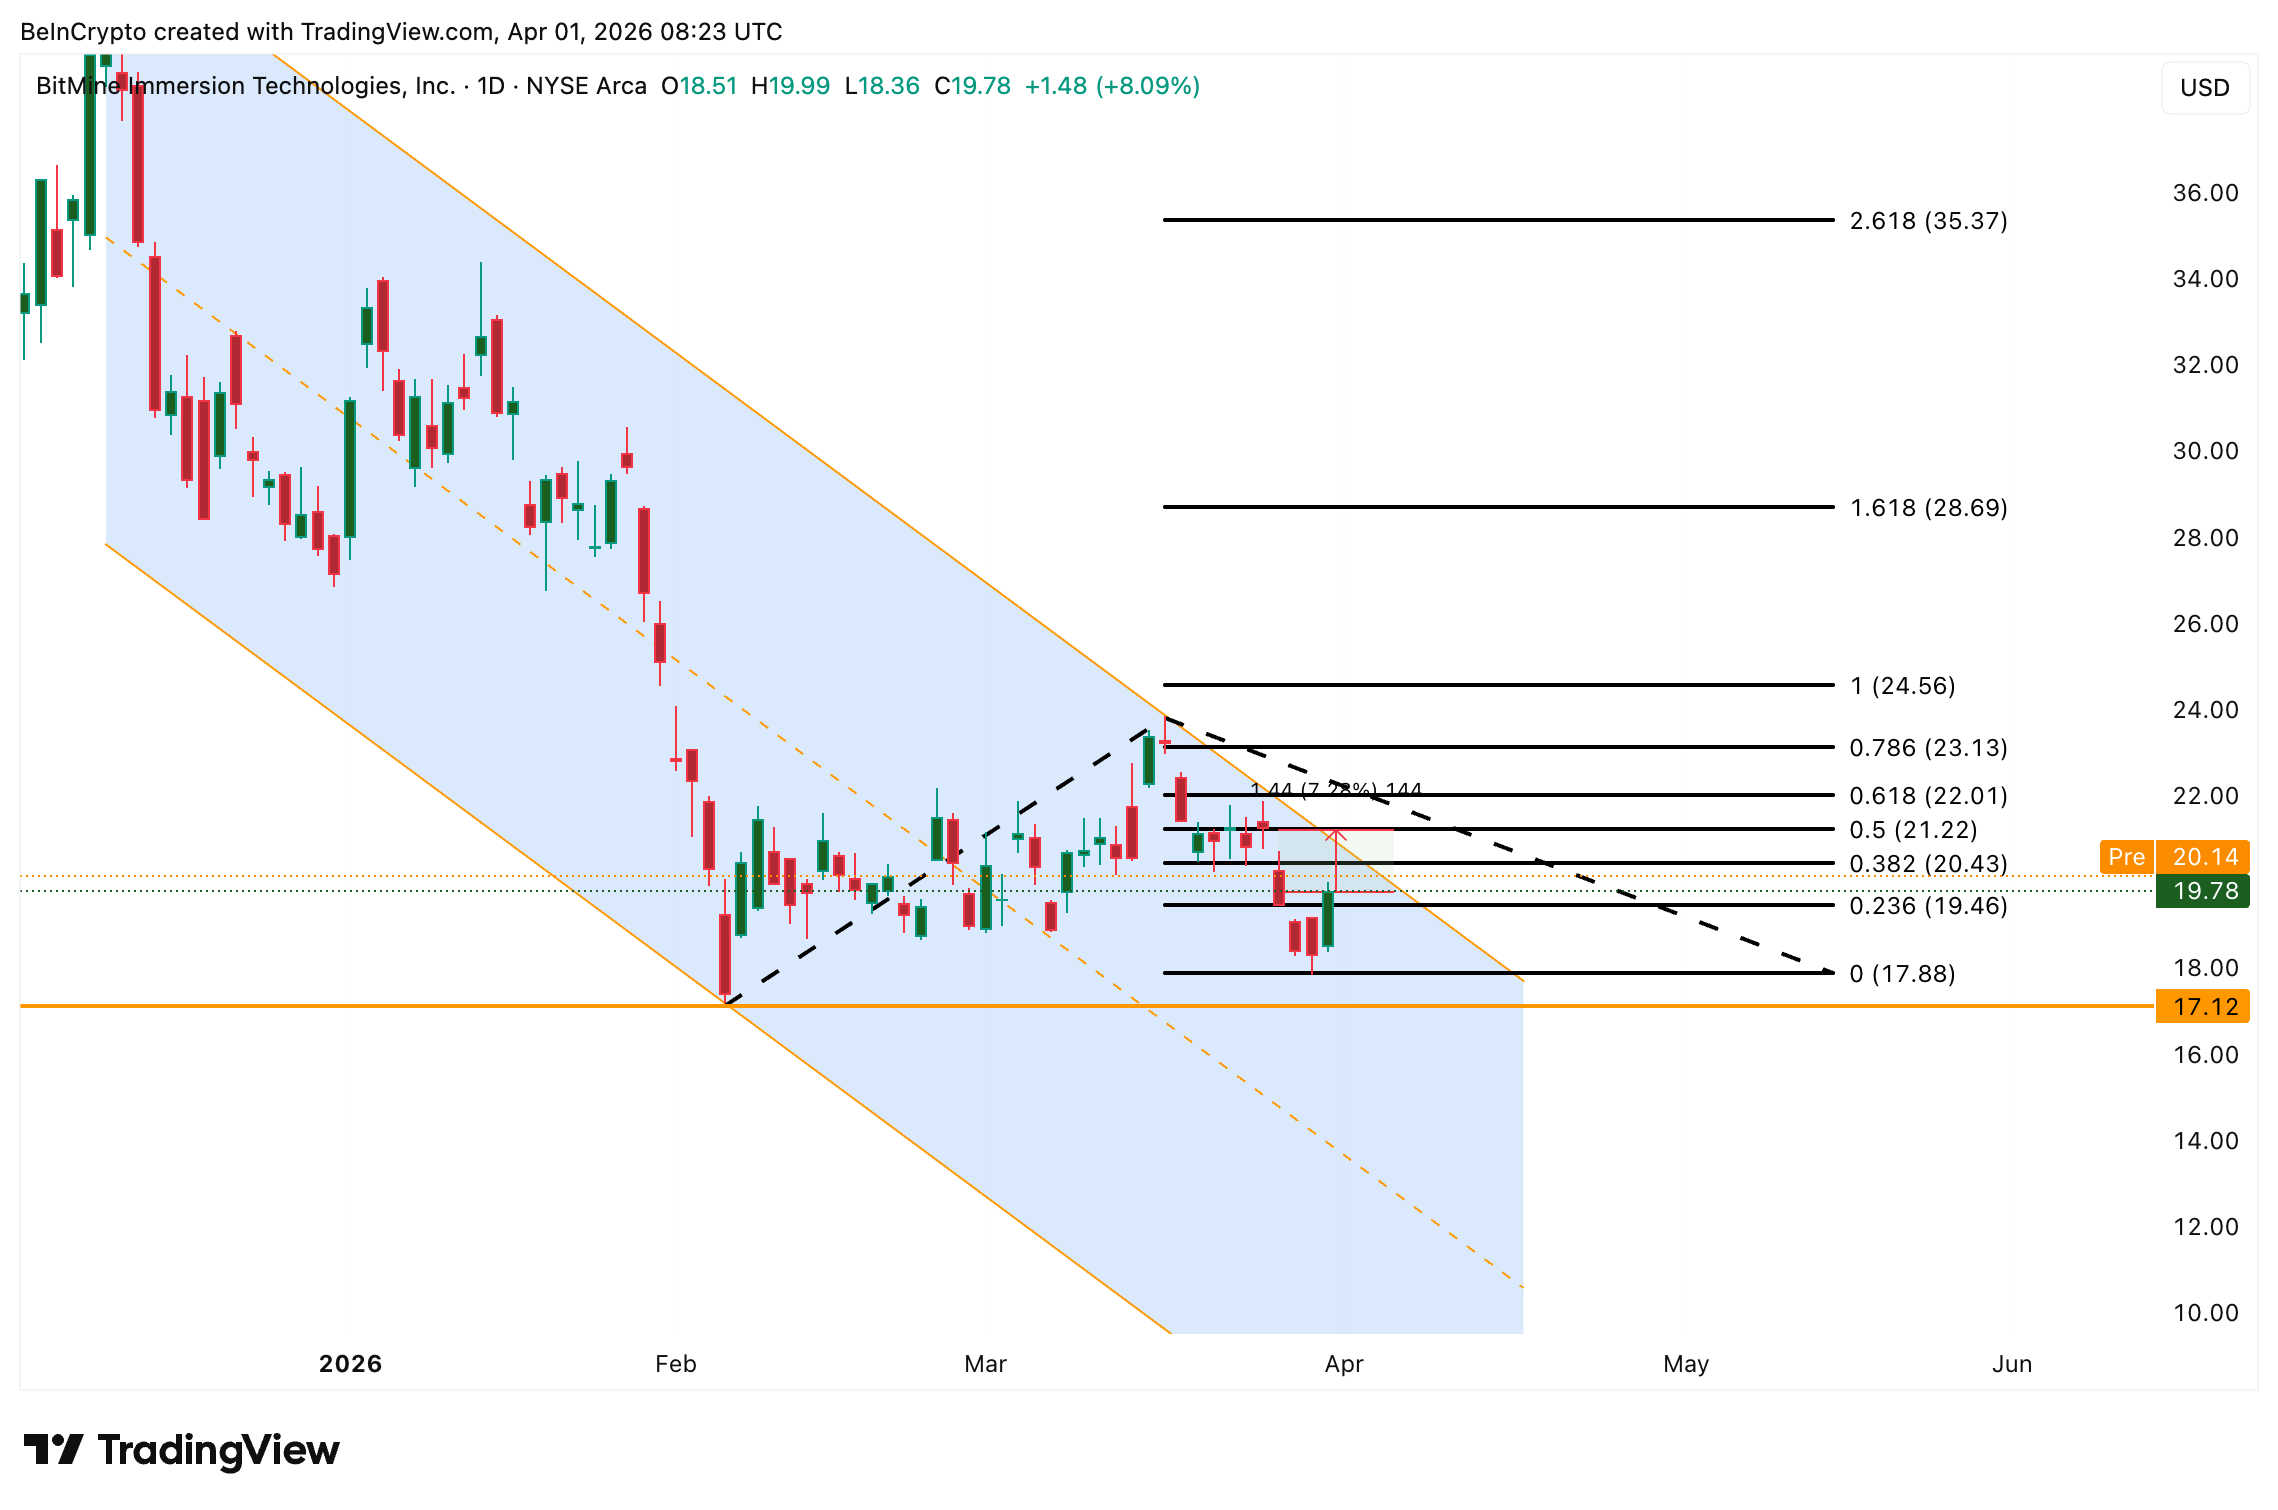
On the downside, failure to hold $19.46 would signal that the squeeze has exhausted itself. A close below $17.88 reopens the lower channel for BMNR stock and puts the $17.12 support at risk.
The $21 zone now separates a confirmed channel breakout fueled by ETH momentum and MAVAN staking revenue from another failed trendline rejection that sends BitMine stock price back toward $17.88.
The post BitMine Stock Gets a Bullish Upgrade, but a 4-Month Trap Still Holds appeared first on BeInCrypto.
Key points:
-
Buyers will have to sustain Bitcoin above $69,000 to gain the upper hand in the short term.
-
Select major altcoins may break above their near-term resistance, signaling buying at lower levels.
Bitcoin (BTC) is facing resistance at $69,000, but the bulls continue to exert pressure. A minor positive in favor of the bulls is that the US spot BTC exchange-traded funds have recorded $186.9 million in inflows this week, according to Farside Investors data.
Is this a good level to buy BTC, or could it fall further? That’s a question troubling investors. Alphractal founder Joao Wedson said in a post on X that BTC’s previous market cycles suggest a historical bottom may form “in late September or early October 2026.”

Veteran trader Peter Brandt also believes that BTC could bottom in September or October. Brandt told Cointelegraph that a complete recovery to a new all-time high may happen only by the second quarter of 2027 but he added that it “is all guesswork.”
Could BTC and select major altcoins rise above their overhead resistance levels? Let’s analyze the charts of the top 10 cryptocurrencies to find out.
Bitcoin price prediction
Buyers are attempting to sustain BTC above the moving averages, indicating solid buying at lower levels.

If they succeed, the BTC/USDT pair may remain inside the bullish ascending triangle pattern. Buyers will have to thrust the BTC price above the $76,000 level to seize control. The pair may then surge to the $84,000 level.
This positive view will be negated in the near term if the BTC price turns down and breaks below the $65,000 level. That will invalidate the positive setup, resulting in long liquidation. The pair may then tumble to the $62,500 to $60,000 support zone.
Ether price prediction
Ether (ETH) closed above the 20-day exponential moving average ($2,085) on Tuesday, and the bulls are attempting to push the price to the $2,200 overhead resistance.

If buyers overcome the barrier at $2,200, the ETH/USDT pair is expected to pick up momentum and rise to $2,400. Sellers will attempt to vigorously defend the $2,400 level, as a close above it opens the gates for a rally to the $3,050 level.
Time is running out for the bears. They will have to quickly pull the price below the $1,916 level to stay in the game. If they do that, the ETH price may plummet to the critical $1,750 support.
BNB price prediction
Buyers are attempting to push BNB (BNB) above the moving averages, but the bears have held their ground.

Sellers will strive to pull the BNB price below the immediate support at $596. If they manage to do that, the BNB/USDT pair may slip to the vital support at $570. Buyers are expected to defend the $570 level with all their might, as a close below it signals the resumption of the downtrend. The next stop on the downside may be $500.
Alternatively, a close above the moving averages may push the price to the stiff overhead resistance of $687. A close above the $687 level will be the first sign of strength. The pair may then march to $730 and thereafter to $790.
XRP price prediction
XRP (XRP) is trying to form a base near the $1.29 level, but the bulls are struggling to push and maintain the price above the moving averages.

That suggests the bears have kept up the pressure. If the XRP price turns down and breaks below the $1.27 level, it signals that bears have overpowered the bulls. The XRP/USDT pair may then decline to the $1.11 level.
On the contrary, a break above the moving averages indicates that the bulls are back in the game. The pair may rise to the breakdown level of $1.61 and then to the downtrend line. A close above the downtrend line signals a potential trend change.
Solana price prediction
Solana (SOL) is attempting to form a floor at the $76 level, but the relief rally is facing stiff resistance at the moving averages.

The flattish moving averages and the relative strength index just below the midpoint do not give a clear advantage either to the bulls or the bears. If the price breaks above the moving averages, the bulls will endeavor to push the SOL/USDT pair above the $95 resistance. If they succeed, the rally may extend to the $117 level.
Contrarily, if the SOL price turns down sharply from the $95 level, it suggests that the range-bound action may continue for a while. Sellers will be back in command on a close below the $76 level.
Dogecoin price prediction
Dogecoin (DOGE) remains stuck between the moving averages and the critical $0.09 support, but the tight range trading is unlikely to continue for long.

If buyers thrust the DOGE price above the moving averages, the relief rally may reach $0.10 and then the $0.12 resistance. Sellers are expected to fiercely defend the $0.12 level. If the price turns down from the overhead resistance, the DOGE/USDT pair may consolidate between $0.09 and $0.12 for a few more days.
Sellers will seize control on a close below the $0.09 level. The pair may then sink to the Feb. 6 low of $0.08 and eventually to the $0.06 level.
Hyperliquid price prediction
Hyperliquid (HYPE) fell below the breakout level of $36.77 on Tuesday, but the bears are struggling to sustain the lower levels.

The bulls are attempting to make a comeback by swiftly pushing the HYPE price back above the 20-day EMA ($37.57). If they can pull it off, the HYPE/USDT pair may rise to $41.59 and subsequently to the $43.76 level. Sellers will attempt to halt the up move at $43.76, but if the bulls prevail, the pair may climb to $50.
This positive view will be invalidated in the near term if the price turns down and breaks below the 50-day simple moving average ($33.97). That suggests the market has rejected the break above the $36.77 level.
Related: Strategy set to resume buying Bitcoin via STRC: Will BTC price hit $80K?
Cardano price prediction
Cardano (ADA) is facing resistance at the $0.25 level, but a positive sign is that the bulls have not ceded ground to the bears.

Buyers will attempt to overcome the barrier at the moving averages. If they do that, the ADA/USDT pair may reach the downtrend line, which is a crucial resistance to watch out for. A close above the downtrend line signals a potential short-term trend change.
Sellers are likely to have other plans. They will attempt to defend the moving averages and pull the ADA price below the $0.23 level. If that happens, the pair may slide to the Feb. 6 low of $0.22.
Bitcoin Cash price prediction
Bitcoin Cash (BCH) has been trading between the 50-day SMA ($485) and the $443 support for the past few days.

The failure of the bulls to clear the 50-day SMA suggests that the bears are active at higher levels. Sellers will attempt to strengthen their position by pulling the BCH price below the $443 level. If they manage to do that, the BCH/USDT pair will complete a bearish head-and-shoulders pattern. That opens the doors for a drop to the $375 level.
Instead, if buyers drive the price above the 50-day SMA, it signals demand at lower levels. The pair may then ascend to the $520 to $540 zone.
Chainlink price prediction
Chainlink (LINK) is facing resistance at the moving averages, but a positive sign is that the bulls have kept up the pressure.

That improves the prospects of a close above the moving averages. If that happens, the LINK price may rally toward the $10 level. Sellers will attempt to defend the $10 level and keep the LINK/USDT pair range-bound for some more time.
The next trending move is expected to begin on a close above $10 or below $8. If buyers pierce the $10 level, the pair may rise to $10.94 and later to the $11.61 level. Alternatively, a drop below the $8 support may sink the price to $7.15 and then to $6.
This article does not contain investment advice or recommendations. Every investment and trading move involves risk, and readers should conduct their own research when making a decision. While we strive to provide accurate and timely information, Cointelegraph does not guarantee the accuracy, completeness, or reliability of any information in this article. This article may contain forward-looking statements that are subject to risks and uncertainties. Cointelegraph will not be liable for any loss or damage arising from your reliance on this information.
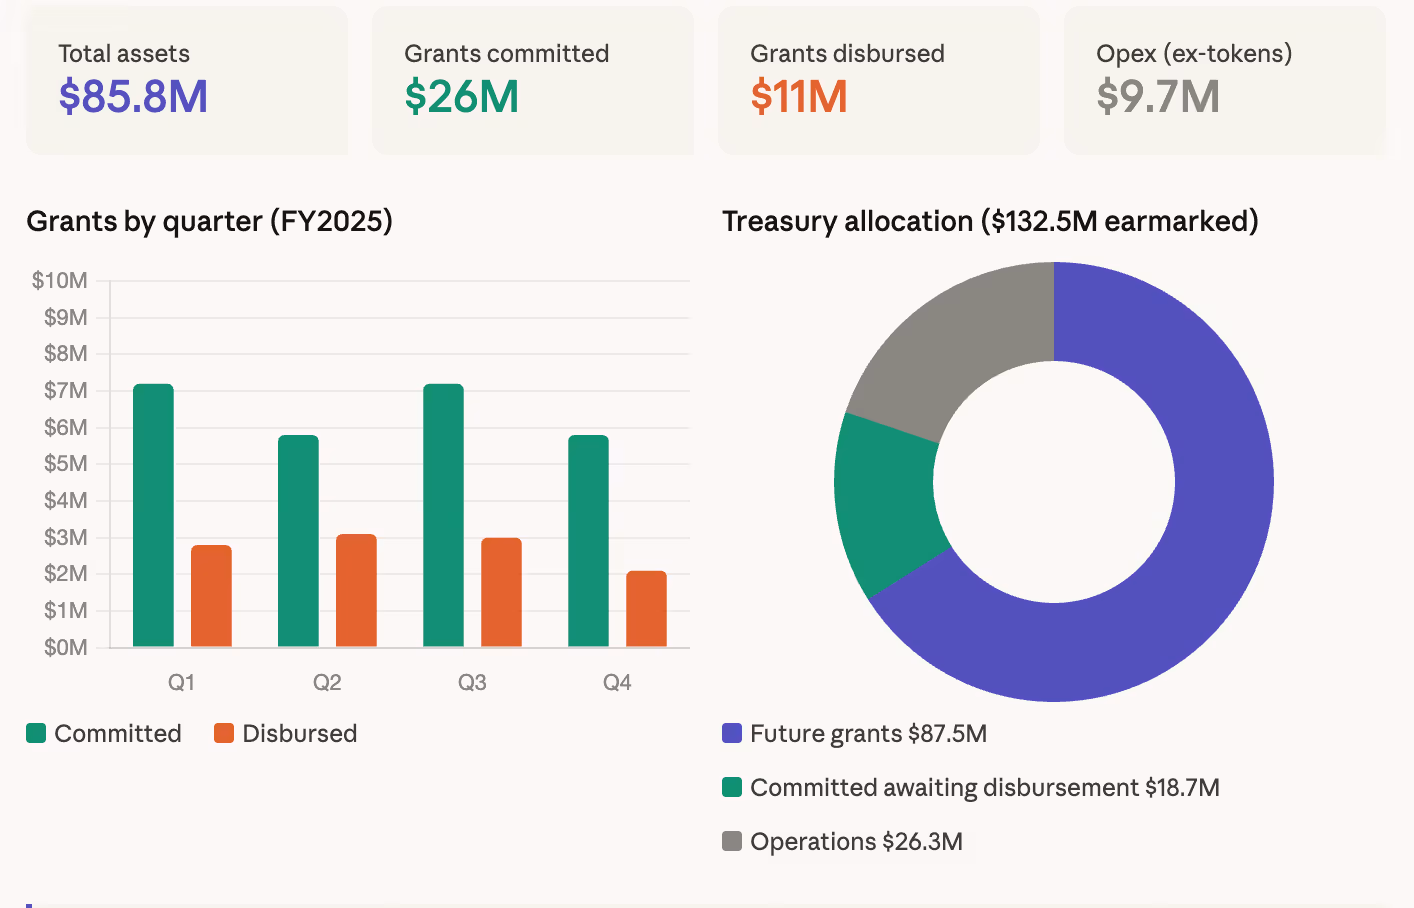
The Uniswap Foundation held $85.8 million in total assets at the end of 2025, split between $49.9 million in cash and stablecoins, 15.1 million UNI tokens, and 240 ETH, according to unaudited summary financials published Tuesday.
The foundation committed $26 million in new grants during 2025 and disbursed $11 million against prior commitments. In Q4 alone, $5.8 million in new grants were committed and $2.1 million disbursed. Operating expenses for the full year came to $9.7 million, excluding employee token awards of 450,000 UNI.
On the revenue side, the foundation received 20.3 million UNI, worth roughly $114 million at year-end prices, from the Uniswap Treasury through the Uniswap Unleashed governance proposal. It also earned $1.7 million in interest on fiat holdings.
The numbers reflect the foundation’s financial position before the UNIfication proposal, approved by governance on Dec. 26, which restructures the relationship between the foundation and the broader Uniswap ecosystem. A new legal entity called DUNI was formed as part of that process.
Of the total funds, $106.2 million was earmarked for grants ($87.5 million to be committed, $18.7 million reserved for previously committed grants awaiting disbursement) and $26.3 million for operations and employee token awards.
The projected runway extended through January 2027, though the foundation said that timeline will be updated in its Q1 2026 report to reflect the post-UNIfication organizational changes.

The report lands alongside a year of significant protocol milestones, including the launch of Uniswap v4, which introduced hooks and a programmable architecture for on-chain liquidity, and Unichain, a dedicated chain for high-performance DeFi applications. The foundation said more than 1,500 developers onboarded to v4 during the year.

eToro wins New York BitLicense, expands crypto access to 48 US states
Justin Bieber gives sneak preview of upcoming Coachella performance

Owning 10,000 XRP Won’t Be Possible After 2026… New Rich List Data Reveals How Rare It Really Is!

Smart energy pays enters the US market, targeting scalable financial infrastructure

Why Israel is blocking foreign journalists from entering

Bitcoin: We’re Entering The Most Dangerous Phase
Owning 10,000 XRP Won’t Be Possible After 2026… New Rich List Data Reveals How Rare It Really Is!

Wealth Isn’t Luck: Master the System, Build Your Financial Future

Warren Buffett: Why Big Money Is Made in Patience, Not Action
-

 News Videos7 days ago
Parliament publishes latest register of MPs’ financial interests
-

 Business6 days ago
Instagram, YouTube Found Responsible for Teen’s Mental Health Struggle in Historic Ruling
-
 Tech6 days ago
Intercom’s new post-trained Fin Apex 1.0 beats GPT-5.4 and Claude Sonnet 4.6 at customer service resolutions
-

 NewsBeat5 days ago
The Story hosts event on Durham’s historic registers
-

 Sports5 days ago
Sweet Sixteen Game Thread: Tide vs Michigan
-
Entertainment2 days ago
Fans slam 'heartbreaking' Barbie Dream Fest convention debacle with 'cardboard cutout' experience
-
 Entertainment4 days ago
Lana Del Rey Celebrates Her Husband’s 51st Birthday In New Post
-
Crypto World1 day ago
Dems press CFTC, ethics board on prediction-market insider trades
-

 Sports1 day ago
Tallest college basketball player ever, standing at 7-foot-9, entering transfer portal
-

 Tech3 days ago
The Pixel 10a doesn’t have a camera bump, and it’s great
-

 Entertainment7 days ago
HBO’s Harry Potter Series Will Definitely Fail For One Big Reason, And It’s Not J.K. Rowling Or Snape
-

 Tech2 days ago
EE TV is using AI to help you find something to watch
-

 Crypto World2 days ago
U.S. rule change may open trillions in 401(k) funds to crypto
-

 Tech1 day ago
How to back up your iPhone & iPad to your Mac before something goes wrong
-

 Fashion6 days ago
En Vogue in Brown Leather and Tailored Neutrals by Atelier Savoir, Styled by J Bolin
-

 Politics2 days ago
Should Trump Be Scared Strait?
-

 Tech2 days ago
Flipsnack and the shift toward motion-first business content with living visuals
-

 Fashion6 days ago
What Are Your Favorite T-Shirts for the Weekend?
-

 Fashion5 days ago
Weekly News Update, 3.27.26 – Corporette.com
-

 Tech2 days ago
Apple will hide your email address from apps and websites, but not cops
You must be logged in to post a comment Login