
Crypto World
Hyperliquid Emerges Winner Amid US Iran Geopolitcal Tensions

Hyperliquid emerged as a rare winner amid the sudden escalation of military hostilities in the Middle East between the US, Israel, and Iran.
This weekend, the exchange saw a surge in commodities-focused derivatives trading, with open interest for these assets reaching an all-time high of more than $1.1 billion.
Hyperliquid Rallies 13% as US and Iran Tensions Roil Markets
The uptrend can be attributed to traders seeking to hedge geopolitical risks while traditional financial markets were closed for the weekend.
As a result, market participants pivoted to the blockchain-based platform to trade synthetic perpetual futures contracts tied to oil, gold, silver, and US equities.
This continuous trading was facilitated by HyperLiquid Improvement Proposal 3, or HIP-3, an upgrade implemented last year.
HIP-3 allows developers to deploy permissionless perpetual futures markets for any asset with a reliable public price feed, provided the creator stakes 500,000 of the platform’s native HYPE tokens.
Driven by the weekend volatility, HIP-3’s open interest eclipsed its previous record of $1.06 billion.
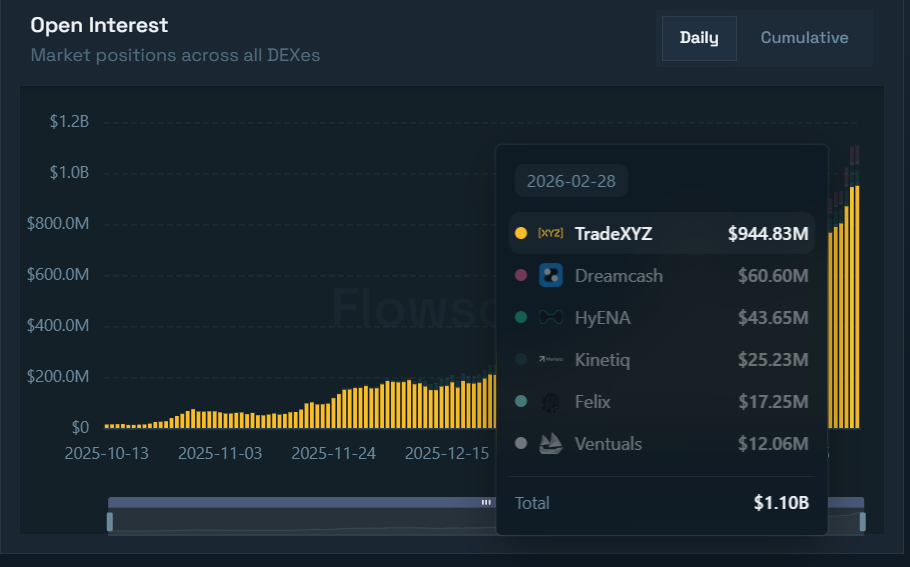
Overall, the broader Hyperliquid platform has accumulated nearly $5.5 billion in total open interest, securing an estimated $1.06 million in protocol earnings over a 24-hour period, according to data from DeFiLlama.
Additionally, data provider Messari reported that HIP-3 markets have generated $4.4 billion in weekend trading volume in February alone.
The platform’s ability to capture traditional market volume drew the attention of prominent industry figures. Arthur Hayes, co-founder of the crypto exchange BitMEX, highlighted the structural shift on the social media platform X.
“Where price discovery happens when TradExchanges sleep…It’s the weekend, [stuff’s] going down, TradExchanges are closed, but Hyperliquid is open for business,” Hayes wrote.
However, the platform’s lack of compliance guardrails could introduce substantial legal hurdles in the future.
Offering synthetic US equities to retail investors without “know your customer” (KYC) protocols or a registered broker-dealer license poses significant regulatory risks.
These practices could draw future scrutiny from the Securities and Exchange Commission and the Commodity Futures Trading Commission
Despite this looming threat, the platform’s native token responded positively to the weekend influx.
BeInCrypto data show that HYPE’s price rose 13% over the last 24 hours, trading above $30 as of press time. Notably, this makes it the best-performing asset among the top 20 cryptocurrencies by market capitalization.


Saudi Arabia’s energy ministry confirmed on April 12 that it had restored full pumping capacity on its East-West pipeline, returning throughput to approximately 7 million barrels per day after attacks earlier this month cut output.
The recovery comes as US-Iran peace talks in Islamabad collapsed without an agreement, leaving energy markets facing renewed uncertainty ahead of Monday’s open.
What Happened to Saudi Oil Infrastructure
Recent attacks during the US-Iran war disrupted an estimated 600,000 barrels per day of Saudi production. The Manifa field lost approximately 300,000 bpd, and the Khurais field saw a similar reduction. Moreover, it also cut East-West pipeline throughput by 700,000 bpd.
“An official source at the Ministry of Energy stated that important energy facilities in the Kingdom have recently been subjected to multiple attacks, including oil and gas production, transportation, and refining facilities, as well as petrochemical facilities and the electricity sector in Riyadh, the Eastern Province, and Yanbu Industrial City,” the officials wrote.
Follow us on X to get the latest news as it happens
The energy ministry stopped short of naming the attacker directly, though Riyadh has been intercepting waves of Iranian drones and missiles throughout the war. JPMorgan analysts estimated the combined damage at roughly 10% of Saudi Arabia’s pre-conflict crude exports, noting it represented a “measurable supply shock.”
In a recent update, the energy ministry said the East–West pipeline and Manifa output have been restored. However, work on the Khurais field is still underway and will be announced upon completion.
“Ministry of Energy announced the success of operational and technical efforts in restoring the full pumping capacity through the East–West pipeline, amounting to approximately seven million barrels per day, and recovering the affected volumes from the Manifa field production of around 300,000 barrels per day, all within a short period of time,” the press release read. “With regard to the Khurais field, work is still ongoing to restore full production capacity, and this will be announced upon completion.”
The ministry added that Aramco’s rapid restoration demonstrated its “high operational resilience and crisis management efficiency.”
US Iran Failed Talks Add Pressure to Monday’s Open
The pipeline fix landed hours after Vice President JD Vance confirmed that 21 hours of negotiations with Iran in Islamabad produced no deal. The two sides are still divided on key issues, including the Strait of Hormuz and Iran’s nuclear program.
The strait normally carries approximately 20% of global seaborne oil. The International Energy Agency has called the disruption the largest supply shock in the history of the global oil market.
Oil prices have surged since the conflict began in late February. The conflict has also rattled food, aluminum, and liquefied natural gas markets.
Saudi Arabia’s partial recovery helps, but it cannot replace the full volume lost from the Hormuz disruption. Monday’s market opening will test whether the pipeline restoration can offset the diplomatic failure in Islamabad.
Subscribe to our YouTube channel to watch leaders and journalists provide expert insights
The post Saudi Arabia Restores Major Oil Pipeline After Recent Attacks, Will Prices Drop? appeared first on BeInCrypto.

Justin Sun, the founder of the Tron ecosystem, has publicly criticized World Liberty Financial (WLFI), a decentralized finance project co-founded by Donald Trump’s sons, over what he describes as opaque and rushed governance processes tied to WLFI’s governance token lock-up. Sun, who says he invested “significant capital” in WLFI as an early backer, pointed to a March governance proposal that would determine how long token holders must stake their voting power, arguing that the move was not conducted with transparency.
“The governance votes cited to justify the above actions were not conducted through fair or transparent procedures. Key information was withheld from voters, meaningful participation was restricted, and outcomes were predetermined.”
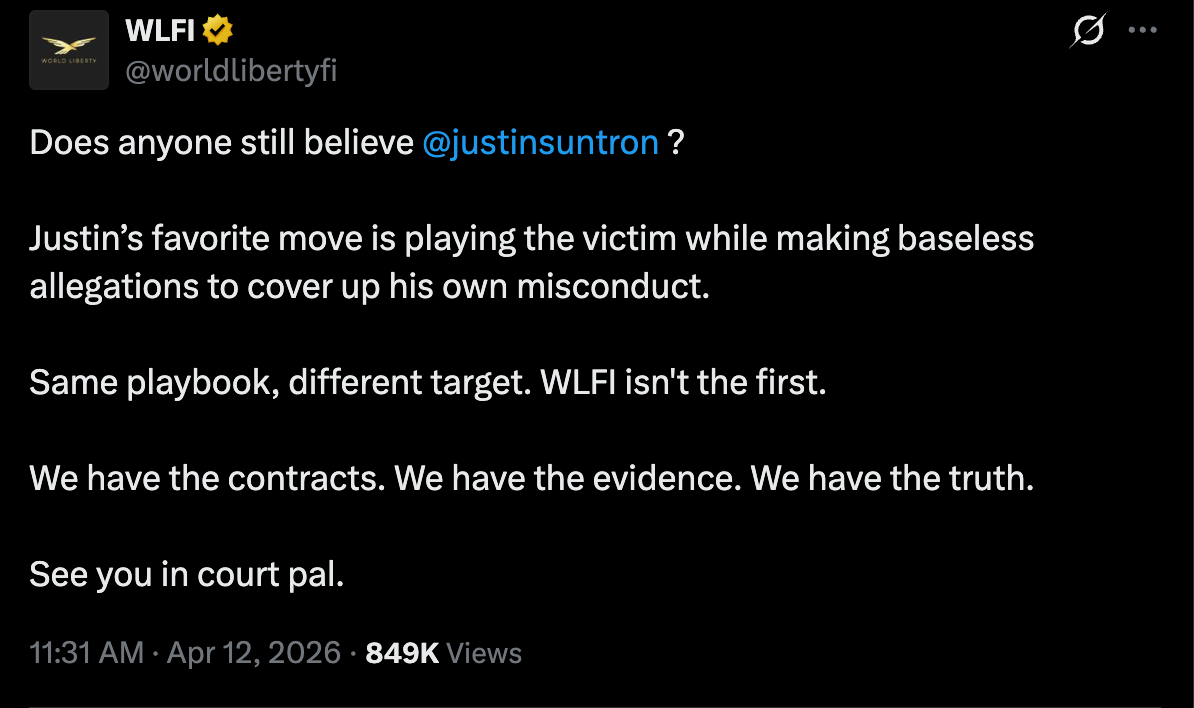
In a Sunday post on X, Sun criticized the process and argued that it failed to deliver fair governance for the WLFI community. World Liberty Financial (WLFI) countered by accusing Sun of playing the victim and making baseless claims, saying it would pursue legal action if necessary to defend its position.
The dispute comes as WLFI faces broader community pushback and scrutiny after confirming that its own governance tokens were used as loan collateral. The move coincided with a rapid decline in WLFI’s token price and renewed attention on Trump-linked crypto ventures amid concerns about governance, transparency, and risk management.
Cointelegraph reached out to World Liberty Financial for comment but did not receive a response by publication time.
Related: World Liberty signals phased WLFI unlock vote after early holder backlash
Key takeaways
- Governance under scrutiny: A March WLFI proposal to set token lock-up periods drew questions after more than 76% of voting tokens were found to originate from 10 wallets, raising transparency concerns about how governance outcomes are determined.
- Token as collateral, price pressure: WLFI disclosed that its token was used as collateral on Dolomite, a DeFi platform, to borrow stablecoins, a move that contributed to the token’s decline to an all-time low near $0.07 and heightened scrutiny of token-backed lending practices.
- Anchor role and ecosystem dynamics: WLFI described itself as an anchor borrower and lender within its own ecosystem, a stance that critics say could create incentive misalignment between token holders and platform governance.
- Public confrontation and risk of legal action: Sun’s criticism hinges on governance transparency, while WLFI has denied the allegations and signaled potential legal action against Sun to defend its position.
- Broader implications for governance in Trump-linked crypto ventures: The episode adds to ongoing debates about governance fairness, disclosure, and risk in projects tied to prominent political figures.
Sun’s critique highlights governance transparency questions
Sun’s public critique centers on a March WLFI governance proposal that intended to set the parameters for lock-up durations of WLFI’s voting tokens. He argues that the voting process did not meet basic standards of transparency or fairness. In his post on X, Sun asserted that the votes cited to justify the action were made under conditions where critical information was withheld, voter participation was constrained, and outcomes appeared predetermined before ballots were cast.
The concern, as Sun framed it, is not merely a procedural quibble but a signal about the broader governance integrity of WLFI. If true, such practices could undermine investor confidence, especially in a project intertwined with high-profile political figures and rapid token-driven voting mechanics. The episode dovetails with prior discussions in the ecosystem about how token-based governance should operate when decision rights directly affect token holders and the value of the treasury or collateral pools.
WLFI’s response to Sun’s comments, however, framed the dispute as a political attack rather than a governance critique. The project’s team described Sun’s allegations as an attempt to deflect attention from his own conduct and declined to engage on the specifics beyond asserting their stance. The exchange underscores a broader risk: when governance is tied to popular personalities or high-visibility founders, accountability mechanisms must be transparent, verifiable, and resilient to reputational cycles that can influence investor behavior.
Token-backed lending, collateral use, and market reaction
The controversy intensified after WLFI confirmed that it used WLFI tokens as collateral in DeFi lending arrangements to generate yields for the platform and its holders. Dolomite, the DeFi protocol involved, has been associated with WLFI’s operational team, including its chief technology officer, Corey Caplan. The arrangement, described by WLFI as part of its broader lending and earning strategy, contributed to a sharp sell-off as market participants weighed the implications of token-backed collateral in a mixed risk environment.
The practical consequence for investors was immediate: the WLFI token slid to an all-time low, with prices hovering around $0.07 at one point amid concerns about token-backed loans and the stability of the underlying collateral framework. The dynamic illustrates a broader tension in crypto markets where token utility and collateralizing power can influence both liquidity and price discipline, particularly when governance overlays are perceived as opaque or compromised.
WLFI has positioned itself as a major supplier and borrower within its own ecosystem, suggesting that its token serves multiple roles — including providing yield, enabling liquidity, and supporting the platform’s financial equilibrium. Critics caution that such centrality could create conflicts of interest between governance priorities and the financial incentives of the token’s largest holders.
The episode also fuels broader public and media scrutiny around Trump-linked crypto ventures, reinforcing existing debates about regulatory exposure and the alignment of incentives in politically connected blockchain projects. While supporters argue that these projects push innovation and capital formation, detractors warn of misaligned incentives, potential conflicts of interest, and governance fragility in high-profile launches.
Cointelegraph has documented prior coverage of WLFI and related backlash, including discussions about token unlocks and investor backlash from early holders. Readers can explore those pieces for context on how community sentiment has evolved as governance-related decisions intersect with market dynamics.
What this means for investors and builders
From an investment perspective, the WLFI episode underscores the importance of governance transparency, robust disclosure, and clear stake-lock mechanisms that are not easily gamed by coordinated groups of token holders. For builders and protocols, the incident highlights the need for open auditability of governance proposal sources, independent verification of vote origins, and explicit, auditable procedures for how voting outcomes are determined. In a field where leverage and collateral practices can directly affect token value, ensuring that governance can withstand scrutiny is essential to sustaining long-term trust.
For observers tracking Trump-linked crypto ventures, the WLFI case adds a concrete data point about governance fragility and reputational risk. It suggests that while political association can attract attention and capital, it also places a premium on transparent governance practices and risk controls that stand up to public debate.
Looking ahead, market watchers will want to monitor whether WLFI clarifies its governance process, offers third-party verification of token-holder participation, and demonstrates that its use of token-backed collateral adheres to transparent risk management standards. The trajectory of WLFI’s token price will likely reflect not only the platform’s technical decisions but the perceived legitimacy of its governance framework and the broader willingness of the market to engage with politically connected crypto projects.
Readers should watch for any formal governance updates, new disclosures from WLFI, and potential regulatory statements that might address governance and collateral practices in tokenized ecosystems. The next moves will reveal whether WLFI can restore trust and stabilize its token, or if the episode marks a turning point in how investors evaluate governance risk in high-profile crypto ventures.
In the near term, the key question remains: will WLFI provide verifiable transparency around its governance voting and token-locked mechanisms, or will the controversy linger as a systemic cautionary tale about governance complexity in tokenized finance?

TLDR:
- SUI broke above the $0.89–$0.90 consolidation range on the one-hour chart, signaling a bullish trend shift.
- Price pulled back to the $0.91–$0.905 demand zone, where analysts expect buyers to defend key support.
- Wyckoff accumulation patterns and bullish order blocks on the weekly chart point to targets of $10–$20.
- SUI’s market cap stabilized above $3.6B after spiking to $3.85B, reflecting long-term holder conviction.
SUI price prediction is flashing signals that seasoned traders rarely ignore. A textbook breakout above a weeks-long consolidation range, a controlled pullback into fresh demand, and a weekly chart carrying the fingerprints of prior 1,000% rallies, the setup is building quietly but deliberately.
Whether the next move targets $0.97 or something far more ambitious, the chart is making its case without apology.
SUI Breaks Out, Pulls Back, and Sets Up a Second Shot
SUI flashed a textbook breakout on the one-hour chart this week, clearing the $0.89–$0.90 consolidation range that had capped price for an extended period. The move was sharp and deliberate.
Bullish candles stacked above prior resistance, volume followed, and the chart shifted from a downtrend structure to a clear bullish bias in a matter of hours.
The rally did not hold its highs. SUI pulled back toward the $0.91–$0.905 area shortly after, a move that initially spooked short-term traders. However, analysts tracking the asset noted the correction lacked the hallmarks of a genuine reversal.
No heavy sell volume. No breakdown of structure. Just a measured retreat into what is now a recognized demand zone, where previous resistance has flipped into support.
That flip is the crux of the current setup. Traders are now watching for bullish confirmation at the $0.91–$0.905 zone before positioning for another push toward the $0.96–$0.97 resistance band.
Until that confirmation arrives, the market remains in a wait-and-see posture at a level that could determine SUI’s next directional move.
Weekly Structure Points to Targets Far Beyond Current Levels
Step back to the weekly chart and the short-term noise gives way to a much larger technical picture. SUI has printed this pattern before.
In mid-2024 and again in mid-2025, the price dipped toward a key trendline support, gathered liquidity at those lows, and then staged parabolic advances.
Those rallies registered gains north of 500% and, in one instance, crossed 1,000% within a matter of months. Analysts point out that SUI is currently sitting at a structurally similar position.
Bullish order blocks are visible at the current support zone, consistent with what Wyckoff analysis describes as smart money accumulation — a phase where institutional-level buying absorbs retail selling before a major directional move develops.
Resistance between $3 and $5 is flagged as a potential speed bump on any extended advance. Even though historical precedent suggests momentum tends to build rather than stall once that band is cleared.
Market cap data from the past seven days adds a layer of confirmation to the broader thesis. SUI’s market cap spiked toward $3.85 billion on April 7 before pulling back and stabilizing above $3.6 billion through several corrective sessions.
The base is holding. Long-term participants appear to be absorbing the dips rather than exiting, a dynamic that analysts say keeps the structural case for $10–$20 price targets firmly on the table.

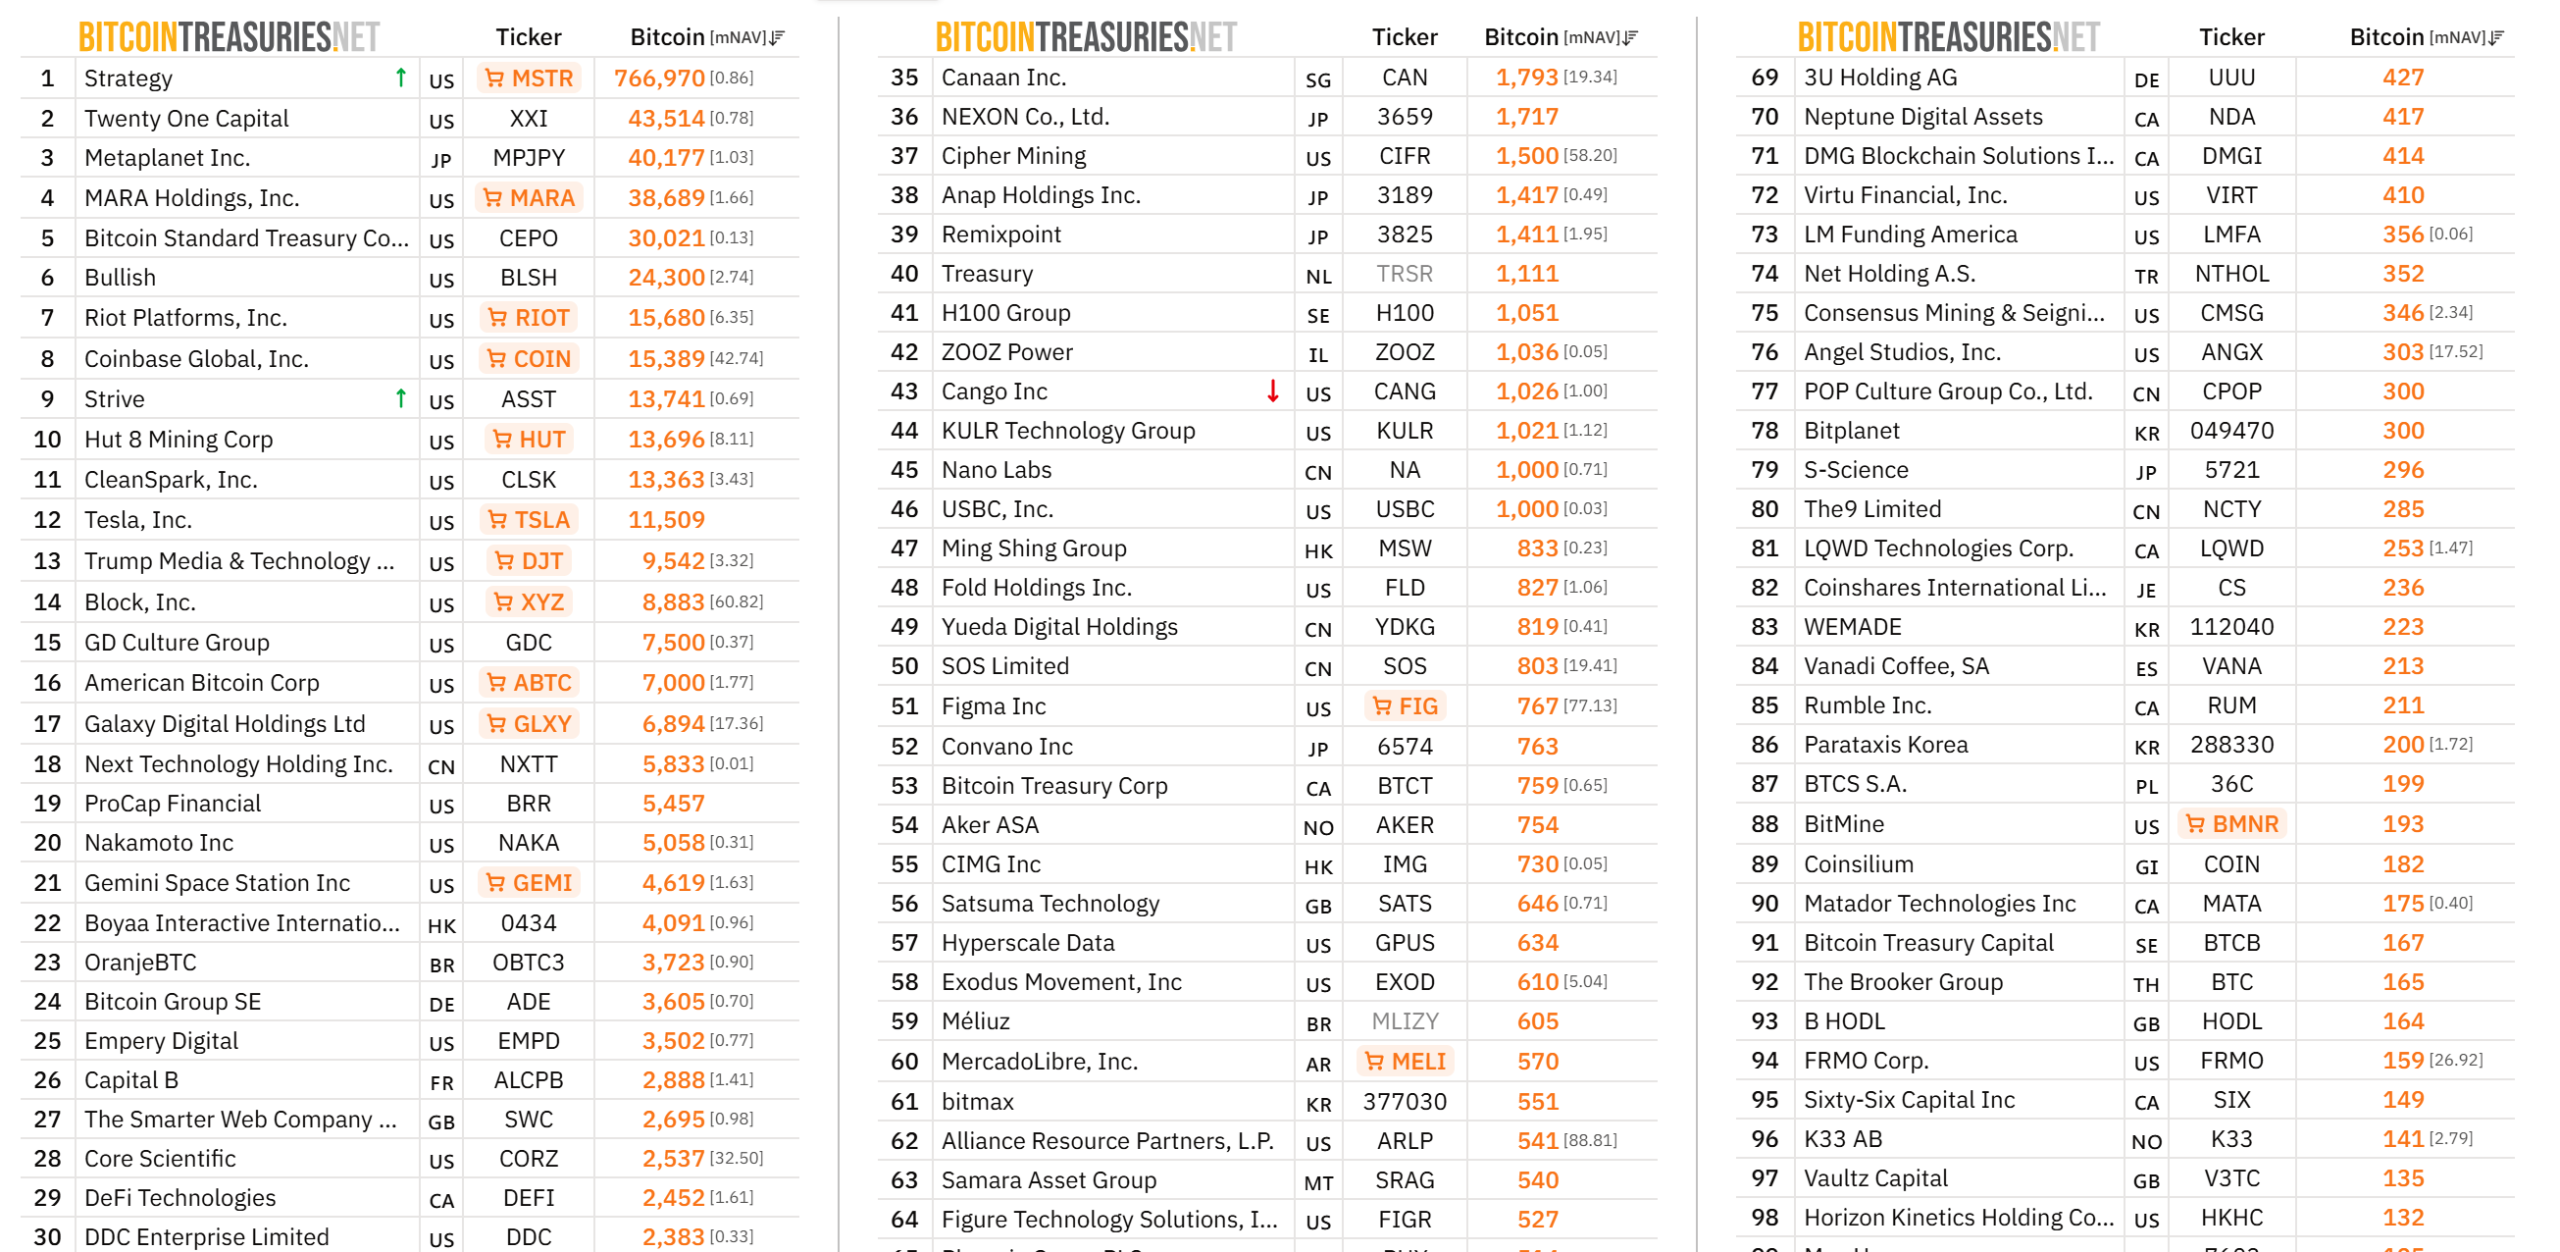
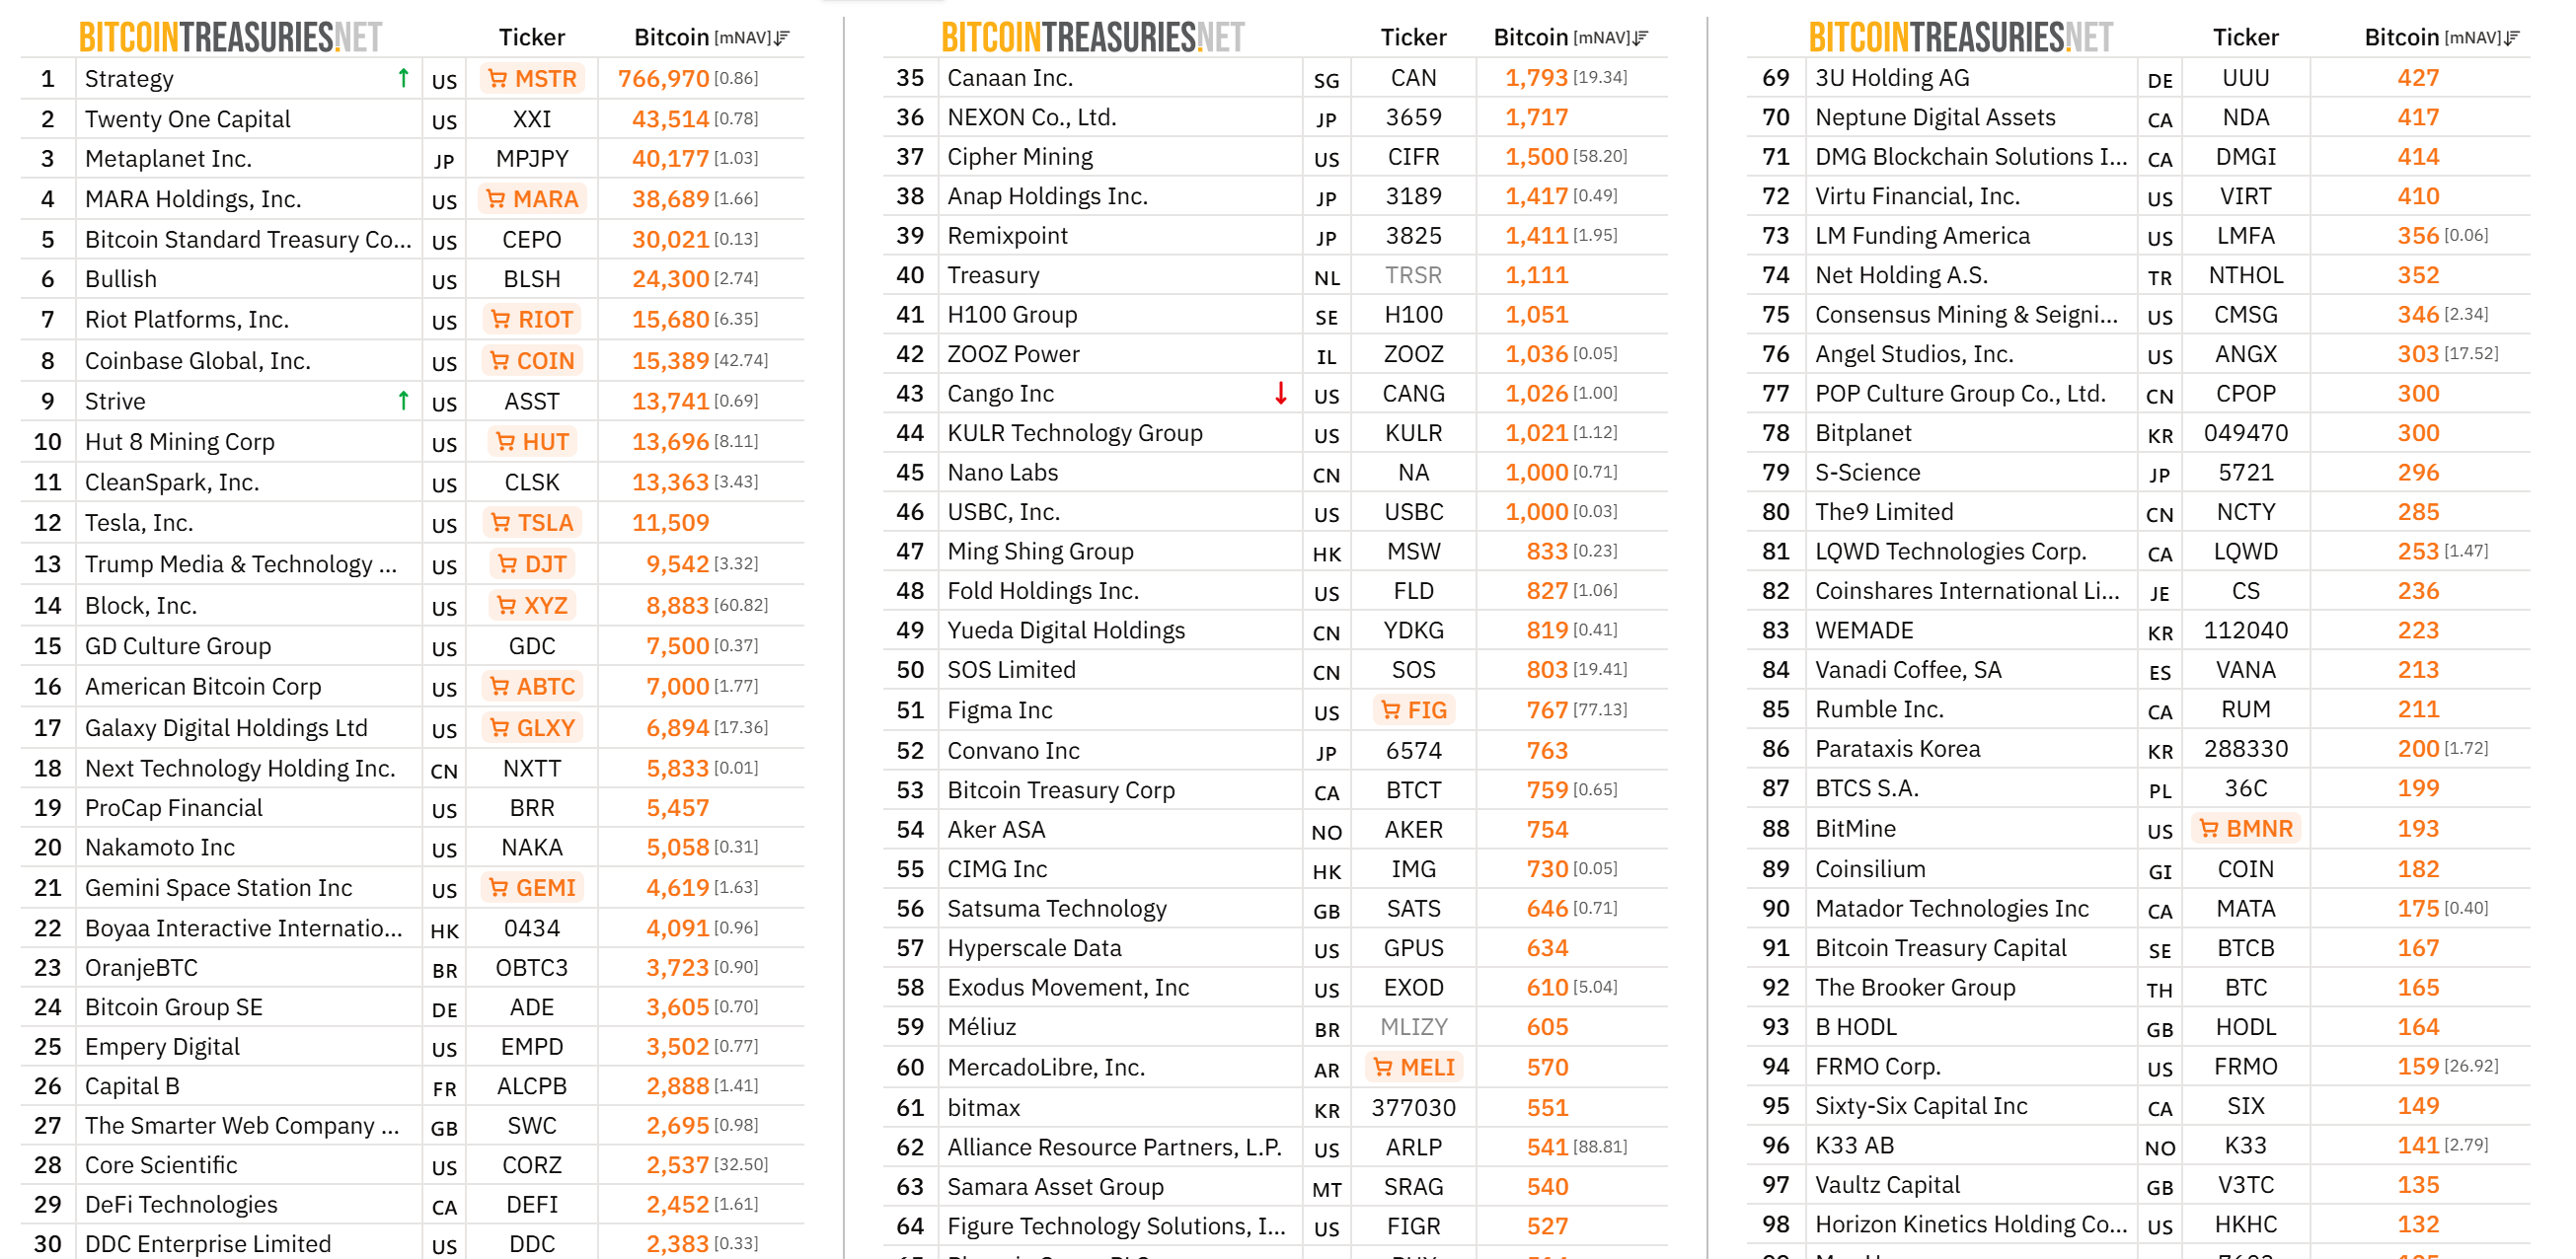
Adam Back, the Blockstream CEO named by the New York Times as the most likely candidate behind Satoshi Nakamoto, may have had a more practical reason for cooperating with the investigation.
Several industry figures now suggest Back used the global media attention as free publicity for Bitcoin Standard Treasury Company (BSTR), his Bitcoin (BTC) treasury firm approaching a public listing.
Did Adam Back Use NYT Satoshi Story as Free BSTR Publicity?
John Carreyrou, the investigative reporter behind the explosive expose revealed that Back agreed to pose for a NYT photographer in Miami weeks before the story ran.
“If you’re IPO’ing a company — it’s pretty damn good PR. Particularly when the cost is roughly zero,” commented ETF analyst James Seyffart.
The timing matters because BSTR is completing a SPAC merger with Cantor Equity Partners I. The deal includes a $1.5 billion PIPE, the largest ever announced for a Bitcoin treasury vehicle.
BSTR plans to launch with over 30,000 BTC on its balance sheet, which would catapult its ranks among the largest public Bitcoin treasury.
The merger was originally expected to close in Q1 2026, subject to SEC review and shareholder approval.
Whether Back intended the headlines or simply welcomed them, the Satoshi spotlight landed at the most commercially convenient moment possible.
The post Free PR or Confession? Expert Thinks Adam Back Played the NYT Like a Prospectus appeared first on BeInCrypto.
Justin Sun, the founder of the Tron layer-1 blockchain network, criticized World Liberty Financial (WLFI), a decentralized finance platform co-founded by US President Donald Trump’s sons, over lengthy lock-up periods for the platform’s governance token.
Sun said that he invested “significant capital” in WLFI as an early investor and also said that a March WLFI governance proposal to determine token lock-up periods, in which more than 76% of the voting tokens came from 10 wallets, lacked transparency. In a Sunday post on X, Sun wrote (in translation):
“The governance votes cited to justify the above actions were not conducted through fair or transparent procedures. Key information was withheld from voters, meaningful participation was restricted, and outcomes were predetermined.”
“Justin’s favorite move is playing the victim while making baseless allegations to cover up his own misconduct,” World Liberty Financial said in response, threatening legal action against Sun over his claims.

The incident came amid community pushback against WLFI and confirmation that the platform was using its own governance tokens as loan collateral, causing the price of WLFI to sink to an all-time low and renewed backlash against Trump for his crypto activities.
Cointelegraph reached out to World Liberty Financial but did not obtain a response by the time of publication.
Related: World Liberty signals phased WLFI unlock vote after early holder backlash
WLFI token sinks to all-time low as community backlash mounts
The WLFI token hit a new all-time low on Saturday, falling to just $0.07 following news of the platform using WLFI tokens as collateral to borrow stablecoins.
Wallets linked to World Liberty Financial used WLFI tokens as collateral on Dolomite, a DeFi platform co-founded by the project’s chief technology officer, Corey Caplan, to take out the stablecoin loan.

WLFI confirmed that it acts as an “anchor” borrower, which generates yield for the platform and value for token holders, adding that it is “one of the largest suppliers and borrowers” in the WLFI ecosystem.
“Treating the crypto community as a personal ATM is unjust and has never been authorized through any fair, transparent, good-faith community governance process,” Sun said.
Magazine: Trump’s crypto ventures raise conflict of interest, insider trading questions
Crypto World
Aave Will Win Proposal Passes: AAVE Token Now Controls Protocol Revenue, Brand, and Full Product Stack
TLDR:
- Aave Will Win proposal directs application revenue from Aave Pro, Aave App, and Horizon directly to the DAO treasury.
- Aave’s protocol revenue reached $140 million in 2025, with 2026 tracking similarly despite market weakness.
- Swaps on Aave.com and Aave Pro are generating $10–20 million in new revenue on top of existing protocol income.
- Aave Labs commits to zero-bureaucracy governance, requiring measurable SP goals and full financial transparency.
Aave has passed what its community calls the most important proposal in the protocol’s history. The Aave Will Win (AWW) proposal secured a landslide governance vote, reshaping how the protocol generates revenue.
The new framework positions the AAVE token as the central asset across all products and brand assets. It also introduces new application revenue streams beyond the core protocol. These earnings are directed entirely to the DAO treasury for the first time.
Aave Moves Toward a Full-Stack Revenue Model
The AWW proposal creates a new revenue layer on top of existing Aave Protocol earnings. Application and product revenue from Aave Pro, Aave.com, Aave App, Horizon, and Aave Kit will now flow to the DAO.
This represents a clear expansion beyond the protocol-only revenue model that has existed since the project launched.
According to Aave Labs founder Stani Kulechov, the DAO accumulated $140 million in protocol revenue in 2025. Revenue for 2026 is tracking at a similar level despite broader market weakness.
That growth was achieved through protocol-only income alone, making the addition of application revenue a notable shift.
Kulechov noted on X that swaps on Aave.com and Aave Pro are already generating between $10 million and $20 million.
This revenue is additive, sitting on top of what the protocol already generates. Together, the two streams begin building the full-stack revenue model the proposal envisions.
Aave V4’s reinvestment feature allows idle capital in pools to generate additional yield for the protocol. New V4 Spokes will also unlock further collateral and address the demand side of the DeFi liquidity market. These technical upgrades work in tandem with the revenue changes introduced under AWW.
Aave Labs has committed to working exclusively on the protocol’s own products going forward. This means AAVE token holders now own the protocol’s brand, users, and integrations through one unified asset.
Owning the full vertical stack is increasingly important as protocol competition intensifies across the DeFi space.
Governance Rules Tighten as Risk Management Expands
The governance model under AWW is shifting to a zero-bureaucracy structure focused on execution. Service providers will now be held to real, measurable goals rather than process-heavy deliverables.
The change reflects the DAO’s intent to compete with well-funded and efficient organizations in the broader financial sector.
Kulechov stated plainly on X: “Payments for posting governance proposals are over.” The DAO has already consolidated service providers to direct resources more effectively.
Going forward, SPs who align with token holder interests will receive budget support, provided their requests remain reasonable.
Under the new rules, full transparency from all service providers is a firm requirement. Relationship gating and value leakage away from the protocol will not be tolerated. Everything built with the DAO’s funds must benefit the protocol and remain owned by it.
On the risk side, Aave will maintain a dual-layer approach covering both economic and technical risk assessment. External managers such as Llama Risk and Token Logic will continue operating in their current roles. Their work will be supported and coordinated by a new internal team at Aave Labs.
Aave Labs will build a permanent internal risk management function to sit alongside external managers. This combined structure makes the overall risk framework more resilient.
Better coordination between layers is expected to strengthen the protocol’s response to market and technical risks ahead.
Crypto World
Whales Keep Buying TRUMP Meme Coin Before Mar-a-Lago Event, But Price Drops to Record Low
Whale activity around Official Trump (TRUMP) is intensifying, with holders accumulating tokens ahead of the April 25 crypto conference and gala luncheon at Donald Trump’s Mar-a-Lago resort.
On-chain tracker Lookonchain reported that one wallet withdrew 850,488 TRUMP worth $2.4 million from Bybit over the past two days. Moreover, a second wallet pulled 105,754 TRUMP from Binance. The wallet now holds 1.13 million tokens valued at $3.2 million.
Follow us on X to get the latest news as it happens
TRUMP Meme Coin Whales Stack Tokens
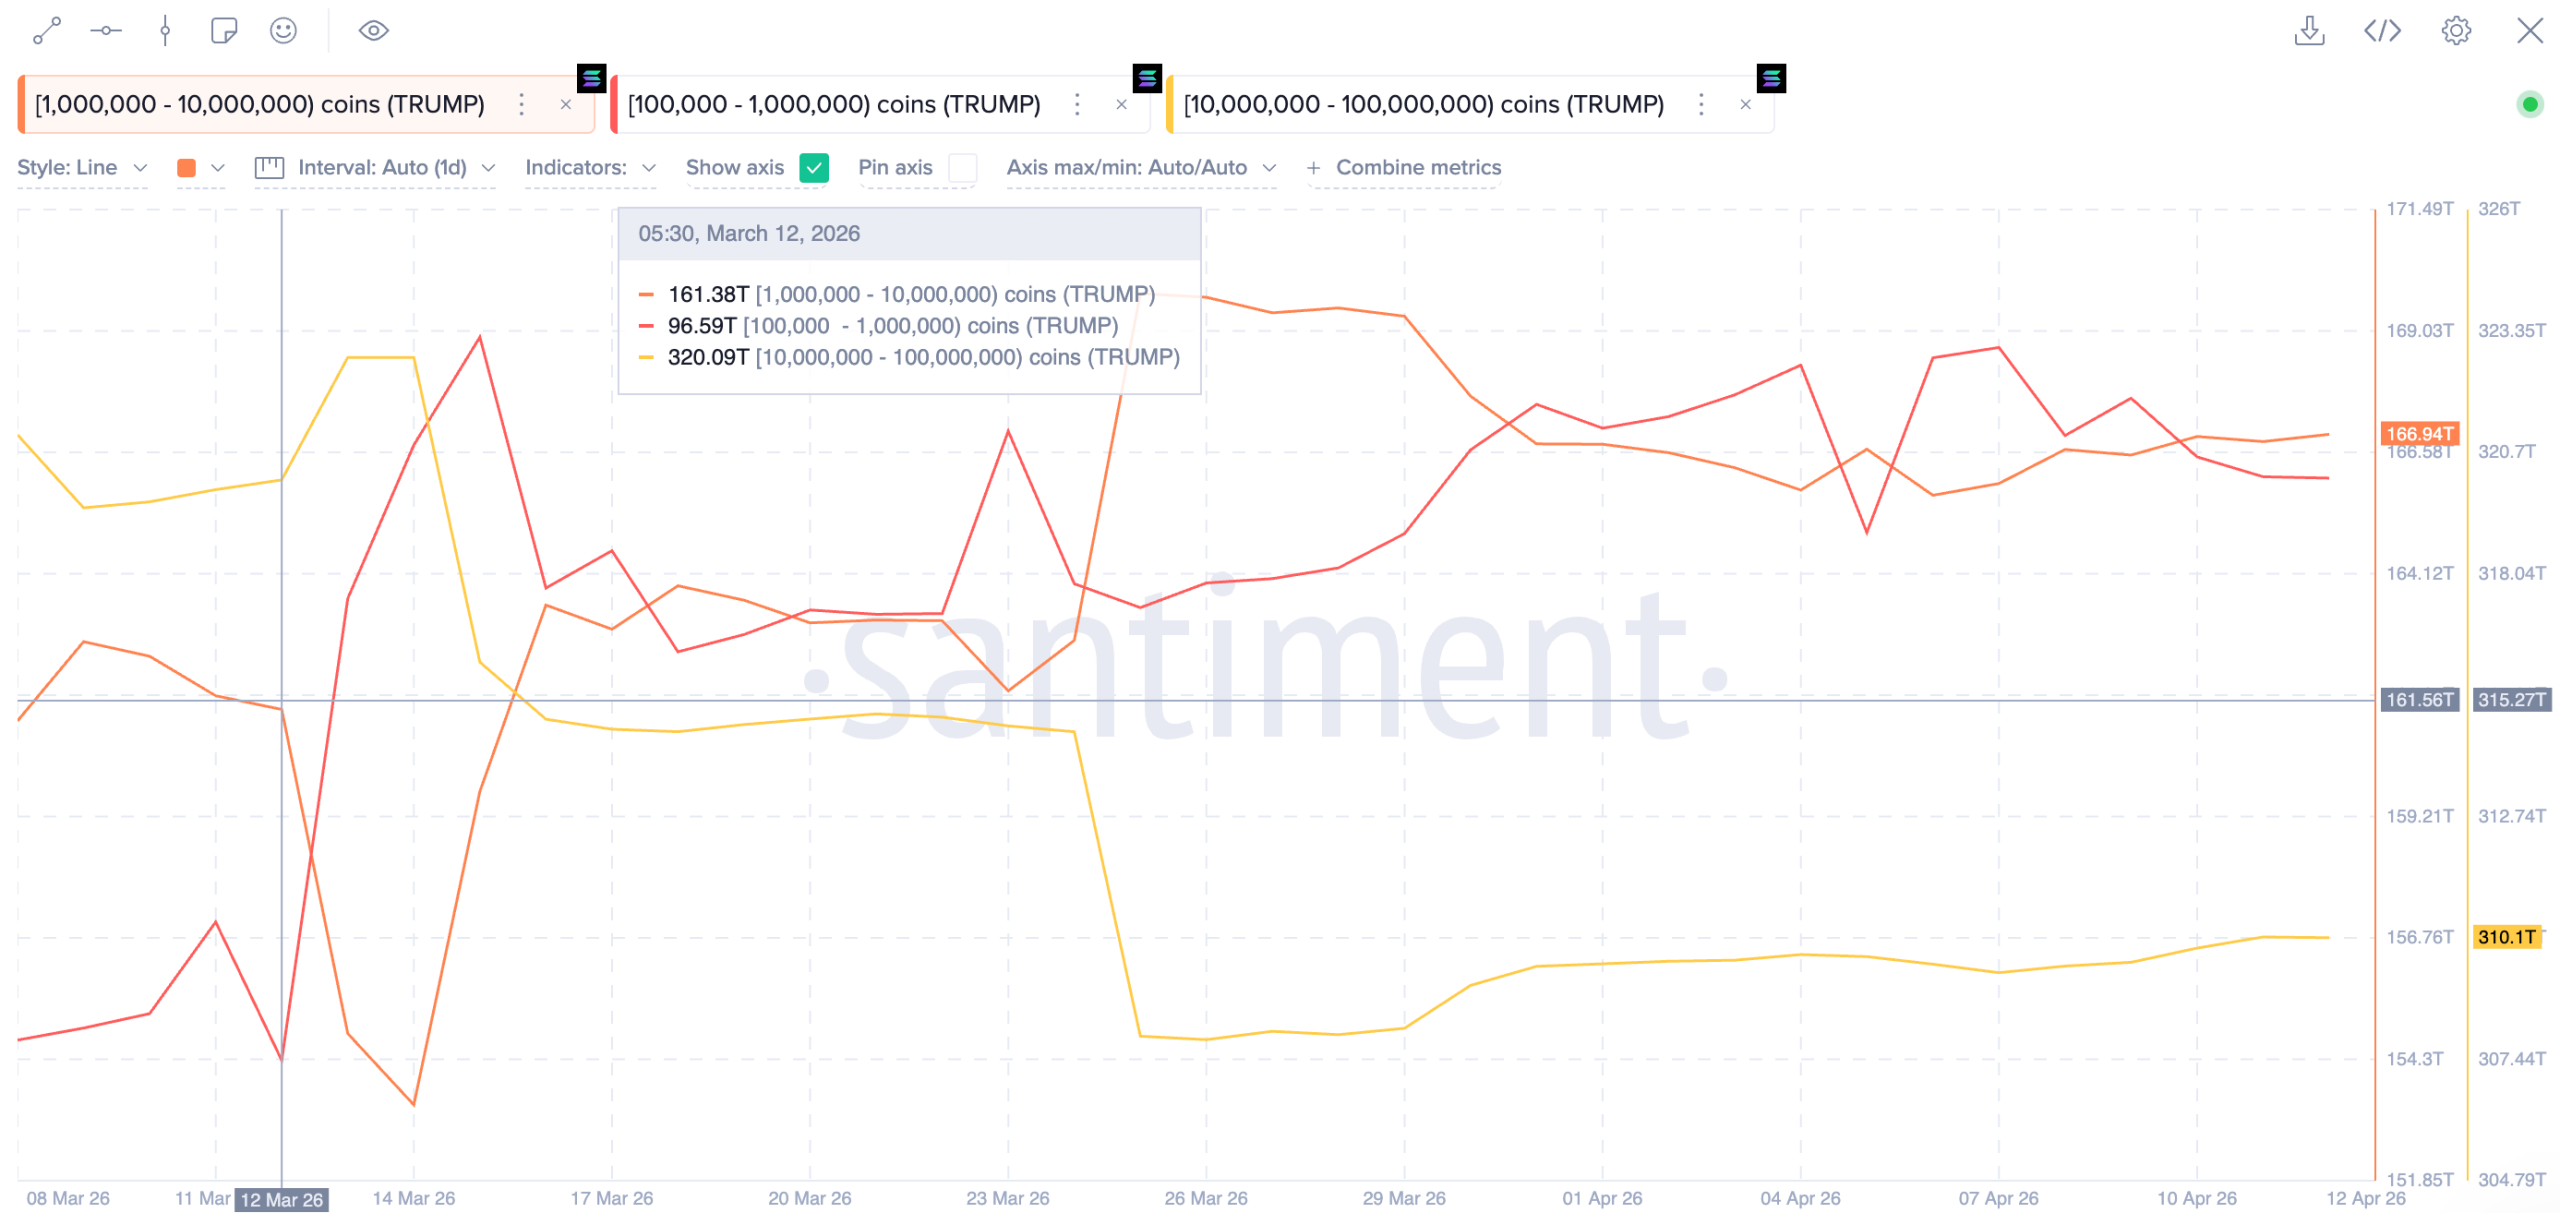
On-chain data from Santiment reveals a clear redistribution pattern since the event was announced on March 12. The largest holder tier, wallets holding between 10 million and 100 million tokens, trimmed positions from 320.09 trillion to as low as 307.95 trillion in late March.
However, the buying activity picked up after, with holdings increasing to 310.1 trillion on April 12.
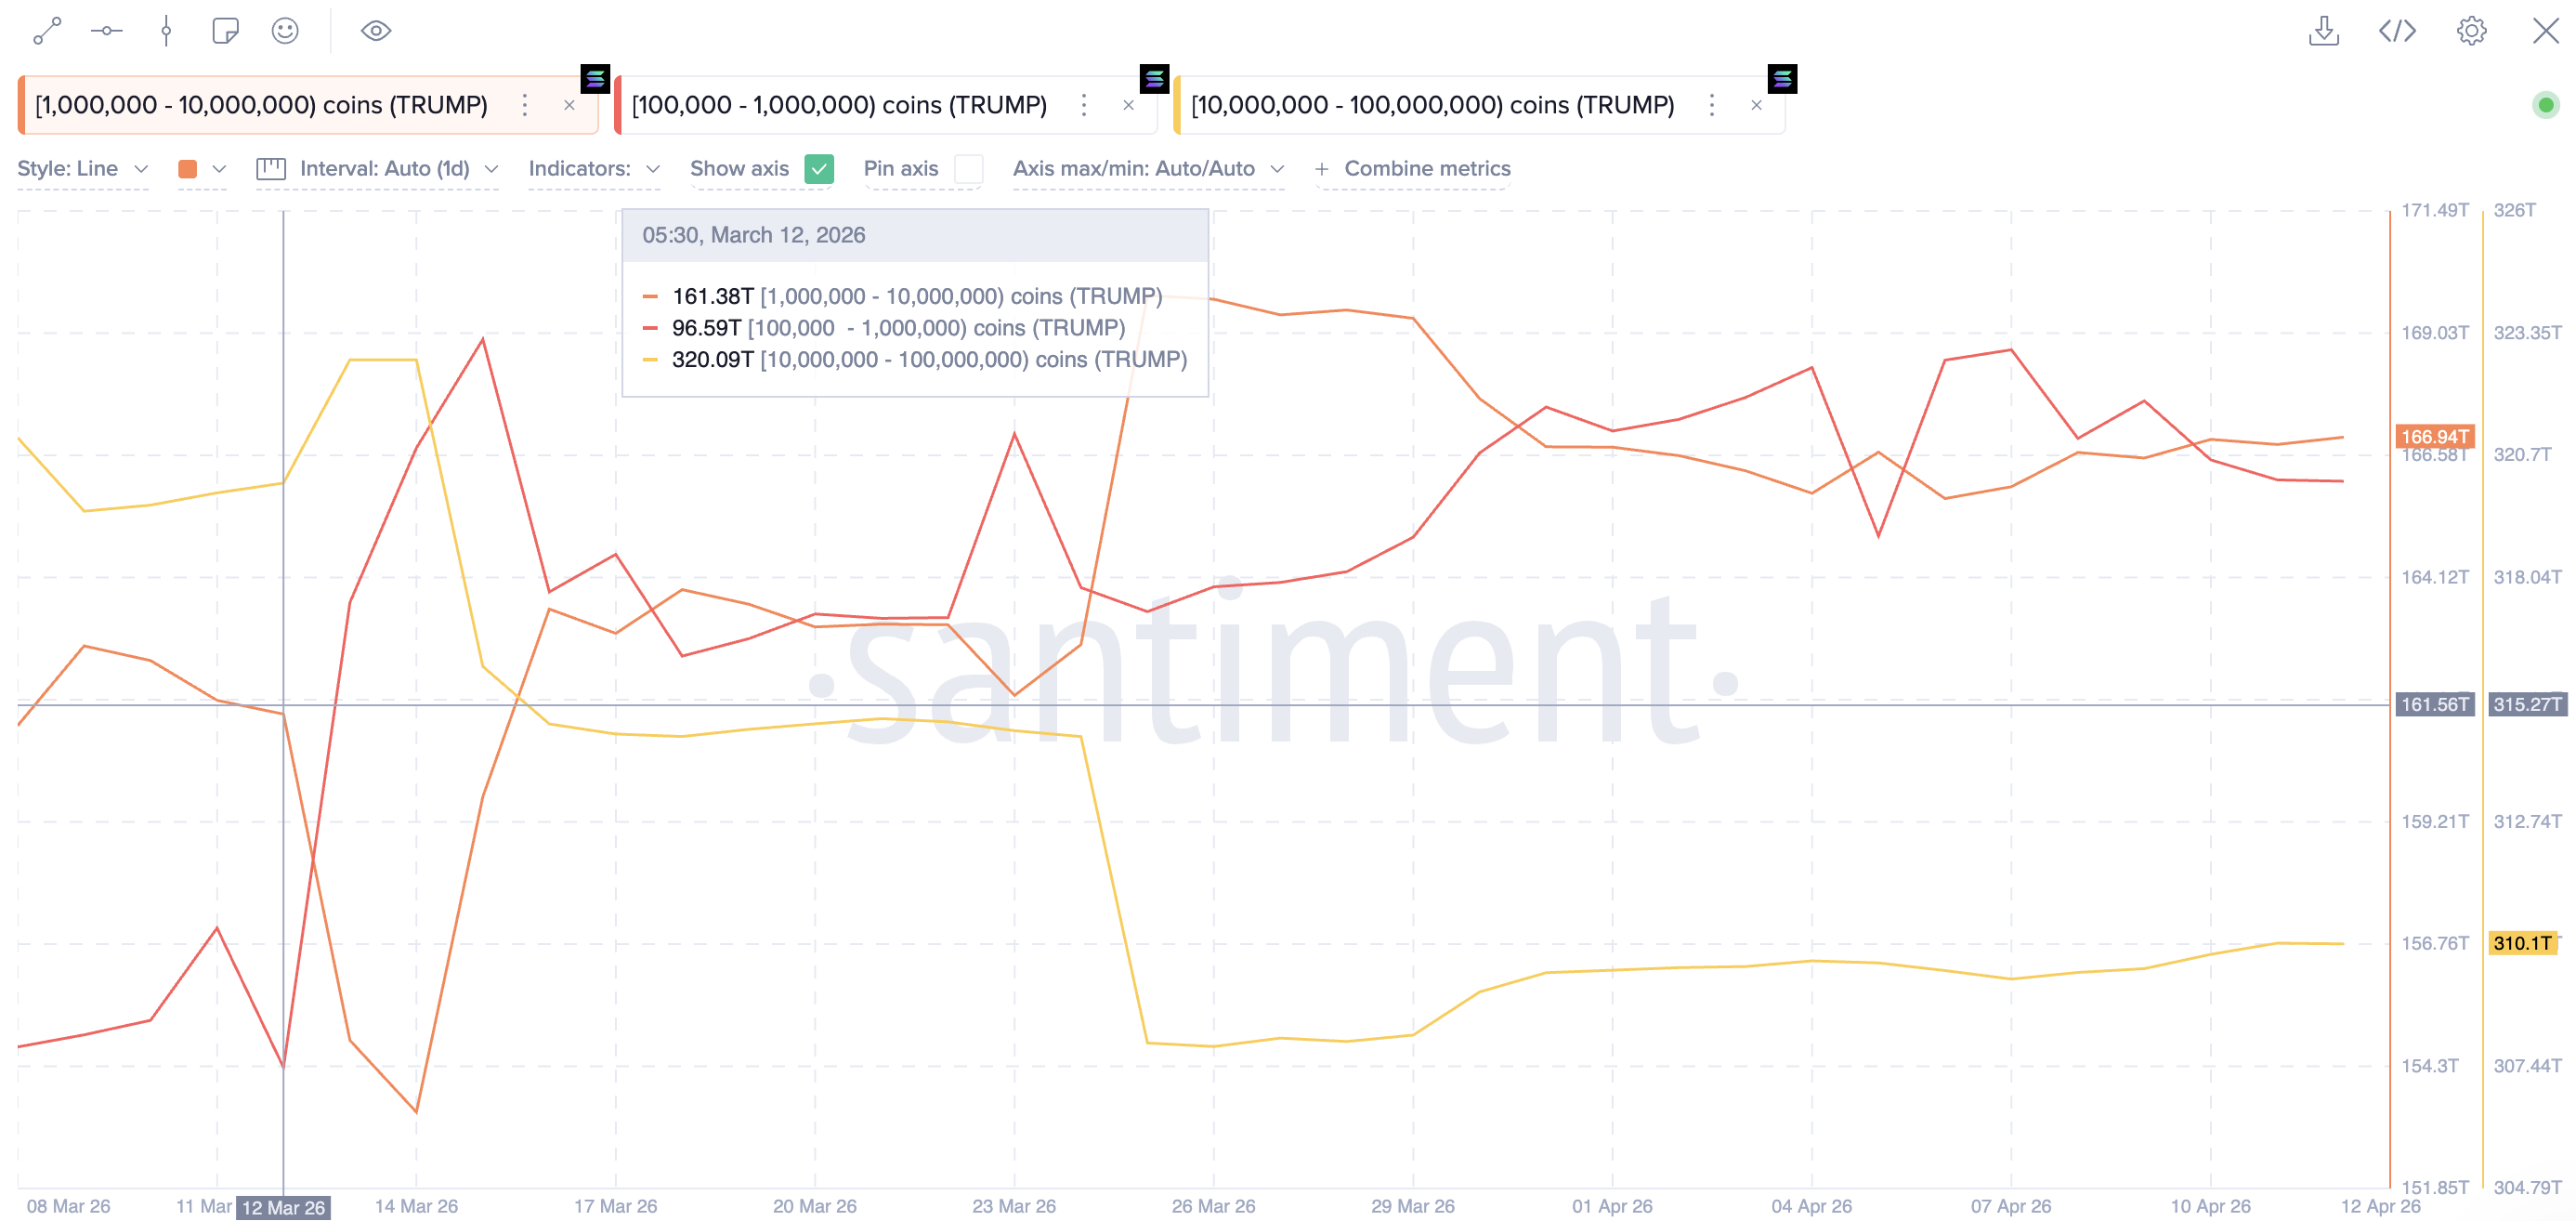
Whales in the 1 million to 10 million range moved in the opposite direction. Those wallets added 5.56 trillion tokens during the same period, bringing their holdings to 166.94 trillion.
Wallets in the 100,000-1 million bracket followed a similar trajectory. Their holdings grew 5% from 96.59 trillion to 101.46 trillion.
BeInCrypto previously reported that the top 297 holders on the leaderboard will earn a seat at the conference. The 29 largest wallets receive VIP access to a private reception with the president.
TRUMP surged over 50% following the March announcement, briefly touching $4.49. However, the token has since given back all of those gains. It traded at approximately $2.8 on April 12.
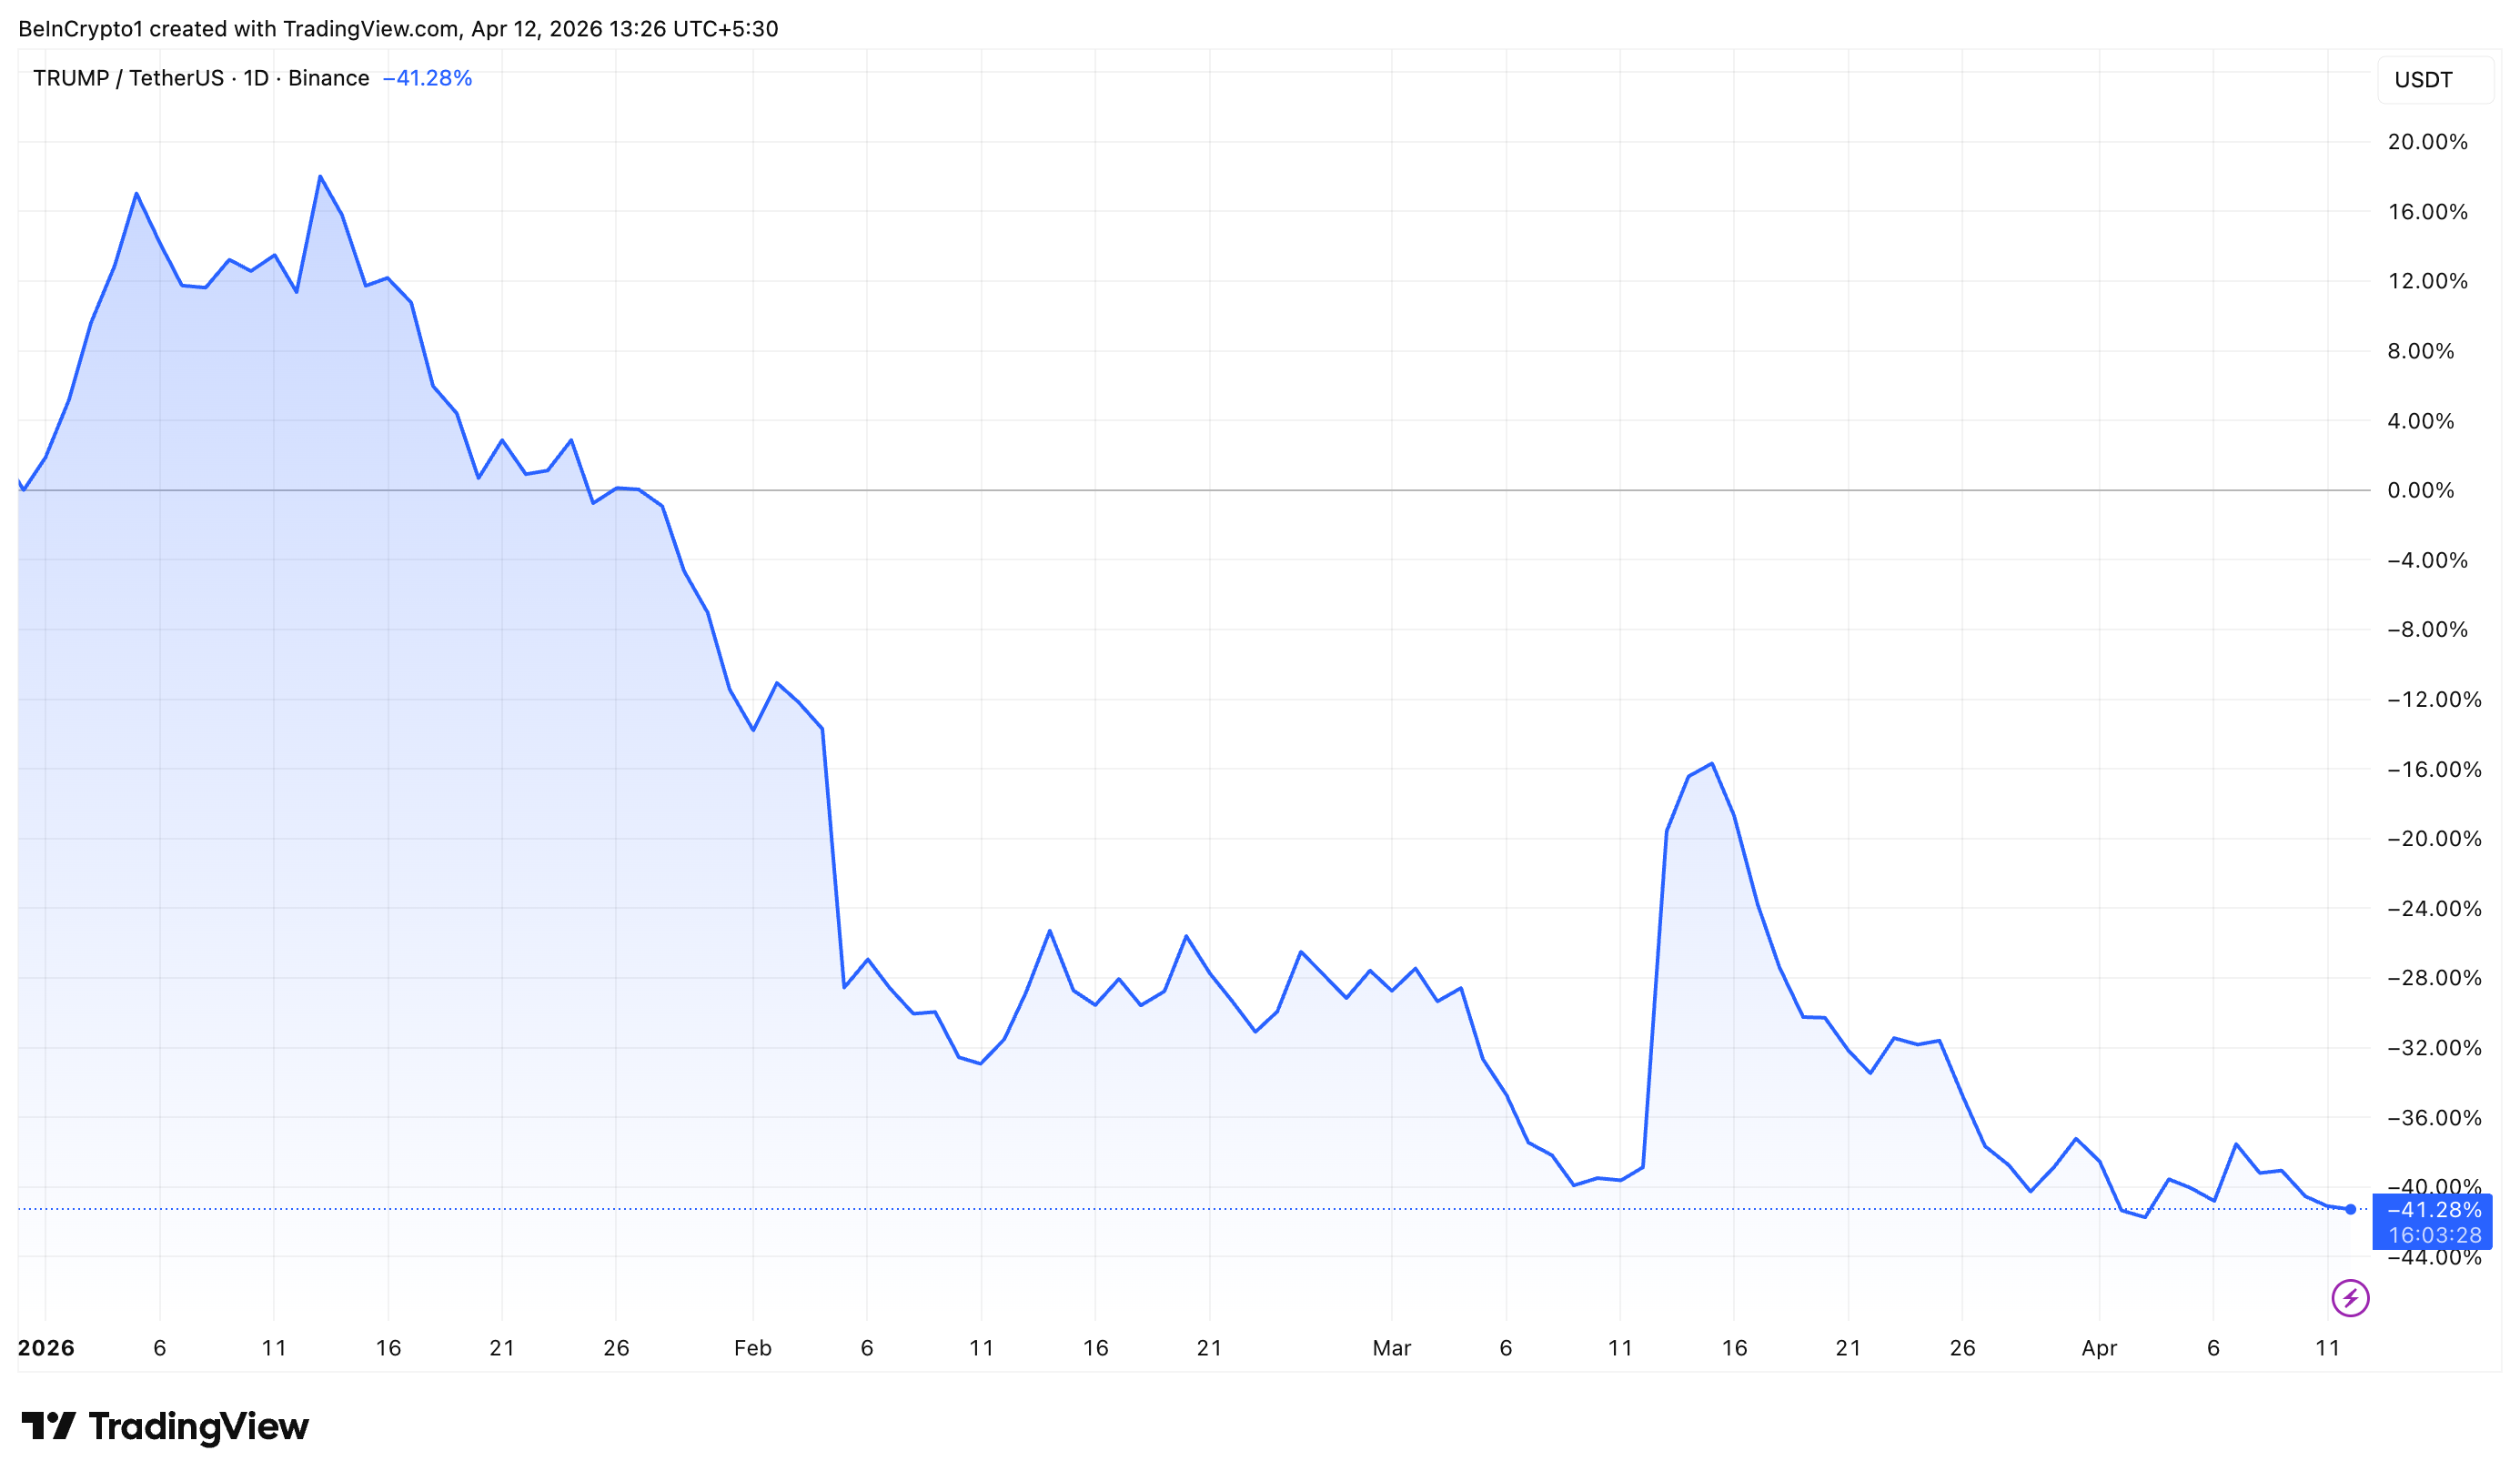
Overall, in 2026, the meme coin is down by more than 41% and has lost more than 11% over the past month alone. With the event less than two weeks away, the gap between ongoing whale accumulation and falling prices sets up a volatile stretch for TRUMP holders.
The post Whales Keep Buying TRUMP Meme Coin Before Mar-a-Lago Event, But Price Drops to Record Low appeared first on BeInCrypto.
TLDR:
- Binance recorded the largest XRP open interest decline, dropping by approximately 721.49 million XRP in recent periods.
- Bybit posted a fall of around 132.10 million XRP in open interest, reflecting weakened speculative momentum across the platform.
- Bitfinex added to the downtrend with a decline of roughly 10.96 million XRP, completing a consistent drop across all three major exchanges.
- Falling XRP open interest may reduce liquidation risks and set early conditions for a potential recovery once liquidity returns.
XRP open interest has fallen sharply across major futures trading platforms in recent periods. Binance, Bybit, and Bitfinex each recorded a drop in open positions, pointing to reduced speculative activity.
Traders appear to be pulling back from leveraged exposure in the XRP market. Position closures have outnumbered new entries across all three platforms.
The data reflects a broader shift in market sentiment as liquidity exits XRP futures at a steady pace.
Binance Leads Drop as Bybit and Bitfinex Also Record Declines
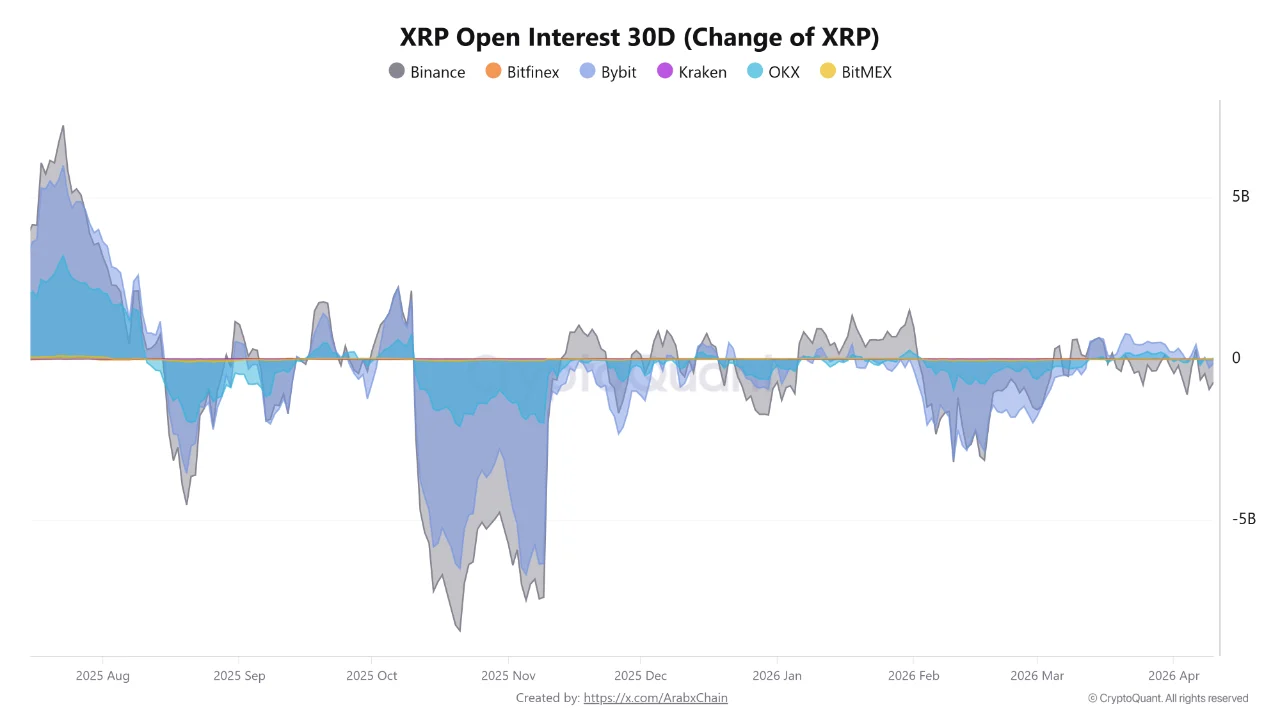
Binance recorded the steepest fall, with XRP open interest declining by roughly 721.49 million XRP. As one of the largest futures exchanges globally, its movements tend to mirror broader market behavior. The sharp drop points to substantial position closures, possibly tied to recent price volatility in XRP.
Bybit ranked second, posting a decline of approximately 132.10 million XRP in open interest. While smaller than Binance’s figure, the drop still reflects reduced speculative momentum in the market. Traders on Bybit also appear to have pulled back from active positioning in XRP futures.

Source: Cryptoquant
Bitfinex came in third with a decline of around 10.96 million XRP in open interest. The figure, though smaller, adds to the consistent downward pattern seen across the other platforms. Three major exchanges declining together builds a coherent picture of retreating market liquidity.
Across all three platforms, position closures have dominated trading activity in this period. The combined exit of open interest reflects a measurable weakening of futures participation in XRP. This type of retreat often follows price instability or a wave of forced liquidations across the market.
Lower Liquidity Could Create Conditions for a Market Recovery
A decline in XRP open interest does not necessarily point to a permanent bearish trend. In many cases, falling open interest reflects a temporary pause as traders reassess their exposure.
When liquidity exits a market, the resulting calm can precede a stronger directional price move. Analysts typically monitor these conditions for early signs of a potential trend reversal.
The exit of liquidity from XRP futures also lowers the risk of cascading liquidations going forward. With fewer open positions on record, sudden price swings are less likely to trigger large sell-offs. This dynamic can help form a more stable foundation for price recovery over time.
The current pullback in XRP open interest also takes place amid wider turbulence in crypto derivatives. XRP futures are particularly sensitive to sentiment shifts given the asset’s trading volume.
Monitoring these data points will remain important for traders tracking directional movement in XRP.
Once liquidity returns and new positions begin to form, market activity in XRP may pick up again. Open interest recovery, particularly on Binance, would serve as an early indicator of renewed demand. The sessions ahead will likely determine whether this retreat marks a floor or a deeper exit.
TLDR:
- Average ROI across 2026 token launches sits at -54%, with RNBW losing nearly 90% from its ICO price.
- Attention and liquidity both peak at TGE and consistently fail to recover, trapping retail buyers at the top.
- Projects like MegaETH and Polymarket are now delaying TGEs until real usage milestones and traction are confirmed.
- Tokens with proven product-market fit like Pendle and Hyperliquid continue holding narrative ground above newer launches.
Token launches in 2026 are delivering deeply negative returns for early participants, according to recent on-chain data.
Average ROI across this year’s launches sits at approximately -54%, raising serious questions about the current fundraising model.
Projects like RNBW, ZAMA, and AZTEC have each lost between 43% and nearly 90% of their value after their token generation events.
Market analysts now point to structural flaws in how new tokens reach the market. The pattern is consistent, and it is hitting retail investors hardest.
The Data Behind the Decline
Recent figures paint a troubling picture for anyone entering early-stage token sales. RNBW dropped 89.87% from its ICO price, while ZAMA fell 43% after its TGE. AZTEC declined nearly 50% shortly after going live on exchanges.
These are not isolated cases. The -54% average ROI across 2026 launches points to a recurring structural problem with token distribution and pricing at launch.
Crypto researcher Nick Research flagged this pattern publicly, noting that both attention and liquidity peak at TGE and then never recover. That observation lines up with what data consistently shows across multiple project launches this cycle.
The core issue is the low float, high fully diluted valuation model combined with heavy venture capital allocations. This structure creates what analysts describe as an exit liquidity machine, where early backers offload holdings onto retail buyers at peak hype.
A Market Pivoting Toward Usage and Revenue
Despite weak performance data, token launches are not disappearing entirely. However, the model is clearly evolving in response to consistent losses by retail participants.
MegaETH has chosen to delay its TGE until specific key performance milestones are met. Polymarket and OpenSea have also withheld firm launch dates, a move that signals growing caution among project teams about launching before real traction exists.
This shift reflects a broader recalibration in how investors assess new projects. The speculation-first approach that defined earlier cycles is giving way to a usage-first standard that the market now rewards more visibly.
Tokens with genuine product-market fit continue to hold narrative ground. Assets such as Pendle and Hyperliquid retain attention in ways newer launches simply cannot match.
BTC, ETH, SOL, TAO, and HYPE still dominate market conversation, crowding out newer entrants almost entirely within days of any new launch.
New experiments in attention markets and cashback incentive models are also emerging as alternative frameworks. These designs attempt to align token value with real platform usage rather than speculative demand.
For now, the market is sending a clear message: proof of traction before TGE is no longer optional for any project seeking long-term viability.
Crypto World
CFTC Chair Mike Selig argues for agency’s ‘exclusive regulatory authority’ in prediction markets fight: State of Crypto


Commodity Futures Trading Commission Chairman Mike Selig told CoinDesk that the agency will continue to defend its “exclusive regulatory authority” to oversee prediction markets in court. “It doesn’t matter if it’s on sports, politics or anything else, if it’s a validly offered product within a CFTC-regulated exchange, then we regulate that,” Selig said.
You’re reading State of Crypto, a CoinDesk newsletter looking at the intersection of cryptocurrency and government. Click here to sign up for future editions.
NASHVILLE, Tenn. — The Commodity Futures Trading Commission is just defending its territory in suing states over prediction markets, the regulator’s head told CoinDesk.
CFTC Chairman Mike Selig, speaking on the sidelines of the Digital Assets and Emerging Tech Policy Summit hosted by Vanderbilt University and the Blockchain Association on Monday, said the agency’s lawsuits against Arizona, Illinois and Connecticut make it “very clear … that the CFTC has exclusive regulatory authority when it comes to commodity derivatives markets.”
Selig, who is speaking at CoinDesk’s Consensus Miami conference next month, said Monday’s Third Circuit Court ruling that the CFTC has to oversee prediction markets bolstered his agency’s view.
Under Selig, the CFTC has embarked on a major litigation effort to bolster prediction markets’ arguments that they are providing derivatives products under the Commodity Exchange Act, rather than gambling services regulated by states.
“Our view is that the statute is very clear that when you offer a swap on a federally regulated Designated Contract Market, that transaction, those trades, are subject to federal regulation,” he said. “It doesn’t matter if it’s on sports, politics or anything else; if it’s a validly offered product within a CFTC-regulated exchange, then we regulate that, and the states don’t have the ability to nullify federal oversight and substitute gambling laws where derivatives laws apply.”
Asked why the CFTC did not sue Nevada or Massachusetts — two states that have successfully secured preliminary injunctions against prediction market providers — Selig said that “I wouldn’t say, just because these are the first states, that they’ll be the last.”
He pointed out that the CFTC filed an amicus brief in a consolidated case before the Ninth Circuit Court of Appeals, which will be heard next week. The Ninth Circuit includes Nevada.
Dodd-Frank swaps
Under the Dodd-Frank Act, the CFTC can regulate swaps and can block certain types based on whether they are in the public interest. These categories include war, terrorism, assassination, gaming, anything otherwise illegal or “other similar activity.”
Selig said the main issue is that, under the law, the CFTC decides whether a product is contrary to the public interest. The lawsuits it’s engaged in are focused on that aspect — regardless of the events underlying the contracts.
“Even if those categories of underlyings, whether it’s war terrorism, assassination, gaming, and so on and so forth, even if we have to do a public interest analysis, or we choose to do a public interest analysis, that doesn’t mean that that’s not within our exclusive regulatory authority,” he said. “And so that’s what the cases are about, and that’s what we’re fighting for.”
The CFTC is currently going through the formal rulemaking process to clarify its oversight of prediction markets.
“We’re open to suggestions as to what that process should look like and how to evaluate it,” he said. “We’re certainly considering that provision of the Dodd-Frank Act.”
Interpretative guidance
Outside prediction markets, Selig said the CFTC would review any comments on the final interpretation it published with the Securities and Exchange Commission last month.
“To the extent we get feedback on certain things we might change or need to reconsider, we’ll certainly do that,” he said.
More importantly, he said, the creation of a taxonomy means if any company wants to self-certify a futures product tied to a digital asset, the CFTC and SEC can just look to their guidance to ensure the token is not a security.
“To the extent you have a tokenized security, we’re not butting heads on the CFTC claiming it’s a commodity or the SEC claiming a different type of commodity as a security,” he said. “We’ve got clear lines drawn in the statute.”
The guidance was intended to be comprehensive, so both the companies and the agencies had examples, he said.
“We should be very much aligned across agencies,” he said.
Monday
- 13:00 UTC (9:00 a.m. ET) SEC Chair Paul Atkins will speak at the IMF-IOSCO conference on new technologies.
Thursday
- 14:00 UTC (10:00 a.m. ET) The House Agriculture Committee will hold a hearing with CFTC Chair Mike Selig. There are not many details about the topic of the hearing — it just said it’s “for the purpose of receiving testimony.”
- 16:00 UTC (9:00 a.m. PT) A Ninth Circuit Court of Appeals panel will hear arguments in a consolidated set of cases around prediction markets and state regulators. The CFTC filed an amicus brief in this case and will also speak during the arguments.
If you’ve got thoughts or questions on what I should discuss next week or any other feedback you’d like to share, feel free to email me at nik@coindesk.com or find me on Bluesky @nikhileshde.bsky.social.
You can also join the group conversation on Telegram.
See ya’ll next week!

Pep Guardiola has Arsenal message after Man City win

Your developers are already running AI locally: Why on-device inference is the CISO’s new blind spot

THEY JUST DROPPED A MEGA XRP BOMBSHELL IN CONGRESS ($100 TRILLION.)

Why Israel is blocking foreign journalists from entering

Bitcoin: We’re Entering The Most Dangerous Phase

Alan Cumming Brands Baftas Ceremony A ‘Triggering S**tshow’
THEY JUST DROPPED A MEGA XRP BOMBSHELL IN CONGRESS ($100 TRILLION.)

Breaking Down the Financial Strain of Salon Booth Rentals_ Who Pays What #shortsfeed #judgejudy

Crypto Gold Live Trading 12 April | Market Trader | #goldtrading #cryptotrading #bitcoin
-

 Business7 days ago
Three Gulf funds agree to back Paramount’s $81 billion takeover of Warner, WSJ reports
-

 Politics2 days ago
US brings back mandatory military draft registration
-

 Fashion2 days ago
Weekend Open Thread: Veronica Beard
-

 Tech5 days ago
How Long Can You Drive With Expired Registration? What Florida Law Says
-

 Politics5 hours ago
World Cup exit makes Italy enter crisis mode
-
 Sports2 days ago
Man United discover Nico Schlotterbeck transfer fee as defender reaches Dortmund agreement
-

 Fashion6 days ago
Massimo Dutti Offers Inspiration for Your Summer Mood Board
-

 Crypto World3 days ago
Canary Capital Files SEC Registration for PEPE ETF
-

 Fashion5 days ago
Let’s Discuss: DEI in 2026
-

 Business2 days ago
Tesla Model Y Tops China Auto Sales in March 2026 With 39,827 Registrations, Beating Cheaper EVs and Gas Cars
-

 Crypto World4 days ago
Bitcoin recovers as US and Iran Agree a Ceasefire Deal
-

 Politics3 days ago
Malcolm In The Middle OG Turned Down ‘Buckets Of Money’ To Appear In Reboot
-

 Business2 days ago
OpenAI Halts Stargate UK Data Centre Project Over Energy Costs and Copyright Row
-

 Business1 day ago
Ireland Fuel Protests Enter Day 5 as Blockades Spark Shortages and Government Prepares Support Package
-

 Tech6 days ago
Italian court says Netflix must refund customers up to $576 over price hikes
-

 Tech6 days ago
Haier is betting big that your next TV purchase will be one of these
-

 Tech6 days ago
Gamer Restores the Original PlayStation Portal From Two Decades Ago
-

 Tech7 days ago
The Xiaomi 17 Ultra has some impressive add-ons that make snapping photos really fun
-

 Tech6 days ago
Samsung just gave up on its own Messages app
-

 Politics3 days ago
LBC Presenter Mocks Trump Over Iran War Failures
You must be logged in to post a comment Login