
Crypto World
Hyperliquid to Launch Prediction Market Outcome Trading


The new markets will trade on Hypercore via the upcoming HIP-4 upgrade.


TLDR:
- TAO fell from $337 to $270 within 24 hours after Covenant AI announced its exit over governance concerns.
- Covenant AI claimed revenue was halted abruptly, and decision-making power shifted away from the broader community.
- Infrastructure updates were reportedly introduced without consensus, raising concerns among contributors about control.
- The project, once backed by major AI figures, now faces scrutiny over whether it still operates as decentralized.
Bittensor’s native token, TAO, recorded a sharp decline within 24 hours after a public dispute raised concerns about governance and network control.
The development followed the exit of Covenant AI, a key contributor, which cited operational and structural concerns.
Covenant AI Exit Raises Governance Questions
A recent post by Coin Bureau on X detailed Covenant AI’s departure from the Bittensor ecosystem. The statement alleged that revenue streams were halted without prior notice, disrupting ongoing operations tied to the project.
Covenant AI further stated that governance mechanisms had shifted away from community participation. According to the team, decision-making authority appeared concentrated among a limited group of actors. This shift raised concerns about whether the network still operates under decentralized principles.
The group also pointed to infrastructure changes introduced without broader consultation. These changes, described as top-down, reportedly altered how participants interact with the system. As a result, contributors expressed uncertainty about the network’s direction and governance structure.
Covenant AI was known for developing Covenant-72B, a large-scale language model built through contributions from over 70 participants. The model was trained using consumer-grade hardware, reflecting a collaborative approach within decentralized AI development.
Market Reaction Follows Centralization Allegations
Following the announcement, TAO experienced a rapid price drop, falling from $337 to $270 within a single day. The movement reflected a strong market response to the claims surrounding governance and operational control.
The project had previously gained recognition from notable figures in the artificial intelligence sector. Jensen Huang had publicly acknowledged the initiative, while a co-founder of Anthropic expressed support for its development approach.
Despite this recognition, the latest developments placed attention on internal dynamics within the network. Market participants reacted quickly as concerns about decentralization surfaced, leading to increased volatility in TAO’s valuation.
The situation also drew attention to broader discussions around decentralized AI systems. Questions emerged regarding how governance structures evolve as projects scale and attract more contributors.
At the time of reporting, no additional clarification from the Bittensor core team had been referenced in the initial statement. The absence of an immediate response left market participants assessing the available information.
TAO’s decline followed a period of steady activity, making the sudden movement notable within the digital asset market. Traders and observers continue to monitor developments as further details may emerge from involved parties.


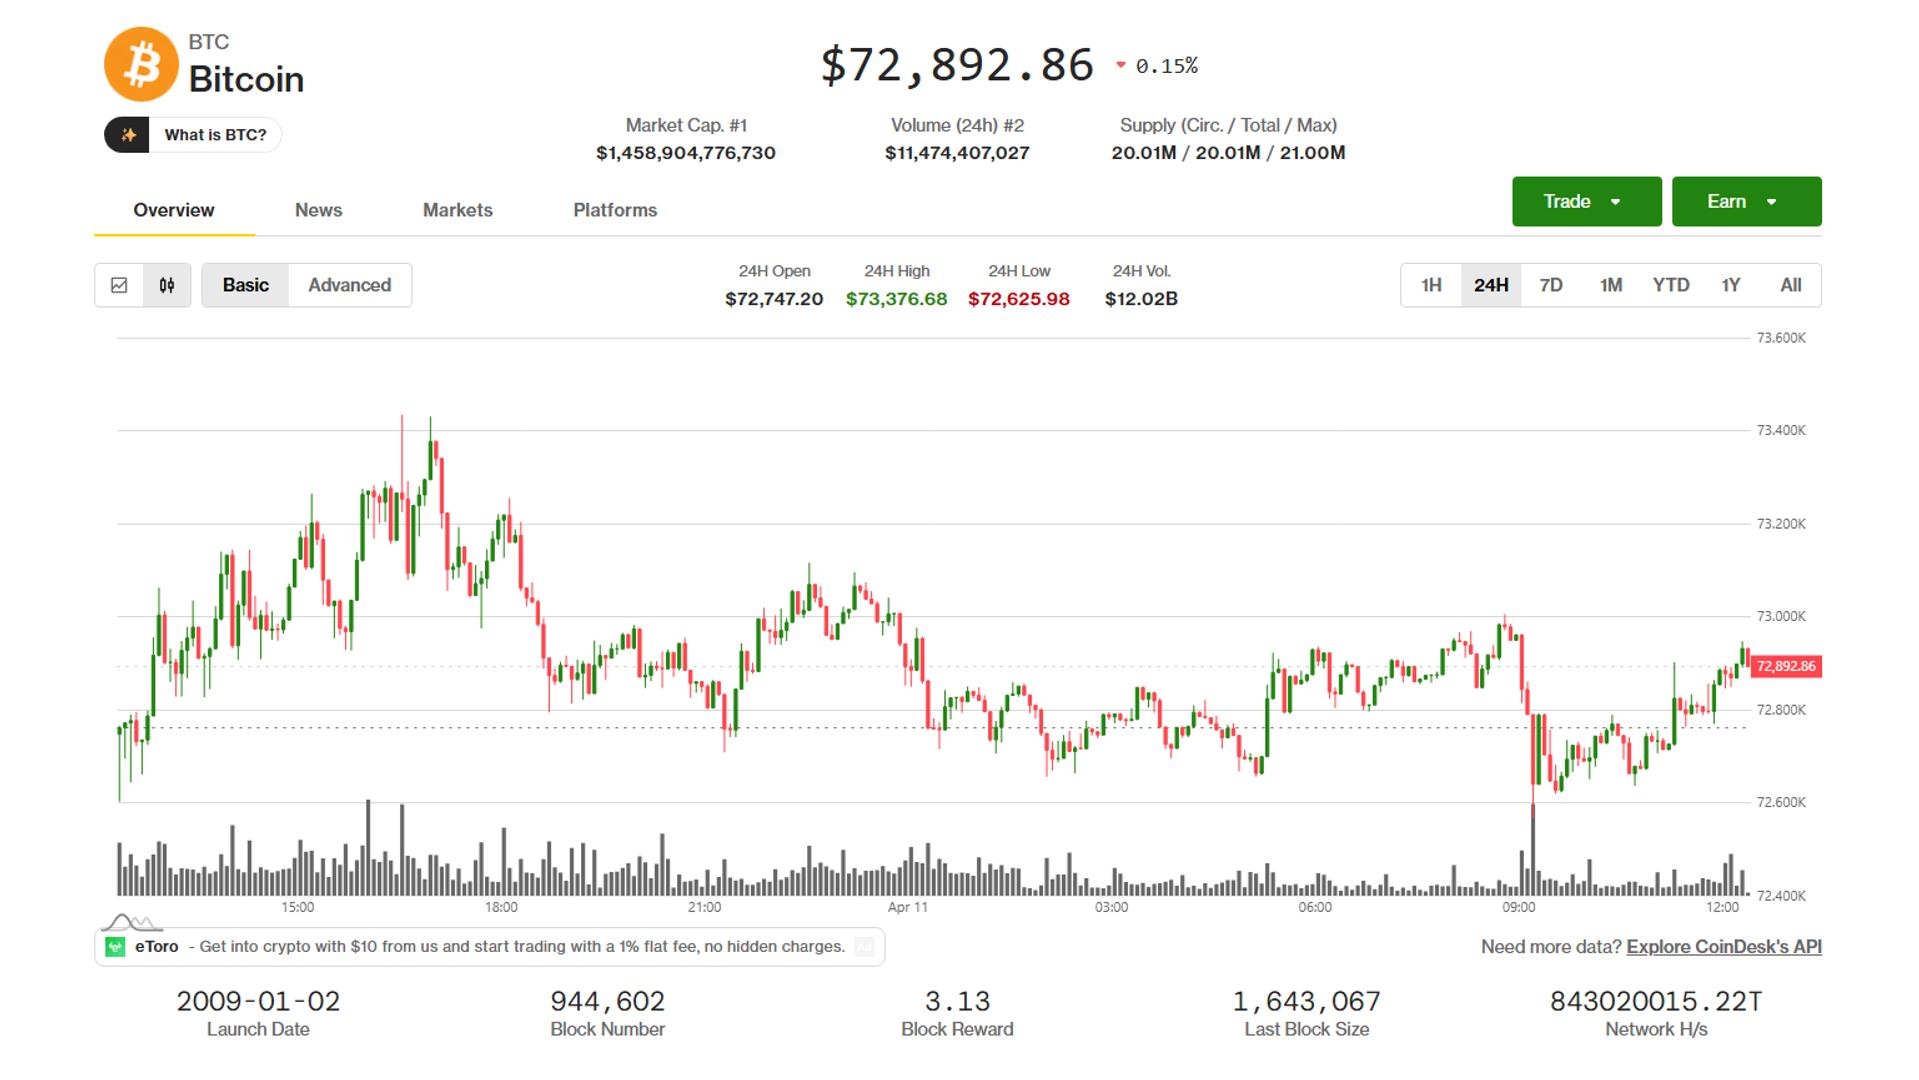
Bitcoin is trading below $73,000 on Saturday, down roughly 0.2% in 24 hours, as U.S. and Iranian officials opened high-level talks in Islamabad. The broader crypto market is mostly flat.
The market rose over the week after a two-week ceasefire was announced, triggering a derivatives short squeeze that wiped out over $430 million in bearish positions.
The CoinDesk 20 index was trading up about 0.12% over the past 24 hours, while Ethereum (ETH) was up about 0.1%. Other major cryptocurrencies saw similarly small moves.
The U.S.-Iran truce remains fragile, with Israel continuing airstrikes against Lebanon and Iran announcing it will charge ships a toll to pass through the Strait of Hormuz, prompting criticism from U.S. President Donald Trump.
CNN reported earlier Saturday that Vice President J.D. Vance, special envoy Steve Witkoff and Jared Kushner, who does not hold a formal position with the U.S. government but is Trump’s son-in-law, are leading the U.S. side of the talks. Iran’s delegation includes its Foreign Minister, Abbas Araghchi, and Parliament Speaker Mohammad Bagher Ghalibaf, according to The New York Times. Pakistan itself is a third party to the talks.
Some ships have passed through the Strait of Hormuz on Saturday, after traffic through the vital maritime route collapsed when U.S. strikes against Iran began at the end of February.
Read more: Iran war oil-price shock revives inflation trade and a new stablecoin play


As the war with Iran and the closure of the Strait of Hormuz send oil prices higher, inflation is once again at the forefront of investors’ minds.
In the U.S., inflation accelerated last month to 0.9%, driven mostly by energy costs linked to the Middle East conflict; core inflation, which excludes energy and food costs, surprisingly fell short of estimates. February’s headline increase was just 0.3%.
For Michael Ashton, co-founder of the USDi stablecoin along with Andrew Fately, the figures underscore a flaw in crypto’s monetary architecture.
“The stablecoin boom has accidentally rebuilt only half of the monetary system,” Ashton told CoinDesk in an interview. “Stablecoins solved the medium-of-exchange problem for crypto, but nobody solved the store-of-value problem. USDi is the first serious attempt to finish building the monetary system onchain.”
The $300 billion stablecoin market, dominated by dollar-pegged tokens, has become essential plumbing for crypto trading and payments. But those tokens, typically backed by cash or Treasury bills, are designed to hold a nominal value of $1, not preserve purchasing power. In real terms, Ashton argues, they are losing value.
“As stablecoins graduate from crypto-trading tools to genuine payment infrastructure, the store-of-value gap becomes a real institutional concern, not just a philosophical one,” he said. “Treasurers, neobanks, and cross-border payment platforms holding float in stablecoins are quietly taking inflation risk they probably haven’t priced.”
USDi
USDi is an attempt to fill that gap.
Instead of tracking the dollar, the token is designed to track inflation itself. Its value increases in line with changes in the U.S. Consumer Price Index (CPI), effectively making it a blockchain-native version of an inflation-protected principal.
Ashton describes USDi as closer to the principal value of Treasury Inflation-Protected Securities (TIPS), but without some of the drawbacks that have caught investors off guard in recent years.
While TIPS offer inflation linkage, they are still bonds, meaning their market price can fall when interest rates rise. USDi, by contrast, aims to function more like an inflation-linked savings instrument.
The stablecoin’s reserves are invested in a in a low-volatility private fund called the Enduring U.S. Inflation Tracking Fund, which uses TIPS, U.S. Treasury debt, foreign exchange and commodity futures and options; to generate return.
“There isn’t really an inflation-protected savings account,” Ashton said. “That’s the gap we’re trying to fill.”
Oil-fueled inflation
Oil markets have been on a sharp and volatile upswing since the outbreak of the Iran war in late February. Prices initially jumped into the $80s before rapidly breaking above $100 a barrel as fears mounted over disruptions to the Strait of Hormuz, a key artery for roughly 20% of global supply.
Elevated oil prices can stoke inflation by raising transportation and production costs across the economy, which are often passed on to consumers in the form of higher prices.
The moves have been marked by extreme volatility, with daily swings driven less by fundamentals than by headlines as markets price in a persistent war premium tied to the risk of prolonged supply disruption
“T-bills are around 3.5%, inflation is around 3%, but historically, inflation has often outpaced short rates over longer periods,” Ashton said. “We may be returning to that pattern.”
The dynamic, he added, strengthens the case for an asset explicitly designed to track inflation rather than nominal yields.
Still, Ashton frames USDi as more than a tactical trade. He sees it as a structural evolution in crypto, one that completes the system bitcoin began.
“Bitcoin was conceived as an alternative monetary system, and potentially as a store of value like gold,” he said. “But its volatility makes it difficult to use that way over shorter horizons. Stablecoins solved the payments side. Now we need to solve the store-of-value side.”
Customizable inflation exposure
Beyond its core design, USDi plans to introduce something Ashton says is difficult, or impossible, to replicate in traditional finance: customizable inflation exposure.
CPI itself is a composite of multiple categories, including housing, health care, transportation and education. USDi’s architecture, Ashton said, could eventually allow users to tailor exposure to specific components of inflation.
“You don’t have to hold one aggregate basket,” he said. “You could isolate health-care inflation, or tuition, or energy. You could even tailor it by geography: Dutch inflation, French inflation, U.S. core CPI.”
That flexibility allows for more specialized applications, particularly in industries with direct exposure to specific cost pressures.
Insurance companies, for example, face inflation risk in areas like medical costs but lack precise hedging tools. Traditionally, they’ve managed such risks by holding more capital or transferring exposure through reinsurance or catastrophe bonds. But those tools are blunt and often unavailable for certain types of inflation risk.
“There’s never really been a direct hedge for something like health-care inflation,” Ashton said. “If you can hedge that exposure more precisely, you can reduce the capital you need to hold, or expand the amount of business you can underwrite.”
He expects insurers and reinsurers to be among the earliest institutional adopters in a second phase of USDi’s rollout.
Other potential applications include education financing. Programs already exist in parts of the U.S. that allow families to prepay tuition years in advance, effectively locking in prices. Ashton sees a tokenized inflation hedge as a more flexible alternative.
“Tuition is a classic inflation risk,” he said. “Being able to hedge that directly, that’s powerful.”
Fundraising
USDi is already up and running, with Ashton targeting a seed raise of around $1.5 million in the coming months.
The broader pitch, however, is less about funding and more about reframing how investors think about risk.
“You’re born with inflation risk,” Ashton said. “You’re not born with credit risk or equity risk.”
Read more: Oil shock, Iran war risk keep crypto investors on sidelines: Grayscale

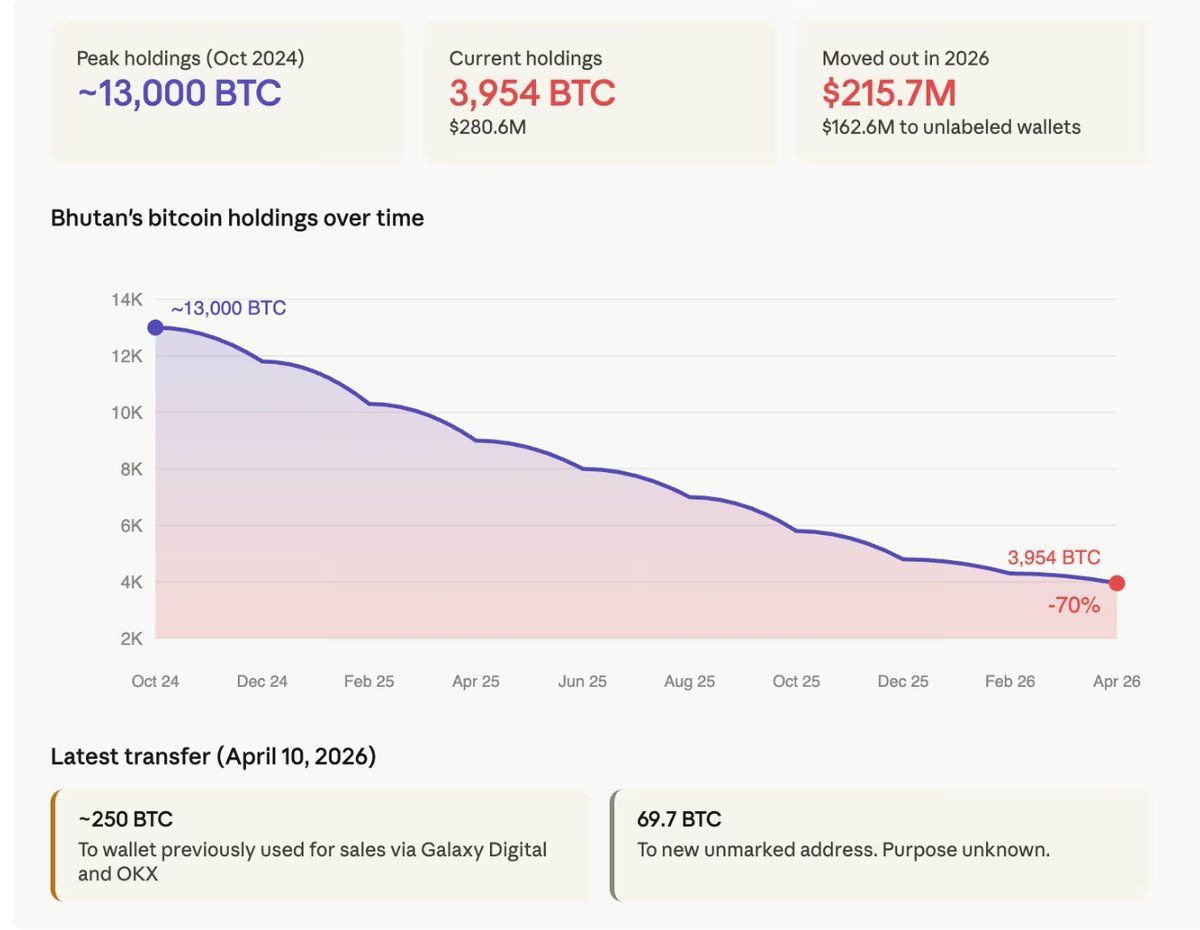
Bhutan has sold over 70% of its Bitcoin (BTC) reserves over the past 18 months, raising questions about the future of its once-celebrated sovereign mining experiment.
On-chain analytics from Arkham Intelligence paint a picture of steady, deliberate liquidation by the Himalayan kingdom’s state-owned investment arm.
Bhutan’s Bitcoin Experiment Loses Steam
Wu Blockchain reported that $215.7 million in BTC was transferred out of the kingdom’s wallets in 2026 alone. In addition, the latest data from Arkham revealed that Bhutan moved out another 250 BTC around 18 hours ago.
The transfer leaves the wallet with nearly 3,774 BTC, a massive drop from 13,000 BTC in October 2024.
Follow us on X to get the latest news as it happens
Druk Holding and Investments (DHI), the state-owned fund that manages Bhutan’s reserves, began mining BTC in 2019 using surplus hydroelectric power. The operation turned a tiny, landlocked Himalayan kingdom into one of the world’s top sovereign holders of Bitcoin.
However, data shows that Bhutan has not received mining inflows exceeding $100,000 in more than a year. That absence has fueled speculation that the kingdom may have halted its hydropower-backed mining operations entirely.
“Bhutan appears to have ceased mining as of ~November 2024,” Arkham posted.
Miners and Treasury Firms Join the Bitcoin Sell-Off
Bhutan is not the only entity reducing its BTC exposure. Several publicly traded miners and Bitcoin treasury firms have accelerated liquidations in recent months, though each for distinct reasons.
Cango sold 2,000 BTC in March to retire outstanding Bitcoin-backed loans, leaving its treasury at 1,025 BTC. MARA sold 15,133 BTC for approximately $1.1 billion between March 4 and March 25 to repurchase $1 billion in convertible notes
Another miner, Riot Platforms, offloaded 3,778 BTC during Q1 2026 for roughly $289.5 million. Notably, additional transfers from both MARA and Riot have been recorded in April, suggesting further sales.
Smaller holders have also trimmed positions. Genius Group liquidated its entire 84.15 BTC treasury on April 1 to repay $8.5 million in debt. Furthermore, Nakamoto Holdings sold approximately 284 BTC in March for about $20 million, resulting in a realized loss relative to its average cost basis.
The wave of selling stands in contrast to MicroStrategy, which purchased 44,377 BTC in March alone and now holds over 766,970 BTC.
Subscribe to our YouTube channel to watch leaders and journalists provide expert insights
The post Bhutan Offloads 70% of Its Bitcoin Stash as Mining Activity Dries Up appeared first on BeInCrypto.

Running a successful crypto presale or ICO requires more than a good project. It requires attention. Investors need to know the sale exists. The crypto community needs to understand what the project does. Industry observers need a reason to take notice. Yet the vast majority of token presales and ICO launches happen with zero professional media coverage, relying entirely on social media hype and community word of mouth to attract participants.
Kooc Media, a PR distribution agency that has served the cryptocurrency and blockchain sectors since 2017, has introduced a dedicated PR service for crypto presales and ICO projects. The service provides guaranteed article placements on established news publications, professional press release writing, same-day global distribution and comprehensive campaign reporting. It is designed to give new token sales the media visibility that directly influences investor confidence and participation rates.
The Difference Between a Funded Presale and a Failed One
Thousands of crypto presales and ICO launches take place every year. Some fill their allocation quickly and go on to build successful projects. Many others fall short of their targets, run out of momentum and quietly disappear. The projects that succeed are not always the ones with the best technology or the most experienced team. They are almost always the ones that more people heard about.
Visibility drives participation. An investor cannot contribute to a presale they do not know exists. A community member cannot advocate for a project they have never encountered. A crypto influencer cannot discuss a token sale they have never seen covered anywhere. Every potential participant who remains unaware of the presale represents lost capital that could have funded the project’s development.
The presales that consistently fill their allocations share a common trait — they generate media coverage that extends their reach beyond their existing network. Articles on crypto news sites, finance publications and blockchain media outlets introduce the project to investors, traders and enthusiasts who were not already following it. Each article widens the funnel of potential participants and reinforces the perception that the project is worth paying attention to.
For most crypto presale and ICO teams, generating that coverage has been extremely difficult. PR agencies refuse cryptocurrency clients. Journalists are overwhelmed with pitches from competing projects. Paid advertising channels are restricted across major platforms. The team is left promoting the presale through Twitter threads, Telegram announcements and direct messages — channels that reach existing followers but struggle to attract new audiences at scale.
Kooc Media provides the media infrastructure that presale and ICO teams need to reach beyond their existing circles. The agency’s crypto PR service has been delivering guaranteed coverage for blockchain projects since 2017 and is now specifically tailored for the unique demands of token sale campaigns.
“A crypto presale without media coverage is like a fundraiser that nobody was invited to,” said Michelle De Gouveia, spokesperson for Kooc Media. “The project might be excellent, but if potential investors do not know the sale is happening, the allocation does not fill. PR solves that problem directly.”
How the Service Supports Presales and ICOs
Kooc Media has structured its presale and ICO PR service around the specific timeline pressures and communication needs of token sale campaigns.
The process begins with content. The agency’s editorial team works with the project to develop press releases that communicate the essential information investors need — what the project does, what problem it solves, how the tokenomics work, what the presale terms are, what the roadmap looks like and why the opportunity matters. The writers have deep experience with blockchain content and understand how to present technical concepts like smart contract functionality, token utility, vesting schedules, DeFi mechanics and governance structures in language that resonates with both crypto-native investors and broader finance audiences.
Publication happens across Kooc Media’s owned news network. The agency operates several established publications including Blockonomi, CoinCentral, MoneyCheck, Parameter, Beanstalk and Computing. These sites cover cryptocurrency, blockchain, finance and technology with strong domain authority built over many years of consistent publishing. Because Kooc Media controls these properties, every placement is guaranteed and publication timing can be coordinated precisely with presale opening dates, ICO phases or any other milestone in the token sale calendar.

Distribution extends through the agency’s partner network, pushing each press release to hundreds of additional outlets and thousands of syndication feeds worldwide. Premium packages place content on major financial platforms including Business Insider, Bloomberg, Benzinga, MarketWatch and USA Today. For a presale project, appearing on these platforms alongside mainstream financial reporting creates a credibility signal that significantly influences investor perception.
Same-day turnaround means coverage can go live on the exact day a presale opens, maximising visibility at the moment when investor action is most needed. Comprehensive post-campaign reports with live links to every placement are delivered promptly.
What Press Coverage Does for a Token Sale
The impact of professional PR on a crypto presale or ICO operates across several dimensions simultaneously.
Investor confidence is the most direct effect. Crypto investors conduct research before committing capital to any token sale. They search for the project name and evaluate what they find. A presale with articles across recognised blockchain and finance publications immediately appears more credible than one with no media presence beyond its own website and social channels. That credibility translates directly into higher participation rates. Investors who were on the fence move toward committing. Investors who had not heard of the project discover it through published coverage and enter the funnel for the first time.
Reach expands beyond the project’s organic audience. Every crypto presale team builds a community through social media before the sale opens. That community represents the project’s existing reach. Press coverage extends that reach to every reader of every publication where an article appears. A single placement on a high-traffic crypto news site can introduce the presale to tens of thousands of potential investors who were not previously aware of it. Multiple placements across different publications multiply that effect.
FOMO dynamics strengthen with media visibility. Crypto presales operate on urgency — limited allocations, time-bound phases, early-bird pricing. Press coverage amplifies that urgency by signalling to the broader market that a sale is happening and generating attention. Investors who see a project covered across multiple publications are more likely to act quickly than those who encounter it only through a single social media post.

Search visibility improves immediately. Investors researching a presale search for the project name and related terms like “crypto presale,” “ICO launch,” “new token sale,” “best crypto presale,” “upcoming ICO” or “token launch.” Articles on high-authority domains rank well for these searches, ensuring that investors conducting due diligence find published coverage that reinforces the project’s legitimacy. The backlinks generated also strengthen the project’s own website rankings over time.
Post-sale credibility carries forward. The media coverage generated during a presale does not expire when the sale ends. Published articles remain online and searchable, continuing to build brand recognition and trust as the project moves into development, exchange listings and ecosystem growth. The coverage becomes a permanent asset that supports every subsequent phase of the project’s lifecycle.
Packages for Every Token Sale Structure
Crypto presales and ICOs follow different structures and timelines. Kooc Media accommodates all of them.
Launch packages deliver coordinated multi-publication coverage timed to presale opening dates or ICO kickoff. These create maximum visibility at the exact moment investor participation matters most.
Phased packages support token sales that operate across multiple rounds. Each phase receives its own coverage push, maintaining momentum throughout the entire sale period rather than concentrating all visibility at the start.
Custom campaigns address complex sale structures. A project running a private round before a public presale might need separate coverage targeting institutional investors and retail participants. An ICO with a tiered pricing model might need phased announcements highlighting each new tier. Projects combining token sales with gambling or iGaming platforms can access parallel distribution reaching both crypto investors and gaming audiences.
About Kooc Media
Kooc Media is a PR distribution agency founded in 2017, specialising in cryptocurrency, blockchain, fintech, technology and iGaming. The company operates its own network of news publications and distributes content through a broad global partner network to guarantee media placements. Services include press release writing, sponsored articles, homepage features, newswire distribution and fully managed campaigns.
Kooc Media’s Crypto PR packages are available now through the company’s website at https://kooc.co.uk.

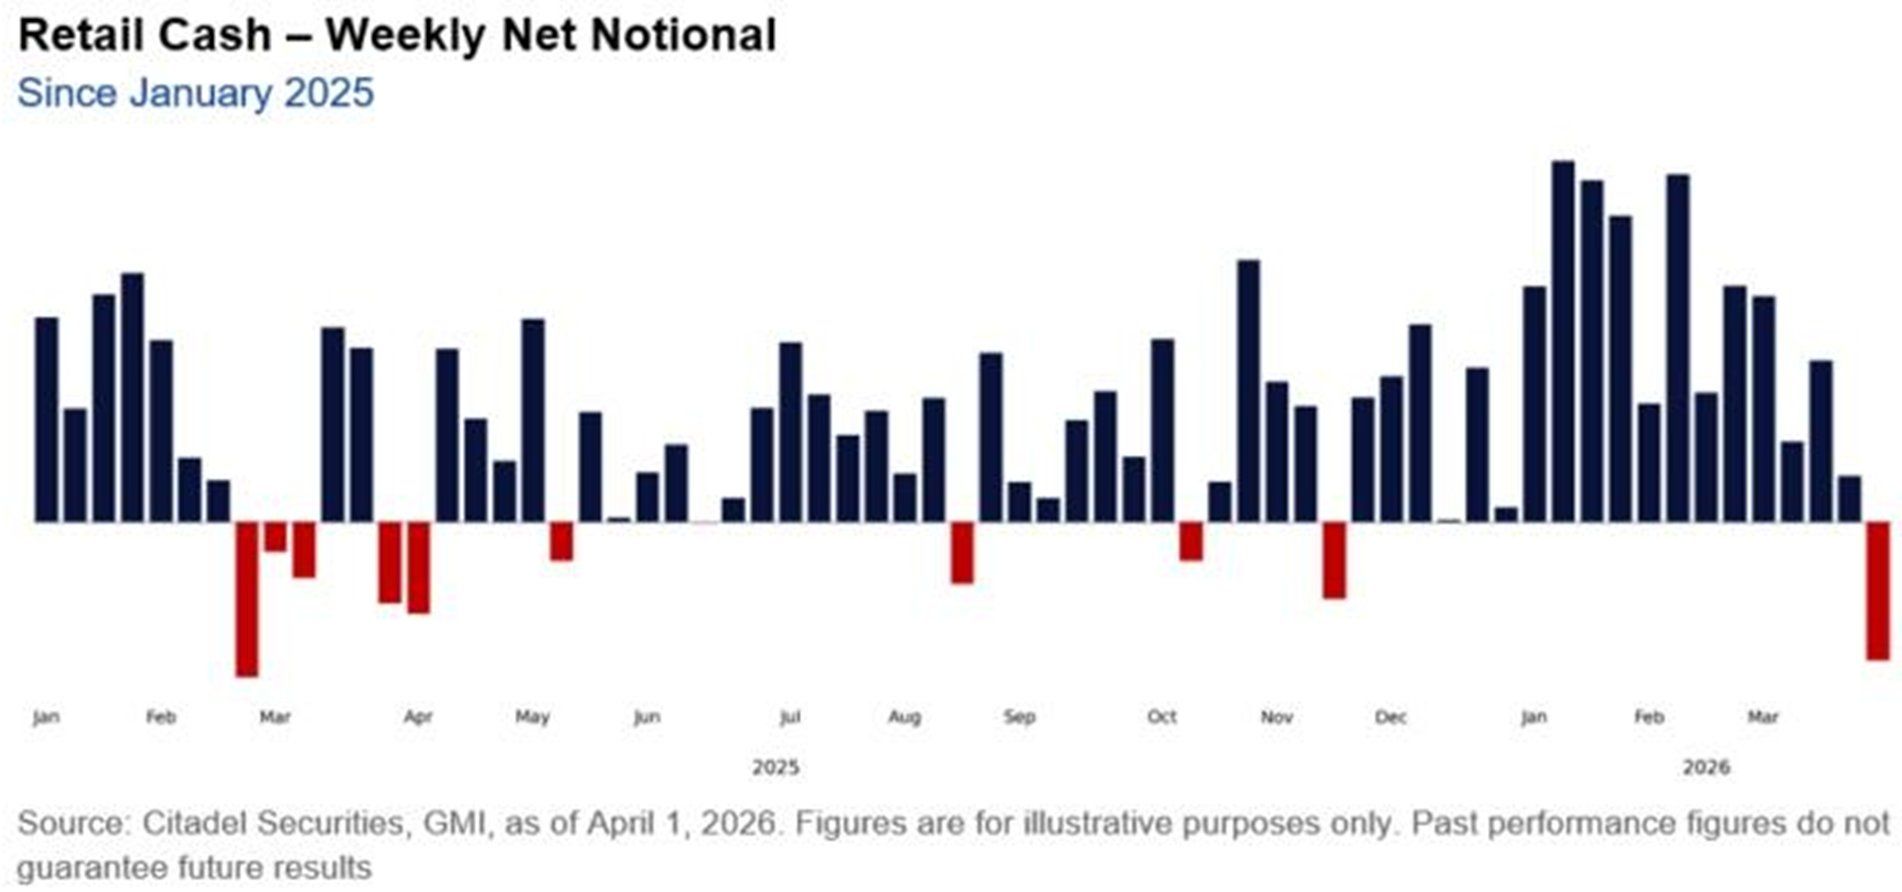
Retail investors became net sellers of stocks last week, making a bearish shift in positioning since late November 2025.
The selling came amid a notable rally in US equities, with the S&P 500 rebounding to recover nearly all of its war-driven losses.
Retail Capitulation Meets Renewed Rally
Mom-and-pop investor participation has slowed sharply. Global Markets Investor reported that retail stock purchases have declined approximately 70% from January highs.
“Retail investors turned bearish at the worst possible time: Retail SOLD stocks last week for the first time since November 2025,” Global Markets Investor wrote.
Between March 27 and April 2, retail traders also spent a record $275 million in net put options premium, the largest five-day total in nearly a year.
The defensive positioning stands in direct contrast to the index’s sharp recovery, fueled by the US-Iran ceasefire announcement that sent oil prices lower and reignited risk appetite.
Scott Rubner, head of equity and equity derivatives strategy at Citadel Securities, noted that retail net selling has occurred just 18 times since January 2020. That rarity carries a contrarian signal.
Following similar episodes, the S&P 500 has risen approximately 82% of the time within the subsequent two months, delivering an average gain of 4.1%.
Follow us on X to get the latest news as it happens
History Favors A Stock Market Rally
Meanwhile, the Kobeissi Letter noted that the S&P 500 posted seven consecutive green sessions, gaining roughly 7.6%, its longest winning streak since October 2025.
The analysts explained that since the 1950s, the S&P 500 has recorded a similar winning run with at least a 7.0% gain only nine other times.
In eight of those nine instances, the index was higher one month later, with an average return of +4.4%. Over the following three months, it gained in seven cases, with an average return of +10.2%.
“History says market momentum is set to continue,” the post read.
Breadth has also improved. Roughly 65% of stocks in the Invesco QQQ Trust (QQQ) now trade above their 10-day moving averages, a 40-point jump in just five sessions.
Seasonal patterns add another tailwind. April has historically been one of the strongest months for equities. The MSCI World Index has posted gains roughly 75% of the time, with an average return of about 2% over the past 25 years.
Taken together, the divergence between cautious retail positioning and strengthening market internals suggests the current rally may still have room to run.
If historical patterns hold, retail capitulation could once again act as a contrarian signal, supporting further upside in equities over the near term.
Subscribe to our YouTube channel to watch leaders and journalists provide expert insights
The post Retail Investors Sold US Stocks for the First Time Since November appeared first on BeInCrypto.

March’s U.S. jobs report showed the economy adding 178,000 payrolls, a modest gain that left the overall pace of hiring largely unchanged from the prior month, according to the Bureau of Labor Statistics. The broader employment landscape unfolded against a backdrop of policy shifts, rising energy costs tied to geopolitical tension, and fresh research suggesting AI could be reshaping how work gets done even if it isn’t translating into uniform job expansion across sectors.
While proponents of artificial intelligence tout an era of productivity-driven growth, the latest numbers underscore a complex reality: the promised boom may be uneven, and the link between AI adoption and net hiring remains nuanced. In March, while healthcare and construction led the job gains, the tech sector showed little net acceleration and even registered some cutbacks in related services. That divergence highlights a broader dynamic as businesses experiment with AI tools while reassessing roles and staffing needs.
Key takeaways
- March posted 178,000 new jobs, with healthcare adding 76,000, construction 26,000, transportation and warehousing 21,000, and social assistance 14,000; the tech sector saw muted growth and declines in some related services (computer systems design down 13,000).
- Openings in technology roles have risen in reported counts—Business Insider cites data from TrueUp showing tech job openings doubling to about 67,000 since 2023—yet this hasn’t necessarily translated into equivalent hires.
- Industry analyses suggest AI-driven displacement could be real and lingering: Goldman Sachs, cited by Fortune, has estimated that AI-related job cuts could amount to roughly 16,000 roles per month across the economy.
- Executive optimism about AI persists even as workers report growing frustration: 80% of leaders use AI weekly with 74% noting positive early returns (Harvard Business Review), while Mercer finds 43% of workers say their jobs are more frustrating due to AI adoption, and only 14% report net-positive AI outcomes (Workday).
- OpenAI has released policy proposals intended to address the workforce transition, emphasizing that policy must keep pace with technology to preserve safety nets and social supports (Industrial Policy for the Intelligence Age).
AI’s mixed signal in the March payrolls
The March Labor Department figures show a broad distribution of gains across industries, with healthcare leading the charge and other non-tech sectors contributing significantly. Specifically, 76,000 new healthcare jobs were added, followed by 26,000 in construction, 21,000 in transportation and warehousing, and 14,000 in social assistance. By contrast, demand in computing-related services wasn’t as robust; related services like computer systems design contracted by about 13,000 jobs, and computing infrastructure providers registered a modest decline of around 1,500 positions.
These patterns matter because they illustrate how AI adoption is translating into real-world labor needs. While automation and AI are often pitched as accelerants of hiring through productivity gains, the March data point to a more uneven distribution of impact—where some sectors still rely on human labor to deliver growth while others grapple with substitution dynamics.
Hiring resilience vs. openings and the AI disruption debate
Beyond the headline payroll gain, job-market research paints a more complicated picture. Tech job openings have reportedly surged in recent periods—Business Insider cites TrueUp data indicating openings rose to about 67,000, up from 2023 levels—but that doesn’t automatically imply immediate increases in hiring. The discrepancy between openings and actual hires underscores a tension at the core of the AI transition: firms may be signaling demand for tech capabilities while tightening headcounts elsewhere or delaying new hires as they test AI-enabled workflows.
On the broader disruption front, Goldman Sachs has estimated that AI-driven displacement could be meaningful and persistent, highlighting the potential of ongoing shifts in entry-level hiring and routine tasks. Fortune’s coverage of the bank’s analysis notes a roughly 16,000-jobs-per-month impact, a rate that could exert lasting pressure on early-career pathways. These dynamics come as executives weigh the productivity benefits of AI against the costs of retraining, redeploying, or replacing workers over time.
Industry observers also point to historical patterns: the tech sector’s expansion has often been tied to cycles of funding, team growth, and shifts in job mix. A 2025 SignalFire study found that new-graduate hiring fell by about half from pre-pandemic levels, suggesting a structural recalibration in how and where early-career talent enters the labor market—an environment where AI-enabled processes may further alter talent pipelines.
Executive optimism, worker experience, and the policy front
There is a marked optimism among corporate leaders about AI’s strategic value. The Harvard Business Review reports that about 80% of leaders say they use AI on a weekly basis, with 74% indicating positive returns on early deployments. Yet the same period reveals a more febrile sentiment among workers. Mercer’s survey found that 43% of workers felt their jobs were more frustrating amid AI implementation, a sentiment echoed by broader productivity data.
One practical source of friction is the uneven quality of AI outputs in day-to-day work. Workday’s findings indicate that for every 10 hours of time saved through AI, nearly four hours are consumed by correcting outputs, undermining net efficiency gains. The problem isn’t limited to accuracy; researchers have highlighted phenomena like “workslop”—AI-generated content that looks polished but carries little substantive value, shifting cognitive workload onto colleagues and eroding trust and collaboration.
In parallel, OpenAI has signaled a willingness to engage policy-makers and industry players in shaping the transition. The organization released a set of policy proposals described as intentionally early and exploratory, aimed at sparking discussion around healthcare coverage, retirement savings, and a broader industrial-policy framework for the AI era. The document emphasizes a core warning: without policy alignment with technological advancement, the institutions and safety nets designed to guide workers through the transition could fall behind.
Taken together, the data point to a paradox: AI tools are increasingly central to strategic decision-making at the executive level, yet the benefits at the frontline depend on how well organizations manage implementation, training, and governance. The tension between the high-level potential of AI and the realities of day-to-day workflows remains a defining feature of the current labor market landscape.
For readers tracking industry shifts, the questions remain: will AI-led productivity spur durable employment gains across more sectors, or will displacement and upskilling needs slow the path to broad-based adoption? How quickly will policy, corporate strategy, and worker retraining align to maximize benefits while mitigating costs?
OpenAI’s policy framework and the evolving workplace experiments with AI will likely shape the answers in the months ahead. Investors and builders should watch for sector-specific hiring trends, the pace of AI-driven efficiency gains in core operations, and how firms respond to workers’ concerns about job quality and stability as automation deepens across the economy.
Additionally, the March data and related analyses underscore a broader market frame: technology-driven transformations are real and ongoing, but their immediate impact on hiring is heterogeneous. As institutions refine AI implementations and policymakers weigh timely safeguards, the next set of official payroll numbers and corporate earnings updates will be critical barometers of how quickly the labor market can adapt to an AI-enabled economy.
What’s next to watch: the next Bureau of Labor Statistics release, further employer surveys on AI integration, and policy developments around industrial strategy and social safety nets. These signals will help determine whether AI accelerates a broader, sustainable job-creating cycle or reinforces a gradual reallocation of labor toward higher-skill tasks while placing pressure on entry-level hiring.
Crypto World
Crypto TradFi perpetuals are predicting the direct of Wall Street’s Monday open with 89% accuracy
Crypto exchanges are starting to take on a new role: pricing traditional assets while Wall Street is closed.
The growing market for perpetual futures contracts tied to traditional financial instruments including commodities like gold and oil that runs around the clock on cryptocurrency exchanges is responsible.
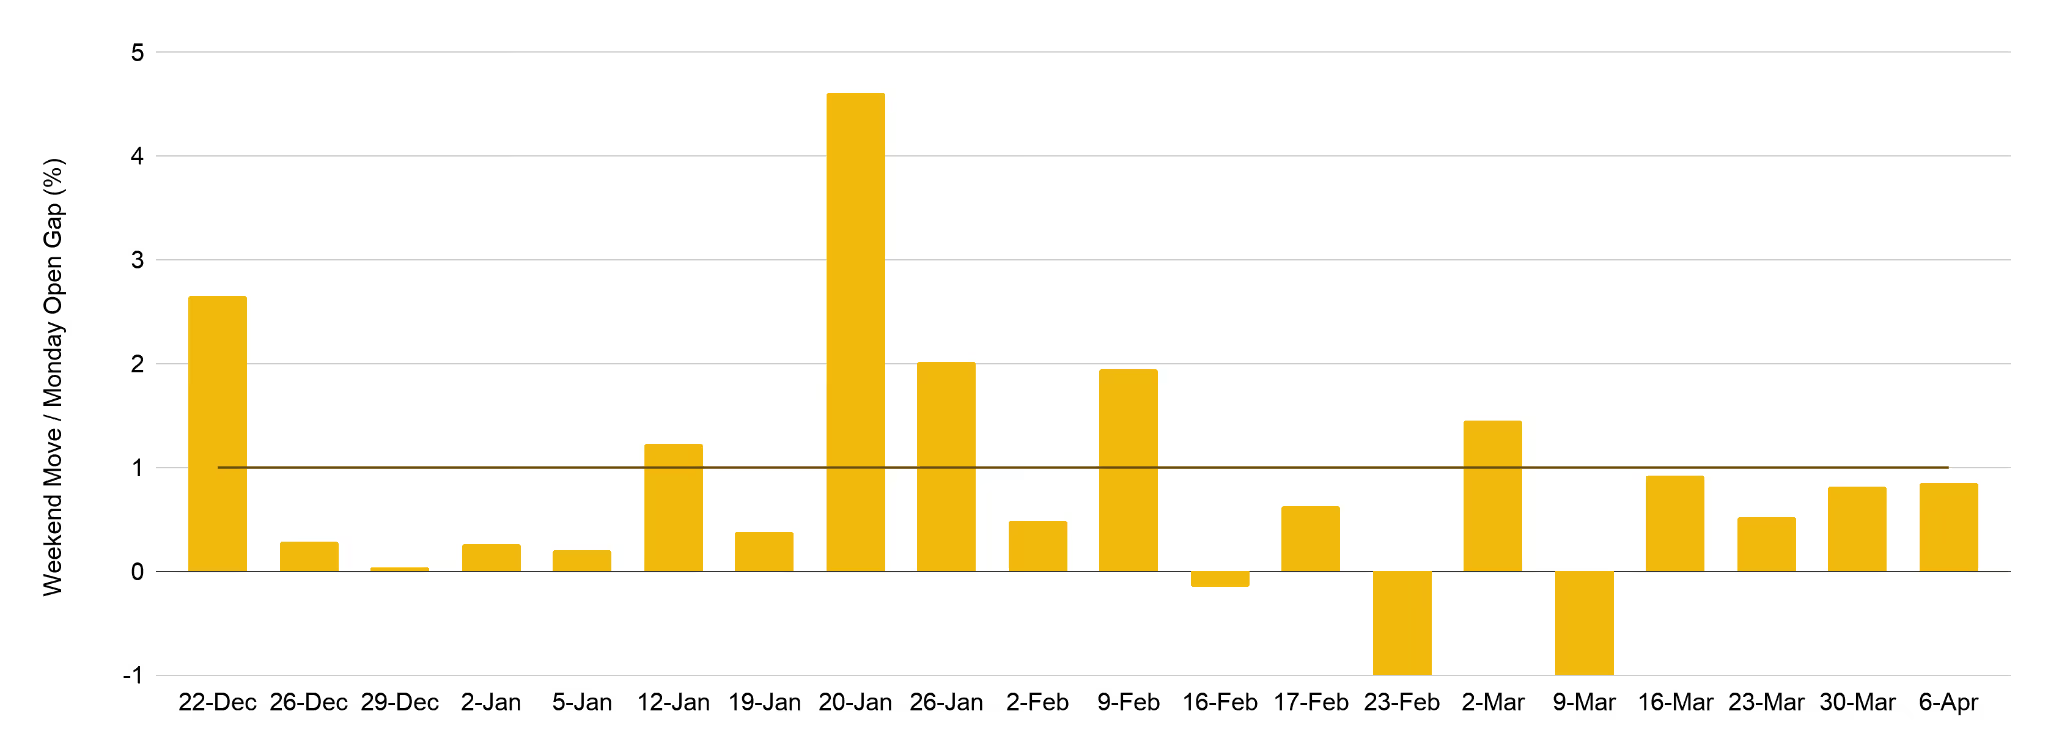
Data from Binance Research suggests these markets, which hit $31 billion in weekly trading volume on commodities volatility, are doing more than filling idle hours. Weekend price moves in gold-linked perps correctly predict the direction of Monday’s opening in traditional futures about 89% of the time, Binance found. The correlation between the two sits near 0.80, indicating a strong relationship.
The report finds a median “capture ratio” of 57%, meaning more than half of the expected move is already reflected in crypto markets before traditional exchanges open.

The extreme volatility seen over the war in Iran serves as an example. As tensions rose over the weekend of February 28 to March 1, trading volume in these contracts surged to $8.1 billion, far above typical levels. Traders used the market to hedge and react in real time while traditional venues were closed.
Weekend activity has grown steadily over the past month as volumes now average about 38% of weekday levels, according to Binance’s data.
“While the magnitude of price discovery still has room for improvement, directional accuracy is already compelling,” the firm wrote. “Weekend perpetual price movements correctly predict the direction of Monday’s opening gap 89% of the time. For traders seeking to position ahead of Monday’s open or manage weekend risk, this level of directional reliability makes TradFi-perps a valuable signal source.”
These products also offer other advantages by bringing financial instruments that would otherwise have forced crypto holders to off-ramp to access directly into their platfforms.
Read more: Traders are the big winners as 24/7 stocks will finally end the after-hours price ‘manipulation’

Key Highlights
- Citigroup downgraded DocuSign from Buy to Neutral, reducing its price target dramatically from $99 to $50
- Shares declined approximately 6% following the announcement, continuing a multi-day slide
- The company’s fiscal 2026 revenue expansion of only 8% raised valuation concerns
- Emerging AI-powered competitors pose potential disruption threats to traditional SaaS business models
- Year-to-date performance shows DOCU down approximately 34.5%, trading more than 54% below its peak
DocuSign experienced a particularly challenging week as shares tumbled following a significant analyst downgrade. On April 10, Citigroup shifted its rating on the digital signature provider from Buy to Neutral while simultaneously slashing its price objective from $99 down to $50. The dramatic reduction caught investor attention and triggered immediate selling.
The downgrade centered on a fundamental concern: revenue expansion. DocuSign reported fiscal 2026 revenue growth of merely 8%. For a technology company that historically traded at premium multiples, such modest single-digit expansion creates a challenging narrative for investors anticipating stronger performance.
Citi’s research analyst emphasized that the decelerated growth trajectory makes the stock’s previous valuation levels difficult to support. The revised $50 price objective signals a substantially more conservative outlook on the company’s near-term potential.
The Citigroup rating cut didn’t occur in isolation. One trading session prior, DOCU shares had already declined 4.4% as market-wide nervousness intensified.
Some of that previous session’s weakness stemmed from geopolitical developments — news surrounding a ceasefire collapse in Middle Eastern regions unsettled markets and prompted investors to reduce exposure to growth-oriented technology names.
However, another catalyst hit particularly close to the software sector. Anthropic’s introduction of Managed Agents — autonomous artificial intelligence systems capable of executing sophisticated, multi-stage workflows — sparked concerns that conventional SaaS applications might face meaningful competition from AI-first platforms.
Artificial Intelligence Rivals Create Uncertainty
The concern carries substance. Should AI-powered agents successfully replicate functionality currently delivered by specialized software platforms like DocuSign, the total addressable market for such solutions could contract significantly over time.
Notable short seller Michael Burry contributed to the apprehension with a social media comment (later deleted) suggesting Anthropic[[/LINK_END_3]] was undermining Palantir’s business. Though the post was swiftly removed, market participants took notice — amplifying broader concerns regarding established SaaS providers.
It’s notable that DOCU has experienced 16 separate trading sessions with single-day price movements exceeding 5% throughout the past year. The equity clearly responds sharply to developments, with investors rapidly adjusting their valuations.
Current Trading Position
At a price of $42.49 per share, DocuSign currently trades 54.7% beneath its 52-week peak of $93.84, which the stock reached in June 2025.
Since the beginning of the calendar year, shares have declined approximately 34.5%. That represents a substantial contraction in barely more than a fiscal quarter.
For perspective: an investor who allocated $1,000 to DocuSign stock five years ago would currently hold a position valued at roughly $199.
The technical analysis also presents challenges. Daily trading volume has averaged north of 5 million shares, while technical momentum indicators currently flash a Sell signal.
The company’s market capitalization now stands at approximately $8.86 billion, representing a meaningful decrease from levels reached during periods of stronger growth expectations.
Citigroup’s $50 price objective represents the most recent Wall Street analyst adjustment for the security.

Key Points
- Super Micro Computer shares rallied approximately 9% Friday following the Gold Series server announcement.
- The new Gold Series features more than 25 ready-to-deploy server configurations designed for AI, cloud computing, and data storage applications.
- All systems ship within a three-business-day window and arrive fully equipped with processors, graphics cards, RAM, and storage drives.
- Company CEO Charles Liang emphasized the platform reduces delivery timelines and speeds up customer implementation.
- Despite Friday’s rally, SMCI remains down 18.3% in 2025 and trades 58.3% beneath its 52-week peak of $60.71.
Super Micro Computer (SMCI) posted a roughly 9% gain Friday after introducing its Gold Series enterprise server portfolio, a ready-to-ship platform designed to accelerate deployment timelines for business clients.
Super Micro Computer, Inc., SMCI
The Gold Series encompasses more than 25 distinct server models selected from Super Micro’s current product catalog. The lineup includes both single-socket and dual-socket architectures, each engineered for artificial intelligence, cloud infrastructure, and storage operations.
Every configuration arrives fully integrated with central processing units, graphics processing units, memory modules, and storage components. According to the company, all orders leave distribution centers within three business days of placement.
CEO Charles Liang positioned the initiative as a velocity-focused strategy. “We make our industry-leading server portfolio available to our customers even faster, significantly shortening lead times and accelerating their time-to-online,” he stated.
Another Significant Swing for a High-Volatility Equity
SMCI has experienced 48 single-day movements exceeding 5% during the past twelve months. Friday’s advance continues this established volatility pattern — notable in magnitude, yet not necessarily indicative of shifting sentiment on the company’s fundamental outlook.
The most recent substantial decline occurred eleven days prior when shares dropped 5.4%. That selloff coincided with escalating geopolitical tensions that pushed both the Dow Jones Industrial Average and Nasdaq Composite into correction territory, each declining over 10% from recent peaks. Climbing crude oil prices and inflation concerns triggered widespread equity market weakness.
Friday’s positive session doesn’t reverse those losses. SMCI continues trading down 18.3% year-to-date.
Current Valuation Context
Trading at $25.30 per share, SMCI sits 58.3% below its 52-week high of $60.71, established in July 2025.
Despite recent volatility, investors with longer holding periods maintain substantial appreciation. A $1,000 investment in Super Micro five years ago would currently be valued at approximately $6,321.
The Gold Series introduction arrives as Super Micro expands its presence in the enterprise artificial intelligence infrastructure market. The emphasis on rapid fulfillment and turnkey configurations indicates the company is pursuing customers prioritizing deployment speed and operational simplicity over customized solutions.
The company did not release revised revenue projections or earnings estimates alongside Friday’s product unveiling.

IBM settles its DEI lawsuit with the DOJ for $17 million

XRP I’M SCARED !!!! 1300 DAY MR POOL WARNING !!!!

Newscast – US-Iran Peace Talks + Artemis II Returns


-

 Business6 days ago
Three Gulf funds agree to back Paramount’s $81 billion takeover of Warner, WSJ reports
-

 Sports7 days ago
India men’s 4x400m and mixed 4x100m relay teams register big progress | Other Sports News
-

 Politics22 hours ago
US brings back mandatory military draft registration
-

 Fashion23 hours ago
Weekend Open Thread: Veronica Beard
-

 Tech4 days ago
How Long Can You Drive With Expired Registration? What Florida Law Says
-

 Business6 days ago
No Jackpot Winner, Prize to Climb to $231 Million
-

 Fashion5 days ago
Massimo Dutti Offers Inspiration for Your Summer Mood Board
-
 Sports23 hours ago
Man United discover Nico Schlotterbeck transfer fee as defender reaches Dortmund agreement
-

 Fashion4 days ago
Let’s Discuss: DEI in 2026
-

 Crypto World3 days ago
Bitcoin recovers as US and Iran Agree a Ceasefire Deal
-

 Crypto World2 days ago
Canary Capital Files SEC Registration for PEPE ETF
-

 Business20 hours ago
Tesla Model Y Tops China Auto Sales in March 2026 With 39,827 Registrations, Beating Cheaper EVs and Gas Cars
-

 Business7 days ago
Akebia Therapeutics, Inc. (AKBA) Discusses Pipeline Progress and Strategic Focus on Kidney Disease Treatments at R&D Day – Slideshow
-

 Politics1 day ago
Malcolm In The Middle OG Turned Down ‘Buckets Of Money’ To Appear In Reboot
-

 Business1 day ago
OpenAI Halts Stargate UK Data Centre Project Over Energy Costs and Copyright Row
-

 Tech5 days ago
Haier is betting big that your next TV purchase will be one of these
-

 Tech5 days ago
Gamer Restores the Original PlayStation Portal From Two Decades Ago
-

 Tech5 days ago
The Xiaomi 17 Ultra has some impressive add-ons that make snapping photos really fun
-

 Tech5 days ago
Samsung just gave up on its own Messages app
-

 Tech5 days ago
Save $130 on the Samsung Galaxy Watch 8 Classic: rotating bezel, sleep coaching, and running coach for $369
You must be logged in to post a comment Login