

Crypto World
Imbalance Trading in Forex and CFDs
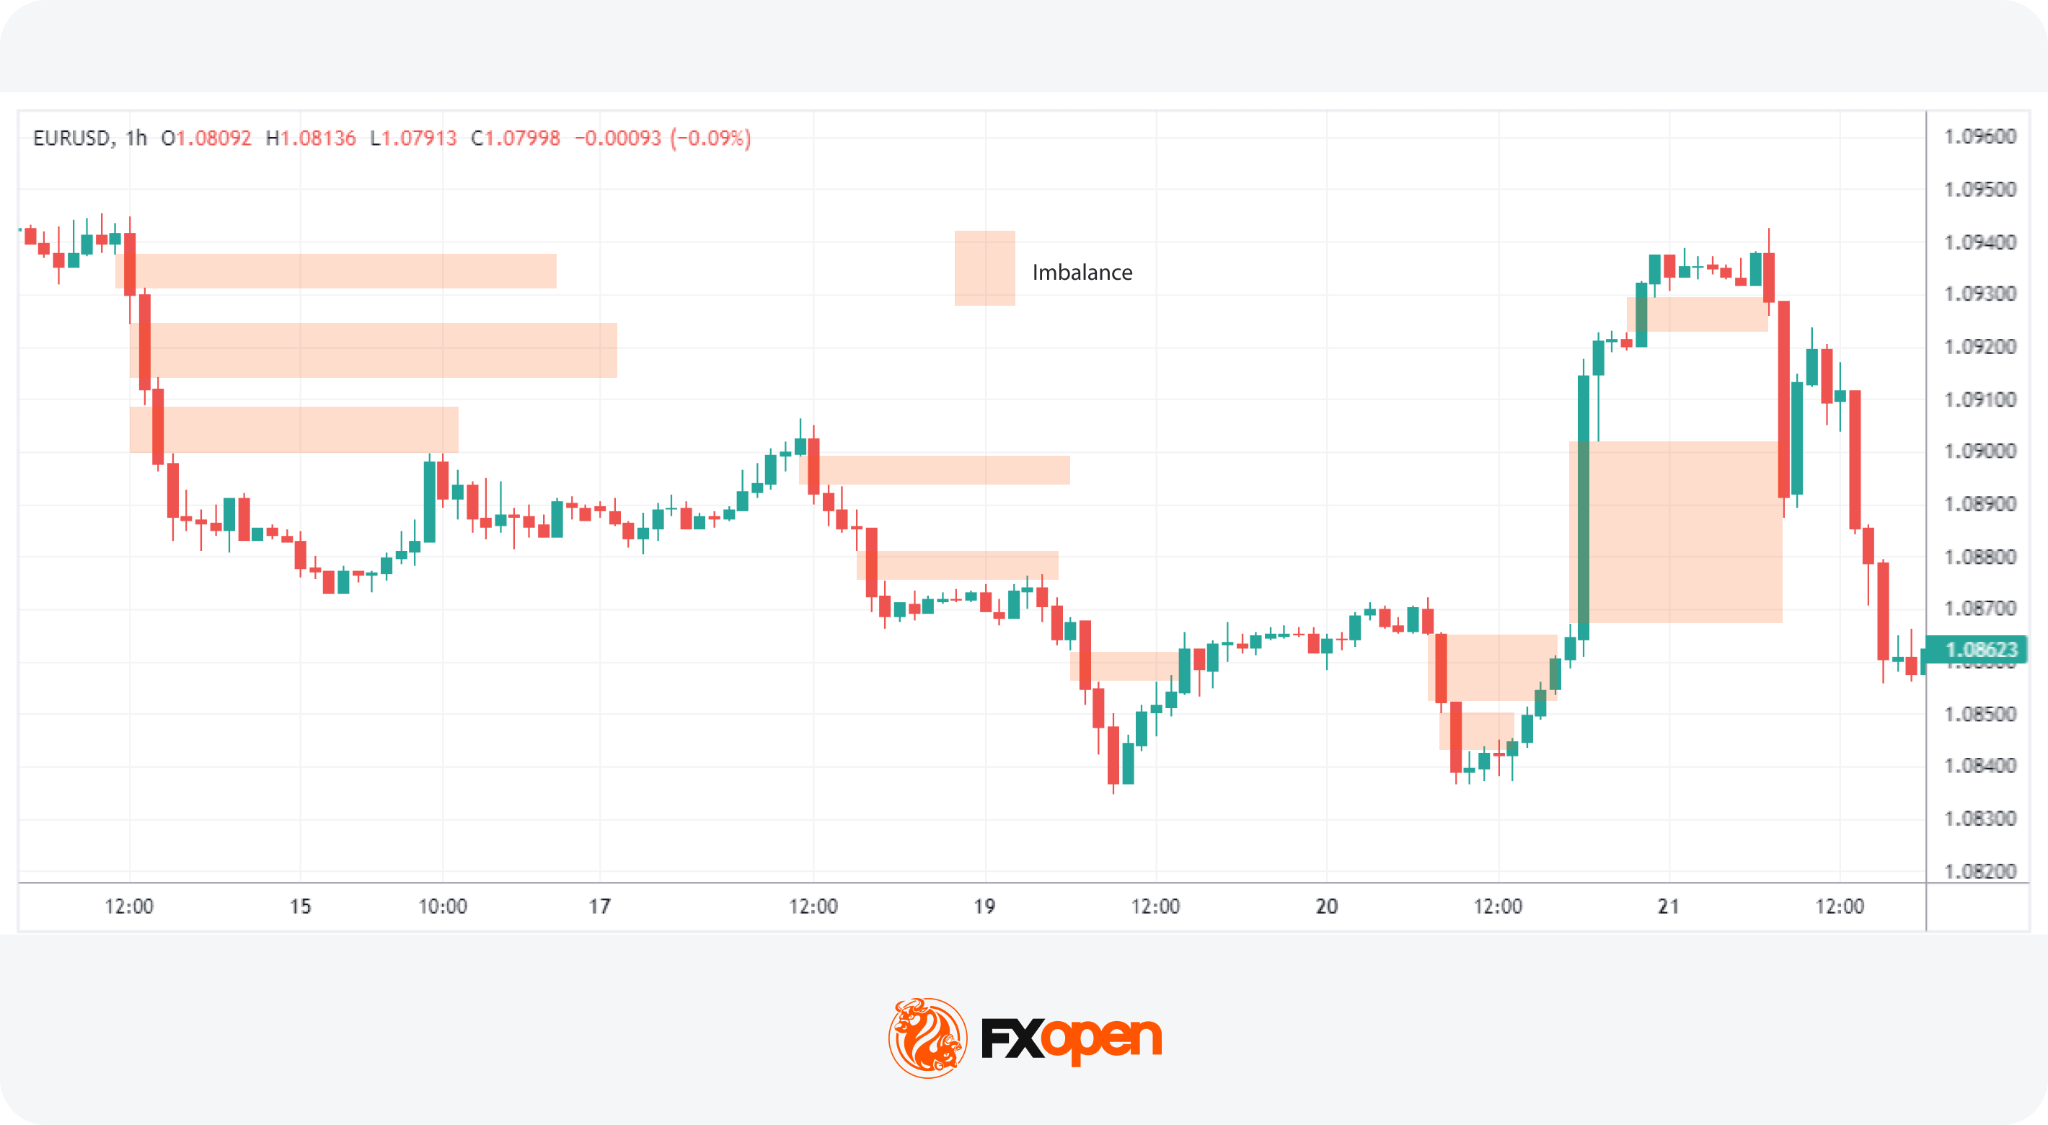
An imbalance in trading is a price zone where supply or demand heavily outweighs the opposite side, causing a sharp directional move with little trading in between. These zones sit at the heart of Smart Money Concept analysis. They shape how traders read momentum, structure, and entry points across forex and CFDs.
This article covers what drives imbalance in forex and CFDs and how it shows up on a chart. It walks through how an imbalance trading strategy may be built around price action, the link between an order flow imbalance and liquidity, and the difference between imbalance zones, fair value gaps, and order blocks.
What Is Imbalance in Trading?
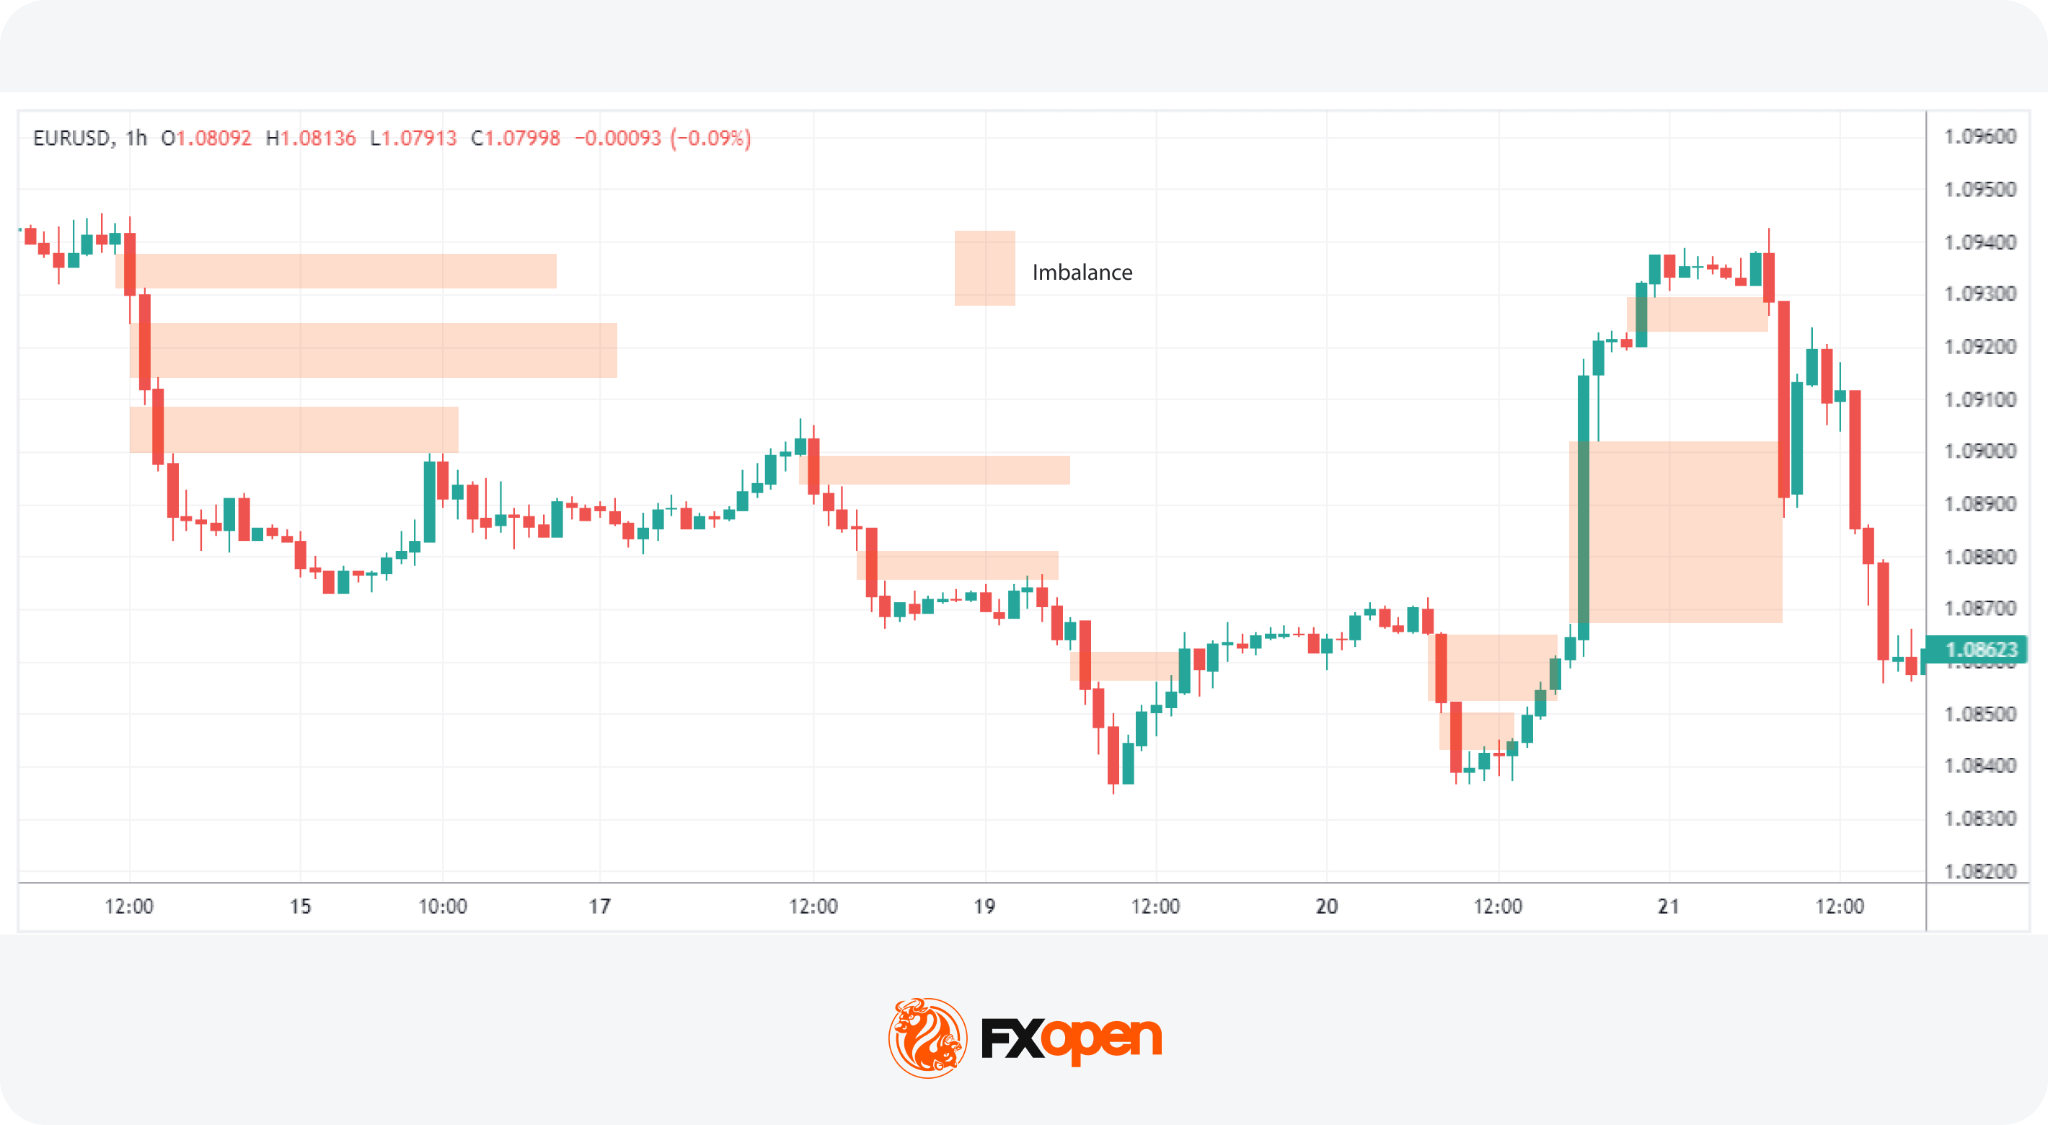
Imbalance in trading is a price zone where buy or sell orders heavily outweigh the opposite side, causing a sharp directional move with little trading in between. This imbalance of orders can significantly influence asset prices, pushing them up or down. It’s a fundamental concept in forex, crypto*, commodity, and stock markets.
Three related terms appear often:
- Imbalance: any zone where one side of the order flow dominates and price displaces sharply.
- Fair value gap (FVG): a three-candle pattern where wicks of the outer candles fail to overlap.
- Liquidity void: a wider displacement zone, often spanning several candles, that may contain multiple FVGs.
A market imbalance occurs when there’s an overwhelming interest from buyers (buy-side imbalance) or sellers (sell-side imbalance) without enough opposite-side orders to match. These zones are read by retail traders as visible footprints of large activity. Institutional desks often cause the imbalance themselves through size-driven execution the order book cannot absorb on one side.
Imbalance zones in trading are critical components of the Smart Money Concept (SMC), a framework that focuses on understanding the actions of institutional investors. SMC proponents argue that by analysing where and how these imbalances occur, traders can align their strategies with those of the market’s most influential players. The rationale is that institutional movements, often the cause behind significant imbalances, have the power to drive market trends.
Types of Imbalance in Trading
Order imbalances in trading come in different forms depending on direction, structure, and timeframe. Knowing which type is in front of you may shape how the zone is read and what reaction is expected.
- Buy-side vs sell-side imbalance: a buy-side imbalance is a sharp upward move where aggressive buy orders overwhelm available supply, leaving a thin zone below that price may revisit. A sell-side imbalance is a sharp downward move, where heavy selling pressure creates an unfilled gap above as price drops quickly.
- Fair value gap vs volume imbalance: a fair value gap is a structural three-candle pattern, while a volume imbalance focuses on disparity in traded volume between bid and offer at a level. Both highlight inefficiency but rely on different inputs.
- Micro vs macro imbalance: micro imbalances appear on 1-minute and 5-minute charts and may resolve within a session. Macro imbalances sit on the daily or weekly chart and may take weeks or months to fill.
Higher-timeframe imbalances usually carry more weight than lower-timeframe ones. For deeper context on the wider zones, the FXOpen article on liquidity zones and liquidity voids covers the mechanics in more detail.
Fair Value Gaps vs Imbalance vs Order Blocks
Imbalances, fair value gaps (FVGs), and order blocks are related but not identical. They sit on a spectrum of the same idea: a market inefficiency that price may return to.
An imbalance is the broad category. A fair value gap in forex is one specific imbalance pattern. An order block is the cause behind many imbalances, not the imbalance itself. Traders often combine the three: a fair value gap that forms just after an order block, in line with the prevailing trend, may carry stronger confluence than any single element alone.
Why Imbalances Matter in Trading
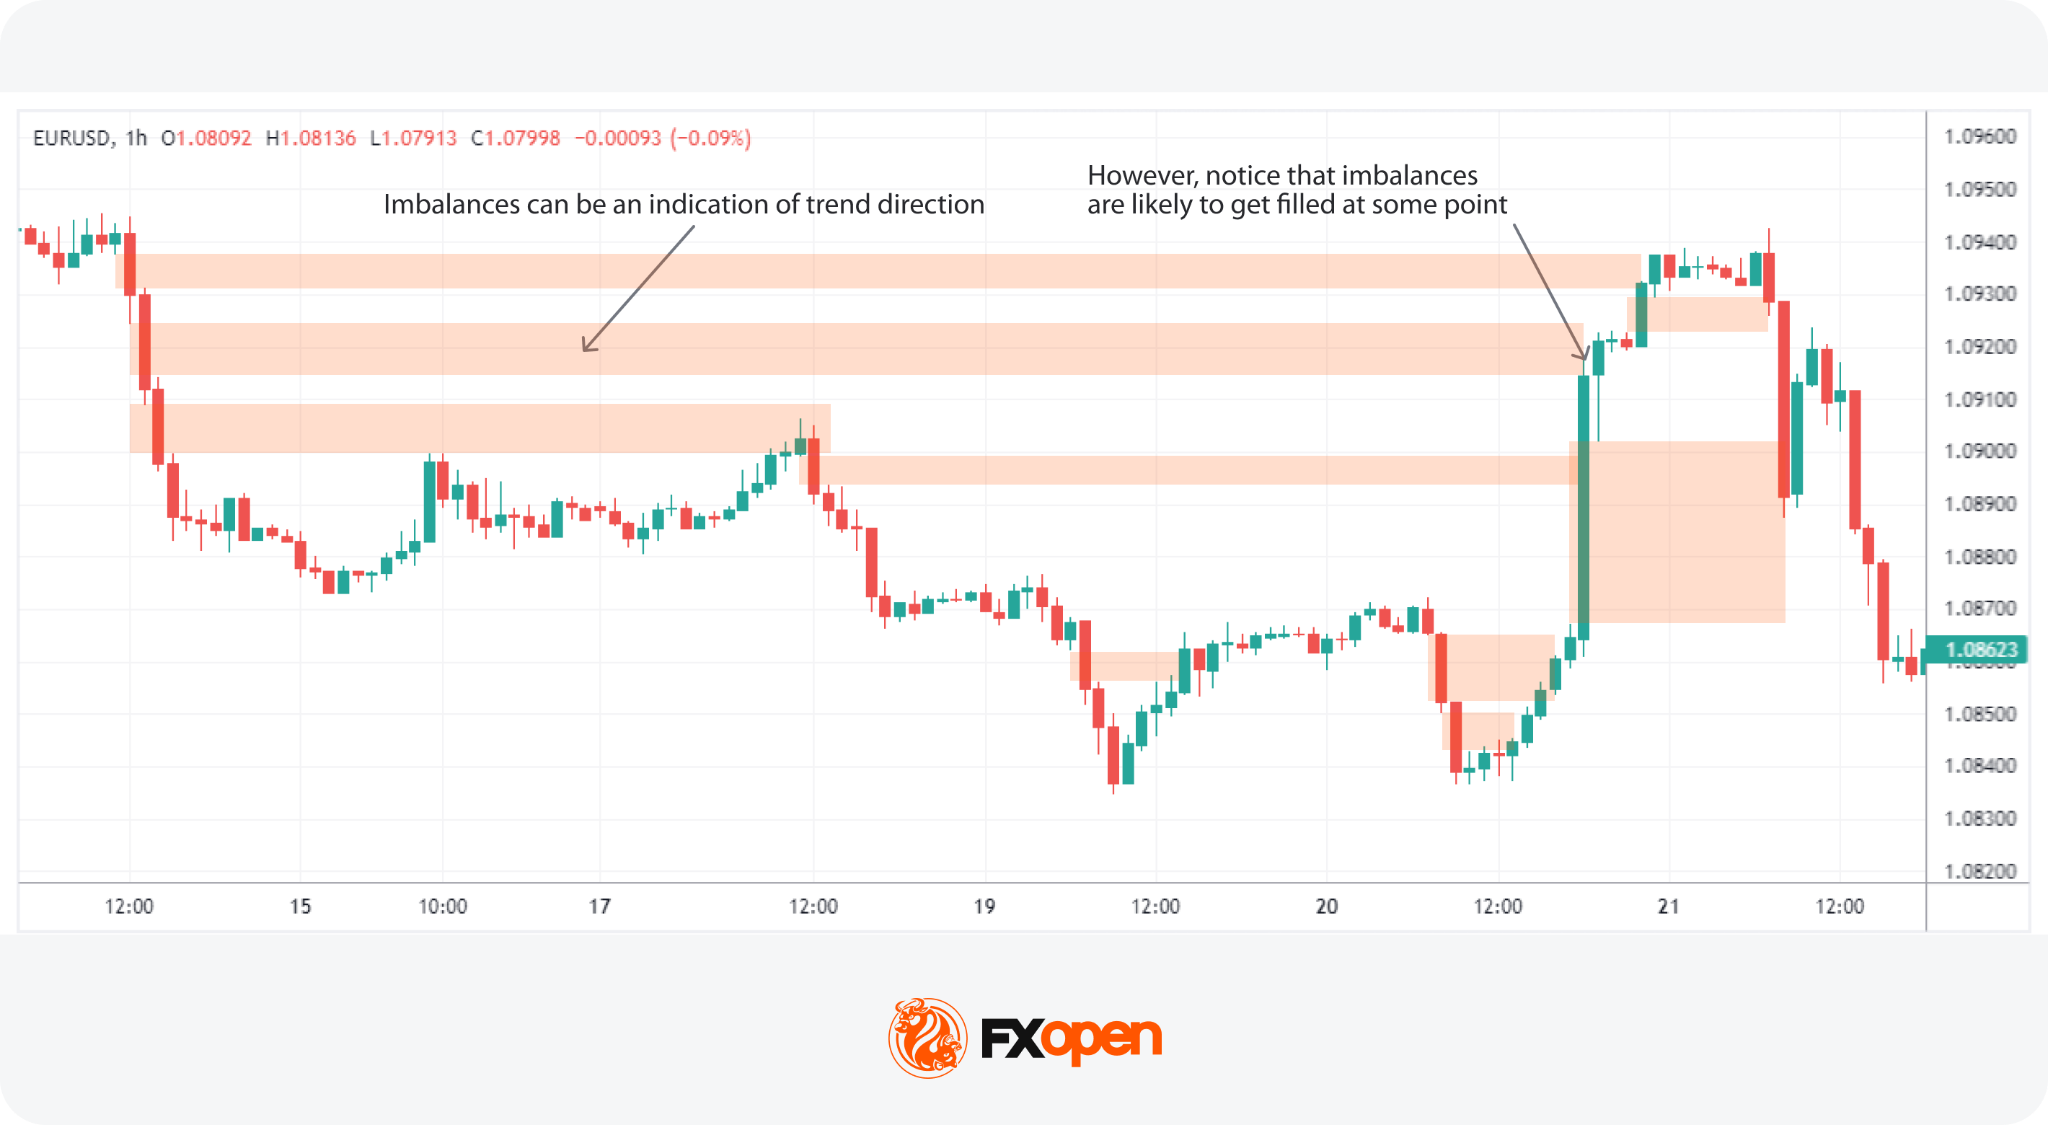
Traders often use imbalances to gauge market sentiment and direction. Large imbalances indicate a pronounced market preference for either buying or selling, suggesting that the trend in the direction of the imbalance is likely to persist. This directional insight is particularly potent with substantial imbalances (also known as liquidity voids), whereas smaller ones may be less useful for market analysis.
Markets tend to “fill” imbalance gaps, created by a lack of trading volume in a price range. This phenomenon hinges on the idea that prices gravitate towards areas of minimal resistance.
Price often returns to fill them, but some remain unfilled for weeks, months, or indefinitely, especially when tied to fundamental repricing events.
Three main reasons traders track imbalances:
- Trend continuation: an imbalance that forms with the higher-timeframe trend may act as a continuation signal.
- Mean reversion: price often retraces back into an imbalance before resuming, offering a reference point for entries.
- Liquidity targeting: large participants may push price through imbalances to access resting orders on the other side. Order flow analysis is a complementary concept here.
Imbalances offer probability, not certainty.
Identifying Imbalances on a Chart
How to identify imbalance in forex and CFD charts? In imbalance trading, traders look for areas where price moved rapidly with limited opposing activity. These conditions often reflect aggressive order flow entering the market while available liquidity on the opposite side remains limited. Fair value gaps (FVGs) are among the most common visual representations of imbalance on a forex or CFD chart.
A fair value gap is typically identified through a three-candle pattern. The central candle represents a strong impulsive move, while the candles before and after it create the boundaries of the imbalance zone. Once the third candle closes, the pattern may indicate that price moved through the area too quickly to establish balanced trading activity.
Strong displacement candles are often associated with meaningful imbalances. Common visual characteristics include:
- large candle bodies
- limited or no wick rejection
- breakout from consolidation
- expansion in volume
- rapid directional movement
The stronger the displacement, the more significant the imbalance is often considered.
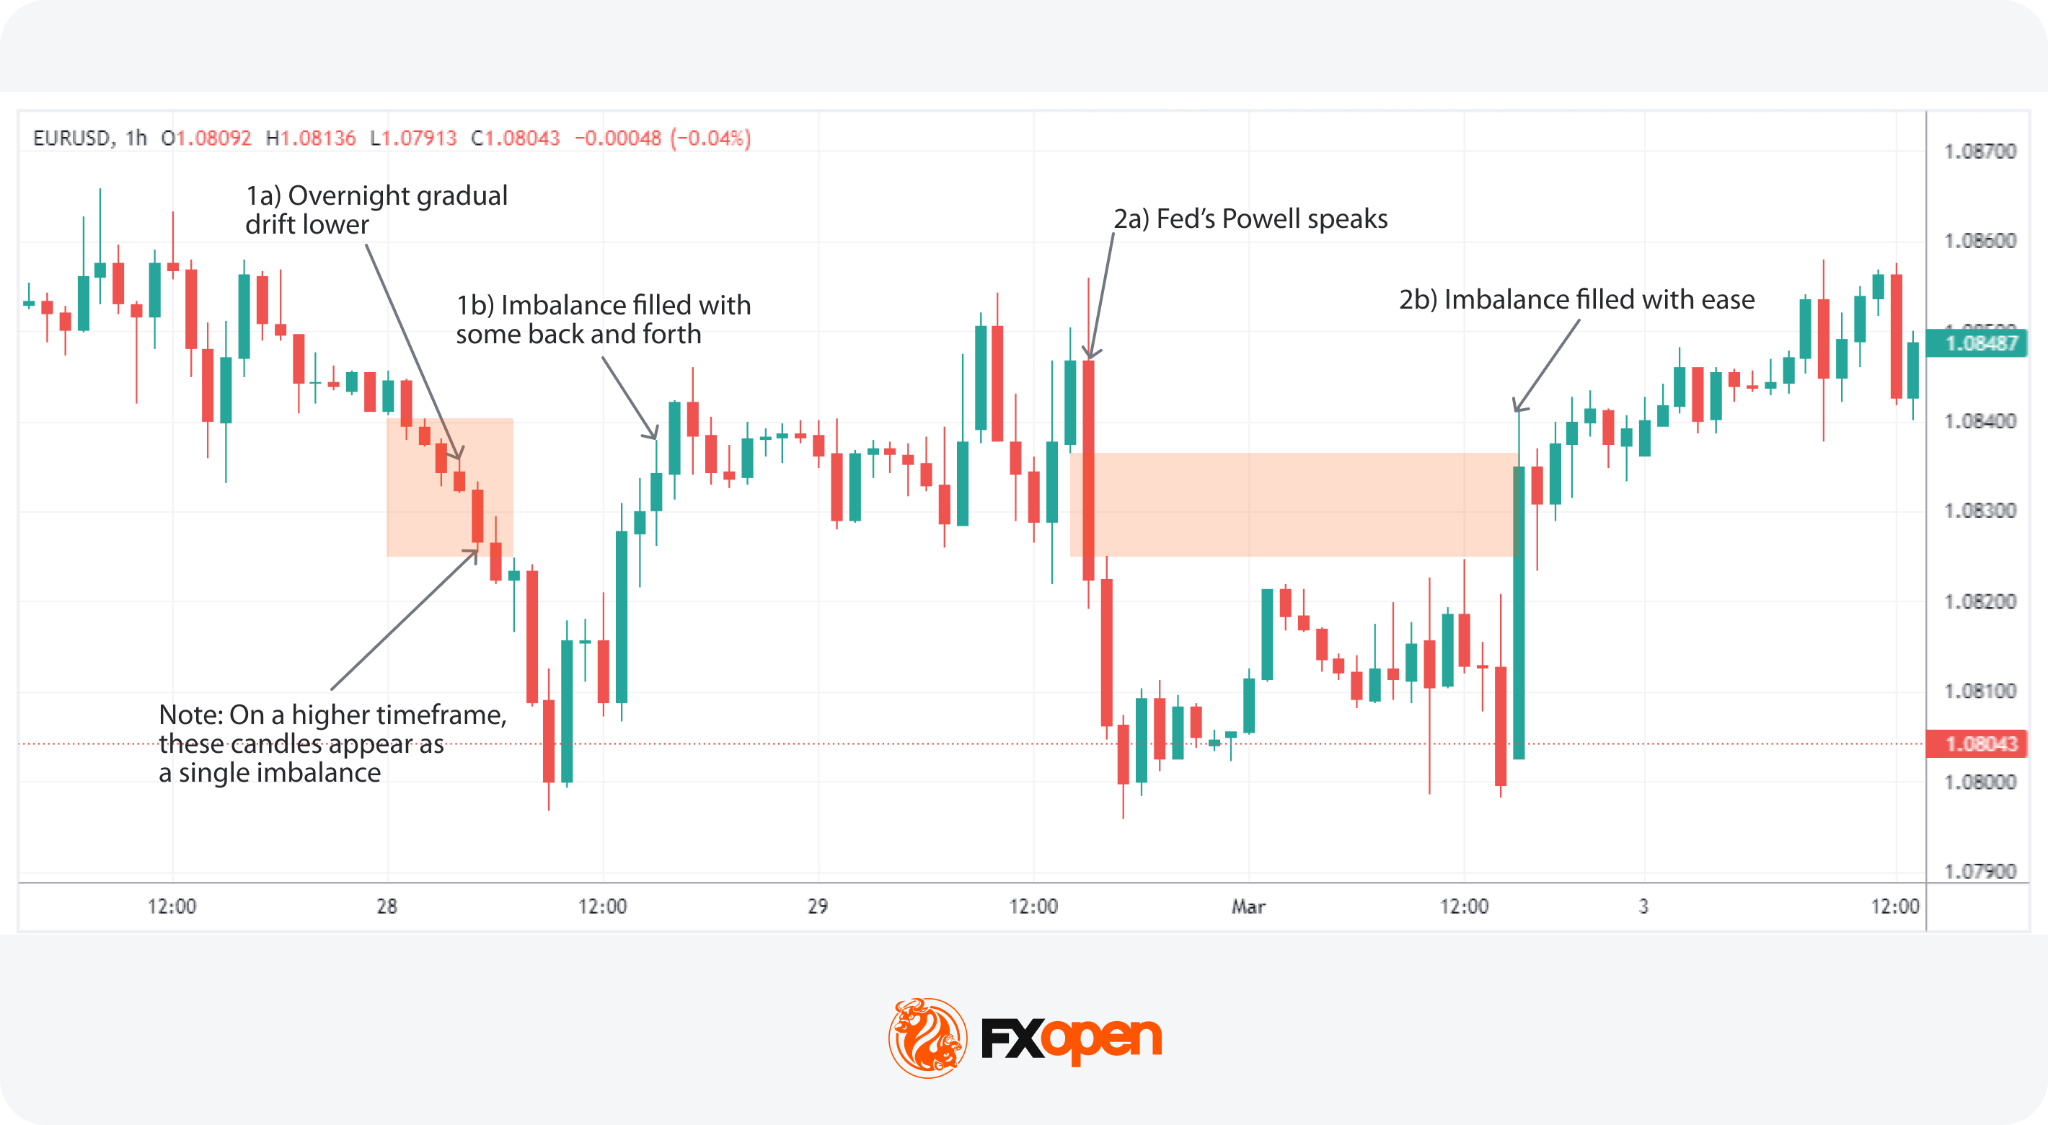
Imbalances may also appear as thin trading or low-interaction zones rather than textbook FVG structures. These areas often show limited candle overlap and minimal back-and-forth price action, indicating that the market moved rapidly through the zone.
A common process for identifying imbalance includes:
- identifying a strong impulsive move
- checking for limited candle overlap
- defining the imbalance boundaries
- comparing the setup with higher-timeframe structure
Timeframe hierarchy also matters. Imbalances that remain visible across both higher and lower timeframes are often considered more significant than those appearing only on lower charts. A daily imbalance may therefore carry more weight than a similar formation on a 5-minute chart. Higher-timeframe imbalance zones are often used as the primary reference area, while lower-timeframe imbalances may help refine entries.
Imbalance Trading Strategy Explained
An imbalance trading strategy combines trend direction, structure, and zone identification into a repeatable framework. According to theory, in an imbalance trading strategy, traders stick with the prevailing market trend. By combining trend analysis with imbalance identification, traders can align themselves with the market’s momentum and identify valuable setups.
The Smart Money imbalance framework runs in four steps:
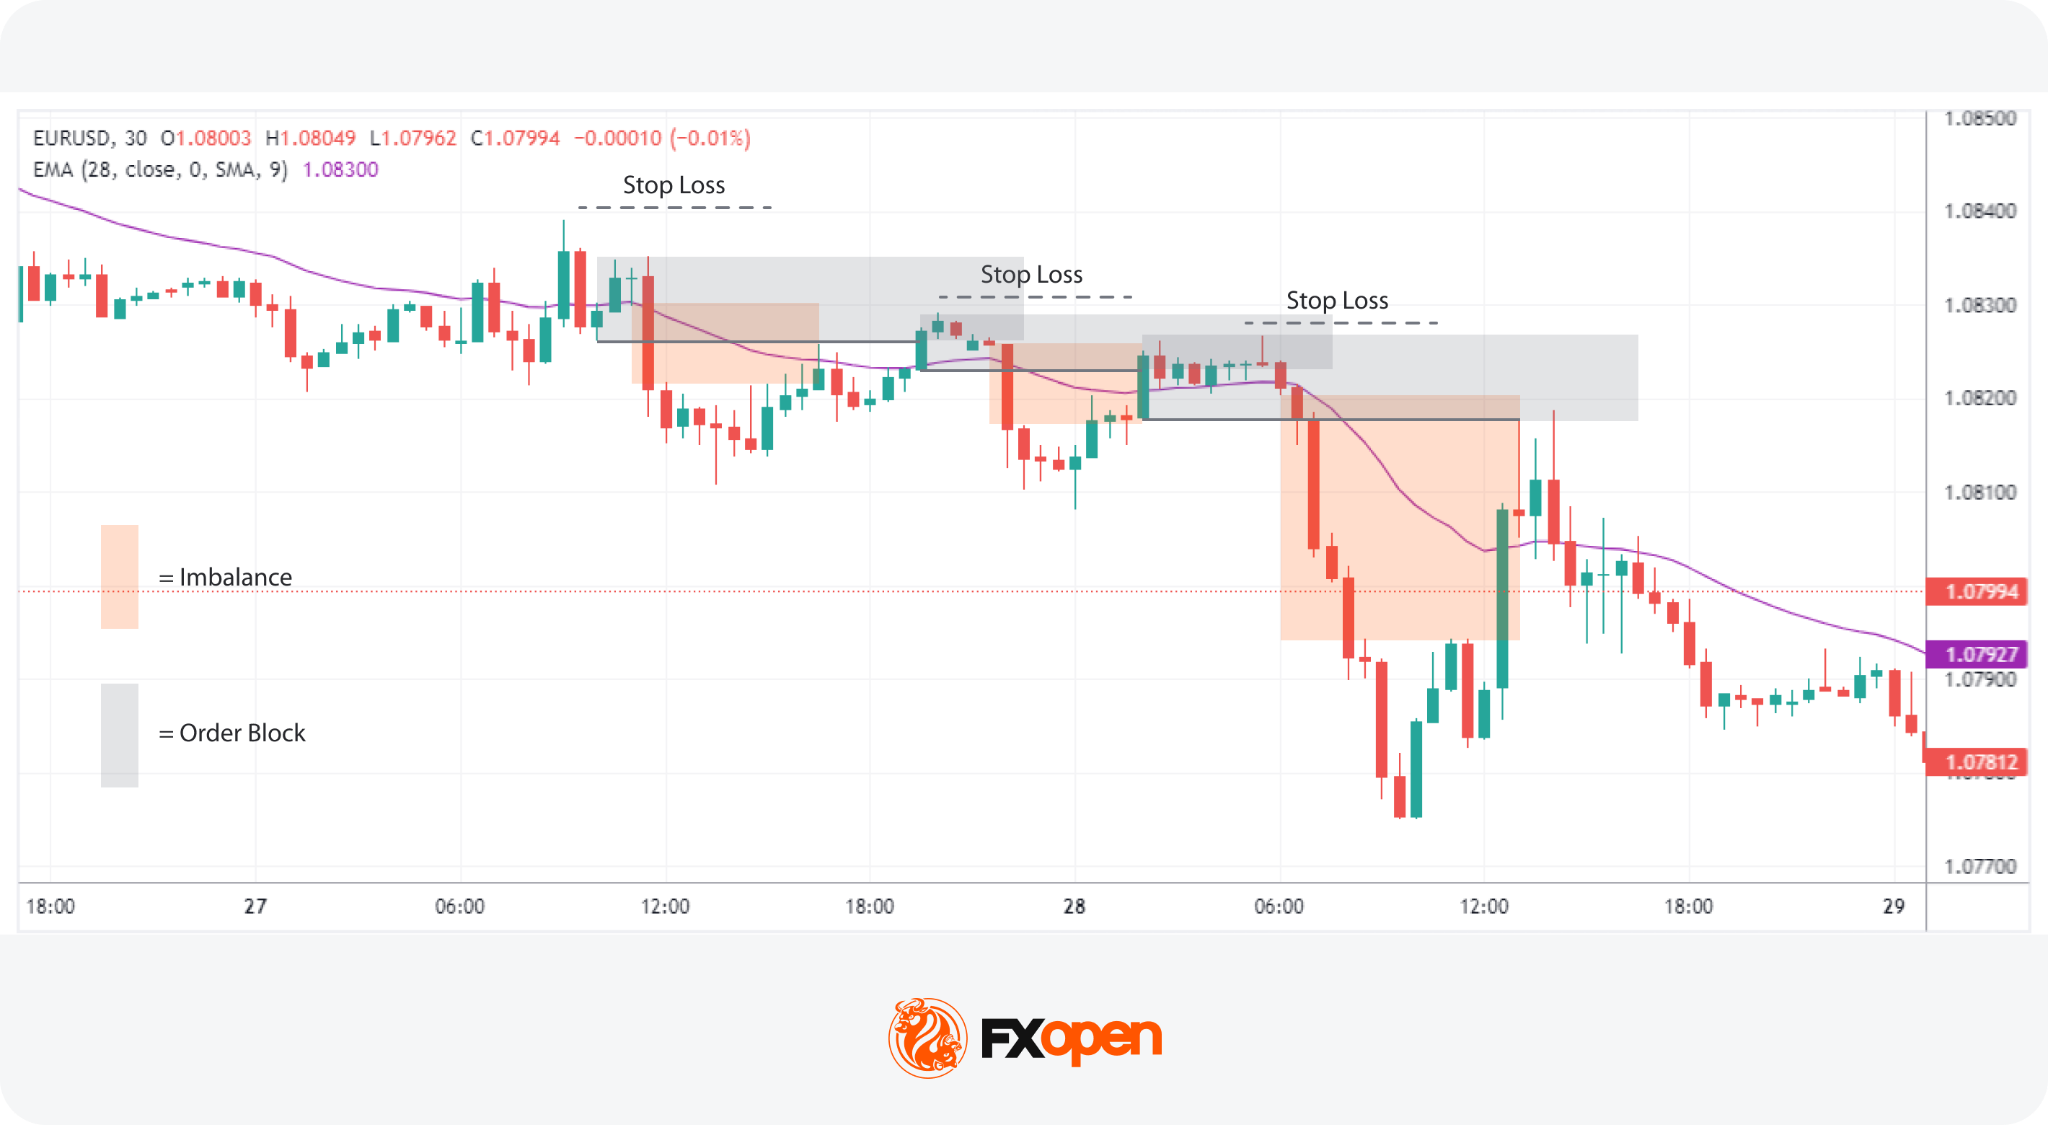
- Trend identification. In SMC, traders usually identify trends by examining market structure: higher highs and higher lows for bullish conditions, lower highs and lower lows for bearish. An Exponential Moving Average (EMA) may be applied as a simpler proxy. A downward-sloping EMA typically indicates a bearish trend, while an upward slope reflects bullish conditions.
- Imbalance formation. A strong displacement move may create an imbalance or fair value gap. Traders often monitor whether price later revisits this area before continuing in the direction of the prevailing trend.
- Order block identification. Traders then identify the last significant countertrend movement before a strong impulsive move. In Smart Money Concepts (SMC), this area is commonly referred to as an order block and may represent a zone where institutional activity previously entered the market.
- Entry point. Some traders wait for price to retrace back into the imbalance or order block after the impulsive move to enter the market in the trend direction. In bullish conditions, attention is usually placed on retracements into bullish imbalance zones; in bearish conditions, traders typically focus on retracements into bearish imbalance zones.
- Risk and exit planning. Stop-loss placement, position sizing, and exit logic are all defined before entry.
Consider following along on live charts in FXOpen’s TickTrader platform for the deepest understanding.
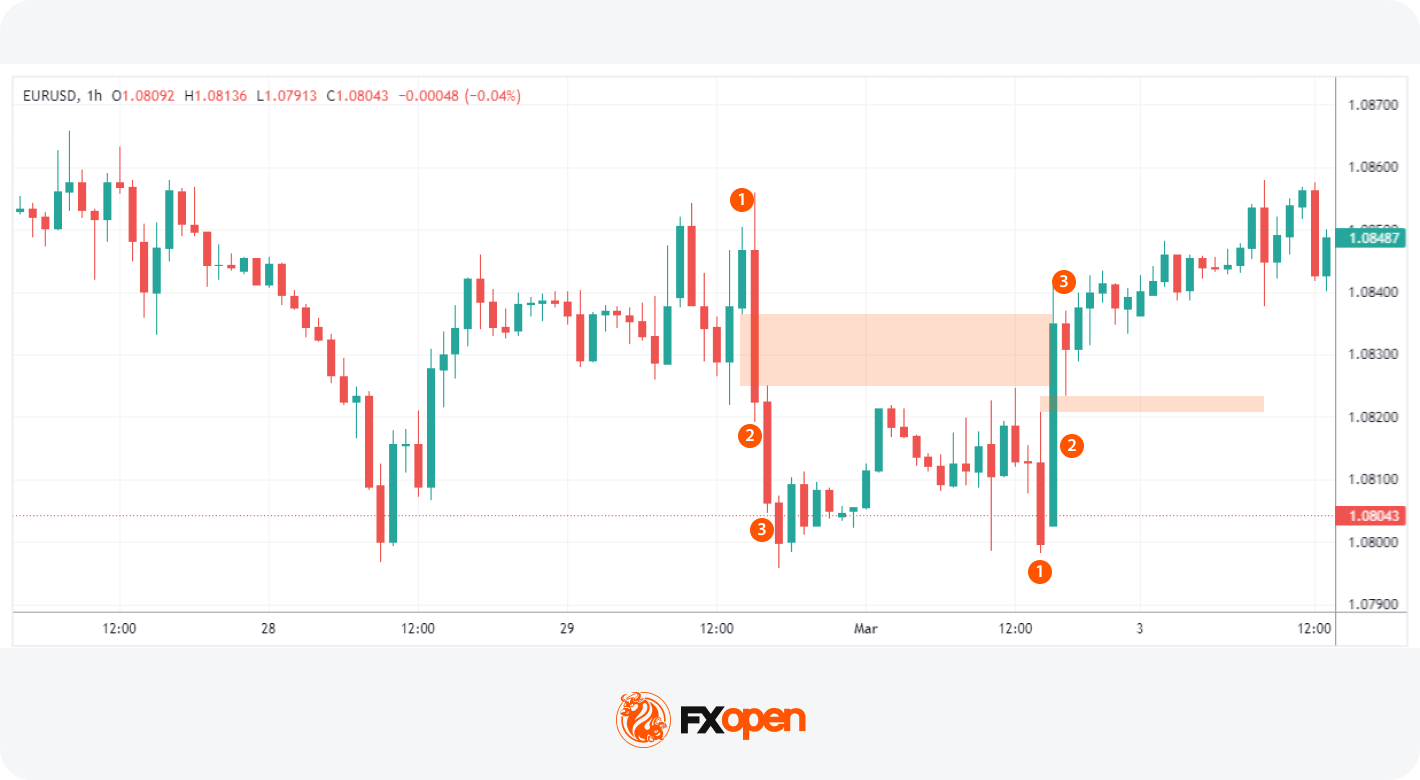
Entry
- Traders identify the market trend using the slope of an EMA.
- They look for an imbalance that results in a new high or low in line with the identified trend.
- The entry point in the trend direction may be set at the high (bullish trend) or low (bearish trend) of the last strong counter-trend candle before the imbalance.
Stop Loss
- A stop loss may be set just beyond the order block. This anchors risk to the structure that triggered the trade rather than an arbitrary pip distance.
Take Profit
- Profit-taking strategies may involve waiting for the price to fill another imbalance or reaching a predetermined technical level.
- To make the most of the trend, traders could employ trailing stops above or below new swing points or follow a longer-term moving average as a dynamic exit radar.
When Not to Trade
Some conditions reduce the reliability of imbalance trading setups:
- Just before major news releases, where volatility may spike and stops may be filled on noise rather than direction.
- When the imbalance forms against the higher-timeframe trend.
- In choppy, range-bound markets where directional bias is unclear.
- When multiple imbalances stack with no clean retracement, making entries harder to define.
Risk Considerations in Imbalance Trading
Imbalance setups offer structure, but they carry the same downsides as any pattern-based approach. Three areas warrant particular attention.
- False signals. Not every imbalance fills. Some price moves continue without retracement, especially during strong trends or trend reversals. A retracement into the zone is not guaranteed.
- News volatility. High-impact data releases can create imbalances that look textbook but resolve in unexpected ways. Slippage and widened spreads during these windows mean stop-losses may be filled at worse prices than expected.
- Overfitting and confirmation bias. Traders sometimes draw imbalances after the fact, marking only the patterns that worked. Without rules defined before the move, the strategy drifts into hindsight pattern-matching rather than systematic trading.
Defining clear entry, stop, and invalidation rules before the trade may support consistency. Risk management may potentially reduce reliance on any single signal when combined with broader structural analysis
Imbalance vs Liquidity
Imbalances and liquidity are linked mechanically. An imbalance forms precisely because liquidity on one side of the order book runs thin, allowing aggressive buying or selling to push price through several levels without resistance.
When aggressive buying or selling outpaces available counterparties at a price level, rapid repricing follows. This is the order flow imbalance in action, and it leaves the visible footprint traders mark as a fair value gap or liquidity void.
What Causes Imbalance in Trading?
Imbalances in forex and CFDs are driven by four main forces: news shocks, institutional flow, sentiment shifts, and technical triggers. Each one shifts the order book in a distinct way, and the order flow impact behind each helps explain why the visible gap forms on the chart. Academic work on market microstructure, including the Bank for International Settlements paper on market liquidity, examines how these forces interact at the deepest level.
High-impact news releases and economic events can quickly skew the balance as traders react en masse to new information, either flooding the market with buy orders or triggering a sell-off. Central bank decisions, inflation prints, and employment data are among the most common triggers. The order flow impact is immediate: liquidity providers widen spreads or pull resting orders, and price gaps to a new level.
Due to their sheer volume, large institutional orders create imbalances by outpacing the market’s ability to absorb them, sharply moving prices in one direction. The order flow impact here is more deliberate. A fund executing a sizable trade may break the order across price levels, but the cumulative pressure still consumes resting liquidity and leaves a visible imbalance behind.
Shifts in market sentiment, driven by broader economic indicators or trending market narratives, can collectively tilt trading activity towards buying or selling, further contributing to order flow imbalance. The shift is often gradual rather than sudden, but the cumulative result still drives one side of the book to dominate.
Technical factors, like prices reaching critical support or resistance levels, can activate automated trading algorithms that rapidly buy or sell, exacerbating the imbalance as these systems execute large-scale trades based on pre-set conditions. The order flow impact tends to be self-reinforcing: a breakout triggers more algorithmic activity, which extends the move and deepens the imbalance.
The Bottom Line
Order imbalances can serve as an indicator of market sentiment, helping traders recognise when supply and demand are not synchronised. By learning how to identify these situations and incorporating them into a structured trading approach, traders may spot potential price moves before they unfold. As with any strategy, combining order imbalance analysis with risk management and other technical tools can support traders when making trading decisions and provide a more balanced view of the market.
If you seek to apply these concepts in real-world scenarios, you can consider opening an FXOpen account, which offers trading with tight spreads and low commissions.
FAQs
What Is Imbalance in Trading?
In trading, an imbalance refers to a situation where buy orders significantly outnumber sell orders, or vice versa, leading to potential shifts in asset prices. This disproportion indicates strong market sentiment towards either buying or selling, impacting price movement direction.
What Causes Imbalance in Forex Markets?
Trade imbalances are primarily caused by significant news releases, large institutional orders, shifts in market sentiment, and technical triggers. These factors can lead to a sudden surge in buying or selling activity, creating an imbalance between supply and demand.
What Is an Imbalance Zone?
An imbalance zone is a specific area on a trading chart where the price has moved sharply, creating a gap known as a fair value gap. This gap signifies a period during which trading volume was minimal, suggesting a potential area for price to return to in the future.
What Is the Order Imbalance-Based Strategy?
The order imbalance-based strategy involves identifying moments when buy or sell orders dominate and using this information to anticipate future price movements. Traders use these imbalances to inform their entry and exit points.
What Is the Difference Between a Fair Value Gap and a Volume Imbalance?
A fair value gap refers to a price area skipped over during rapid market movement, indicating a potential return point for the price. Volume imbalance, however, specifically relates to the difference in volume between buy and sell orders, impacting price direction without necessarily creating a visual gap on the chart.
What Is a Fair Value Gap?
A fair value gap (FVG) is a three-candle pattern where the wicks of the outer two candles fail to overlap, leaving a gap between them. It is one specific form of imbalance and often appears during sharp directional moves. Traders watch FVGs as zones may be revisited before continuing the prevailing trend.
Does Price Always Return to an Imbalance?
No, price does not always return to an imbalance. Many imbalances are filled within hours, days, or weeks, but some remain open indefinitely, particularly those tied to fundamental repricing events such as central bank decisions or major economic shifts. Traders treat imbalance fills as probable rather than guaranteed and combine them with broader structural analysis.
What Is the Difference Between Imbalance and Order Block?
An imbalance is the visible gap or thin zone left after a strong directional move. An order block is the last opposing candle before that move, where institutional orders are thought to have been placed. The order block is the cause, the imbalance is the effect. Traders often look for both elements to align before entering.
How Is Imbalance Identified on a Chart?
Imbalance is commonly identified through strong displacement candles, fair value gaps, or areas with limited candle overlap. Traders often look for rapid directional movement, breakout conditions, and low-interaction price zones that suggest the market moved too quickly to establish balanced trading activity.
What Timeframes Are Used for Imbalance Trading?
Imbalance trading is applied across all timeframes, from 1-minute charts up to the weekly. Higher timeframes such as 4-hour, daily, and weekly tend to produce stronger imbalances. Lower timeframes are typically used for entry refinement once a higher-timeframe imbalance has been located. Multi-timeframe analysis sits at the core of the approach.
*Important: At FXOpen UK, Cryptocurrency trading via CFDs is only available to our Professional clients. They are not available for trading by Retail clients. To find out more information about how this may affect you, please get in touch with our team.
This article represents the opinion of the Companies operating under the FXOpen brand only. It is not to be construed as an offer, solicitation, or recommendation with respect to products and services provided by the Companies operating under the FXOpen brand, nor is it to be considered financial advice.


The Hyperliquid Policy Center disputed the framing.

The decentralized finance (DeFi) applications blockchain network Flare has unveiled a new XRP yield product in collaboration with digital asset manager Monarq and vault infrastructure provider Upshift.
According to a press release sent to CryptoPotato, the new product is a multi-strategy XRP vault offering diversified yield opportunities. Launched on Flare and accessible to XRP holders, the Monarq XRP Yield Vault (MXRPY) is powered by Monarq and built on Upshift’s vault infrastructure.
MXRPY Offers Diversified Yield
MXRPY allocates capital across three strategies: options trading, basis and funding rate arbitrage, and on-chain XRPFi deployment. Users deposit Flare XRP (FXRP), receive MXRPY tokens representing their capital and accrued yield, and expect returns from the three primary engines.
The first return engine uses XRP as collateral to support options strategies across several platforms and over-the-counter products. Through the second strategy, XRP is deployed in funding rates and market-neutral basis using borrowed stablecoins across major platforms. For the third engine, the vault allocates the capital into Flare-native XRP Finance (XRPFi) opportunities and DeFi applications.
With an initial deposit cap of 500,000 FXRP, the vault targets a range of 3% to 4% annual percentage yield (APY) distributed over time based on strategy, performance, and market conditions. The product is accessible through Upshift; the platform processes withdrawals weekly, every Friday, with an optional fee-based instant redemption mechanism available.
Monarq’s managing partner, Shiliang Tang, commented on the launch, saying: “A real financial system needs a broader menu of options. MXRPY is built to be one of those options for XRP holders.”
MXRPY App Coming Up
While MXRPY expands the scope of XRPFI beyond Flare, it adds to the rapidly growing list of products on the DeFi applications network. Over the past months, Flare has launched several yield-bearing products, including lending markets, for XRP holders. The latest launch combines on-chain and off-chain execution in a structure that provides XRP holders with diversified yield opportunities.
“The Clearstar EarnXRP vault showed that there is real demand for XRP-denominated vaults on Flare. Upshift provided the infrastructure behind that launch, and we’re now expanding the model with Monarq, a second XRP vault with a different strategy profile and a broader set of yield sources,” remarked Upshift’s growth lead, Ethan Luc.
While the XRP community embraces MXRPY, the companies intend to release a standalone application in the future. The upcoming app is expected to provide users with a direct connection to MXRPY via their XRP Ledger wallets.
The post XRP Holders Get New Yield Opportunity via Flare and Monarq Collaboration appeared first on CryptoPotato.
Crypto World
Saudi Arabia is tokenizing its multi-trillion dollar economy to protect its wealth from global shocks


The chairman of droppRWA has secured $12.5 billion in mandates to tokenized real estate and his plans are to go beyond properties to bring trillions of dollars onchain.

Key Takeaways
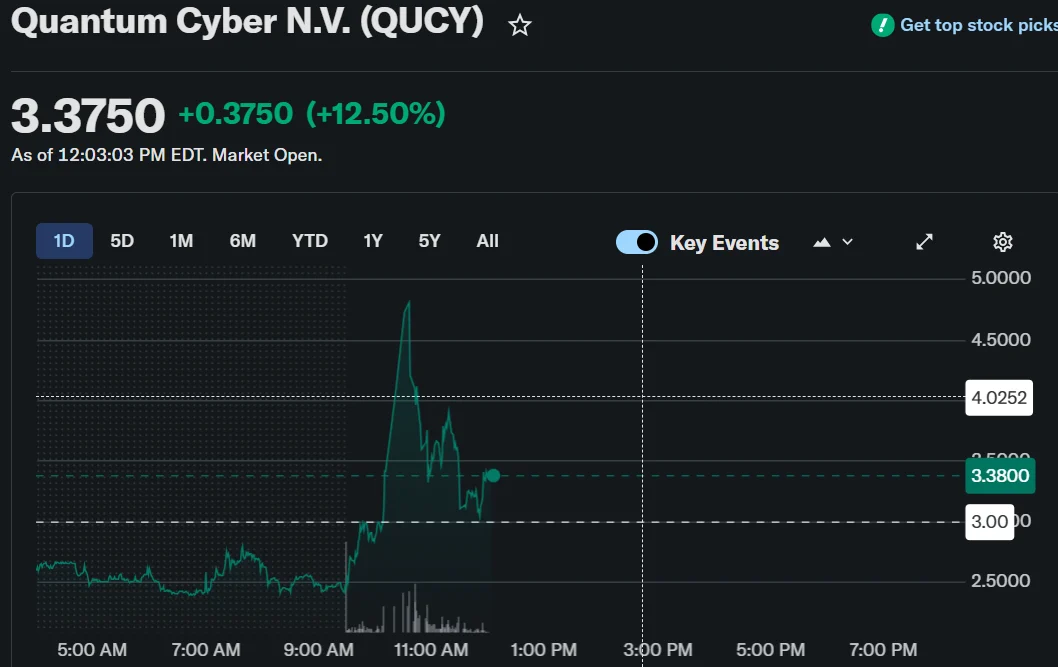
- QUCY shares climbed 7.71% following the debut of its defense technology web portal.
- The new platform emphasizes autonomous warfare, counter-drone systems, and EMP technology.
- Quantum Cyber’s website launch refocuses market attention on its AI-powered defense strategy.
- Despite retreating from session highs, QUCY maintained positive momentum throughout trading.
- Company strategically positions its defense portfolio amid expanding autonomous warfare budgets.
Shares of Quantum Cyber N.V.(QUCY) advanced on Friday following the introduction of its defense technology web platform, which brought renewed focus to the company’s strategic initiatives. QUCY closed at $3.2313, marking a 7.71% increase, after reaching higher levels earlier in the session. Despite the pullback from peak levels, the Nasdaq-listed firm maintained solid gains through the close.
Quantum Cyber leveraged its website introduction to showcase its comprehensive defense technology suite to investors and stakeholders. The platform now features detailed information on autonomous drone operations, counter-unmanned aircraft systems, electromagnetic pulse protection, robotic demining solutions, and quantum-based antenna technology. This digital presence provides enhanced visibility into the company’s System-of-Systems defense architecture.
The organization’s strategy centers on consolidating multiple defense technologies within a single publicly traded entity. Its emphasis lies in autonomous operational capabilities spanning aerial, terrestrial, and maritime domains. The website now functions as the primary resource for corporate communications and technical specifications.
The upward movement in QUCY shares coincided with heightened market interest in autonomous military systems and defense technology equities. While the stock experienced significant volatility during the trading session, the sustained gain reflected ongoing investor appetite following the company’s strategic announcement.
Digital Platform Showcases Integrated Defense Solutions
According to Quantum Cyber, the website will serve as a cornerstone for its corporate messaging and shareholder engagement initiatives. The platform delineates its technological capabilities across five distinct defense sectors. Furthermore, it delivers enhanced transparency regarding intellectual property, platform development roadmaps, and communication frameworks.
The company identifies unmanned aerial vehicle systems as a fundamental component of its operational blueprint. Counter-UAS perimeter security represents another significant technological pillar. The portfolio encompasses electromagnetic pulse-resistant drone hardware and automated mine clearance platforms.
Additionally, Quantum Cyber highlights its ongoing development of quantum-enhanced antenna communication systems. The organization anticipates forthcoming disclosures regarding technological advancements, strategic alliances, patent filings, and business development initiatives. Consequently, the website launch establishes a foundation for increased corporate transparency going forward.
Defense Budget Priorities Align With Company Focus
The platform introduction arrives amid a strategic reorientation of U.S. military procurement toward autonomous combat systems. The Trump administration has proposed approximately $55 billion for unmanned and autonomous warfare initiatives in the 2027 fiscal year. This allocation represents a dramatic escalation from the roughly $225 million budgeted in the previous fiscal period.
The counter-unmanned aircraft systems sector provides additional strategic context for Quantum Cyber’s market positioning. According to Grand View Research projections, this market segment is expected to expand from $3.1 billion to $10.6 billion by decade’s end. These estimates reflect a robust 27.2% compound annual growth trajectory.
Quantum Cyber combines combat-proven Israeli defense technologies with access to American capital markets infrastructure. The company’s roadmap includes acquiring, licensing, and advancing autonomous systems tailored for military applications. The web platform launch successfully redirected investor attention toward QUCY’s defense capabilities as shares registered meaningful gains.

Crypto World
Bitcoin Rejected at $80K as Inflation Fears Outweigh CLARITY Act Progress: Weekly Recap
The past week was quite eventful once again, with headlines spanning different sectors: from the highly anticipated meeting between US President Trump and China’s Xi Jinping to inflation data and some progress on the CLARITY Act front.
The business week began on the right foot for bitcoin as it rocketed from under $80,500 to roughly $82,500 following a quiet weekend. However, the rejection was swift, and BTC dipped below its starting point within hours.
Another breakout attempt took place on Tuesday, but the bears stepped up even faster this time, not allowing BTC to surpass $82,000. The selling pressure mounted on Wednesday after the inflation data for April went live in the US. Once it became known that the CPI numbers hit a three-year high of 3.8%, BTC reacted with a price dip to under $79,000.
More volatility ensued on Thursday when the CLARITY Act passed a Senate panel, which was regarded as a bullish development for the crypto industry, as it could crystallize the regulatory landscape in the country. Bitcoin traded at around $79,500 before the news spread, but quickly exploded to $82,000.
The bears reemerged at this point once again and didn’t allow any further gains. Although BTC managed to remain close to the $82,000 level for a while, it nosedived on Friday by over three grand from the top and currently struggles below $79,000.
Its market capitalization has fallen to $1.580 trillion on CG, while its dominance over the alts remains well above 58%. Nevertheless, BTC remains slightly in the green on a weekly scale, but it has been outperformed by many altcoins, including BNB, DOGE, XRP, and SUI.
Market Data

Market Cap: $2.71T | 24H Vol: $118B | BTC Dominance: 58.2%
BTC: $78,800 (+0.6%) | ETH: $2,210 (-1.38%) | XRP: $1.43 (+5%)
This Week’s Crypto Headlines You Can’t Miss
Bitcoin’s Drop Below $80K Was Not Random: Here Are the 3 Hidden Triggers. The largest cryptocurrency slipped below $80,000 on a couple of occasions in the past week, and many analysts believe it’s not random. Easy On Chain, for example, outlined three reasons behind the asset’s decline.
Is Bitcoin’s Rally Fake? Analyst Sees Massive Downside Ahead. Another popular market observer, Dr. Profit, who has mostly leaned bearish over the past half a year, noted that the rally to over $82,000 was most likely unsustainable and predicted a substantial crash to and perhaps below $50,000.
Arthur Hayes Predicts AI Race Will Push Bitcoin Back to $126K. On the contrary, Arthur Hayes remains bullish on BTC’s long-term perspective, forecasting a massive surge to the October 2025 all-time high of $126,000. Interestingly, he thinks such a move could be propelled by the AI race.
Bitcoin and Ethereum Arrive on Wall Street Giant Charles Schwab for Selected Retail Clients. Schwab Crypto, the behemoth investment services firm’s new digital asset venture, officially launched last week, allowing certain retail investors to get exposure to BTC and ETH through the regulated platform.
Strategy’s Bitcoin Buying Spree Resumes With Fresh 535 BTC Accumulation. After a quick weekly pause, Michael Saylor’s Strategy resumed its BTC purchases. The latest was a relatively small one of 535 BTC, acquired for $43 million. Its total stash grew to 818,869 BTC.
Tom Lee Doubles Down on ‘Crypto Spring’ Theory, but Bitmine Slows ETH Accumulation. BitMine also slowed its pace of ETH purchases, but Tom Lee remains optimistic that the worst has already passed and ‘crypto spring’ is about to commence.
Charts
This week, we have a chart analysis of Ethereum, Ripple, Cardano, Binance Coin, and Hyperliquid – click here for the complete price analysis.
The post Bitcoin Rejected at $80K as Inflation Fears Outweigh CLARITY Act Progress: Weekly Recap appeared first on CryptoPotato.
Crypto World
RedStone’s settlement layer is the first serious attempt to make tokenized RWAs real DeFi collateral


RedStone’s new “Settle” layer is the first sober attempt to fix DeFi’s RWA paradox.
Summary
- RedStone Settle liquidates RWA‑backed loans via on‑chain auctions, letting LPs buy the position and assume slow 60–180 day redemption risk, so lending protocols keep atomic, instant liquidations.
- With around $30B of tokenized Treasuries, credit and funds sitting as “dead capital,” Settle standardizes liquidation and repricing so RWAs can back Aave‑style markets instead of being trapped in isolated wrappers.
- The trade‑off is structural: if Settle becomes the default, RedStone’s oracle and auction stack starts to look like a quasi‑central clearinghouse for RWA collateral inside an allegedly permissionless ecosystem.
RedStone has launched “RedStone Settle,” a dedicated DeFi settlement layer built to make tokenized real‑world assets usable as collateral in lending protocols, targeting roughly $30 billion of RWAs that are currently structurally dead capital. The design attack is straightforward: fix the core timing mismatch between instant, on‑chain liquidations and 60–180 day off‑chain redemption cycles for bonds, funds, credit and other tokenized instruments that have, until now, been almost impossible to use in live DeFi lending.
RedStone settlement layer adds functionality
RedStone, a decentralized oracle provider based in Baar, Switzerland, says Settle introduces an on‑chain auction mechanism that activates when a borrower using RWA collateral is liquidated. Instead of trying to redeem the underlying real‑world asset instantly — which is structurally impossible for most tokenized bonds or funds — the system lets liquidity providers bid for the liquidated position, buy it on chain, and then assume the delayed redemption risk of the underlying, which can take 60–180 days to unwind. In effect, Settle turns those LPs into specialized risk‑bearers who bridge slow TradFi settlement and fast DeFi risk management, while letting lending protocols keep their instant‑liquidation discipline.
The scale of the prize is non‑trivial. RedStone cites estimates from RWA.xyz and other trackers that put the current market for tokenized RWAs — led by tokenized US Treasuries, private credit vehicles and fund wrappers — at around $30 billion as of April 2026, most of it sitting in isolated contracts, earning yield but functionally unusable as collateral in Aave‑style money markets. By standardizing how those assets are liquidated and repriced across protocols, RedStone argues Settle can “unlock over $30 billion worth of tokenized assets currently sitting idle,” removing what it calls “a significant barrier to integrating RWAs into DeFi.” Intellectia’s summary is blunt: this gives institutional holders “a transparent pathway to leverage their income‑generating assets for loans without selling them,” shifting DeFi yields toward corporate, real‑estate and sovereign risk premia instead of pure crypto beta.
Conceptually, this is the invisible plumbing that actually matters for RWA‑DeFi integration, as opposed to the endless “tokenized T‑bills” narratives that never quite become money‑like. Today, most tokenized assets face a structural veto: protocols need atomic liquidations; real‑world settlement is slow, litigious and path‑dependent; so the obvious choice has been to keep RWAs at arm’s length. RedStone Settle creates an explicit risk‑transfer market around that mismatch: if you want the yield and diversification from RWAs, you price and outsource the time risk to LPs through auctions, instead of pretending it doesn’t exist. In a best‑case scenario, that pushes stablecoin and lending rates to track the term structure of credit and macro cycles, not just the mood swings of BTC and ETH.
The catch is structural. If RedStone’s private oracle plus settlement layer becomes the de facto standard for how DeFi handles RWA collateral, you’ve effectively recreated a quasi‑central clearinghouse — a DTCC‑style coordination layer — inside an ecosystem that insists on being permissionless and credibly neutral. Price feeds, auction design and dispute resolution all route through one oracle stack and its governance, even if the contracts are on chain. That’s the real wedge: one approach, like State Street’s Luxembourg build‑out, plugs tokenization into TradFi’s legal superstructure; the other, like RedStone Settle, builds a parallel “central bank of RWAs” for DeFi. Either way, the fantasy of purely flat, trustless collateral markets dies as soon as $30 billion of real‑world assets show up and someone has to decide what happens when the redemption clock and the liquidation engine collide.
Over the past month, Solana (SOL) spiked 10%, yet it remains below the psychological $100 milestone.
One popular crypto analyst is optimistic that the price may surge well above that level, but such a breakout would require the overcoming of a key resistance zone.
The Necessary Conditions
As of press time, SOL trades at around $91, while its market capitalization stands just below $53 billion. According to Ali Martinez, the price has been moving within a well-defined channel since February, identifying the upper boundary at $98 and the lower at $78. He forecasted a potential bounce if SOL makes a successful breakout above the ceiling and set $88 as “the pivot point.”
“We recently tested that $98 resistance, which resulted in a quick rejection. Now, I am seeing Solana bounce. This suggests we could be gearing up for another retest of the channel top to determine if a breakout is finally in the cards,” he stated.
Martinez believes that a daily close above $98 could open the door to a surge toward $107, with a secondary target at $117. At the same time, if that level continues to hold as heavy resistance, the price may retreat to $88 and even to the $78 floor.
Earlier this month, the analyst revisited Solana, describing the $77-$94 range as a “no-trade” zone. Back then, he suggested that if buying pressure picked up, the price could surge toward $96.
Prior to that, Martinez noted that SOL’s Bollinger Bands have squeezed, which has historically been a precursor of a major breakout. However, the direction of the move (up or down) can not be determined.
Another X user who recently gave their two cents on the matter is Globe of Crypto. In their view, closing above $99 could set the stage for a solid rise toward $160-$170.
The Bold Forecast
X user Marino also chipped in, predicting that SOL could climb above $500 in the coming years. He supported his bullish outlook by pointing to Solana’s accelerating adoption, rising usage, growing network value, increased staking, the launch of new apps, and other positive factors that reinforce the ecosystem’s strength.
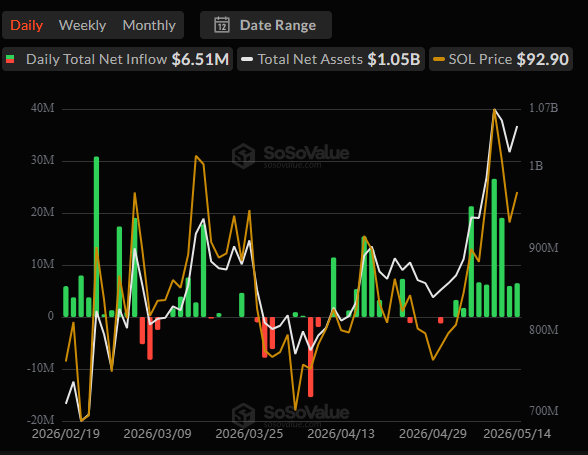
The analyst added that inflows into spot SOL ETFs could also spark a rally, and data show that lately these products have indeed attracted millions of dollars of fresh capital. Since their introduction, the financial vehicles have generated a cumulative total net inflow of approximately $1.12 billion.
“If Solana keeps compounding adoption at this pace into the next cycle & if macro conditions are positive. Then $500+ in 2029 feels absolutely possible,” Marino concluded.
The post Solana (SOL) at a Turning Point: What Will Define the Next Breakout? appeared first on CryptoPotato.


Disclosure: This article does not represent investment advice. The content and materials featured on this page are for educational purposes only.
Poly Truth and Meme Punch stand out among below-$1 crypto picks alongside Sei in 2026 market watchlist.
Summary
- Crypto markets are targeting sub-$1 tokens again, with Poly Truth, Meme Punch, and Sei gaining attention.
- Poly Truth is an AI prediction market tool that turns event data into probability-based reports using a 3-part system.
- Meme Punch is a play-to-earn meme game where players earn MEPU through PvP battles and in-game progression.
A lot of coins sit well under $1, but only some have the setup to actually move toward it. The next crypto to hit $1 will probably come from a project that has more going for it than a low price tag.
This article looks at three picks worth a closer look right now. Poly Truth (PTRUE) and Meme Punch (MEPU) are still in presale, and Sei (SEI) is already listed and building momentum. Different stages, different stories, but all three are worth knowing.
Next crypto to hit $1: 3 Picks to watch
Three projects worth a closer look for those who are scanning for the next sub-$1 token with real upside.
1. Poly Truth (PTRUE)
Poly Truth is a prediction market intelligence tool. Not a trading platform, not a bot. The concept is that users receive AI-powered analysis that indicates which outcome the data actually supports and why, rather than speculating on prediction events.
The team constructed the platform’s three-part system around three characters. The Runners are AI bots that search the internet for information on current prediction events. The AI analyst known as the Starlet calculates probability scores, looks for patterns, and cross-references the sources. The Presenter delivers the final report in plain language.
A few things worth noting:
- 11.5 billion tokens are available, and it is based on Ethereum.
- Ten percent of the supply is reserved for staking rewards, and forty percent is allotted to the presale.
- Audited by Coinsult and SolidProof; both reports are available to the public.
- Team tokens have a 3-month cliff and a 12-month vest.
- ETH, BNB, SOL, USDT, USDC, card, and SEPA are among the available payment methods.
2. Meme Punch (MEPU)
The play-to-earn cryptocurrency game Meme Punch is based on a simple idea. Play and get real cryptocurrency after winning, as opposed to holding a memecoin and waiting for a pump.
Five iconic meme-inspired characters — Pepe, Doge, Floki, Brett, and Pudgy Penguin — compete for supremacy in this medieval battle arena. Choose a knight, engage in PvP combat, move up the leaderboard, and receive in-game rewards in the form of MEPU. The token has actual use outside of speculation since it can be used within the game to access weapons, skins, and special abilities.
Features worth knowing:
- Built on Ethereum, with a total supply of 10 billion MEPU.
- 40% of supply goes to the presale, with 14.5% for staking and 9.5% for in-game rewards.
- Marketing allocation sits at 16.5%, aimed at reaching gamers outside the crypto bubble.
- Payment options cover ETH, BNB, SOL, USDT, USDC, and card.
3. Sei (SEI)
Sei is a high-speed Layer 1 blockchain built around fast trading, gaming, and other apps that need performance. After months of sideways action, it’s one of the better stories on exchanges right now.
The price action tells the recovery story clearly. SEI was sitting near $0.054 in mid-April, broke above the descending channel in early May, hit a peak of around $0.078 on May 10, and now trades near $0.067. That’s a 24% move off the April low, with the chart showing higher lows building.
A few catalysts are behind it:
- The Giga upgrade is rolling out through 2026, targeting over 200,000 transactions per second with sub-400ms finality.
- EVM migration is set to complete by June 15, 2026, opening the door to Ethereum developers and apps.
- Xiaomi partnership has SEI’s wallet preinstalled on devices outside China and the US, exposing the chain to a massive global user base.
Why these picks are worth watching
Each of the three picks holds its position for a different reason, but they all have one thing in common. Price alone won’t be enough for the next cryptocurrency to reach $1. It will require a strong reason for consumers to continue purchasing.
In order to provide prediction market traders with a real advantage, Poly Truth is developing an AI research tool. A memecoin can be transformed into a playable game with in-game features with Meme Punch. Real adoption is being pushed by Sei through the Giga upgrade, an EVM migration, and a partnership with Xiaomi.
The point is the combination of stages. The smaller entry and larger upside, should they land, are offered by the presales. SEI provides a project that is already demonstrating ecosystem progress and recovery. It’s important to be aware of the various bets and timelines.
Disclosure: This content is provided by a third party. Neither crypto.news nor the author of this article endorses any product mentioned on this page. Users should conduct their own research before taking any action related to the company.
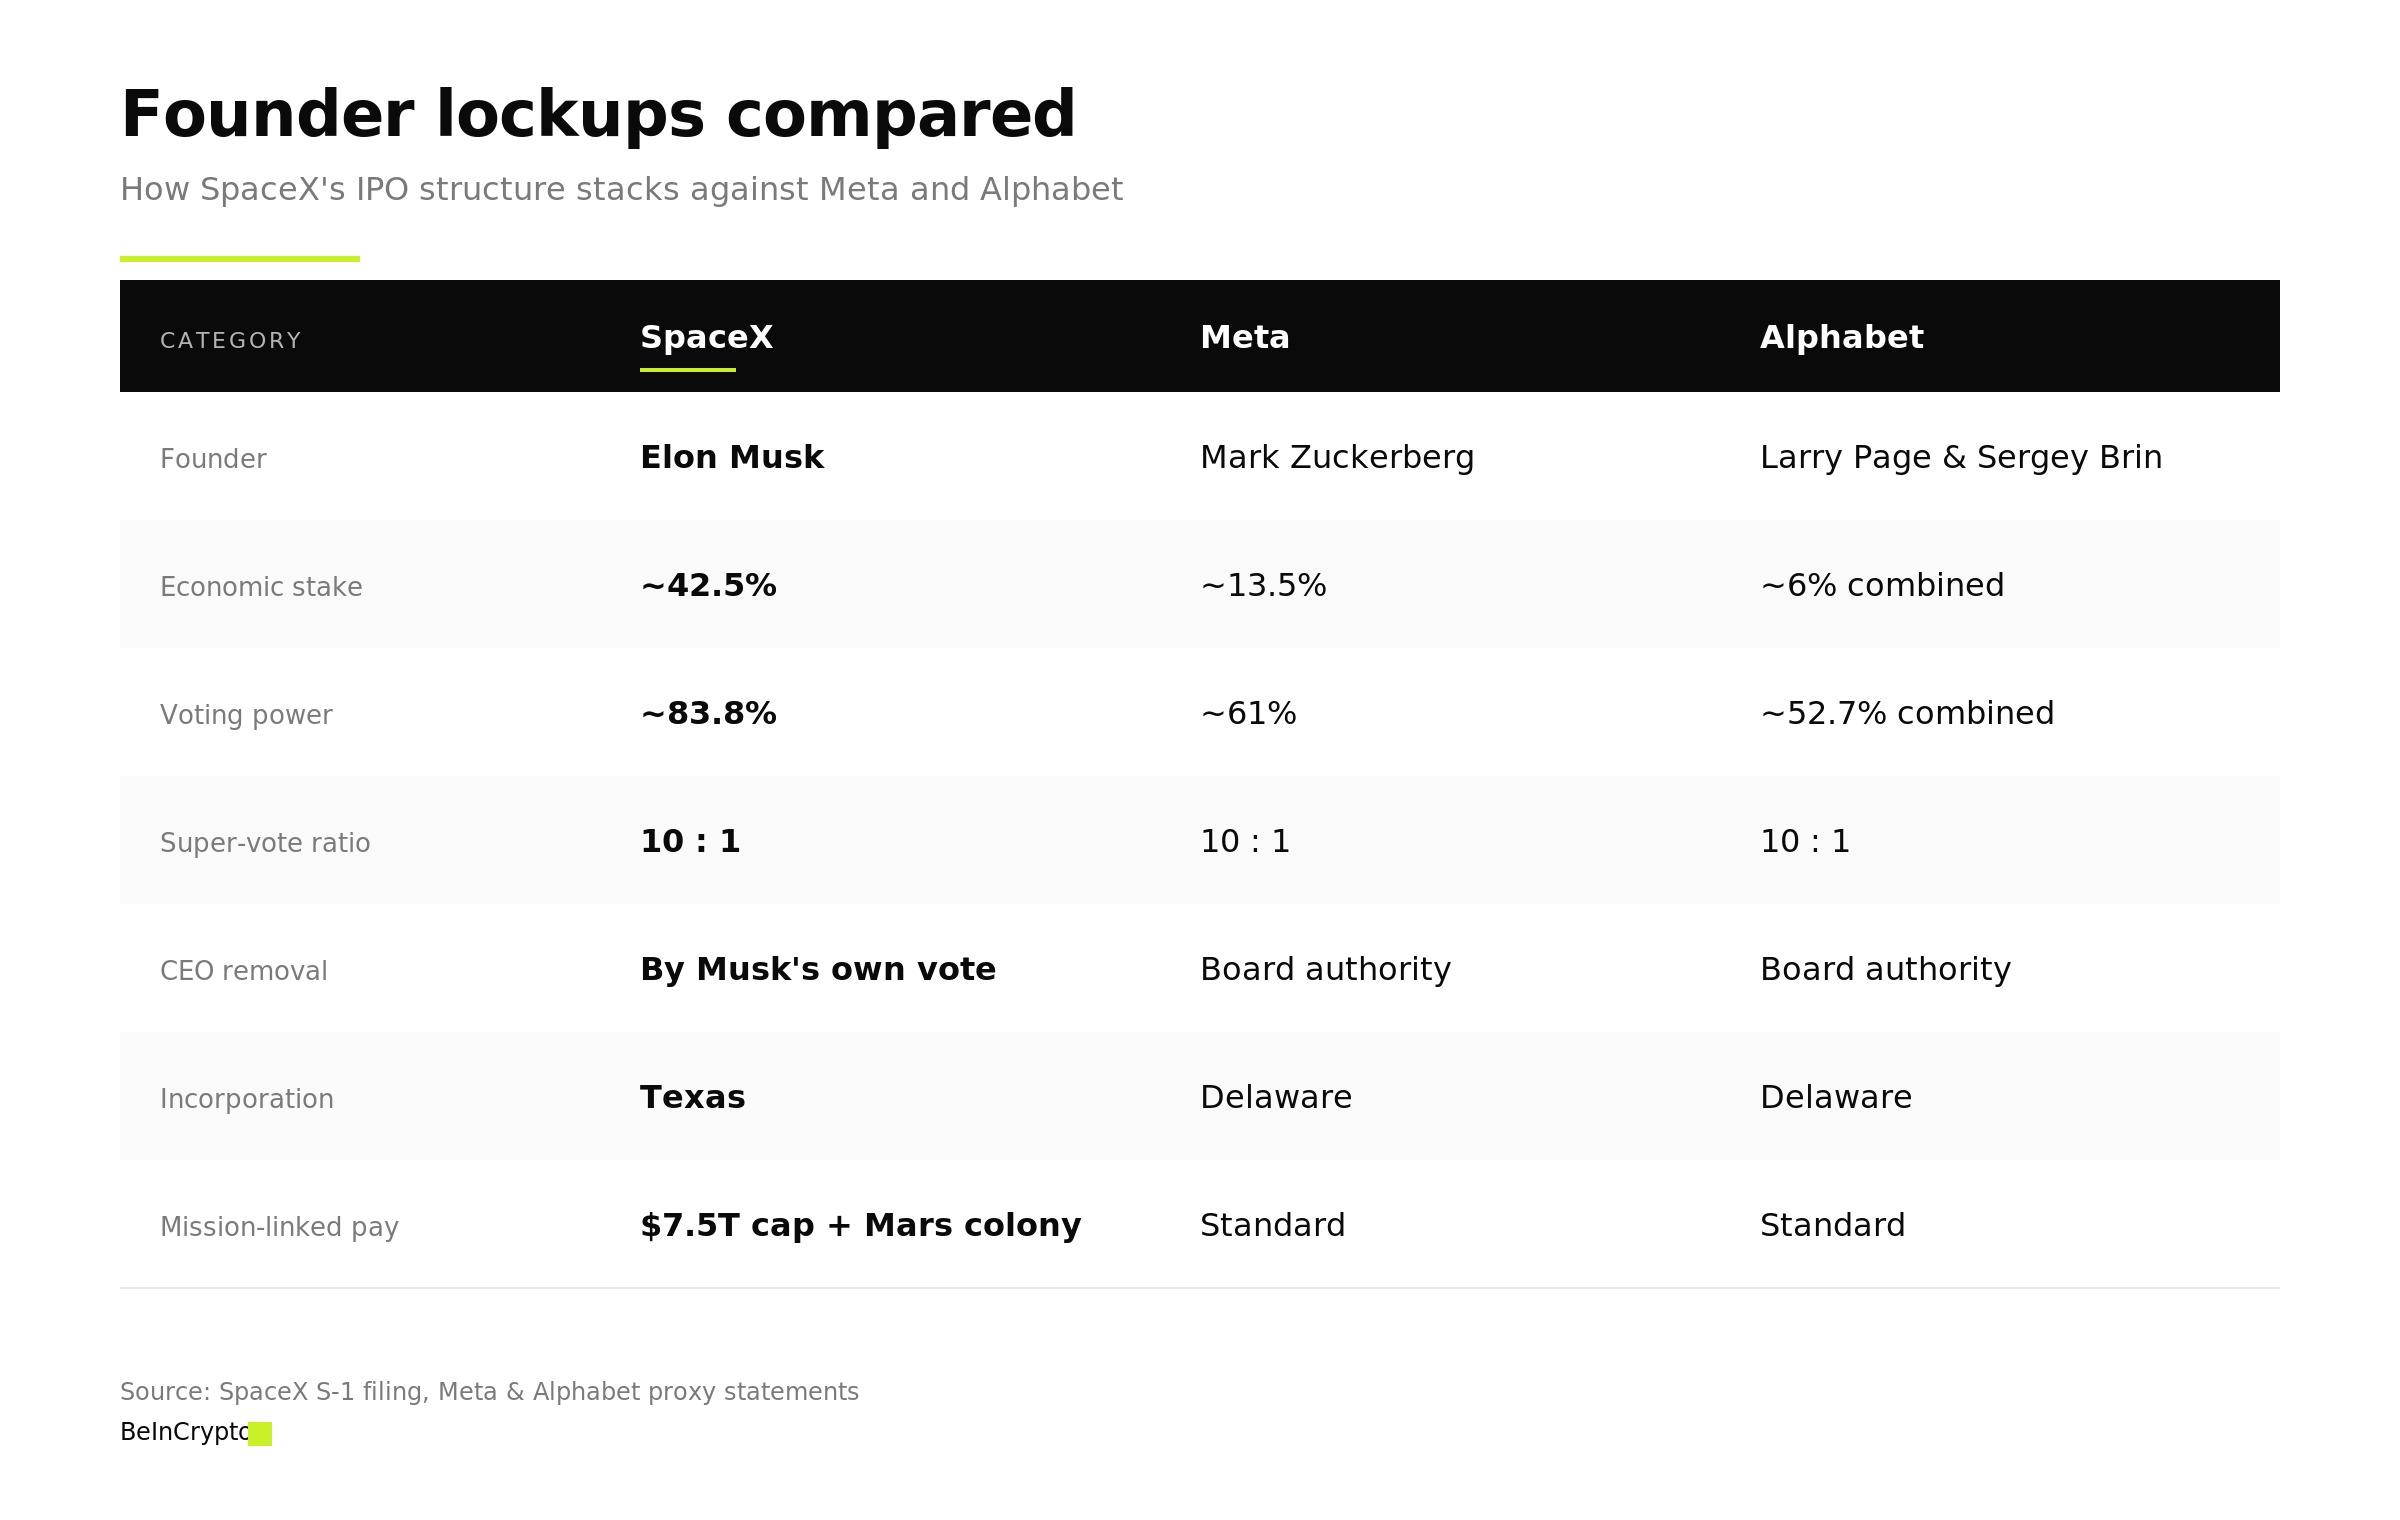
SpaceX’s IPO prospectus does something rare. It strips public investors of the right to remove the chief executive. The same filing warns that his departure could be existential.
The contradiction is structural, not accidental. The S-1 asks markets to fund a single founder. It also asks them to accept a pay package whose triggers exist only in projection.
The SpaceX IPO Hardwires Single-Point Failure
Musk holds about 42.5% of SpaceX equity but 83.8% of voting power through Class B super-voting shares. The S-1 states removal from his roles requires a Class B vote. He controls those votes outright.
Harvard Law professor Lucian Bebchuk called the arrangement “not common.” Boards typically retain formal removal authority. The structure collapses that authority into Musk’s voting bloc, leaving a self-veto in its place.
The filings flag Musk’s loss as a multi-page risk factor. They cite his overlapping commitments at Tesla, xAI, X, Neuralink, and The Boring Company.
No structured succession framework appears, and no deputy is positioned to take over.
Corporate Feudalism Returns to Public Markets
Texas incorporation, mandatory arbitration, and a controlled-company exemption sit alongside a 3% or $1 million floor on shareholder proposals. The filing itself states public shareholders’ influence will be limited or eliminated.
Pension fund officials have already pushed back. CalPERS, the New York State Comptroller, and the New York City Comptroller signed a joint letter.
They call the Musk-led structure a departure from accepted public-company standards.
SpaceX argues the structure protects long-horizon goals from short-term shareholder pressure.
That defense does not address removal mechanics. Founder lockups at Meta and Alphabet look modest by comparison.

A $7.5 Trillion Mars Milestone Is Not a Valuation
The main pay tranche awards Musk up to 200 million Class B shares. It vests only if SpaceX reaches a $7.5 trillion market capitalization. The same trigger requires a permanent Mars colony of at least one million residents.
The $7.5 trillion threshold sits above the combined market value of Apple, Microsoft, and Saudi Aramco. The Mars criterion has no precedent, no infrastructure to project against, and no off-world regulatory framework.
Neither benchmark fits standard valuation methods.
A second tranche grants up to 60.4 million shares for orbital data centers with 100 terawatts of compute. The award mirrors xAI’s terrestrial AI race. The S-1 admits such operations may not be commercially viable.
That is the price of single-point governance combined with speculative pay design. Investors are asked to fund a company they cannot influence and price milestones no model can value.
The only person who could fail the mission is the one allowed to define it.
The post $1.75 Trillion SpaceX IPO Hardwires Elon Musk As Single-Point Founder Risk appeared first on BeInCrypto.
Crypto World
Arkham Intelligence Reports 90%+ Token Concentration in $LAB Project Trading at $4B Market Cap


Blockchain intelligence firm Arkham flags extreme insider ownership concentration in $LAB, which has surged 3000% in three months.

'People should have never doubted me' – Rousey on Carano comeback fight

Popular node-ipc npm package compromised to steal credentials

The Most Powerful Man in Finance Owns 40 Cryptocurrencies And Almost Nobody Knows
Manchester United reach agreement with Casemiro over contract clause amid transfer speculation

US brings back mandatory military draft registration

Steven Gerrard disagrees with Gary Neville over ‘shock’ Chelsea and Arsenal claim | Football


-

 Fashion7 days ago
Weekend Open Thread: Marianne Dress
-

 Fashion4 days ago
Coffee Break: Travel Steam Iron
-

 Fashion5 days ago
What to Know Before Buying a Curling Wand or Curling Iron
-

 Politics4 days ago
What to expect when you’re expecting a budget
-

 Tech5 days ago
Auto Enthusiast Carves Functional Two-Stroke Engine from Solid Metal
-

 Politics6 days ago
Politics Home Article | Starmer Enters The Danger Zone
-
 Business6 days ago
Ignore market noise, India’s long-term story intact, say D-Street bulls Ramesh Damani and Sunil Singhania
-

 Tech4 days ago
GM Agrees To Pay $12.75 Million To Settle California Lawsuit Over Misuse Of Customers’ Driving Data
-

 Crypto World5 days ago
CZ says US crypto rivals tried to block Trump pardon
-

 Crypto World6 days ago
PROS explodes 48% as Upbit and Bithumb listings ignite demand
-

 Tech4 days ago
GM agrees to $12.75M California settlement over sale of drivers’ data
-

 Entertainment7 days ago
YNW Melly Denied Bond Again Ahead Of Double Murder Retrial
-

 Crypto World7 days ago
Kraken Parent Seeks OCC Charter, Signaling Regulated Banking Access
-
Crypto World2 days ago
Bitcoin Suisse expands with Digital Asset License and Investment Business Act Registration Approval in Bermuda
-

 Sports7 days ago
Why Nathan Mackinnon Remains the Hart Trophy Favourite over Connor McDavid and Nikita Kucherov | NHL
-

 Sports7 days ago
After Waka Waka, Shakira now drops first teaser for FIFA WC 2026 song | FIFA World Cup 2022
-
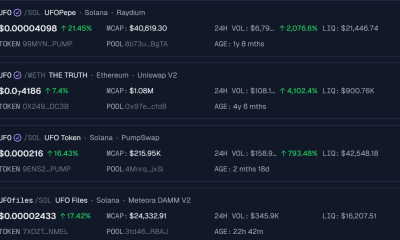
 Crypto World7 days ago
Solana UFO Meme Coins Surge After Pentagon Reveals Alien Files
-

 Entertainment7 days ago
Bethenny Frankel Says She Loves ‘Torturing’ Men
-

 Politics3 days ago
Pakistan to enter Chinese capital market as war inflation bites
-

 Entertainment7 days ago
Young and the Restless Next Week: Cane & Matt Both Arrested in Shocker!
You must be logged in to post a comment Login