

Crypto World
Iran Reportedly Hits Ships in Strait of Hormuz: Oil Price Jumps Again

Oil prices climbed on Tuesday after Iran reportedly fired at least two missiles at commercial ships crossing the Strait of Hormuz, reviving fears over the world’s key oil chokepoint and the fragile truce between Washington and Tehran.
The rebound landed just days after crude erased its entire war premium and sank closer to pre-war levels.
Oil Rebounds Following Sharp Slide Toward Pre-War Levels
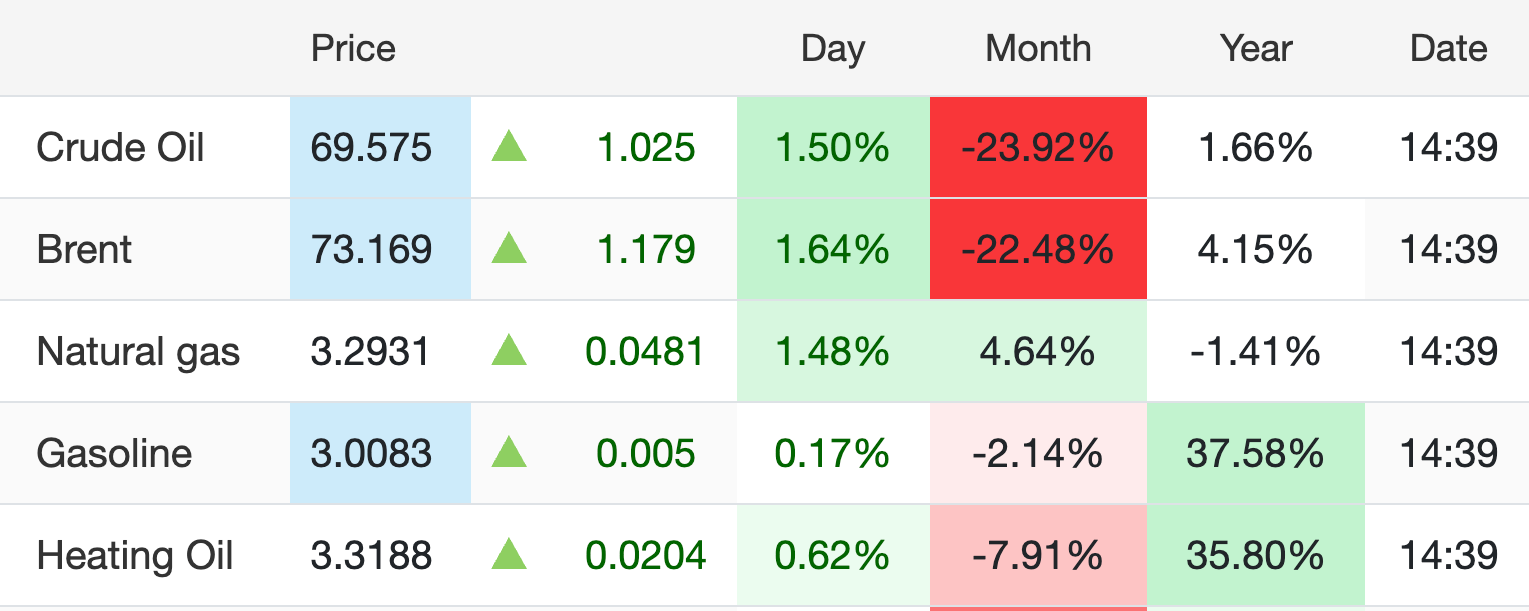
West Texas Intermediate (WTI) crude rose 1.50% to $69.575 on Tuesday. Brent crude gained 1.64% to $73.169.
The wider energy sector also gained. Gasoline rose 0.17%, and heating oil added 0.62%, while natural gas climbed 1.48%.
Follow us on X to get the latest news as it happens

Both oil benchmarks sit far below their wartime highs. Brent has dropped more than 22% over the past month, and WTI has fallen nearly 24% in the same span.
Missile Strikes Test a Fragile US-Iran Truce
The Strait handles roughly 20% of the world’s oil traffic, which magnifies the market reaction to any disruption there. Axios, citing two US officials, reported that Iran fired at least two missiles. The reported strikes came after a one-week agreement between the two sides to halt attacks in the waterway expired.
The United Kingdom Maritime Trade Operations centre reported an incident 8 nautical miles east of Limah, Oman. A southbound tanker was struck by an unknown projectile, causing a fire, according to UKMTO.
A US official said a second commercial vessel was hit by an Iranian missile. Both ships suffered significant damage, though no casualties.
The reported fire threatens a memorandum of understanding barely three weeks after both governments signed it. That deal, reached last month, aimed to end their nearly four-month war. A round of indirect talks in Doha last week closed without meaningful progress.
Meanwhile, the conflict has weighed on President Donald Trump politically. A recent poll found 58% of voters judged the war not worth the cost, while his approval rating held at 36%.
Whether oil extends its bounce or slips back toward pre-war support depends on how Washington responds.
Subscribe to our YouTube channel to watch leaders and journalists provide expert insights
The post Iran Reportedly Hits Ships in Strait of Hormuz: Oil Price Jumps Again appeared first on BeInCrypto.



Bitcoin Suisse has secured full regulatory approval in Abu Dhabi, allowing the Swiss crypto firm to expand its regulated digital asset business across the United Arab Emirates.
Summary
- Bitcoin Suisse has secured a full ADGM license, allowing it to offer regulated crypto services across the UAE.
- The approval follows the firm’s recent MiCA license in Liechtenstein, expanding its regulated presence in Europe and the Middle East.
- Abu Dhabi continues attracting major crypto firms as it strengthens its position as an institutional digital asset hub.
ADGM approval opens regulated crypto services across the UAE
According to a July 7 announcement, Bitcoin Suisse’s Middle East subsidiary, BTCS (Middle East) Ltd., has received full Financial Services Permission (FSP) from the Financial Services Regulatory Authority (FSRA) of Abu Dhabi Global Market (ADGM).
The authorization allows the company to provide regulated digital asset services to institutional clients throughout the UAE.
Under the license, BTCS (Middle East) Ltd. can offer spot trading in approved virtual assets, institutional-grade custody services, and hedging products, including derivatives. The approval follows a multi-stage regulatory review conducted by ADGM before granting the final authorization.
Bitcoin Suisse said it currently safeguards about $3.7 billion in crypto assets globally. The company also ranks as the world’s fourth-largest staking operator by assets, adding an established institutional business to Abu Dhabi’s regulated crypto ecosystem.
Speaking about the approval, ADGM Chief Market Development Officer Arvind Ramamurthy said the arrival of Bitcoin Suisse further strengthens Abu Dhabi’s position as a destination for institutional digital asset infrastructure.
The company added that its Abu Dhabi business is also preparing to support clients seeking access to tokenized real-world assets as that market continues to develop.
Multiple licenses strengthen Bitcoin Suisse’s regulated footprint
The Abu Dhabi approval follows another regulatory milestone secured only weeks earlier. On June 22, Bitcoin Suisse obtained a Markets in Crypto-Assets Regulation (MiCA) Crypto-Asset Service Provider (CASP) license from Liechtenstein’s Financial Market Authority.
The European authorization gives the company passporting rights across the European Economic Area, allowing it to serve institutional investors and high-net-worth clients throughout eligible markets. Together with its existing regulatory approvals, the latest license expands Bitcoin Suisse’s presence across multiple regulated jurisdictions.
Abu Dhabi has continued attracting established crypto firms through its licensing framework. Earlier, Binance secured an ADGM license alongside multiple FSRA authorizations covering trading and custody services, while Kraken also received regulatory approval to operate in the emirate.
The development comes as several jurisdictions across Asia and the Middle East continue building formal crypto regulatory systems. As crypto.news previously reported, Dubai’s Virtual Assets Regulatory Authority recently granted its 50th virtual asset service provider license to Tribe Tokenisation FZE, placing the emirate ahead of Hong Kong and Singapore by reported licensing totals, although those figures do not necessarily indicate the number of active firms or business volumes.
Regulatory approaches across the region remain mixed. Dubai and Abu Dhabi have expanded licensing frameworks designed for digital asset companies, crypto.news previously reported that countries including India and Russia continue to keep state oversight at the center of their digital asset policies.
For Bitcoin Suisse, the Abu Dhabi approval adds another regulated operating base as the company expands its institutional services across Europe and the Middle East under established financial regulatory frameworks.
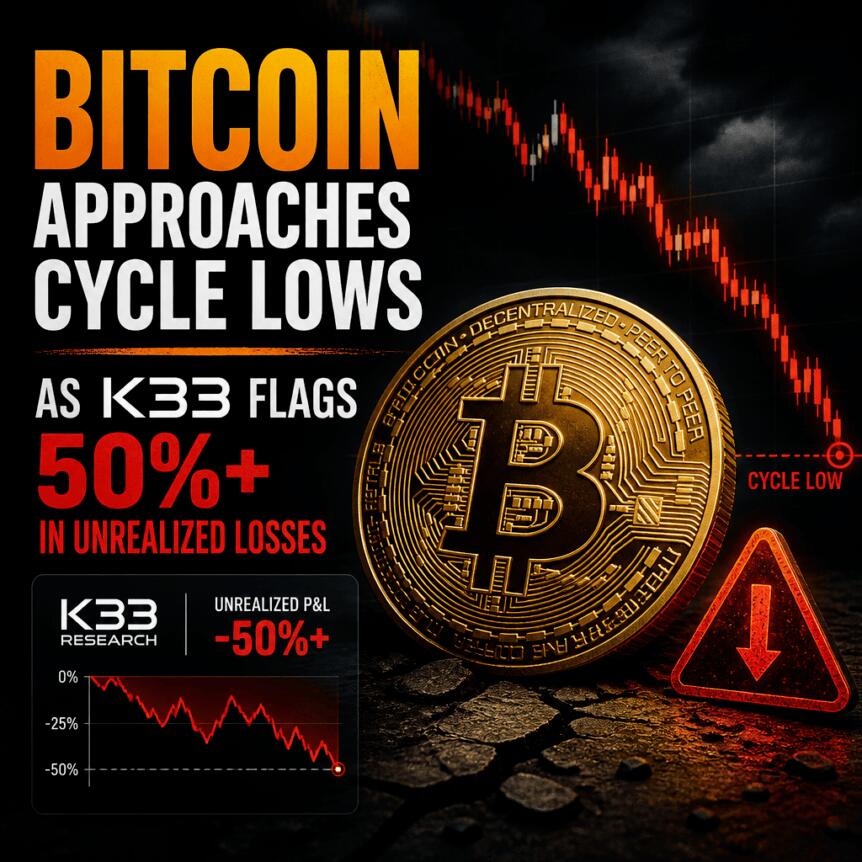
Bitcoin’s “underwater” ratio—the share of circulating supply held at a loss—has climbed above the 50% mark, a threshold that K33 says has often aligned with late-stage bear-market conditions. In its latest research note released Tuesday as part of its H1 2026 roundup, the digital asset brokerage estimated that more than half of all Bitcoin is currently underwater.
K33 also cautioned that this cycle may not mirror prior ones exactly. Because the most recent bull run appeared less extreme than earlier downturn-and-recovery cycles, the firm suggests the drawdown that followed could be comparatively milder. For investors, the key question is what happens after this kind of capitulation-style stress—whether selling pressure truly fades and how quickly “late bear” dynamics translate into renewed risk appetite.
Key takeaways
- Over half of circulating Bitcoin is held at a loss, according to K33—an indicator the firm links to the late stages of bear markets.
- In prior cycles, the sell-off tended to exhaust within weeks of the ratio crossing 50% (with one notable exception in 2014).
- K33 expects this cycle may differ because earlier bull-market extremes were less pronounced this time.
- Spot Bitcoin ETF flows were mixed: two consecutive inflow days followed by record-high June outflows, per Farside Investors data.
- Other gauges point to improving momentum, including Block Scholes’ Risk Appetite Index, which has historically preceded positive 100-day spot returns.
Why the “underwater supply” metric matters
K33’s central observation is straightforward: when a majority of holders are underwater, the market is often closer to the point where forced selling and widespread disillusionment start to ease. Historically, analysts treat the metric as a proxy for the distribution of realized gains and losses across the circulating base—essentially a measure of how much of the ownership is experiencing negative mark-to-market performance.
As K33 framed it in the report, Bitcoin has tended to be in late bear-market phases when more than half of circulating supply is held at a loss. While no single statistic can perfectly time a bottom, the underwater ratio remains popular because it captures a broad ownership reality rather than only short-term price action.
What earlier cycle data suggests about timing
In the report, K33 described how prior bear markets generally bottomed relatively soon after the 50% underwater threshold was reached. The pattern was consistent across multiple cycles:
- 2017 bear market: Bitcoin bottomed 31 days after more than half of supply was held at a loss.
- November 2018: Bitcoin bottomed 23 days after the same condition.
- November 2022: Bitcoin bottomed roughly 13 days after 50%+ supply was underwater.
K33 also highlighted that the 2014 cycle deviated from the pattern. In that earlier period, Bitcoin bottomed 101 days after half the supply was held at a loss, and the asset ended up lower one year after the signal—down about 25%. That outlier matters because it underscores that “underwater majority” can coincide with different macro and liquidity regimes, not just investor psychology.
For current market participants, the most actionable takeaway is not the exact number of days implied by past cycles, but the idea that the 50% threshold has historically marked a phase where the downside momentum has often started to slow. Investors still need to watch whether the current market follows the more typical timing—or whether today’s conditions resemble the 2014-style lag.
ETF flows add a complication to this cycle
K33 flagged that large, structurally different sellers could shift how this cycle behaves compared with earlier ones. Spot Bitcoin exchange-traded funds (ETFs), in particular, can influence price by channeling flows through a regulated wrapper rather than only through traditional trading behavior.
The report pointed to a notable sequence in ETF demand: spot Bitcoin ETFs recorded two consecutive days of inflows, including $265 million on Monday. But according to Farside Investors, those gains were outweighed by $4.51 billion in net outflows in June, which the data described as the worst month on record.
This combination—short bursts of inflow against a still-negative longer trend—can be important for how quickly the market transitions from “stress” to “turn.” Even if the underwater ratio suggests selling pressure may be nearing exhaustion, ETF flow dynamics can reinforce either stabilization or renewed pressure depending on whether June’s outflows continue or reverse.
Risk appetite gauges point to a possible turn
Beyond realized-loss metrics, K33’s report also aligns with other momentum-style indicators. One such tool referenced in the article is Block Scholes’ Risk Appetite Index, which tracks bullish versus bearish momentum across digital assets.
According to the report, Bitcoin’s risk appetite measure fell to -1.27 on July 3 and has since moved higher. Block Scholes tied this kind of rebound to outcomes in past episodes: in the eight prior instances it identified, the median spot return over the subsequent 100 days was 12%.
A Block Scholes spokesperson told Cointelegraph that historically, the move “has preceded a more bullish outperformance in spot prices” and could support additional allocation toward risk assets such as crypto.
What makes this useful for readers is the cross-check. If the underwater ratio is telling you the market is late in the bear phase, and risk appetite is showing an improvement from a low, the combination suggests conditions may be shifting from widespread pain toward more constructive positioning—though it still doesn’t eliminate volatility risk.
What to watch next
With more than half of circulating Bitcoin estimated to be held at a loss, the market is approaching a historically meaningful decision point. Traders and investors should focus on whether ETF flow trends continue to stabilize after June’s record outflows and whether risk appetite measures keep rising—signs that would support a faster transition away from bear-market selling pressure rather than a prolonged, 2014-like lag.
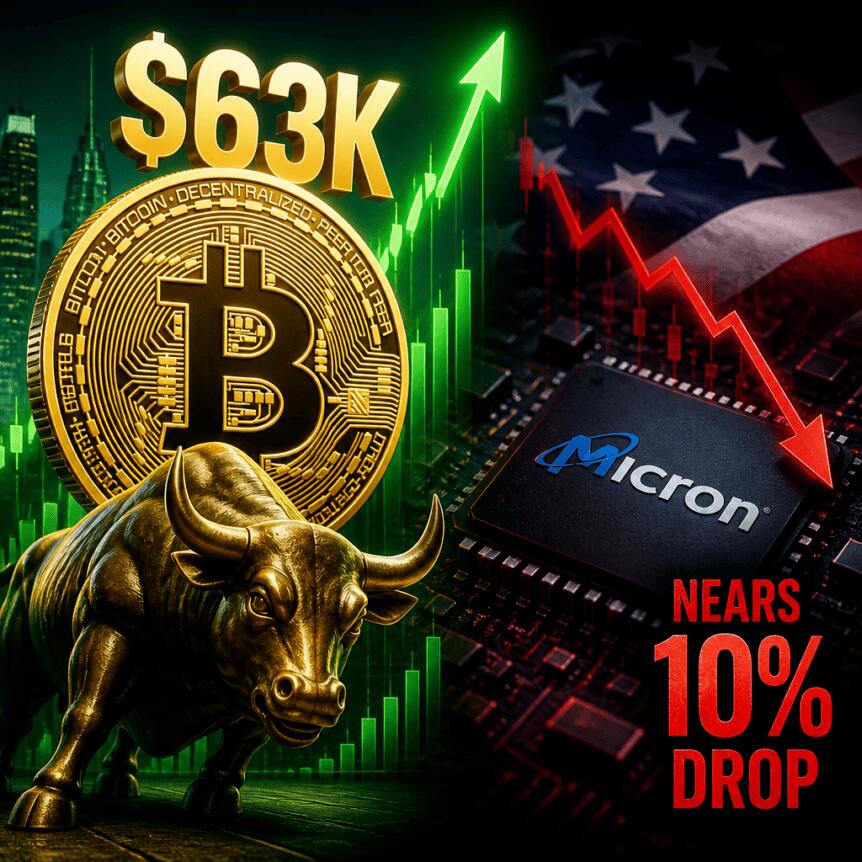
Bitcoin hovered around the low-$63,000s on Tuesday after briefly touching $64,660—its highest level in about two weeks—while US stock indexes slid in early trading. Equity weakness was led by semiconductor names, and the broader move again highlighted how tightly crypto traders are tracking traditional markets during risk-off sessions.
Despite the dip, BTC’s pullback remained orderly as US spot Bitcoin exchange-traded funds (ETFs) continued to post net inflows for a second day, according to data compiled by Farside Investors. That inflow backdrop helped keep a clear downside break from fully materializing as traders debated whether recent price action was only a correction or the start of a more durable shift.
Key takeaways
- BTC pulled back from a $64,660 peak (highest since June 22) as the S&P 500 and Nasdaq 100 fell after the Wall Street open.
- Semiconductor stocks led the equity decline, including Micron Technologies, which was down more than 9% at the time of writing.
- US spot Bitcoin ETFs recorded net inflows for a second consecutive day, providing a floor for sentiment.
- Traders said BTC’s correlation to the Nasdaq has shifted quickly compared with the prior week, changing how BTC is being positioned intraday.
- John Bollinger reiterated that the market is at a “critical point,” pointing to a potential daily “W”-shaped reversal setup.
Bitcoin steadies near $63,000 as stocks slip
TradingView data showed BTC/USD cooling after rising to $64,660, the highest print since June 22. At the same time, market participants watched US equities weaken: the S&P 500 was down about 0.6% and the Nasdaq 100 down around 2.1% during the same window.
Semiconductor weakness intensified the risk mood. Micron Technologies led losses, falling over 9% after highly anticipated earnings late last month (coverage linked by Cointelegraph noted the market attention around those results). That kind of tape matters for crypto not because chip earnings “cause” Bitcoin directly, but because traders often use broader liquidity and index exposure as a proxy for overall risk appetite.
The equity story also carried an index mechanics angle. Tuesday marked the day SpaceX was set to be added to the Nasdaq-100, following its own period of volatility in late June, according to Cointelegraph’s earlier coverage linked in the original report. A faster-than-usual index inclusion—The Kobeissi Letter described SpaceX’s path as the fastest inclusion in the Nasdaq-100’s history in commentary posted to X—can increase near-term positioning and momentum across related exchange-traded products.
ETF inflows and a shifting Nasdaq correlation
While stocks retreated, BTC avoided a sharper breakdown in part because institutional-style demand continued to appear consistent. Fresh inflow data showed US spot Bitcoin ETFs logging a second day of net inflows, as tracked by Farside Investors (see the ETF flow dashboard referenced in the original coverage).
Beyond inflows, some traders focused on the relationship between BTC and the Nasdaq. Trader Daan Crypto Trades reported on X that BTC’s correlation to the Nasdaq had flipped to +0.72 from -0.87 over the span of days the previous week. The implication for day traders is straightforward: when correlation regimes change, strategies built around “hedging” versus “high-beta” equity-like behavior can stop working as expected.
“That’s the difference between trading like a complete hedge/inverse and trading like a high beta tech stock. Right now we’re back to the middle on the 4H timeframe.”
In other words, BTC wasn’t behaving as either a clean hedge or a strict substitute for tech risk—it was in-between, which often makes short-term price action more sensitive to index moves and ETF flow headlines.
Traders split on whether this is a deeper correction
Market commentary remained mixed. Some traders argued that lower-timeframe structure still pointed to additional downside before any larger trend improvement. Cointelegraph-linked coverage mentioned Exitpump as cautious on low time frames, describing an expectation for a “rounding topping structure” and more downside thereafter.
Others framed it as a matter of history repeating through a broader S&P correction. Trader Killa suggested that a “true $BTC bottom” could align with the next correction in the S&P 500, adding that it would be worth checking whether past cycles—citing 2015, 2018, and 2022—repeat in a comparable manner. This is not a prediction of exact dates, but it reflects a common approach: use major equity drawdowns as a timing reference for when liquidity tends to return to risk assets.
For readers, the practical takeaway is that the market signal is not unanimous. ETF inflows and index correlation shifts can stabilize BTC even if technical charts continue to warn of further chop or pullbacks. The next reliable clue would be whether BTC can hold key intraday levels while equities remain heavy, or whether an ETF-flow tailwind can overpower equity weakness for longer than a single session.
Bollinger points to a “W” reversal at a critical juncture
Alongside the trading-floor debate, long-running technical commentary also resurfaced. John Bollinger, the developer of Bollinger Bands, posted additional bullish nuance on X, again emphasizing that the market appears to be at a decision point.
Cointelegraph’s earlier reporting linked in the original piece described Bollinger’s focus on a “W”-shaped reversal pattern developing on the daily timeframe, with the latest iteration potentially confirming a change in trend. Bollinger said last week that the newest setup could even cancel the existing downtrend—while acknowledging that in chart patterns, confirmation often requires follow-through.
On Monday, Bollinger added: “We are at a critical point,” and laid out the logic of how bullish and bearish formations tend to behave differently depending on the prevailing trend.
“In a bear market bullish setups break and in a bull market bearish setups break. So if this W pattern is successful I would see it as a confirmation of a change in trend.”
That framing matters because it highlights what investors should watch next: not just whether the “W” exists on a chart, but whether the market action after the supposed confirmation level actually holds, especially during equity-driven volatility.
As equities remain sensitive to corporate and index catalysts, and as crypto continues to react to ETF flow developments, the “critical point” Bollinger referenced may end up being less about one perfect pattern and more about whether buyers can defend the reversal attempt through the next round of risk fluctuations.
For the near term, traders should monitor two things closely: whether US spot Bitcoin ETF inflows persist as stocks trend lower, and whether BTC can sustain its reversal structure on daily and four-hour timeframes without another sharp correlation-driven selloff.


Kraken, the cryptocurrency exchange planning to go public in the U.S., is pursuing a full banking license in Europe, with a focus on Lithuania as the jurisdiction to secure it, according to a person familiar with the plans.
If the firm gets the license, Kraken would be the only crypto exchange to have such a designation. It will also tread the same regulatory path as fintech major Revolut, which holds a specialized European banking license issued in 2018 and regulated by the Bank of Lithuania. This allowed Revolut to offer full current accounts, consumer lending, and stock trading across the European Economic Area (EEA).
Kraken declined to comment on the plans. A spokesman for the Bank of Lithuania said the licensing process of financial market participants is confidential.
Other fintech firms holding a banking or specialized bank license in Lithuania include Mano Bank, PayRay, European Merchant Bank (EMBank), AB Fjord Bank, and Saldo Bank.
The move to gain full banking status in Europe is part of a broader effort by Payward, Kraken’s parent company, to obtain additional licenses globally.

“There is no major negative fundamental catalyst that we can see,” Dorman said. “These kinds of big movements are common after SPACs because the entire investor base turns over from fixed-income-oriented SPAC buyers to new, fundamentally driven long-term equity owners.”
SPAC merger tickers are often volatile in their early days of trading. These vehicles raise money first and seek an acquisition later, allowing a private company to reach the public market by merging with the shell. But once the deal closes, the investor base often turns over, with SPAC arbitrage investors and redemption-focused holders giving way to public-equity investors weighing the company’s fundamentals. That transition can create sharp price swings, particularly when the float is limited or the stock had traded up before the merger.
Crypto IPO hangover
Dorman added that poor performance of recent crypto-related stock listings have conditioned investors to be cautious.
“Given how horrible recent crypto IPOs have been — Coinbase (COIN), Bullish (BLSH), Gemini (GEMI), BitGo (BTGO) and Circle (CRCL) — it’s not that surprising,” Dorman said.
Since its February IPO, digital asset service provider and custodian BitGo tumbled 70%. Gemini, the crypto exchange founded by the Winklevoss brothers, is down 85% from its September debut. Bullish, CoinDesk’s owner, has fallen over 70% from its $90 debut price in August 2025, and sits below its $37 IPO price.
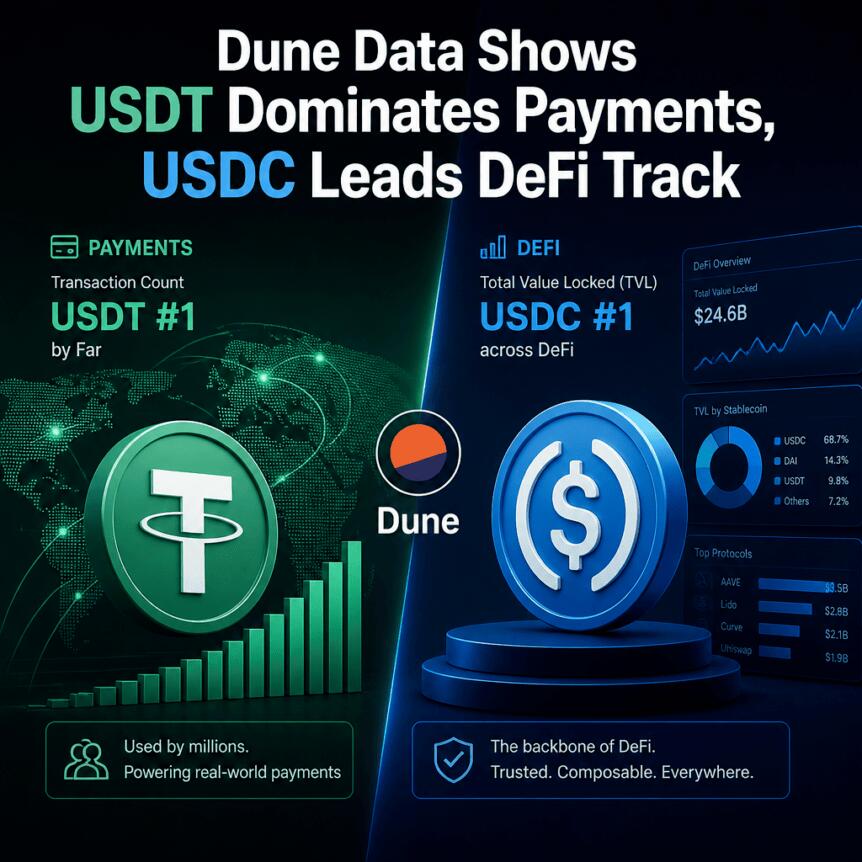
Stablecoin competition is increasingly giving way to specialization. Data from Dune’s Digital Asset Brief suggests Tether’s USDt (USDT) and Circle’s USDC are fulfilling different jobs across the crypto economy—less “winner-takes-all,” more complementary roles feeding payments on one side and DeFi and trading infrastructure on the other.
In the first half of 2026, Dune estimates the biggest stablecoin by activity settled about $95 billion in identified commerce payments. The same dataset points to roughly $14 billion for USDC in those commerce payments and puts USDT at about 92% of the $48 billion business-to-business (B2B) payment volume. On Tron, Dune also reports that approximately 93% of USDT’s supply sits in ordinary wallets rather than exchanges, reinforcing its use as a payment and remittance asset.
Key takeaways
- USDT is leading on real-world-style payments: Dune data shows about $95B in identified commerce payments in H1 2026 versus about $14B for USDC.
- USDC is more central to on-chain finance: USDC transfer volume on Base reached roughly $2.6T in June, with about $1.6T on Ethereum.
- Token distribution hints at use cases: On Tron, Dune estimates ~93% of USDT supply is held in non-exchange wallets, consistent with payments rather than trading.
- Regulatory momentum may change how stablecoins scale: The US GENIUS Act created a federal framework for payment stablecoins, while the CLARITY Act could reshape broader market structure affecting issuers and platforms.
USDT’s payment dominance and what the wallet data implies
Dune’s analysis is particularly telling because it doesn’t just measure token transfers—it focuses on “identified commerce payments.” That framing matters: it aims to map stablecoin flows that resemble merchant and transactional activity rather than purely speculative movement.
According to Dune’s Digital Asset Brief, USDT’s share in B2B commerce is especially large. With roughly 92% of the approximately $48 billion B2B payment volume going to the leading stablecoin, USDT appears positioned as the default settlement rail for corporate and cross-party transfers—at least in the portion of commerce activity Dune can identify.
On Tron, Dune’s “where the supply lives” view adds another layer. With about 93% of USDT supply held in ordinary wallets rather than exchange custody, the stablecoin’s on-chain footprint looks less like an instrument primarily circulating between trading venues and more like an asset staying in the hands of payers, merchants, and intermediaries that use it to settle obligations.
USDC’s DeFi and transfer velocity on Base and Ethereum
While USDT’s dataset emphasizes payments, USDC’s role looks more tied to crypto market plumbing—especially decentralized finance and exchange-like activity. Dune reports that USDC on Base processed roughly $2.6 trillion in transfer volume in June, the highest transfer volume of any token-chain pair. On Ethereum, USDC handled another approximately $1.6 trillion.
Velocity also points to broader usage intensity. Dune notes that USDC on Base recorded daily velocity of about 20 times its circulating supply in June. In practical terms, velocity rising far above one suggests frequent movement of the same supply across trading, lending, or routing activities—patterns often associated with on-chain markets rather than simple payment holding.
Put together, these metrics shift the conversation. Instead of asking which stablecoin “wins,” the more useful question may be where each stablecoin fits in the on-chain stack: USDT appearing to concentrate around payments and remittances, while USDC is more deeply embedded in transfer-heavy trading and DeFi ecosystems.
Why the USDT-versus-USDC narrative is losing clarity
Dune’s findings effectively argue that the traditional framing—USDT competing directly with USDC as the default stablecoin—does not capture how stablecoins actually behave across chains and use cases.
One way to see this is through concentration patterns. Dune reports USDT’s supply is split almost evenly between Tron and Ethereum, whereas USDC remains heavily concentrated on Ethereum despite expanding to newer blockchains. That distribution aligns with the performance profile the dataset shows: USDC’s most prominent volume and velocity signals appear tied to Ethereum and Base activity, while USDT’s stronger commerce-payments footprint aligns with Tron’s large role in everyday transfers.
Meanwhile, the stablecoin market remains dominated by both issuers’ assets. Dune tracked more than 200 stablecoin tokens across multiple blockchains and estimates USDT and USDC together account for roughly 83% of the sector’s approximately $315 billion market capitalization. In other words, even if the “competition” is shifting toward specialization, the center of gravity is still concentrated in these two tokens.
US policy moves: GENIUS passed, CLARITY could broaden the ruleset
These data-driven role distinctions are emerging alongside renewed US regulatory momentum. Earlier this year, the US stablecoin sector gained traction following the passage of the GENIUS Act. Signed into law in 2025, GENIUS created the first federal regulatory framework for payment stablecoins, with the stated goal of enabling banks and other companies to issue US dollar-pegged digital assets. (For background, Cointelegraph previously covered the legislation here: https://cointelegraph.com/news/treasury-genius-act-rule-illicit-finance.)
Lawmakers are now debating the CLARITY Act, which would establish a broader market structure for digital assets by clarifying when crypto assets fall under either the US Securities and Exchange Commission or the US Commodity Futures Trading Commission. While the bill does not target stablecoins directly, it could still influence the operating environment for stablecoin issuers, exchanges, and DeFi platforms through how regulators classify and supervise related activity.
CLARITY cleared the Senate Banking Committee in May and may be brought to a full Senate vote before the August recess, although the odds have been changing as lawmakers face time constraints. Cointelegraph reported that Galaxy trimmed its odds of passage to 50% before the break: https://cointelegraph.com/news/galaxy-cuts-2026-clarity-act-odds-50.
Going forward, investors and builders may want to track more than headline stablecoin market share. Dune’s results suggest that chain distribution, wallet versus exchange custody, and transfer velocity are increasingly important signals of real utility. The next question is how regulation—starting with GENIUS and potentially shaped by CLARITY—will affect which stablecoin roles can scale most easily across payments, lending, and trading.

AbbVie logo on modern glass office building with metal columns, South San Francisco, California, Oct. 16, 2025.
Smith Collection | Gado | Archive Photos | Getty Images
Jefferies recommends owning quality, low-stress stocks to ride out the summer as markets become more volatile amid increased concerns tied to investment in artificial intelligence.
AI-related questions range from potential overcapacity, the profits that will result from hyperscalers investing an estimated $700 billion in capital spending and rising costs for tokens, the fees paid to AI models, according to a note from Desh Peramunetilleke, head of quantitative strategy at Jefferies.
As evidence of the popularity of all things AI, the S&P 500 momentum index has outperformed the broader stock market by more than 70% since 2024, close to levels seen during the dot-com run of the 1990s. Before the outbreak of war with Iran, momentum strategies had included materials and defense stocks, but currently AI alone is carrying the ball, “increasing the risk of an unwind on adverse sentiment,” the strategist wrote Monday.
“While we still see the theme as a long-term winner, the above reasons could drive an unwinding of the AI-led momentum,” Peramunetilleke said.
Peramunetilleke and his team recommended a list of what they call high-quality companies with low momentum to ride out any potential AI-led storms.
Jefferies looked for companies with a high quality score, market values of more than $10 billion, solid fundamentals and long-term free cash flow yields above 3%. The group also had to include stocks with limited momentum and attractive valuations selling for less than 20 times expected earnings over the next year.
Here are 10 stocks from Jefferies’ list:
Drugmaker AbbVie scored a top quality score from Jefferies, which sees the company delivering compound annual earnings growth of nearly 28% in 2026-2027, with a free cash flow yield of 5.2%, one of the stronger growth and cash flow combinations on the list.
AbbVie in its first-quarter financial reported $15 billion in worldwide net revenues, driven largely by a $7.3 billion immunology portfolio. Last week, AbbVie strengthened its next-gen immunology pipeline after agreeing to buy Apogee Therapeutics for $10.9 billion, its largest acquisition in more than five years.
Chicago-based AbbVie is set to release second-quarter results on July 31. The stock has climbed 25% in the past three months, 37% in the past year and yield 2.7%, based on FactSet data.
Netflix, with a $320 billion market value and a 3.6% free cash flow yield, also shared a high quality score in Jefferies’ model. The dominant streaming platform forecast second-quarter revenue growth of 13% despite warning that content spending would be weighted in the first half of the year due to the timing of title launches.
The streaming giant’s shares fell 10% in mid-April when second-quarter guidance fell short of Wall Street expectations and it left full-year forecasts unchanged.
Netflix is set to release second-quarter results on July 16. The stock is down 18% in 2026 so far and almost 41% lower over the past 12 months.
Other companies on Jefferies’ quality, low-stress screen include Lowe’s Companies, McDonald’s and American Express.


NEAR's on-chain governance body, House of Stake, passed proposal HSP-027 to eliminate the protocol's developer gas rebate, a change that will send all network gas fees to be burned rather than partly rebated to smart-contract owners. NEAR co-founder Illia Polosukhin confirmed the outcome Monday,… Read the full story at The Defiant
Tether has taken a $20 million stake in Brazil’s Mercado Bitcoin as it pushes further into tokenized financial products and stablecoin-powered payments across Latin America. The investment is intended to back the company’s expansion into tokenized assets, lending and other blockchain-based services throughout the region.
Mercado Bitcoin, originally launched in 2013 as a crypto trading venue, has since broadened into regulated financial offerings. The platform says it now serves more than 4.5 million users and has issued over 2 billion Brazilian reais (about $370 million) in tokenized assets, while operating under nearly a dozen licenses in Brazil and Europe, including a payment institution authorization from Brazil’s central bank.
Key takeaways
- Tether’s $20 million investment targets Mercado Bitcoin’s expansion into tokenized assets, lending and stablecoin payments in Latin America.
- Mercado Bitcoin positions its business model as “onchain” financial infrastructure supported by multiple licenses, including Brazil’s payment institution framework.
- Tether says it is using profits from its stablecoin business (including USDT) to fund strategic investments in blockchain financial services.
- The deal builds on Mercado Bitcoin’s earlier tokenization deployments, including a $20 million private credit rollout on Bitcoin’s Rootstock sidechain.
Tether backs Mercado Bitcoin’s regulated onchain push
The partnership highlights how stablecoin issuers are increasingly funding regulated platforms rather than focusing solely on token supply. Tether Investments’ stated approach is to support companies building blockchain-based financial infrastructure, and Mercado Bitcoin is positioned as one of Latin America’s most developed “regulated onchain” ecosystems—according to Tether CEO Paolo Ardoino.
Ardoino said Mercado Bitcoin has established a comprehensive platform by combining licensing, tokenization capabilities, and integrated financial services. For investors and users, the practical takeaway is that the project is aiming to connect tokenization and payments to mainstream financial rails under oversight, rather than treating blockchain services as purely standalone experiments.
While the statement emphasizes regulatory breadth, the investment also implicitly addresses a core challenge facing tokenized finance: making tokenized products easier to deploy within existing legal and payment frameworks. Mercado Bitcoin’s cited license footprint—spanning Brazil and Europe, and including a Brazilian central bank payment institution license—suggests the company intends to keep expanding within compliance constraints as it adds more stablecoin and tokenized offerings.
Tokenization momentum: from private credit to wider asset services
Mercado Bitcoin’s broader tokenization strategy appears to be accelerating. In February, the platform announced it had deployed more than $20 million in tokenized private credit, describing this as part of its expanding real-world asset (RWA) activity. That deployment was carried out on Bitcoin’s sidechain Rootstock, according to earlier reporting from Cointelegraph: Mercado Bitcoin expands LatAm RWA push.
Against that backdrop, Tether’s new investment can be read as reinforcement of a direction already underway: scaling tokenization use cases beyond early pilots. The company’s most recent plan explicitly includes stablecoin payments and lending—two segments that typically require not only token issuance and custody capabilities, but also reliable payment processing and settlement infrastructure.
Still, the specific operational details of how the $20 million will be allocated within Mercado Bitcoin’s product stack weren’t provided in the information available here. Readers should watch for updates on whether the funding is earmarked for token issuance infrastructure, credit origination/servicing, or specific stablecoin settlement integrations.
Where Tether’s money is coming from
For Tether, the Mercado Bitcoin investment fits a broader pattern of deploying capital through its investment arm. The company issues USDT, which it describes as the largest stablecoin by circulation, with about $184 billion in circulation cited in the underlying material.
In its Q1 2026 results, Tether reported approximately $1.04 billion in net profit and said it is using those earnings for strategic investments. The underlying report also notes ongoing emphasis on reserves; the investment announcement ties directly to this broader capital deployment thesis via Tether’s finance strategy.
Beyond Mercado Bitcoin, Tether’s participation in other initiatives—such as a $134 million funding round for the Stablecoin Development Corporation—has also been framed as part of expanding the “stablecoin economy” and the infrastructure around it. In April, Tether backed that financing round, and later invested in remittance platform LemFi with the aim of supporting USDT settlement for cross-border payments across Africa and Asia.
Tether also outlined plans to work with the Government of Georgia to launch a stablecoin pegged to the Georgian lari under the country’s digital asset framework. Separately, Tether has said it invests in sectors including artificial intelligence, energy, biotechnology and digital media through its investment arm.
Signals for stablecoin adoption and regulated finance in LatAm
The Mercado Bitcoin deal matters because it sits at the intersection of three trends: tokenization of real-world assets, stablecoin payments, and regulatory-driven rollout. Stablecoins can reduce settlement friction, while tokenized credit and other RWAs aim to bring traditional financial products onto blockchain rails. Mercado Bitcoin’s licensing and reported track record are positioned as the bridge between those worlds.
For users in Brazil and across Latin America, the most meaningful question is whether stablecoin payments and lending will become integrated into Mercado Bitcoin’s regulated financial stack in a way that supports scale—especially for remittances, merchant payments, and other high-frequency use cases. For builders and institutional participants, the investment suggests continued demand for compliant infrastructure that can connect tokenized assets to payment systems.
There’s also an important context point: Tether leadership has previously addressed speculation about going public. Paolo Ardoino said the company has no plans to go public, according to a social post linked in the underlying material.
That clarification doesn’t change the Mercado Bitcoin story directly, but it underscores that the investment strategy is being presented as an ongoing part of Tether’s operating approach rather than a short-term funding maneuver tied to corporate restructuring.
Next, the market will likely look for concrete milestones from Mercado Bitcoin: how quickly stablecoin payments and lending roll out under its licensing framework, and whether additional tokenized credit or other RWAs expand beyond the earlier Rootstock-based deployment. The $20 million investment is a clear signal of intent, but execution details will determine how much of Latin America’s tokenized-finance promise turns into sustained, usable products.
Binance added 10 more bStocks tokenized securities as margin collateral, the second expansion in four days. The list includes Alphabet (GOOGLB), Coinbase (COINB), and the triple-leveraged semiconductor token SOXLB.
The push deepens leverage utility for a product whose first month produced $193.3 million in weekly net inflows but also revealed narrow, tech-heavy demand.
Binance bStocks Collateral Push Builds on $193 Million Week
According to the exchange’s announcement, eligible users can post the tokens as collateral under cross margin and unified account modes. Borrowing is not supported, and access is limited to VIP 3 and above users in approved jurisdictions.
The batch also covers DRAMB, a memory-sector ETF token, and arrives four days after 15 additions disclosed on Square. Those included NVIDIA (NVDAB), Tesla (TSLAB), and SpaceX (SPCXB), bringing eligible bStocks collateral to 25 tokens.
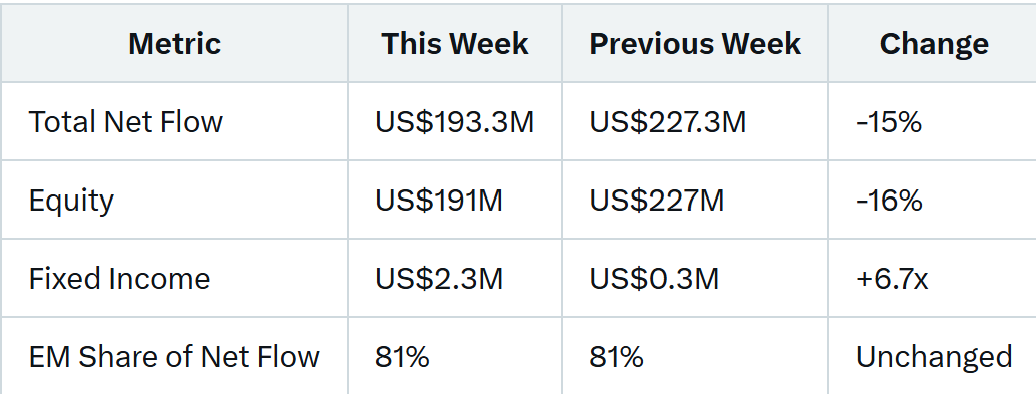
The expansion caps a strong opening month. Binance Research reported a $193.3 million net rise in user stock exposure for the week to July 1. However, that figure fell 15% from $227.3 million the week before.

Binance says users acquired more than $1 billion in US equities after it opened US stock trading on June 1, with roughly 73% of stockholders based in emerging markets.
“Binance launched direct stocks on June 1, giving users access to over 7,000 U.S. stocks and ETFs, right alongside their crypto. In just 30 days after the launch, users have acquired more than $1 billion of U.S. equities on Binance, while generating close to $3 billion in trading volume. Around 73% of people using Binance’s direct stocks come from emerging markets, the places traditional brokerages have underserved for decades.”
Follow us on X to get the latest news as it happens
Warning Signs Behind the Headline Numbers
Binance’s own data reveals heavy concentration. Technology absorbed $159 million, or 83% of net inflows, in the latest weekly report. Binance Research titled that report “From Missiles to Memory” after inflows rotated from defense stocks into memory and chip names.

The pattern runs deeper than one week. Tech accounts for 71% of all stock holdings, with semiconductors alone drawing 48% of allocations. Meanwhile, just over 700 of more than 7,000 available assets have traded, roughly 10% of the catalog.

Against that backdrop, accepting SOXLB (triple-leveraged semiconductor token) as collateral looks bold. The token tracks a 3x leveraged semiconductor ETF, so a chip downturn could hit both positions and their collateral.
In addition, bStocks already back loans through a tokenized stocks collateral market on BNB Chain.
Competition raises further questions. Ondo controls about $870 million of the nearly $1.08 billion tokenized stock market, dwarfing bStocks’ visible share.
Regulatory friction adds pressure too. Binance logged record weekly crypto outflows of $1.23 billion as the EU’s Markets in Crypto-Assets (MiCA) rules took hold.
Collateral expansion may deepen bStocks liquidity, but it could equally concentrate leverage in the same few volatile trades. With weekly inflows already cooling, the next fund flow reports should reveal which effect dominates.
The post Binance Expands bStocks After $193 Million Debut, but Warning Signs Emerge appeared first on BeInCrypto.
Broncos Floated as Weird J.J. McCarthy Trade Fit

Former Impinj CEO Bill Colleran tapped to lead Seattle AI coding startup Adronite

Which high-profile figures took legal action against the Mail publisher?


-

 Fashion4 days ago
Weekend Open Thread: High Hopes
-

 Fashion1 day ago
Open Thread: What Great Books Have You Read Recently?
-
 NewsBeat3 days ago
Taylor Swift and Travis Kelce wedding staffer hilariously struggles to keep her cool while checking in megastars
-

 Politics4 days ago
The House | “Reframing the debate from a binary discussion of winners and losers”: Yuan Yang reviews ‘We Are Not Machines’
-
 Crypto World6 days ago
Airdrop Registration Becomes Key Focus For Remittix As RTX Launch Updates Approach
-
 Crypto World4 days ago
Standard Chartered Secures MiCA License as ESMA Adds 37 New Crypto Firms
-

 Business1 day ago
AXT Shares Jump Nearly 14% as Semiconductor Materials Maker Rebounds on AI-Linked Indium Phosphide Demand
-

 Sports6 days ago
Broncos roster: OL Ben Powers (No. 74) entering final year of contract
-

 Crypto World6 days ago
Binance stock trading tops $1B in first month after launch
-

 NewsBeat7 days ago
Presenter Caroline Flack’s brother Paul Flack dies aged 55
-
Crypto World1 day ago
SK hynix (000660.KS) Stock Dips as $28B Nasdaq ADR Offering Drives AI Memory Expansion
-

 Crypto World6 days ago
Alibaba-affiliate Ant Group enters the humanoid robot market with 12 deals
-

 Crypto World2 days ago
South Africa proposes crypto tax guidance under existing rules
-

 News Videos1 day ago
Best Time to Enter Small Caps Right Now? Another Bull Run? | Financially Free
-
 Tech2 days ago
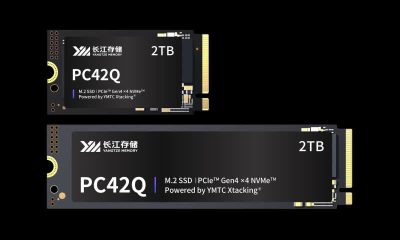
Lenovo laptops are now shipping with YMTC SSDs, a sign of Chinese NAND entering the mainstream
-

 Business6 days ago
Meta Platforms Stock Jumps 7% Today as Bloomberg Reports Company Plans to Enter the Cloud Business
-

 News Videos16 hours ago
Whats Hidden Inside This Cash Register? #treasure #reselling #money
-
 NewsBeat5 days ago
New exhibition reflects five decades of movement between island of Ireland and GB
-

 Business5 days ago
What a 10 Percent Drop Means for Buyers, Sellers and Renters
-

 Crypto World5 days ago
Binance Re-Enters Philippines As EU MiCA Rules Restrict Access
You must be logged in to post a comment Login