
Crypto World
It took Michael Saylor seven minutes to define mNAV


Michael Saylor spent nearly seven minutes at the BTC Prague 2026 conference this week explaining the meaning of the term “multiple-to-Net Asset Value” or “mNAV.”
However, the clip of Saylor’s rambling response went viral for the wrong reason. Almost nobody could follow the answer.
The length and complexity of the definition was also humorous given that Saylor is the founder of Strategy (formerly MicroStrategy), a DAT that publishes its mNAV on its homepage: 1.18x.
How can the answer be precisely 1.18x, yet be so difficult to define?
The first problem? There is no NAV.
Debt-laden companies with payables and other obligations don’t have “NAV” in the first place, which is a controlled term reserved for regulated funds.
Nonetheless, crypto investors likened “NAV” to the value of the crypto holdings at a digital asset treasury (DAT) company.
According to Strategy’s website, the company owns $52.9 billion worth of bitcoin (BTC), and Strategy’s enterprise value is $62.1 billion. Therefore, Strategy has a 1.18x multiple above its $52.9 billion “NAV,” which isn’t really a NAV, but well, whatever.
And it would be whatever, if only the reality were that simple. In fact, it gets worse.
Indeed, at BTC Prague 2026 on Wednesday, Twenty One executive Jack Mallers asked Saylor to define mNAV. Like Saylor, Mallers is a leader of a publicly-traded DAT but remains a little confused about what mNAV really means.
A Bitcoin media outlet posted the exchange with a blunt caption: “Saylor gives nearly a 10-minute answer when Jack Mallers asks him to define mNAV.”
The recording started trending immediately on X, earning hundreds of thousands of combined views.
Mallers’ question, and Saylor’s barely comprehensible response, were as authentic as they were funny. Trying to calm the virality, Mallers wrote, “Pretty basic questions and I was asking them genuinely. How is that shade?”
For example, he asked Saylor how Strategy counts out-of-the-money convertibles. He also wanted an example of a “dilutive” transaction, since Saylor insists swapping equity for dollars isn’t necessarily dilutive.
Read more: Strategy’s bitcoin premium vanishes as mNAV crashes to 1x
A personal definition of mNAV
Even the most basic metric is one that Saylor needs multiple paragraphs to explain.
From the stage, he described mNAV as the equity market cap:
- adjusted for net debt
- adjusted for the notional value of preferred equity
- divided by the BTC value
- adjusted for disclaimers and definitions on 8-Ks
- adjusted for quarterly SEC filings.
He also spoke at length about subsequent amendments, and other figures across Strategy.com.
Indeed, By the end of his answer, Saylor had delivered more of a reading list than a definition.
However, this complexity isn’t accidental. It distracts from the number itself, which keeps going down.
The simple version or “basic mNAV,” market cap divided by the USD value of crypto holdings, has slid below 1x at Strategy after enjoying months in the 2-4x range when sentiment was far better.
The more flattering version of mNAV, enterprise value mNAV, remains slightly higher than 1x — but not by much.
‘Is not equivalent to net asset value or NAV or any similar metric’
The deepest irony sits in Strategy’s own filings. The company concedes that its “BTC NAV” isn’t actually related to net asset value, despite the NAV acronym standing for the words “net asset value.”
It warned that the label “is not equivalent to ‘net asset value’ or ‘NAV’ or any similar metric in the traditional financial context.”
In other words, one of the most popular terms in the DAT industry is nonsensical.
Basic mNAV numbers keep falling below 1x across the sector, so those are no good anymore. The more flattering enterprise value mNAV variants are dangerously close to sub-1x territory, so those are hardly confidence-inspiring either.
Unfortunately, explaining all of these realities eats up valuable minutes of stage time and leaves an inquisitive mind exhausted.
Protos has previously catalogued Saylor’s habit of inventing terminology. That habit continued with his performance this week.
A number everyone can understand: A $9 billion unrealized loss
Fortunately, real prices simplify all of this wordplay to a simple matter of dollars and cents. Strategy holds 845,256 BTC worth about $53 billion against a cost basis near $64 billion.
That leaves the company with a $9 billion unrealized loss on its multi-year BTC investment.
MSTR, the company’s common stock, closed yesterday down 24% year-to-date and down 70% over the past 12 months.
That’s math that anyone can understand.
On the other hand, when defining a term at the core of a valuation decision needs seven minutes and hundreds of pages of follow-up reading assignments, the problem might not be the audience.
A metric like mNAV that requires that much explanation is saying something with the convoluted explanations themselves.
Got a tip? Send us an email securely via Protos Leaks. For more informed news and investigations, follow us on X, Bluesky, and Google News, or subscribe to our YouTube channel.

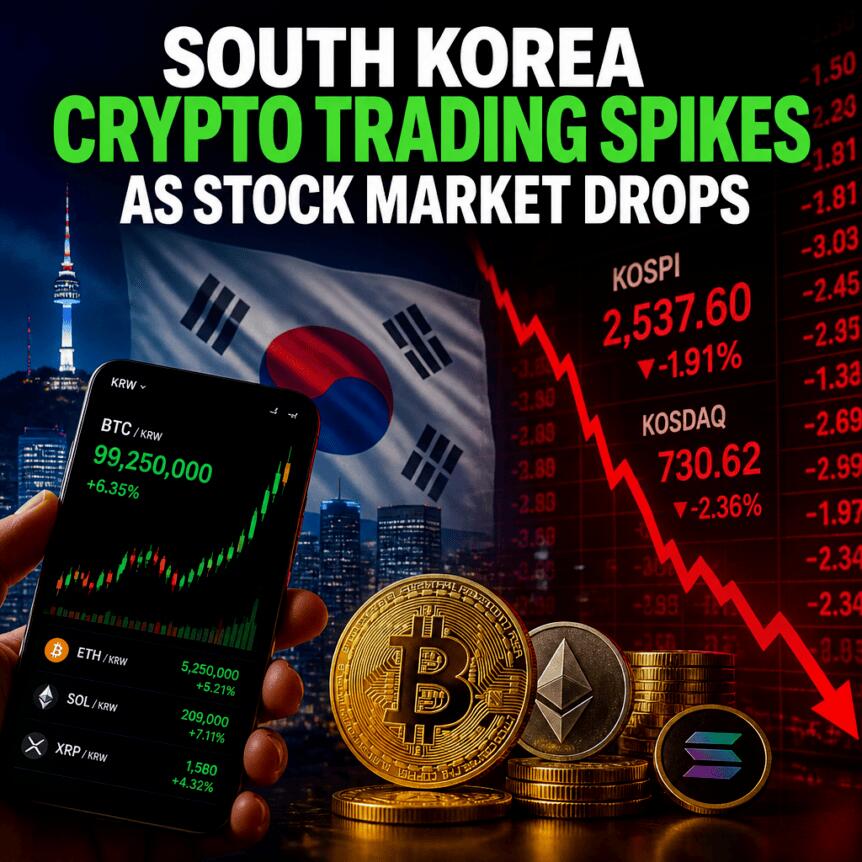
South Korean crypto markets saw a sharp burst in activity after the KOSPI suffered steep losses this week, highlighting how equity sell-offs can quickly redirect attention toward digital assets—and related products traded overseas. According to data from Upbit, trading between the Korean won and Tether (USDT) accelerated rapidly during the index’s decline.
Meanwhile, analysts are pointing to a different storyline in parallel: despite the macro pressure weighing on risk assets, Bitcoin has shown relative strength compared with large U.S. stock benchmarks. Bitwise’s latest research argues that the cryptocurrency’s performance is increasingly notable as financial conditions tighten.
Key takeaways
- Upbit KRW/USDT volume nearly hit 200 billion won (about 140 million USDT) on July 29, up from roughly 20 million USDT on July 25—about a 600% jump.
- Local analysis linked the surge to fund rotation away from Korean equities and toward crypto trading or stock-linked derivatives available through overseas venues.
- Prior KOSPI volatility showed a similar pattern: Upbit recorded a volume spike after a 10% one-day drop on July 14.
- Bitwise says Bitcoin has outperformed major U.S. mega-cap stocks and has remained comparatively “flat” since late June’s semiconductor peak.
KRW/USDT trading surges as equities slide
Upbit’s exchange data shows the most direct evidence of the equity-to-crypto link. Trading volume between KRW and USDT climbed rapidly between July 25 and July 29, according to the figures cited in reporting that referenced Upbit’s KRW/USDT market. On July 29, the volume approached 200 billion won (around 140 million USDT), compared with about 20 million USDT on July 25.
That surge arrived alongside a broader wave of downside momentum in South Korea’s KOSPI. The index’s sharp weekly decline—described in the coverage as close to 18% over the period—was tied to weakness in chip-related equities, particularly chip-maker stocks. The implication for investors is straightforward: when liquid, familiar markets begin to fall quickly, some participants look for alternatives that can be traded at any hour and can offer both spot exposure and leveraged strategies.
Local reporting cited analysis from Seoul Economic Daily suggesting that capital may have rotated out of stocks into crypto during the sell-off, or that traders sought access to derivatives tied to Korean equities through overseas exchange platforms. The same coverage also highlighted a possible preference for moving funds to overseas venues or personal wallets to trade perpetual equity futures.
“There is a possibility that demand increased for moving funds to overseas exchanges or personal wallets to trade perpetual stock futures,” said Cho Yoon-sung, a senior researcher at Tiger Research, according to the publication.
In other words, the KRW/USDT spike appears less like random day-trading noise and more like a measurable byproduct of stress in traditional markets. Traders can reposition quickly when the equity tape deteriorates—especially in environments where crypto already functions as a high-velocity risk market.
Stock sell-offs and “overseas” trading pathways
South Korea’s crypto ecosystem continues to be closely intertwined with how local investors express risk. The coverage emphasized that the country’s market remains highly active, with younger participants in particular showing a taste for leveraged products. That appetite tends to amplify volume responses when shocks hit adjacent assets like equities.
There is also a structural element: some investors may prefer to access certain equity-linked exposures through crypto-native derivatives offered by overseas platforms. When KOSPI volatility rises, the willingness to shift capital—either to trade crypto directly or to use perpetual contracts tied to equity themes—can increase.
What’s notable here is that the surge wasn’t entirely new behavior. Earlier in the month, Upbit reportedly registered a conspicuous volume spike after the KOSPI fell 10% in a single day on July 14, as described in earlier coverage referencing Yahoo Finance. That establishes a pattern: large, fast equity moves have previously coincided with elevated crypto trading activity.
Bitcoin’s resilience amid semiconductor pressure
While won-based volumes rose sharply in response to South Korean equity turmoil, analysts elsewhere were examining whether macro weakness would “spill over” into crypto performance. Andre Dragosch, European head of research at Bitwise, argued that Bitcoin has not behaved like a fragile extension of the semiconductor trade.
In commentary shared on social media and referenced by the reporting, Dragosch suggested that Bitcoin has been largely range-bound—“essentially flat”—since semiconductors peaked in late June. His framing is that the expected contagion from a semiconductor-driven risk repricing did not materialize in the way some market participants may have anticipated.
Bitwise’s broader analysis, released earlier in the week, reinforced that view through relative performance. The firm attributed what it called “remarkable outperformance” to Bitcoin versus a set of U.S. mega-cap stocks. In the coverage, Bitwise pointed to comparison benchmarks including large-cap tech exposure and even SpaceX (SpaceX was referenced as part of the comparison set in the text).
Bitwise’s argument went beyond simple relative returns. It linked Bitcoin’s strength to the possibility that the asset may already be pricing early signals of future monetary-policy easing—even while inflation remains a concern and near-term interest-rate hike risks persist. The firm also used the well-known “canary in the macro coal mine” metaphor to describe Bitcoin’s sensitivity to macro conditions.
Bitwise stated in its analysis that Bitcoin continues to show “remarkable outperformance and resilience” versus U.S. mega-cap stocks such as the Magnificent 7 and SpaceX (as cited in the coverage), calling the relative strength “all the more notable” amid tightening financial conditions.
For investors, this matters because it suggests crypto’s behavior is not simply being dictated by the same narrative driving equities. If Bitcoin’s relative strength persists, it may indicate that markets are treating Bitcoin less as an equity proxy and more as a separate macro instrument responding to different expectations—particularly around future policy.
What traders should watch next
The near-term question is whether the KOSPI-driven volume spike is a one-off reaction to a violent week, or a sign that equity volatility is again feeding crypto activity in South Korea. Traders should watch whether KRW/USDT volumes remain elevated through subsequent market days and whether Bitcoin’s outperformance versus U.S. mega-cap benchmarks holds as the macro narrative shifts.

Ethereum’s (ETH) genesis block turned 11 on July 30, closing quite a busy year. The network now runs on a 60 million gas limit, double where it sat two years ago, with rollups carrying roughly 95% of its transactions.
On the morning of the anniversary, blocks were landing about 229 transactions each, close to 21 per second on the base layer, and running 55% full. The base fee sat near 5.3 gwei, which works out to about $0.20 for a plain ETH transfer, $0.52 for an ERC-20 transfer, and $3.79 for a swap, according to data from Etherscan.
Scaling and ETFs
The fund wrappers arrived alongside the scaling. Morgan Stanley began trading the cheapest US ether ETP at a 0.14% expense ratio on Tuesday, staking 50% to 80% of its holdings and passing the rewards through.
Likewise, BlackRock’s ETHB holds spot ETH and stakes a portion of it, the firm’s first crypto fund to do so. Both lean on Revenue Procedure 2025-31, the safe harbor letting exchange-traded products stake and distribute rewards without a separate tax charge.
Two upgrades are queued for this year: Glamsterdam and Hegotá. The 2026 protocol roadmap sets three tracks – scaling, user experience, and hardening the base layer – and targets a gas limit beyond 100 million per block, and names post-quantum readiness a consideration across protocol development.
Despite all of this, it has been a painful year for the native token. ETH traded at $1,920 on July 30, down 49% over the 12 months to the anniversary and 61% below the $4,946 record it set on August 24, 2025. Its market capitalization stood at $231 billion across 120.7 million coins, second behind Bitcoin.
Two Directors Out in Five Months
The network had some interesting developments, and the overall project managed to thrive, despite all the duress the Ethereum Foundation (EF) went through recently.
Around 54 colleagues had departed, close to 20% of its workforce, and reorganized what remained into five clusters covering the protocol, access, user, community and institutional layers, plus operations and management.
Investor Ryan Berckmans, an eight-year figure in the community, attributed the wider wave of exits to disagreements over sub-strategies. He said confidence in the network itself was not the reason. Researchers Carl Beek, Julian Ma, Barnabé Monnot, Tim Beiko, Trent Van Epps and Josh Stark all left during the same stretch.
Tomasz Stańczak stepped down as co-executive director on February 13, effective immediately, with Bastian Aue named interim co-executive director. The board said Stańczak left “after extensive contributions to the Foundation’s mission and operations.”
Hsiao-Wei Wang resigned as co-executive director and board member in June, writing that she had decided to step down “after my sabbatical.” That leaves Vitalik Buterin, Patrick Storchenegger and Aya Miyaguchi on the board.
The post A Rocky Year: Ethereum Turns 11 Years as ETH Trades 61% Below the High Set Last August appeared first on CryptoPotato.


Binance has regained website access across the Philippines after PLDT restored the platform on its network, extending an SEC-supervised return that remains subject to testing and local compliance requirements.
Summary
- PLDT restored access to Binance, following a similar move by Globe Telecom in May.
- Binance is returning through BlockShoals Technologies, an SEC-approved crypto asset intermediary.
- BlockShoals received permission to begin sandbox testing on April 14, 2026.
- Philippine peso payment channels remain pending while the operator completes systems integration.
Binance website returns across major Philippine networks
PLDT users can now access Binance’s localized Philippine website, bringing the platform back across the country’s two largest telecommunications networks. Globe Telecom had already restored access in May.
The Philippine Binance homepage identifies BlockShoals Technologies Inc. as the local entity facilitating access to the exchange. BlockShoals operates as a crypto asset intermediary under the Philippine Securities and Exchange Commission’s Strategic Regulatory Sandbox, or StratBox.
Binance does not operate the local service directly. The website states that BlockShoals acts as an introducing intermediary, while Binance services are supplied by entities regulated in the Abu Dhabi Global Market.
Binance co-founder Changpeng “CZ” Zhao confirmed the website restoration in a July 29 post on X.
“Binance has a very special sandbox license in the Philippines. Website is unblocked in the country. Fiat channel coming soon, I hear,” Zhao wrote.
His comments followed an appearance at the ASEAN Tech Summit in Manila with FinTech Alliance Philippines founding chairman Lito Villanueva.
SEC sandbox replaces Binance’s former unlicensed model
Philippine authorities blocked Binance in 2024 after the SEC found that the exchange had offered investment and trading services without the required local registration.
The SEC asked the National Telecommunications Commission to restrict the website in March 2024. Authorities also sought the removal of Binance applications from local Google and Apple app stores.
Binance’s return uses a different legal structure. BlockShoals received in-principle SEC approval in November 2025, followed by a Notice to Proceed with Testing on April 14, 2026. The authorization allows the company to test Binance-linked services under regulatory supervision rather than launch an unrestricted public operation.
The first phase includes a 90-day integration period involving BlockShoals and a local virtual asset service provider. Customer onboarding is expected to follow after that work is completed.
The sandbox approval is therefore not equivalent to a permanent license. It permits controlled testing while the SEC reviews the service, its safeguards, and its compliance systems.
Filipino users still await local fiat channels
Restored website access removes a major technical barrier, particularly for users who previously relied on virtual private networks or offshore access routes. It does not, however, mean that every local service is ready.
BlockShoals is still connecting Philippine peso payment channels and completing systems required under the country’s anti-money laundering rules. Users may see registration and product information on the localized website, but the official PHP deposit and withdrawal system has yet to complete its rollout.
The Binance app could also return to Philippine app stores once regulators update Apple and Google about the platform’s status. No firm date has been announced for that step.
BNB traded near $592 at the time of writing, up roughly 4% over the previous close. The token’s move came during a broader crypto-market rebound, and there was no clear evidence linking the gain directly to the Philippine access restoration.
What the sandbox model means for US investors
The Philippine structure differs from Binance’s approach in the United States. American customers use Binance.US, a separate platform operated by BAM Trading Services, while the international Binance platform restricts US users.
BlockShoals’ model could provide a case study for exchanges seeking to re-enter markets after enforcement action. It combines a local intermediary, controlled testing, and services delivered through separately regulated Binance entities.
For the Philippines, the next milestone will be the completion of systems integration and the launch of local fiat rails. Until then, the website restoration represents progress toward a regulated return, but not a fully completed public relaunch.
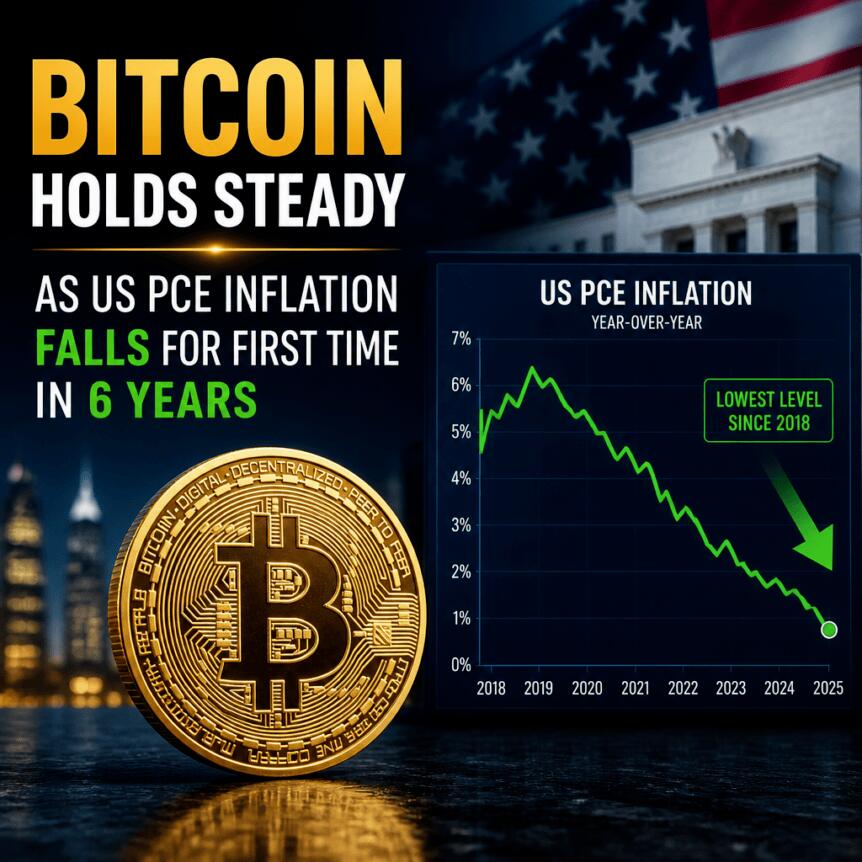
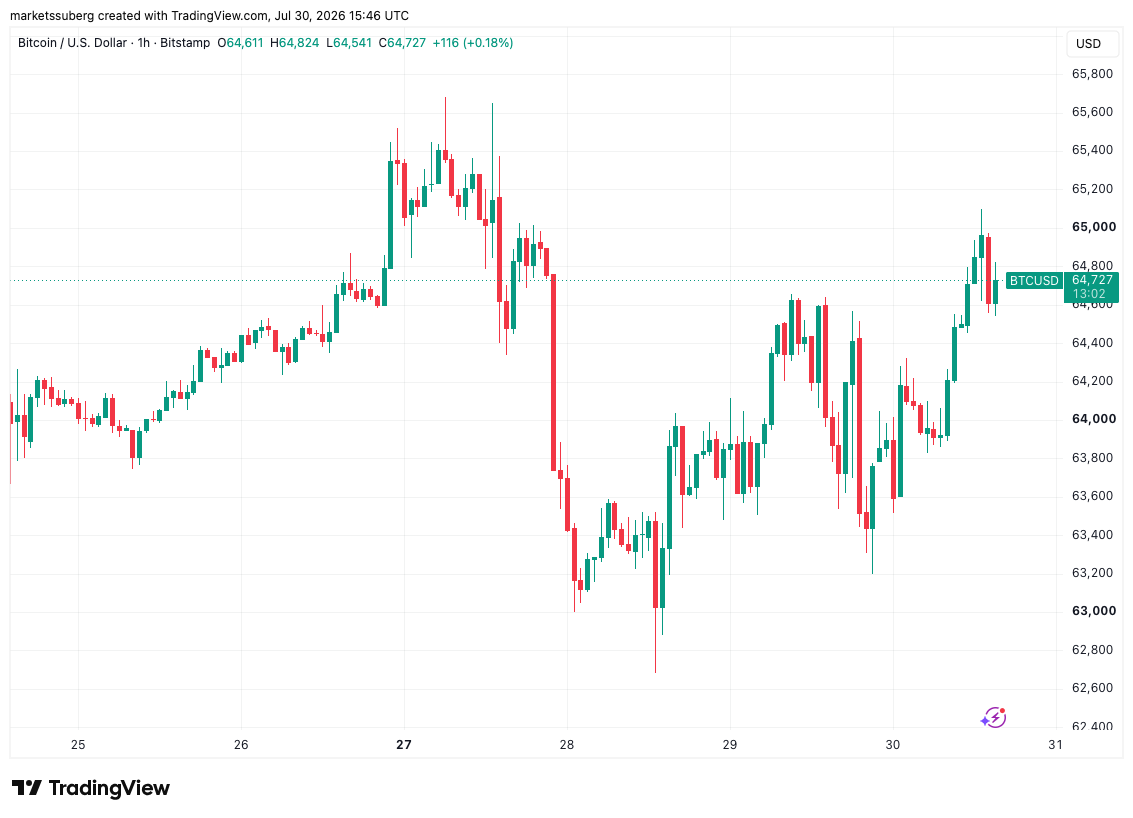
Bitcoin traded with subdued volatility on Thursday as a rebound in US equities and a softer read on inflation reduced the pressure investors had placed on risk assets. In late US trading, BTC held near $64,500, largely steady from the prior day, after market attention shifted to June’s US Personal Consumption Expenditures (PCE) inflation release.
The PCE report showed inflation cooling to 3.7% year-on-year—matching expectations—while S&P 500 and Nasdaq Composite gains reflected a broader “risk-on” tone. Even so, commentators cautioned that the numbers still sit well above the Federal Reserve’s 2% target, keeping the longer-term debate about the inflation path alive.
Key takeaways
- Bitcoin largely shrugged off Thursday’s macro-driven volatility, holding around the $64,500 area as US stocks rebounded.
- June PCE inflation came in at 3.7% year-on-year, in line with forecasts, ending a short-term uptrend in the data.
- Despite the cooler print, inflation remains materially above the Fed’s 2% target, limiting “all clear” confidence.
- Bitwise CIO Matt Hougan argued that future interest-rate moves may be smaller—potentially reducing how strongly BTC reacts to rate headlines.
BTC stays range-bound as equities recover
Charting from TradingView showed BTC/USD action focusing around $64,500, with price behavior described as broadly unchanged versus the previous day. Earlier in the week, crypto had faced a headwind from a broad sell-off in semiconductor stocks, a move that spilled into other risk assets during US trading. That pressure eased on Thursday, helping keep Bitcoin from forcing a sharp reaction to the day’s macro catalyst.
At the time of writing, the S&P 500 was up about 1% and the Nasdaq Composite gained roughly 2.3%, reflecting improving sentiment across markets following the inflation data release.
PCE cools to 3.7%—but remains far above the Fed target
June’s PCE inflation print provided the day’s primary momentum. The year-on-year reading of 3.7% matched market expectations, while May’s figure had been 4.1%, which was described as the highest in three years. PCE is widely treated as the Federal Reserve’s preferred inflation measure because it is based on a broad basket of consumer spending and updates more quickly as consumer choices shift in response to prices. The Federal Reserve Bank of Cleveland describes this framing as a key advantage of the PCE approach.
In its release, the US Bureau of Economic Analysis (BEA) attributed the month’s increase in current-dollar PCE to higher spending—most notably services. The BEA said the $65.2 billion rise in current-dollar PCE reflected increases of $58.2 billion in spending on services and $7.0 billion in spending on goods.
Even with the cooling headline number—and the BEA noting a month-on-month decline—some market watchers treated the report as cautiously supportive rather than decisive. The Kobeissi Letter highlighted that the 3.7% rate was still the second-highest result since October 2024. The account also argued that inflation was running at nearly double the Fed’s 2.0% target.
Economist Steve Hanke also pushed back against complacency, describing inflation as a “genie the Fed just can’t put back in the bottle,” while emphasizing the mismatch between current inflation and the Fed’s goal.
Fed policy uncertainty persists—Bitwise expects weaker rate sensitivity
Beyond the inflation print, Thursday’s narrative also centered on interest-rate expectations. The Federal Reserve left rates unchanged at its latest meeting on Wednesday, with an emerging split among Federal Open Market Committee (FOMC) members over the appropriate policy path.
Matt Hougan, chief investment officer at Bitwise, argued that Bitcoin’s sensitivity to future rate announcements may be lower than what investors have historically experienced. On social media, Hougan pointed to the pattern of rate swings during Bitcoin’s history—ranging across very wide levels—and suggested that future changes may be more incremental. His comment referenced CME Group’s FedWatch Tool, which implies a smaller trajectory for rates over the coming year compared with prior cycles.
Hougan also tied his view to expectations around leadership. He stated that new Fed chair Kevin Warsh is likely to echo former chair Alan Greenspan in terms of the scale of policy moves, contrasting that with Jerome Powell. In addition, he referenced earlier signals from US President Donald Trump suggesting Warsh would take a more dovish stance on policy, a development that, if realized, could support risk-asset performance and reduce the market’s fear of abrupt tightening.
What investors should watch next
Bitcoin’s muted reaction to Thursday’s macro headlines suggests investors are still willing to hold through volatility when equities stabilize, but the debate over whether inflation is truly on a sustainable path remains unresolved. The next key factor will be whether incoming PCE reads continue to ease toward the Fed’s target and whether rate expectations—tracked via tools like CME FedWatch—continue to shift more gradually rather than re-pricing abrupt policy changes.
Crypto World
Russian Bombardment Kills at Least Eight in Ukraine as Zelensky Renews Plea for Air Defense Supplies

The leader of Poland, a NATO member, later said in a press conference that “there is no reason to believe that Poland was the target,” but maintained a violation had taken place.
“After my conversation with President Zelensky, it is quite clear to me that the next 100 days could decide the outcome of this war,” Tusk, who met with Zelensky on Wednesday, declared. “Right now, I would say the chances are fifty-fifty. Much depends on decisions made by the President of the United States.”
NATO is “in close contact with the Polish authorities about the violation of Poland’s airspace,” NATO spokesperson for the Supreme Headquarters Allied Powers Europe (SHAPE) Col. Martin O’Donnell told TIME in an emailed statement.
“The Supreme Allied Commander Europe (SACEUR), General Alexus G. Grynkewich, spoke earlier today with Poland’s Chief of Defence General Wiesław Kukułan about NATO and Poland’s response to the incident, which remains under investigation,” the statement continued. “SACEUR underlined that NATO will continue to take all necessary measures to defend NATO territory.”
Bitcoin (BTC) shook off volatility on Thursday as US stocks rebounded on the back of inflation-data relief.
Key points:
- Bitcoin avoids a snap reaction to US personal consumption expenditures (PCE) inflation data, which reverses a local uptrend.
- Analysis remains wary of inflationary tendencies despite PCE conforming to expectations.
- Bitwise predicts that going forward, Bitcoin will become less sensitive to Fed interest-rate changes.
PCE ends uptrend while staying above Fed inflation target
Data from TradingView showed BTC price action focusing on $64,500, broadly unchanged from the day prior.

BTC/USD one-hour chart. Source: Cointelegraph/TradingView
The major risk-asset headwind from earlier in the week in the form of a mass sell-off in semiconductor stocks eased on the day, sparing crypto during the US trading session. The S&P 500 index and Nasdaq Composite index were up 1% and 2.3%, respectively, at the time of writing.
Nasdaq Composite Index one-day chart. Source: Cointelegraph/TradingView
The June print of the US Personal Consumption Expenditures (PCE) index added another positive catalyst, this coming in at 3.7% year-on-year — in line with market expectations. May’s PCE print, at 4.1%, was the highest in three years.
PCE is considered the Federal Reserve’s preferred inflation measure as it offers a broader and more comprehensive measure of inflation and more quickly picks up adjustments in consumers’ choices in response to price changes, according to the Federal Reserve Bank of Cleveland.
“The increase in current-dollar personal income in June primarily reflected increases in compensation, personal income receipts on assets, and government social benefits that were partly offset by a decrease in farm proprietors’ income,” the US Bureau of Economic Analysis (BEA) said. The BEA said in its data release:
“The $65.2 billion increase in current-dollar PCE in June reflected increases of $58.2 billion in spending on services and $7.0 billion in spending on goods.”
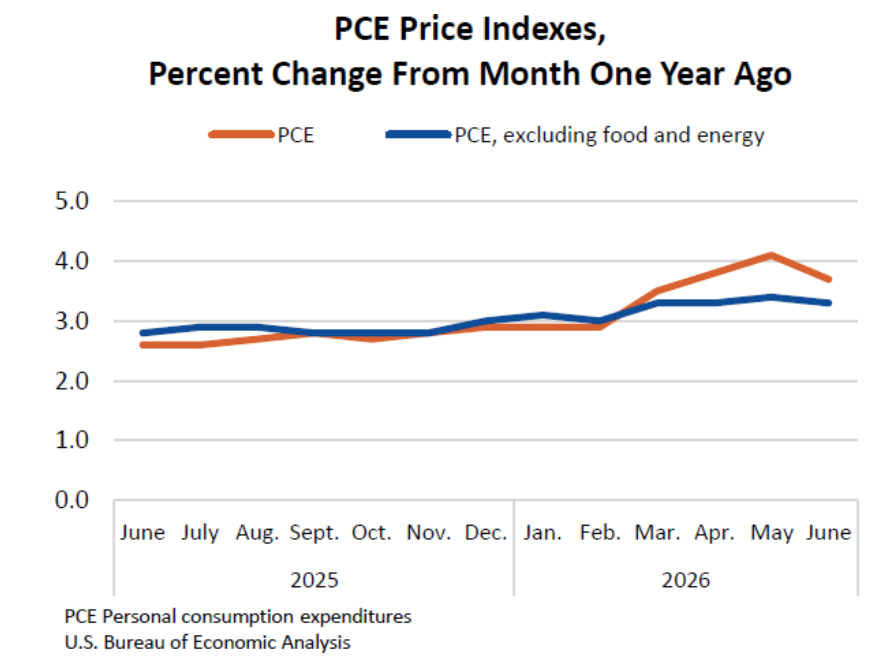
US PCE data percentage change (screenshot). Source: BEA
While ending an uptrend in PCE numbers and showing the first month-on-month decline since 2020, the June print sparked conservative reactions. Trading resource The Kobeissi Letter noted that the 3.7% figure was still the second-highest result since October 2024.
“US inflation continues to run at nearly double the Fed’s 2.0% target,” it said on X.
Johns Hopkins economist Steve Hanke described inflation as “the genie the Fed just can’t put back in the bottle,” while also noting the mismatch with its 2% target.
Bitwise CIO sees BTC brushing off future rate cues
The Federal Reserve left interest rates unchanged at its latest meeting on Wednesday, with an emerging split among the Federal Open Market Committee (FOMC) members regarding appropriate policy.
Related: South Korean crypto trading surges amid stock market plunge
Following the event, Matt Hougan, chief investment officer at crypto asset manager Bitwise, forecast that future interest-rate announcements would have less impact on BTC price performance.
“Rationale: Throughout bitcoin’s history, interest rates swung wildly — from 0% to 2.5% to 0% to 5% to 3.5%. Changes have been measured in whole percentage points. But future changes seem likely to be more modest; the CME expects a 50bps rise over the next year,” he told X followers, referring to rate expectations as measured by CME Group’s FedWatch Tool.
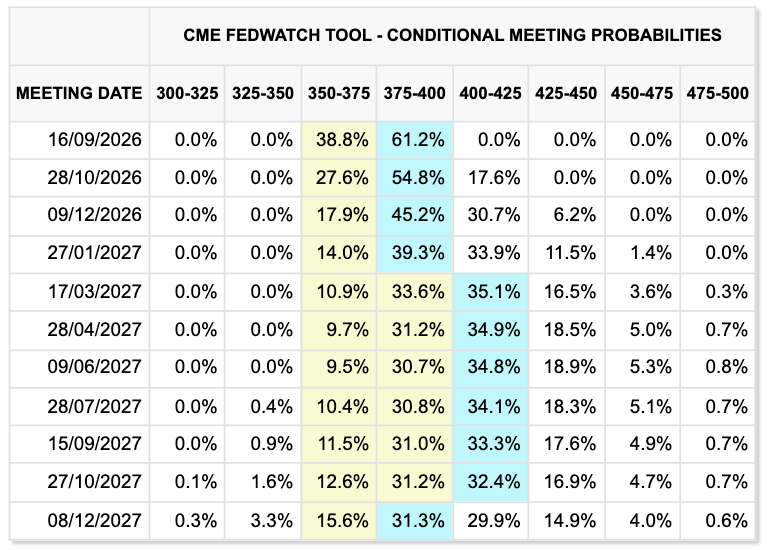
Fed target-rate probabilities (screenshot). Source: CME Group
Hougan said that new Fed chair, Kevin Warsh, will likely echo former chair Alan Greenspan with the scale of rate changes, diverging from his immediate predecessor, Jerome Powell.
Prior to Warsh’s appointment, US president Donald Trump gave repeated signals that he expected Warsh to adopt a dovish stance on the issue, a move that would bolster risk-asset performance.


Asset management giant BlackRock has continued to expand into the Ethereum ecosystem, dipping its toes in Ethereum DeFi, and launching staked ether ETFs, while JPMorgan deepened its blockchain-based settlement initiatives. Together, these efforts illustrate a broader institutional shift toward using Ethereum as the base layer for tokenized real-world assets, drawn by its security, composability and mature developer ecosystem.
TradFi’s growing acceptance of Ethereum is also evident in the markets. Since their launch in 2024, spot U.S. Ethereum spot exchange-traded funds (ETFs) have accumulated more than $11.23 billion in net inflows, reflecting steadily increasing institutional demand for exposure to ETH. Just as importantly, institutions are no longer limiting their relationship with Ethereum to holding its native asset. They are increasingly issuing financial products directly on the network itself.
That contrast may ultimately define Ethereum’s eleventh year. Internally, the ecosystem has experienced one of the most consequential periods of introspection in its history, forcing its leading institution to rethink its structure, leadership and purpose. Externally, Ethereum has never appeared more firmly embedded within the global financial system.
For much of its first decade, Ethereum’s challenge was proving that decentralized infrastructure could work. Its second decade begins with a different challenge: ensuring that the institutions surrounding that infrastructure can evolve without compromising the decentralized principles that made Ethereum possible in the first place.

Tokenized asset specialist Ondo Finance is evaluating a potential acquisition of between $250 million and $500 million, according to a person with knowledge of the matter.
The New York-based company is considering wealthtech targets, among other subsectors, said the person, who spoke on condition of anonymity because the matter is private.
Ondo has not yet appointed any formal advisers, the person said.
Founded in 2021 by former Goldman Sachs executives, Ondo Finance is a tokenization platform that brings traditional financial assets onchain. The company issues tokenized U.S. Treasuries and stocks and has become one of the largest providers of tokenized real-world assets, with more than $2.5 billion across its products.
“As a fast-growing company, Ondo regularly evaluates the market as part of normal business operations. We are not in conversations with any party at this time,” an Ondo representative said in emailed comments to CoinDesk.
Crypto dealmaking has remained strong in 2026 as traditional financial firms and larger digital-asset companies use acquisitions to add licenses, technology and distribution.

Telegram is facing a fresh legal fight in Australia after the country’s online safety regulator moved to seek civil penalties, alleging the messaging service did not adequately address terrorism-linked content.
According to a statement from Australia’s eSafety Commissioner, the regulator filed civil penalty proceedings against Telegram in the Federal Court on Thursday, accusing the platform of failing to meet obligations under the nation’s Online Safety Act.
Key takeaways
- Australia’s eSafety Commissioner has launched civil penalty proceedings against Telegram in Federal Court over alleged failures to tackle pro-terror content.
- The regulator alleges Telegram did not respond sufficiently to multiple user complaints and that some reported material remained visible for as long as three weeks.
- eSafety claims Telegram failed to take adequate preventive steps, including actions to remove or disrupt repeat violators such as channels and groups.
- The case forms part of broader, escalating scrutiny of Telegram’s moderation practices in multiple countries.
- eSafety says penalties could reach up to 54.6 million Australian dollars (about $35.8 million) for violations of the Online Safety Act.
Australia’s allegations focus on delayed takedowns and repeat violations
In its filing, eSafety says it conducted a year-long investigation and concluded that Telegram did not remove certain unlawful material after it became aware of it. The regulator alleges that, in some instances, reported content continued to be visible for up to three weeks.
eSafety further argues that Telegram’s approach was not only reactive but insufficiently protective against repeat behavior. The regulator alleges Telegram did not take adequate steps to prevent renewed violations, including removing accounts and groups used to distribute pro-terror material.
The regulator also contends Telegram failed to detect known extremist content in advance. eSafety cites examples that later were removed, including footage from the 2019 Christchurch mosque shootings and the 2022 Buffalo mass shooting.
What the regulator is asking the court to decide
eSafety is seeking financial penalties, reflecting the seriousness of its claimed breaches of Australia’s online safety framework. Under the Online Safety Act, eSafety notes that violations can carry penalties up to 54.6 million Australian dollars (about $35.8 million).
Telegram has not publicly issued an official statement addressing the Australian proceedings. However, its official X account posted a video captioned “freedom of expression.”
Telegram did not immediately respond to a request for comment regarding the case.
Telegram’s moderation scrutiny extends beyond Australia
Australia’s action arrives amid intensifying pressure on Telegram’s leadership and the platform’s content-handling practices internationally.
Earlier coverage from Cointelegraph noted that Russia’s Federal Security Service (FSB) announced it had charged Telegram founder Pavel Durov with facilitating terrorist activity and initiated steps to place him on an international wanted list. The Russian authorities alleged Telegram failed to remove channels, chats and bots that they say were used by Ukrainian intelligence services, terrorist groups and extremist organizations to coordinate attacks, recruit operatives and conduct cyber fraud.
Telegram has not issued an official response to the latest legal developments in Russia, though it has posted content related to Durov on its social channels.
Broader legal pressure on Durov in Europe
Durov also remains under investigation in France following his arrest in August 2024 at Le Bourget Airport, as previously reported by Cointelegraph. French prosecutors have charged him with offenses including complicity in the distribution of illegal content, including material connected to organized crime, through Telegram.
Durov has in the past criticized what he described as increasing threats to online privacy, warning that governments were rolling back protections for a free internet.
In an October 2025 post on X, Durov wrote that “What was once the promise of the free exchange of information is being turned into the ultimate tool of control.”
Why this matters for investors and platform users
Even beyond the immediate legal stakes, regulators targeting moderation and takedown performance could reshape how Telegram handles harmful content at scale—especially if courts accept eSafety’s allegations about delayed removal and insufficient preventive measures. Readers should watch for the court’s findings and any changes Telegram makes to notice-and-action processes, repeat-violation handling, and detection workflows.

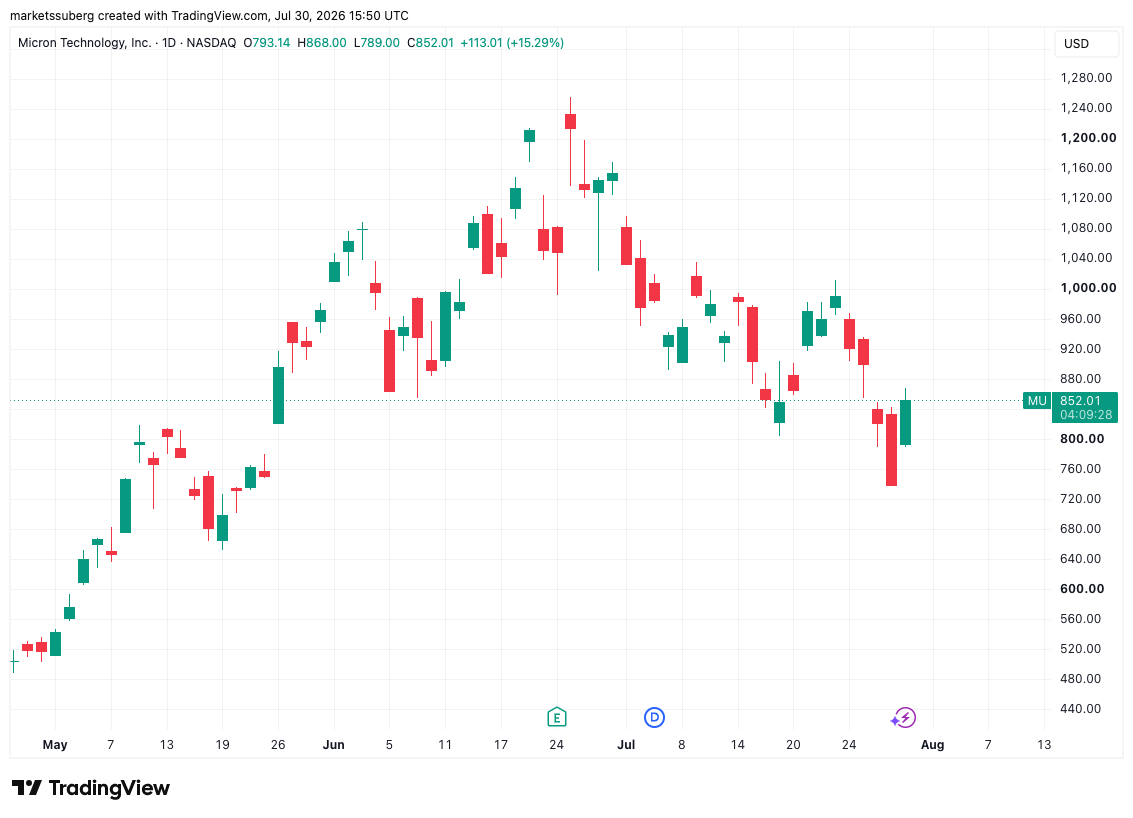
Nokia (NOK) stock traded at $8.44 on Wednesday, down 5.54% intraday, after sellers pushed the price to the 0.786 Fibonacci retracement at $8.50. It is the last major support above the January low of $6.06.
The drop extends Tuesday’s 5.6% slide and deepens a decline that started at the June peak of $17.45. NOK has lost roughly 52% of its value in less than two months.
Why Nokia Stock Is Falling Again This Week
Part of this week’s weakness was mechanical. Tuesday, July 28, was the ex-dividend date for Nokia’s quarterly dividend of 0.04 euros per share, which will be paid on August 6.
However, the adjustment explains only about 0.5% of the move. The rest reflects profit-taking that has continued since last week’s post-earnings breakdown, when investors sold the memory shortage outlook rather than the strong quarter.
Analysts have also started trimming expectations. On July 27, Deutsche Bank lowered its Nokia price target to 11.50 euros from 13.50 euros, while keeping a Buy rating on the shares.
Meanwhile, the sector backdrop remains heavy. Intel dropped 11% after an earnings beat, and profit-taking spread across AI hardware names. Nokia now falls with the sector rather than on company-specific news alone.
NOK Price Analysis Shows Bulls Defending the $8.50 Level
On the daily chart, the Fibonacci retracement drawn from the January low of $6.06 to the June top of $17.45 still maps the decline. The June peak ended a months-long rally fueled by AI and cloud demand.
NOK lost the 0.618 golden pocket at $10.41 last week, and a large spike in volume accompanied the breakdown. Such volume signals conviction among sellers, which favors trend continuation.

The slide has now reached the 0.786 retracement at exactly $8.50. This is the bulls’ final line of defense, and they must step in immediately to hold it.
The Visible Range Volume Profile (VRVP) adds weight to both levels. Its two largest volume nodes sit near $10.41 and $8.50, so these zones will likely act as resistance and support over the coming days or weeks.
Nokia RSI at 27 Gives Bulls No Divergence to Lean On
The daily Relative Strength Index (RSI) reads 27, below the oversold threshold at 30. Historically, such depressed readings can produce short-term bounces, as other beaten-down names showed during this earnings week.
However, there is no sign of a bullish divergence yet. The indicator keeps printing lower lows together with the price, so momentum still favors the sellers.

If NOK loses $8.50 on a daily close, the next support zone sits at the $6.06 anchor low, roughly 28% below Wednesday’s price. In contrast, a daily close back above $10.41 would invalidate the bearish outlook.
Until then, the market decides between a defended floor at $8.50 and a full retest of $6.06.
To read the latest stock market analysis from BeInCrypto, click here.
The post Nokia Bulls Have One Level Left to Defend After 52% Crash From June Peak appeared first on BeInCrypto.

What went right this week: global road safety progress, plus more

Cellnex Telecom, S.A. 2026 Q2 – Results – Earnings Call Presentation (OTCMKTS:CLLNY) 2026-07-30

South Korea Crypto Trading Spikes as Stock Market Drops


-

 Fashion6 days ago
Weekend Open Thread: Brooks Brothers
-
 Sports4 days ago
Commonwealth Games boxing: Jadumani Singh seals dominant 5-0 win over Pakistan’s Sumama Rehman to enter quarter-finals | Commonwealth Games News
-

 Business21 hours ago
Why Trees Belong on the Risk Register
-

 Tech4 days ago
Intel is reversing course and bringing hyper-threading back to its server chips
-

 Crypto World5 days ago
Ripple bought a bank in pieces. The $4 billion audit
-

 Politics3 days ago
Luke Littler dismantles Gerwyn Price to retain title in Blackpool
-

 Politics2 days ago
The Part of the Electric Transition Nobody Wants to Discuss
-
 Entertainment6 days ago
A New Post-Apocalyptic Gundam Anime Series Blasts Into SDCC
-

 News Videos4 days ago
BITCOIN JUST ENTERED THIS CRITICAL ZONE…
-

 Fashion7 days ago
16 Dresses for the High Summer Event
-

 Sports7 days ago
2026 3M Open leaderboard: Scottie Scheffler finds putter in Round 1, sits three back
-

 News Videos7 days ago
The Peugeot Family: How 200 Years of an “Old Money” Dynasty Died in A Boardroom
-

 Business2 days ago
Major shareholder moves on Canyon
-

 Crypto World4 days ago
XRP Ledger adds $2.6B as RWA inflows rank second
-

 Politics4 days ago
Spain sweeps the board at 2026 World Cup with individual awards
-

 News Videos5 hours ago
Bitcoin Enters the 3rd Stage of the Bear Market
-
 Entertainment2 days ago
‘Stargate’ Creator’s New Sci-Fi Series Returns for Season 3 Tomorrow
-

 Tech6 days ago
Anthropic launches Claude Opus 5, a cheaper AI model for coding, agents and enterprise workflows
-

 Crypto World2 days ago
Kraken Enables Retail Access to Jersey Mike’s IPO via Tokenized Shares
-

 Entertainment5 days ago
Sara Gilson Killed By Husband After Viral “Pedophile” TikTok Video
You must be logged in to post a comment Login