
Crypto World
Japan exchange giant JPX prepares for crypto ETF debut


Japan Exchange Group is preparing for the possible launch of cryptocurrency ETFs once legal reforms are completed.
Summary
- JPX may list crypto ETFs once Japan finalizes legal and tax treatment for digital assets.
- CEO Hiroki Yamamichi said asset managers are showing interest in creating crypto-linked ETFs.
- Bitcoin ETFs returned to inflows, while Ethereum ETFs extended their outflow streak.
JPX CEO Hiroki Yamamichi said many asset managers are interested in creating crypto-linked ETFs. He told Bloomberg that “it can be done anytime once the legal framework is in place and the tax treatment is clarified.” The timeline remains tied to the pace of legal and tax changes in Japan.
Yamamichi said a crypto ETF listing could happen as early as next year, depending on reform progress. However, the timing could also move to 2028 if legal changes take longer.
JPX has already listed “entering new asset classes” in its medium-term management plan. The exchange operator has been reviewing crypto-related products as part of its plan to expand market choices.
Japan targets wider investor access
A crypto ETF would give investors a regulated product linked to digital assets. It could also help JPX expand its product lineup beyond traditional securities and derivatives.
The exchange wants to attract more investors by adding new asset classes. Still, the product launch depends on clear rules for crypto treatment and tax handling.
Bitcoin ETFs return to inflows
The comments came as global crypto ETF flows showed mixed movement. On April 30, Bitcoin spot ETFs recorded total net inflows of $14.75 million, according to SoSoValue data.
That marked the first positive day after three straight days of net outflows. Ethereum spot ETFs moved in the opposite direction, with $23.64 million in net outflows.
Ethereum funds have now posted four straight days of outflows. The split shows uneven demand across crypto investment products as Japan studies its own ETF framework.

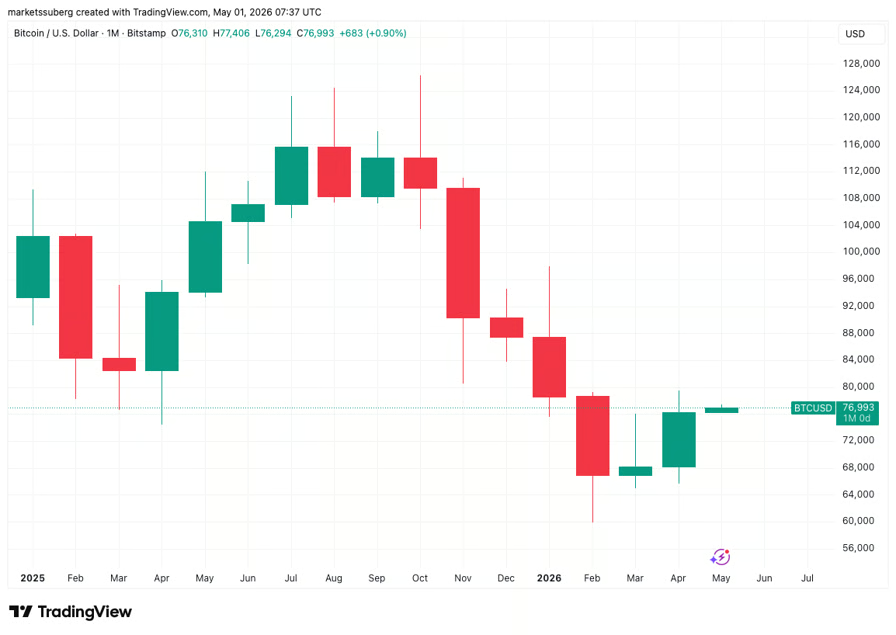
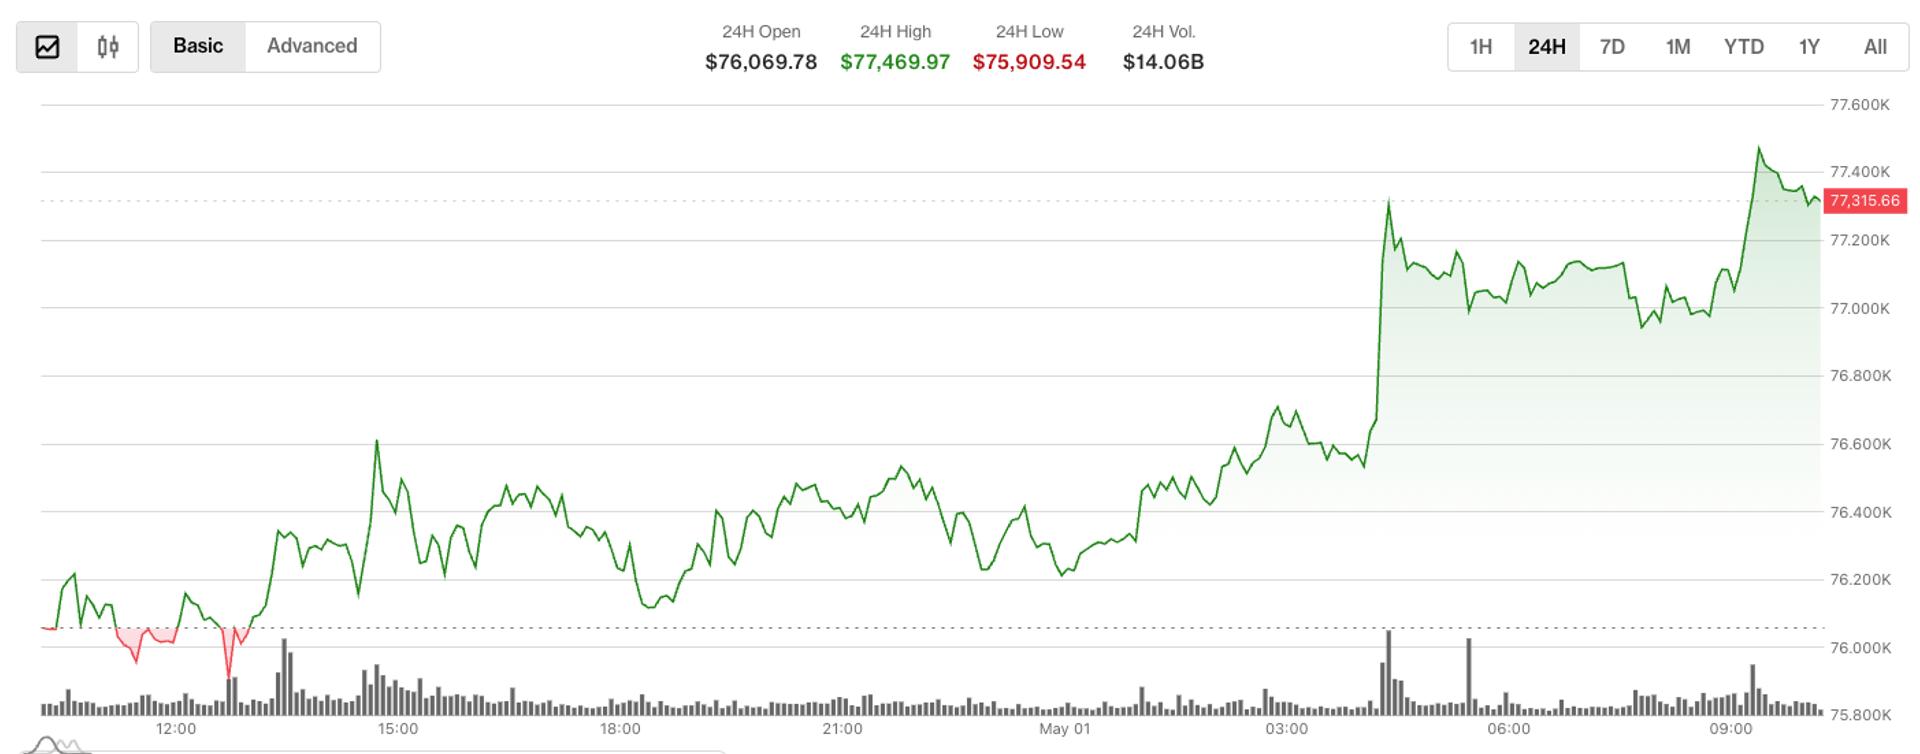
Bitcoin (BTC) eyed $77,500 on Friday after US stocks posted fresh record highs on strong tech earnings.
Key points:
- Bitcoin continues a rebound after the monthly close as stocks hit record highs.
- Strong tech earnings propel the S&P 500 over 7,200 points for the first time in history.
- PCE inflation data nears its highest levels in three years, prompting speculation about next month’s numbers.
Bitcoin creeps higher while S&P 500 makes history
Data from TradingView showed near 12% April BTC price gains as risk assets ignored rising US inflation signs.
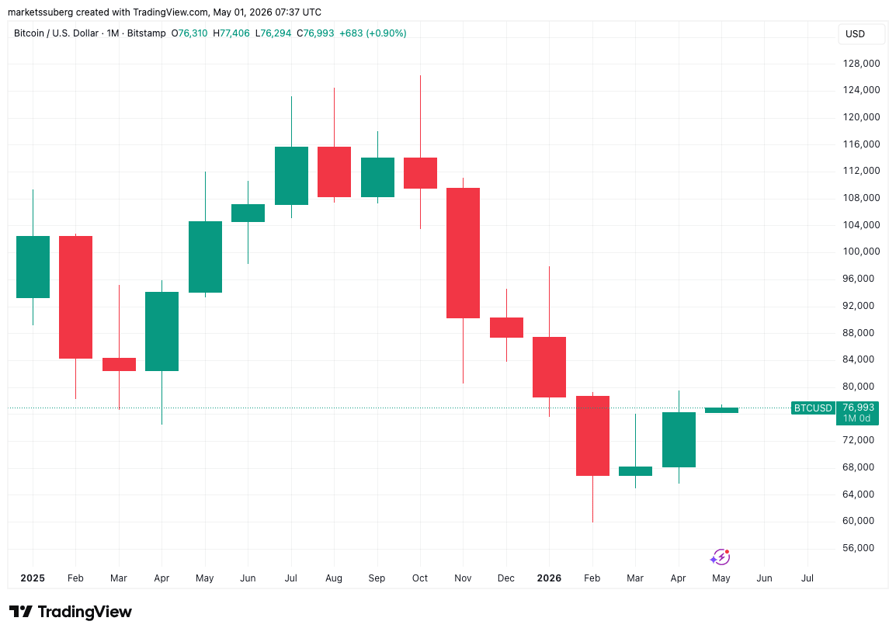
BTC/USD one-month chart. Source: Cointelegraph/TradingView
The S&P 500 reached nearly 7,220 points before closing ten points lower, propelled by stronger-than-expected earnings from Google and Apple.
Reacting on X, trading resource The Kobeissi Letter noted that the S&P had added over $8 trillion in market cap since hitting local lows at the end of March.
“A year ago it was at 5,600. 5 years ago it was at 4,200. 10 years ago it was at 2,100,” Charlie Bilello, chief market strategist at wealth manager Creative Planning, added.
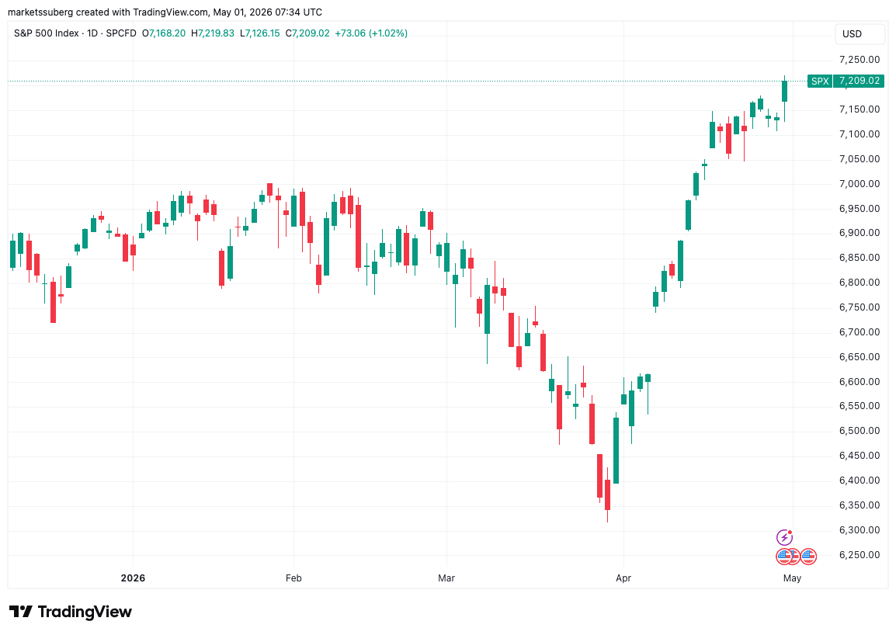
S&P 500 one-day chart. Source: Cointelegraph/TradingView
While Bitcoin’s gains were less pronounced, markets en masse appeared uninterested in US inflation warnings.
The March print of the Personal Consumption Expenditures (PCE) came in at 3.5%, per data from the US Bureau of Economic Analysis (BEA), marking its highest since August 2023.
Known as the Federal Reserve’s “preferred” inflation gauge, PCE had previously conformed to market estimates.
“In the first month of the Iran War, US inflation hit a 3-year high,” Kobeissi commented.
“April’s data will be interesting.”
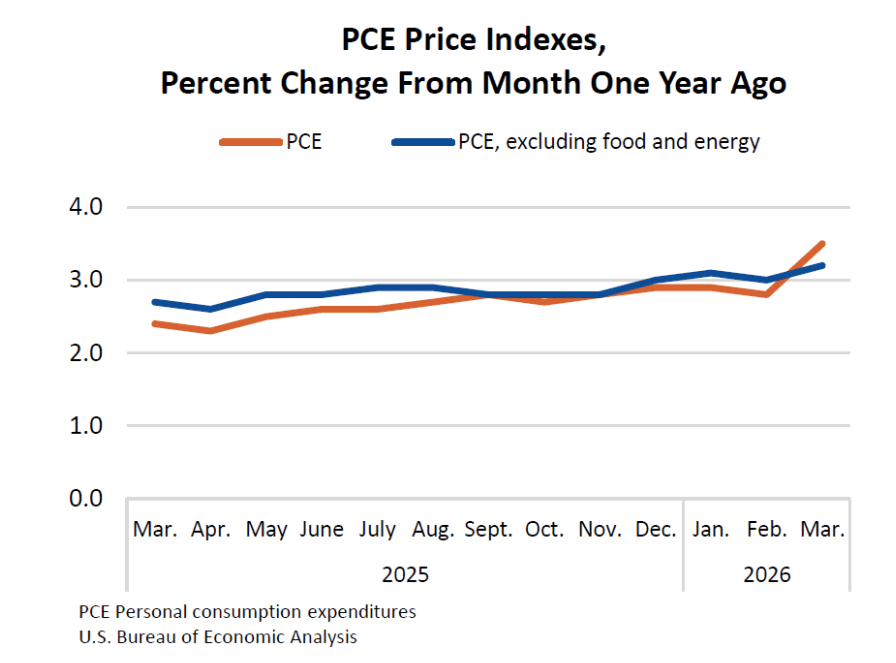
US PCE Indexes. Source: BEA
BTC price still struggling with support reclaim
Bitcoin thus closed out April’s monthly candle with mixed messages.
Related: Bitcoin Coinbase Premium threatens bear flag repeat with BTC price at $76K
At 11.9%, BTC/USD saw its highest monthly gains in a year, CoinGlass data confirmed, but the monthly candle fell short of reclaiming key support lines.
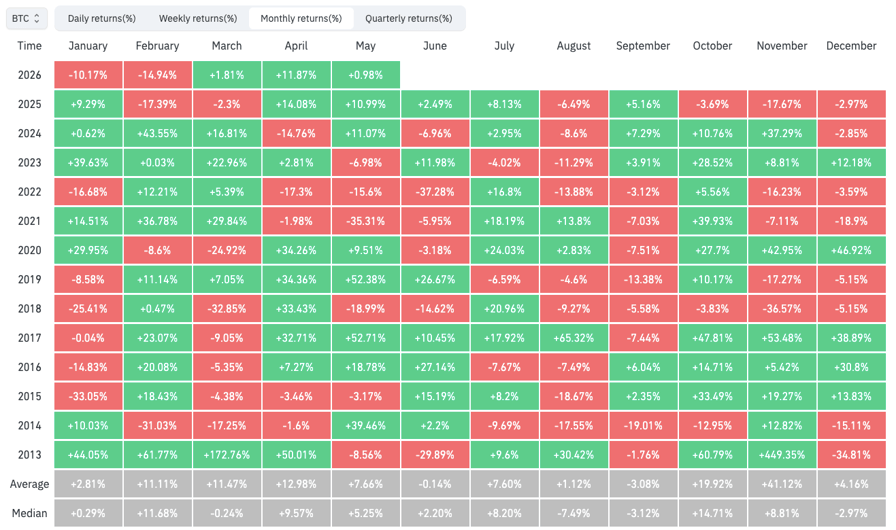
BTC/USD monthly returns (screenshot). Source: CoinGlass
As Cointelegraph reported, these included the 21-week exponential moving average (EMA), with only a single weekly close above it since last October.
“The Bitcoin pullback continues and this is looking more and more like an EMA rejection, especially if BTC isn’t able to Weekly Close above the EMA by end of week,” trader and analyst Rekt Capital warned X followers on Wednesday.
He added that a retest of the mid-$60,000 zone on weekly time frames was “technically necessary to achieve full breakout confirmation.”
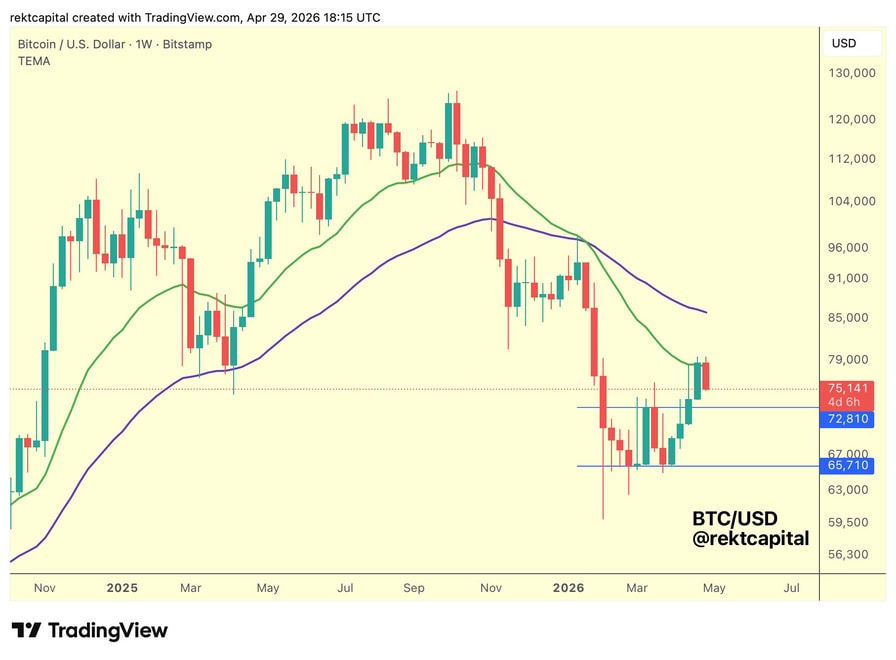
BTC/USD one-week chart. Source: Rekt Capital/X

Key Takeaways
- On April 30, NuScale Power (SMR) stock climbed more than 10% following Amazon’s announcement of three agreements supporting small modular reactor initiatives, featuring a $500 million stake in competitor X-energy.
- Despite not being directly involved in Amazon’s partnerships, NuScale benefited from the positive sentiment spreading across the entire SMR industry.
- Short sellers covering their positions intensified the upward movement as the share price accelerated.
- NuScale holds the distinction of being the sole American firm with Nuclear Regulatory Commission-certified SMR technology.
- With a market capitalization hovering around $3.88 billion, the stock had declined more than 20% year-to-date prior to this rally.
Shares of NuScale Power (SMR) climbed more than 10% on April 30, 2026, propelled by widespread optimism throughout the nuclear energy industry after Amazon revealed three strategic partnerships supporting small modular reactor development — highlighted by a $500 million commitment to competitor X-energy.
NuScale Power Corporation, SMR
Amazon’s announcement didn’t include NuScale among its chosen partners. Yet the stock rallied regardless.
This reaction reveals much about investor sentiment within the SMR market. When a technology giant commits hundreds of millions toward clean energy infrastructure, every company in that ecosystem benefits. Market participants rushed into nuclear-related equities en masse.
A short squeeze magnified the gains. NuScale has attracted significant short interest, and as share prices rose, pessimistic traders scrambled to exit their bearish bets. This forced buying created additional upward momentum.
NuScale’s Current Position
Trading at approximately $3.88 billion in market capitalization, NuScale occupies a compelling position. Competitor Oklo — another dedicated SMR developer — commands a valuation nearly triple that size. Before Wednesday’s surge, NuScale shares had declined more than 20% since the year began.
What distinguishes NuScale from competitors: it stands alone as the only American enterprise possessing Nuclear Regulatory Commission certification for its SMR technology. Securing this regulatory approval required years of effort and cannot be quickly duplicated. In an industry still establishing credibility, this achievement carries significant weight.
However, Bank of America research suggests substantial SMR deployment won’t materialize until 2030 or later, potentially extending to 2035. While the underlying technology exists, commercial markets remain undeveloped.
Long-Term Outlook and Challenges
NuScale’s business model emphasizes utility-scale installations. This differentiates the company from Oklo, which pursues smaller, customized deployments — such as dedicated power systems for individual data center facilities. Both approaches have merit. Neither has achieved large-scale validation.
Bank of America estimates the broader nuclear sector opportunity could reach approximately $10 trillion over three decades. Within that landscape, research indicates the SMR segment specifically may represent $1.5 trillion. Even capturing a modest portion would generate substantial returns relative to NuScale’s present valuation.
One market observer noted: a 2,000% appreciation from current levels would still leave NuScale’s market cap below $100 billion.
Yet such extraordinary gains would demand perfect execution across multiple fronts — sustained expansion in AI data center requirements, nuclear energy capturing meaningful market share of that demand, SMR technology achieving real-world commercial success, and NuScale’s utility-focused design emerging as an industry standard. This represents a considerable series of contingencies.
Daily trading activity for SMR averages approximately 27 million shares, demonstrating intense market attention on this equity. Technical indicators entering the week suggested bearish momentum, making Wednesday’s spike particularly noteworthy.
Despite the recent pop, NuScale’s year-to-date performance remained negative, with shares still down roughly 20% through April’s closing session.

Crypto World
Strategy (MSTR) Stock Climbs 5% Following Major Institutional Investments and Stable Bitcoin Holdings

Key Highlights
- Canadian pension giant Alberta Investment Management Corporation (AIMCo), overseeing $142B in assets, acquired 1.38M MSTR shares valued at approximately $219M
- AIMCo’s purchase represents its inaugural investment in a Bitcoin-focused treasury corporation
- Weekly Bitcoin acquisitions by Strategy plummeted 91%, declining from 34,164 BTC to just 3,273 BTC due to changes in capital sourcing
- MSTR finished April with a 33% gain, marking its first monthly advance after eight consecutive months of declines totaling 75%
- Strategy’s Bitcoin reserves reached 818,334 BTC, maintaining a narrow lead over BlackRock’s 810,077 BTC holdings
Strategy (MSTR) secured a significant institutional investor this week when AIMCo, a fund managing approximately $142 billion in assets, acquired 1.38 million shares of MSTR valued at roughly $219 million. The transaction represents the Canadian pension manager’s initial foray into Bitcoin treasury corporations.
In Thursday’s premarket trading, MSTR climbed 1.03% to reach $159.82 following the announcement. This uptick came after the stock experienced a 4.54% decline in the previous session, settling at $158.19 on Wednesday.
AIMCo joins a growing roster of institutional investors expanding their MSTR positions. Capital Group recently increased its holdings by 4.32 million shares through its American Funds Fundamental Investors vehicle, elevating its total position to 10.33 million shares with a current valuation of approximately $1.63 billion.
Vanguard made its own strategic addition during April, acquiring over 1.2 million shares valued at $195 million at the time of purchase. The investment giant now controls slightly more than 2 million shares through its VOE ETF, presently worth around $323 million.
Significant Slowdown in Bitcoin Accumulation
Strategy’s most recent Bitcoin acquisition showed a dramatic decrease compared to the preceding week. The company secured 3,273 BTC for $255 million, a stark contrast to the 34,164 BTC purchased for $2.54 billion the week before — representing a 91% reduction in acquisition volume.
The deceleration stemmed from Strategy’s funding approach. Instead of utilizing its preferred STRC stock, the company relied on common stock sales this time, which constrained the amount of capital available for deployment.
Despite the reduced acquisition pace, market sentiment suggests Strategy will maintain its accumulation strategy. Polymarket data indicates only a 10% likelihood that the company will liquidate any Bitcoin holdings before 2026 concludes.
Strategy’s cumulative Bitcoin position now totals 818,334 BTC, obtained through investments exceeding $61.8 billion. This positions the company marginally ahead of BlackRock, whose Bitcoin holdings stand at 810,077 BTC.
MSTR’s Turnaround and STRC Dividend Stability
April marked a significant reversal for MSTR. The stock concluded the month at $165, representing a 33% increase — the first monthly gain following eight consecutive months of losses. Between August 2025 and March 2026, the stock had experienced a cumulative 75% decline.
Bitcoin demonstrated similar strength during April, advancing 12% to deliver its strongest monthly performance since April 2025.
Regarding the preferred shares, Strategy maintained the STRC dividend rate at 11.5% for May, the third straight month at this level. STRC’s volume weighted average price for April registered at $99.76, sufficiently close to its $100 par value to justify keeping the rate unchanged.
STRC currently trades at $99.75 and has remained below par value since April 15.
Strategy is evaluating the possibility of transitioning to semi-monthly dividend distributions for STRC as a measure to minimize price fluctuations.
TipRanks analysts maintain a Strong Buy consensus rating on MSTR, with a mean price target of $283.33.

Bitcoin rose more than 1.2% during the European morning to reach just shy of $77,500 for a lift of about 1.7% in the last 24 hours.
The broader digital asset market, as measured by the CoinDesk 20 Index (CD20), also ticked higher, up around 0.95%.
Bitcoin’s gains came on above-average volume, with 24-hour activity running 15% above its seven-day average, indicating steady participation, according to CoinDesk Research’s technical analysis data model.
Derivatives markets may tell a more cautious story. Open interest in the June 26 $76,000 put option surged 22.5%, pointing to increased demand for downside protection near current price levels. The spike suggests institutional participants are positioning defensively, either locking in gains or preparing for potential declines.
Furthermore, bitcoin worth over $770 million has been sent to exchanges in the last week, analyst Ali Martinez post on X, citing data from Santiment. This action is generally regarded as a pre-sale step, pointing to the possibility of considerable selling pressure in the near future.
Bitcoin’s tight correlation with the CD20 — showing only a 0.15% deviation — suggests macro forces, rather than crypto-specific catalysts, continue to drive price action. The index, which captures a large share of the digital asset market value, reinforces that BTC is trading as part of a broader risk complex rather than independently.
Technical levels at $76,200 and $77,000 remain critical as traders balance constructive price trends against defensive derivatives positioning.

TLDR:
- Broad altseason is considered an artefact of the past as too many coins chase shrinking speculative capital pools.
- Long-tail tokens have shifted from high risk, high reward to near-instant value destruction within seconds of holding.
- Bitcoin and Ethereum have underperformed historical recovery expectations, weakening the buy-the-dip anchor strategy.
- Institutional money is flowing into AI while retail traders favour stocks, pulling key demand drivers away from crypto markets.
The crypto market this cycle has delivered a stark reality check for traders who expected history to repeat. The familiar pattern of broad altcoin rallies lifting entire portfolios has failed to materialise in any meaningful way.
Prominent analyst CryptoCred laid out a detailed breakdown of what has changed and why. The post, shared on X, points to structural shifts rather than temporary setbacks. Traders are now confronting a market that demands far more than simple participation.
Altseason Is Gone and the Speculative Landscape Has Turned Dangerous
The crypto market no longer operates on the broad wealth-effect cycle that defined earlier bull runs. Too many coins now compete for a pool of speculative capital that has not grown proportionally.
That supply-demand imbalance makes a rising tide scenario nearly impossible to replicate. The analyst stated plainly that “broad brush alt season is an artefact of the past.”
The long-tail speculative end of the market has become structurally more hostile. What once offered high risk with equally high reward has shifted toward near-certain loss for holders.
The current environment is one where a token can be taken to zero within seconds. That speed of destruction removes any practical window for risk management.
Centralised exchanges, once the engine of retail speculation, have lost their grip on this activity. Excess speculation has migrated into bundled token environments operating in maximum player-versus-player conditions.
This shift means the mechanisms that once drove altcoin momentum are no longer functioning in the same venues. Retail traders chasing that old playbook are entering a fundamentally different game.
Correlation across the crypto market has also tightened to a degree that eliminates sector-based strategy. Assets that once moved independently now collapse together during drawdowns.
This convergence has been described as “a tightly correlated mush,” particularly on the downside. That removes one of the few tools traders historically used to manage portfolio risk across different crypto segments.
Blue Chips Have Disappointed and Strategy Must Now Evolve
Even the historically reliable anchors of the crypto market have underperformed this cycle. Bitcoin and Ethereum, long considered safe entries during deep drawdowns, have not produced the explosive recoveries traders expected.
The assumption that all-time highs are guaranteed and predictable has weakened considerably. That shift challenges one of the most widely held beliefs in long-term crypto investing.
CryptoCred noted the cycle was “extremely concentrated versus broad brush wealth effect.” Something also visibly broke in market structure after October 2024, which was flagged directly in the analysis.
These two factors together mark a clean departure from previous cycle behaviour. Traders relying on past templates are now working with an outdated map.
Institutional capital has largely moved toward artificial intelligence, not crypto. Retail speculative energy has followed single-name stocks and zero-day equity options instead.
That dual departure strips away two demand drivers that historically supported altcoin momentum. The competition for speculative attention is now broader and more intense than any previous cycle.
Both timing and selection now carry equal weight for any trader operating in this environment. Participation alone no longer generates an edge the way it did when the asset class was earlier and less crowded.
CryptoCred closed with a candid remark: “Hopefully I’m an idiot doomposting the bottom GM.” Whether this cycle marks a floor or a permanent structural shift in the crypto market remains the central question.

Bitcoin’s April advance appears increasingly fragile from a sector-wide perspective, as a sharp rally driven by futures trading contrasts with cooling spot demand. CryptoQuant’s latest on-chain analysis shows a roughly 20% rise for Bitcoin in April, climbing from around $66,000 to a peak near $79,000, a move the firm attributes largely to growth in perpetual futures activity. At the same time, on-chain data indicate the market’s marginal buyer was more speculative than fundamental, a dynamic that raises questions about sustainability beyond the current cycle.
As of this writing, Bitcoin was hovering around $77,000, up about 2% on the prior 24 hours. CryptoQuant noted that the April price surge diverged from underlying spot demand, signaling that the momentum may not be supported by long-term buyers or real user adoption. In its assessment, the firm described the divergence between rising prices and contracting spot demand as one of the clearest on-chain signals that current gains are driven by speculative activity rather than a structural shift in demand fundamentals.
Key takeaways
- April’s roughly 20% Bitcoin rally was led by perpetual futures demand, with spot buying cooling during the move.
- The price surge coincided with a backdrop of contracting spot demand, signaling a speculative-driven rally rather than a broad-based fundamentals-led move.
- CryptoQuant warned that the divergence between price and on-chain demand has historically preceded further downside in Bitcoin’s price within bear-market regimes.
- CryptoQuant’s Bull Score Index slid to 40 in April, suggesting growing bearish sentiment despite the price uptick.
Futures-led momentum and the spot-demand paradox
The CryptoQuant report emphasizes a notable shift in market mechanics during April. While Bitcoin advanced toward the high 70s, on-chain activity that would indicate sustained interest from real-world buyers—such as steady spot purchases or rising exchange balances held by long-term holders—remained muted. The firm framed this as a classic indicator of speculative leverage: price gains propelled by futures demand, not by a broadened base of physical demand or treasury accumulation.
Such dynamics are not isolated incidents. The data point to a broader pattern in which a futures-dominated rally can inflate prices temporarily while underlying demand remains fragile. This distinction matters for traders and holders who weigh whether a rally represents a durable shift in the market’s risk-reward or a tactical move that could reverse under tightening liquidity or shifting sentiment.
Comparative context: past cycles and risk signals
CryptoQuant highlighted a historical resonance with the early phase of the 2022 bear market, when futures-driven strength outpaced the spot market before a sustained price decline took hold. In that frame, a rally built on speculative demand without corresponding fundamentals can intensify downside pressure once speculative incentives swing the other way or market liquidity tightens.
That risk assessment sits alongside other macro and market signals. Bitcoin’s current trajectory—price resilience paired with weakening on-chain fundamentals—creates a mixed backdrop for market participants. CryptoQuant stressed that the pattern observed in April remains a reminder of the bear-market regime’s potential to reassert itself, even as short-term momentum persists.
Dueling narratives on the drivers of the rally
The April move has drawn attention to differing interpretations of what’s fueling Bitcoin’s resilience. On one side, CryptoQuant’s analysis underscores the preponderance of futures-driven activity, warning that the rally may not reflect a durable shift in demand fundamentals. On the other side, commentary from market participants has highlighted substantial demand from other quarters. For instance, Bitwise’s chief investment officer Matt Hougan argued that bitcoin-related strategic purchases, including actions by an entity described as Strategy, have been a central driver of the recent rally. He pointed to strong ETF demand and renewed interest from long-term holders as reinforcing factors, while singling out Strategy as a particularly significant contributor to the rally’s momentum.
Both perspectives point to a broader theme: multiple drivers of price action can coexist, and disentangling them is essential for assessing whether the rally will endure. If futures-driven demand remains the dominant force, the market could face heightened volatility and potential downside if those funds retreat or if spot buyers do not step in to take their place.
Market sentiment and what to watch next
CryptoQuant’s Bulls Score, an index that combines market and network signals to gauge sentiment, dipped from 50 to 40 in April. The decline suggests a softening near-term outlook despite price gains, aligning with the idea that the market may be approaching a more cautious phase. The combination of price strength with weakening sentiment and spot demand has prompted observers to wonder whether the rally can translate into a more durable uptrend or if it will unwind as speculative liquidity tightens.
For investors, several questions loom: Will spot buyers eventually re-enter with conviction, supported by macro catalysts or institutional inflows? Or will futures-driven momentum fade, leaving prices to correct as speculative positions unwind? The answer may hinge on how other demand channels—such as ETFs, long-term Treasury-like holdings, and emerging institutional interest—respond in the coming weeks and months.
Closing perspective
As Bitcoin navigates a marketplace characterized by mixed signals, the split between price momentum and fundamental demand remains a critical watchpoint. The April episode reinforces a broader lesson for investors and builders: price action can diverge from on-chain health for extended periods, but sustained upside typically requires a genuine uptick in durable demand. Readers should monitor how spot demand evolves, how institutional and ETF-driven flows develop, and whether sentiment indices indicate a meaningful shift toward risk appetite or a cautiousism that could cap near-term gains.
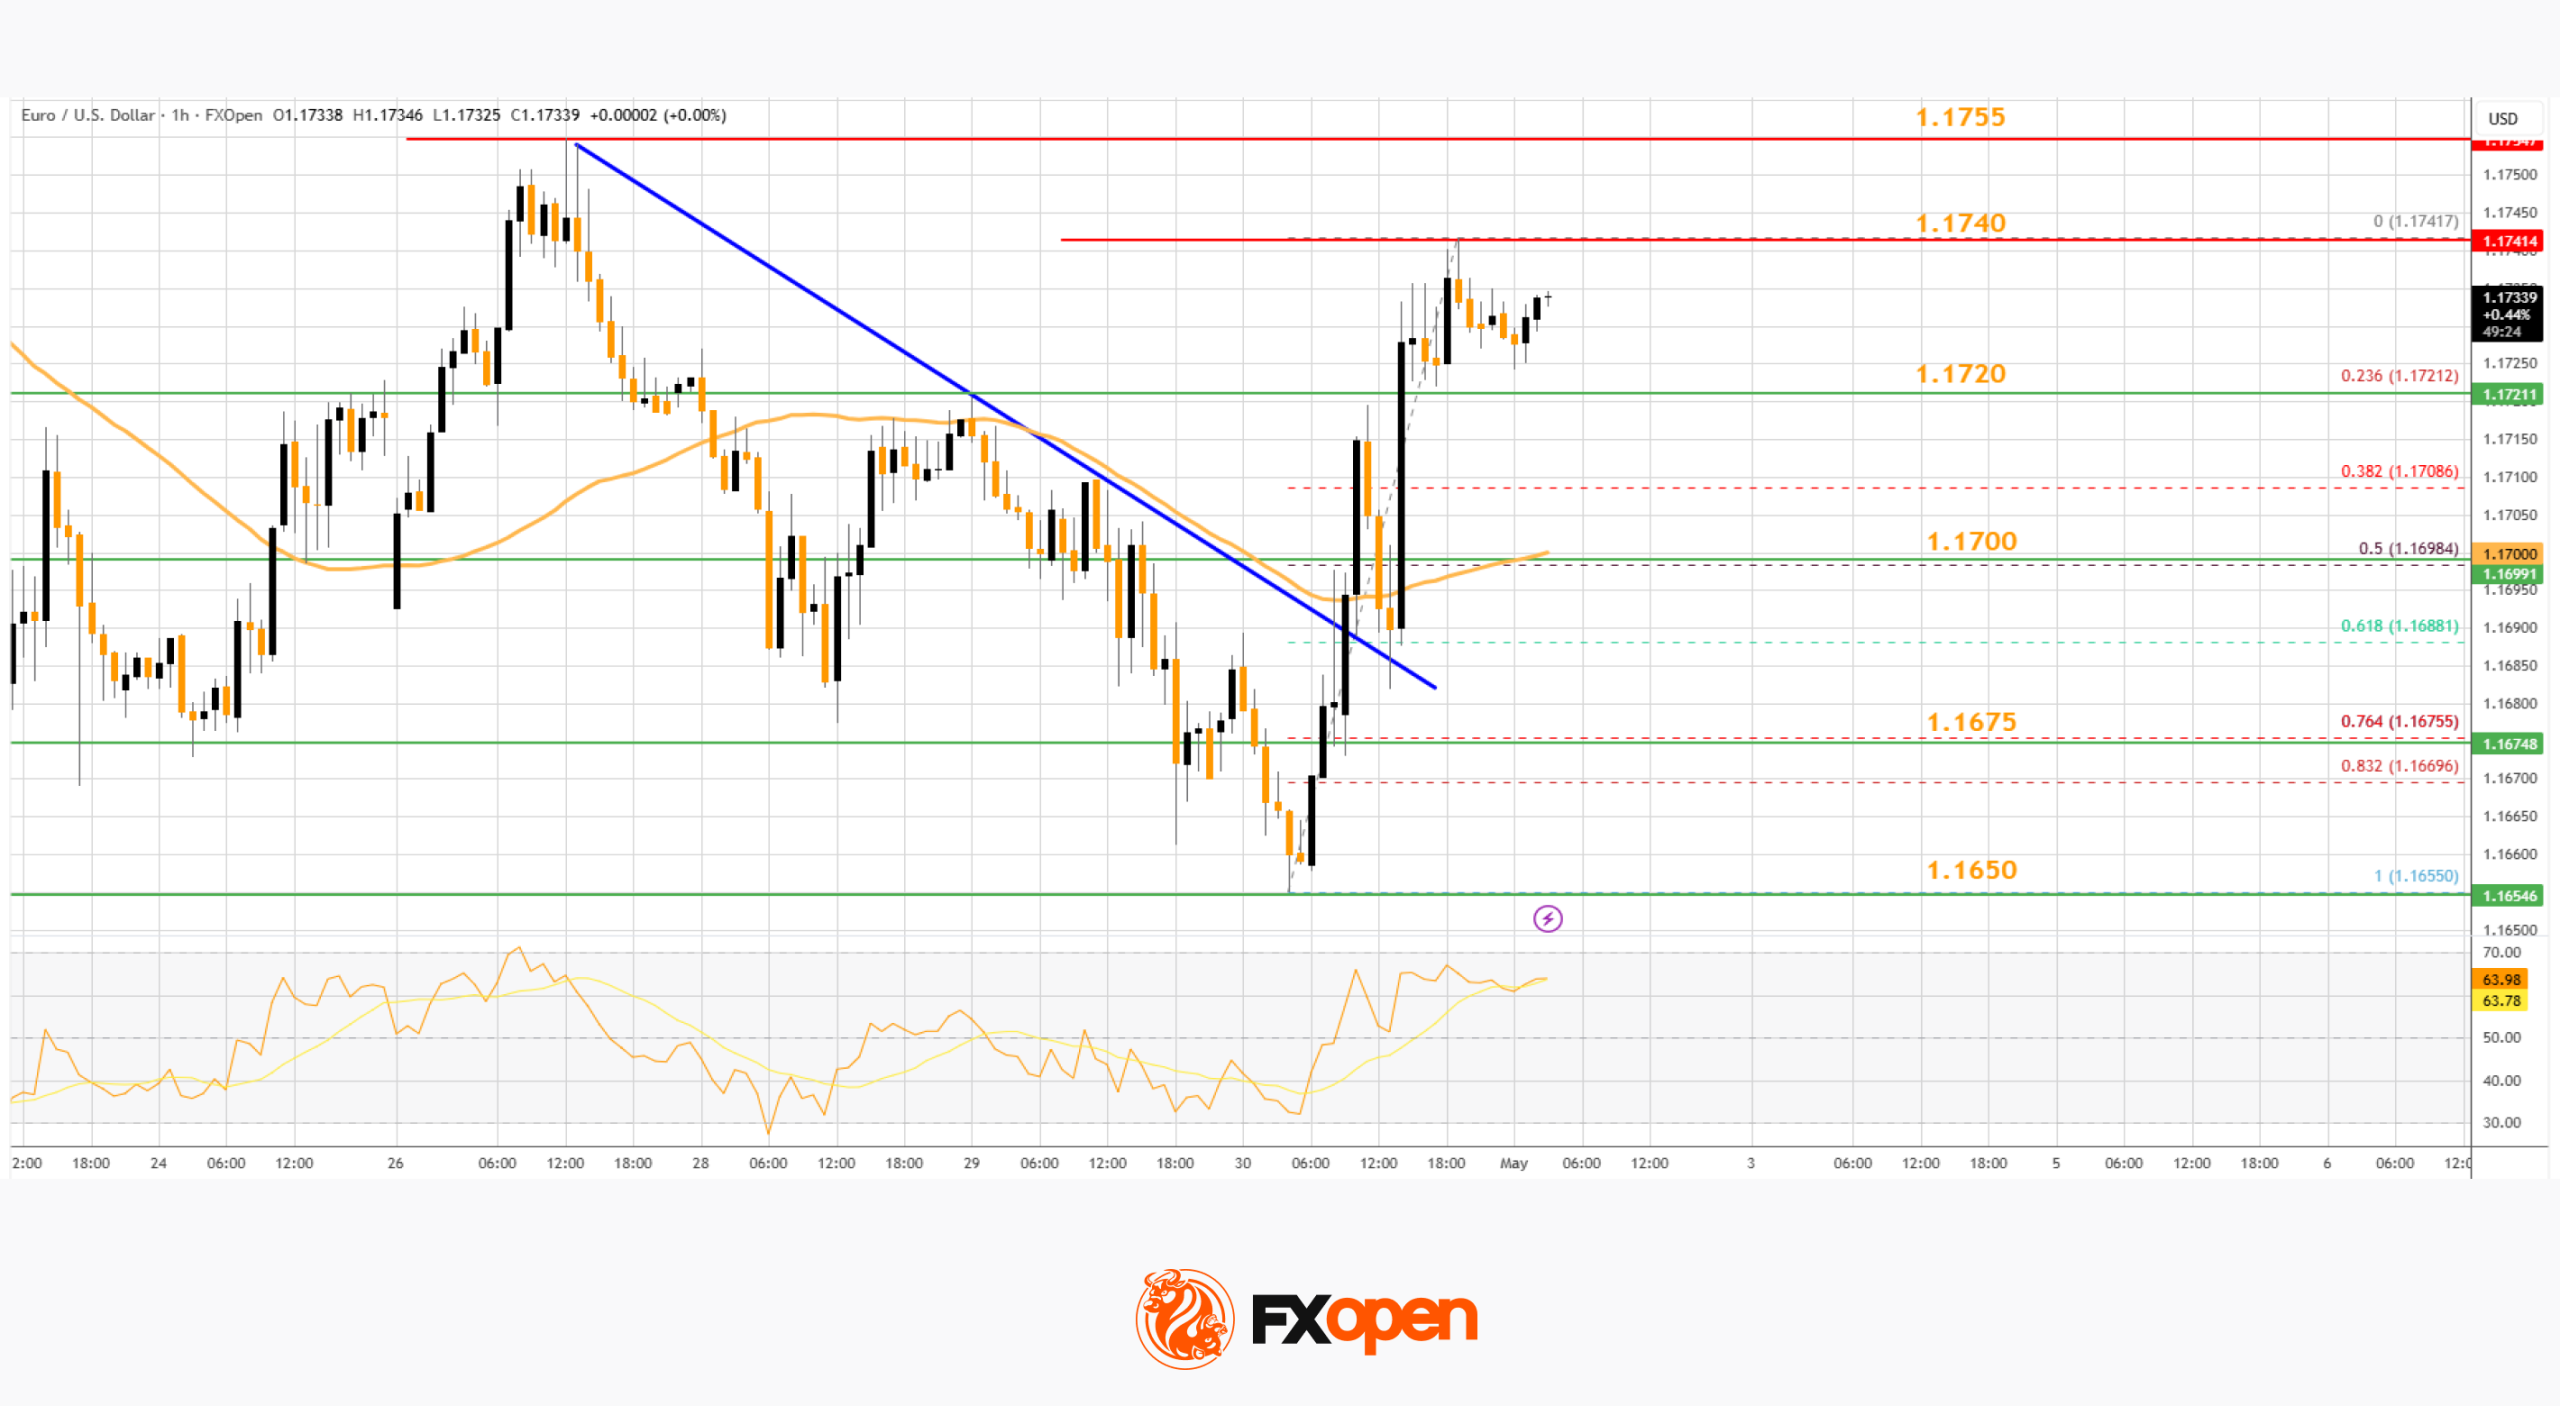
EUR/USD started a fresh increase above 1.1700 and 1.1720. USD/CHF declined further and is now struggling below 0.7835.
Important Takeaways for EUR/USD and USD/CHF Analysis Today
· The Euro started a decent increase from 1.1650 against the US Dollar.
· There was a break above a bearish trend line with resistance at 1.1685 on the hourly chart of EUR/USD at FXOpen.
· USD/CHF declined below the 0.7865 and 0.7850 support levels.
· There was a break below a bullish trend line with support at 0.7910 on the hourly chart at FXOpen.
EUR/USD Technical Analysis

On the hourly chart of EUR/USD at FXOpen, the pair started a fresh increase from the 1.1650 zone. The Euro cleared the 1.1700 barrier to move into a bullish zone against the US Dollar.
There was a break above a bearish trend line with resistance at 1.1685. The bulls pushed the pair above the 50-hour simple moving average and 1.1720. Finally, the pair cleared 1.1735. A high was formed near 1.1740 and the pair is now consolidating gains.
An Immediate bid zone on the downside is near the 23.6% Fib retracement level of the upward wave from the 1.1655 swing low to the 1.1740 high at 1.1720.
The next area of interest could be near 1.1700, the 50% Fib retracement level, and the 50-hour simple moving average. A downside break below 1.1700 might send the pair toward 1.1675. Any more losses might send the pair into a bearish zone toward 1.1650.
If there is a fresh increase, an immediate hurdle on the EUR/USD chart is 1.1750. The first major pivot level for the bulls could be 1.1755. An upside break above 1.1755 might send the pair to 1.1800. The next selling zone could be 1.1850. Any more gains might open the doors for a move toward 1.1920.
USD/CHF Technical Analysis
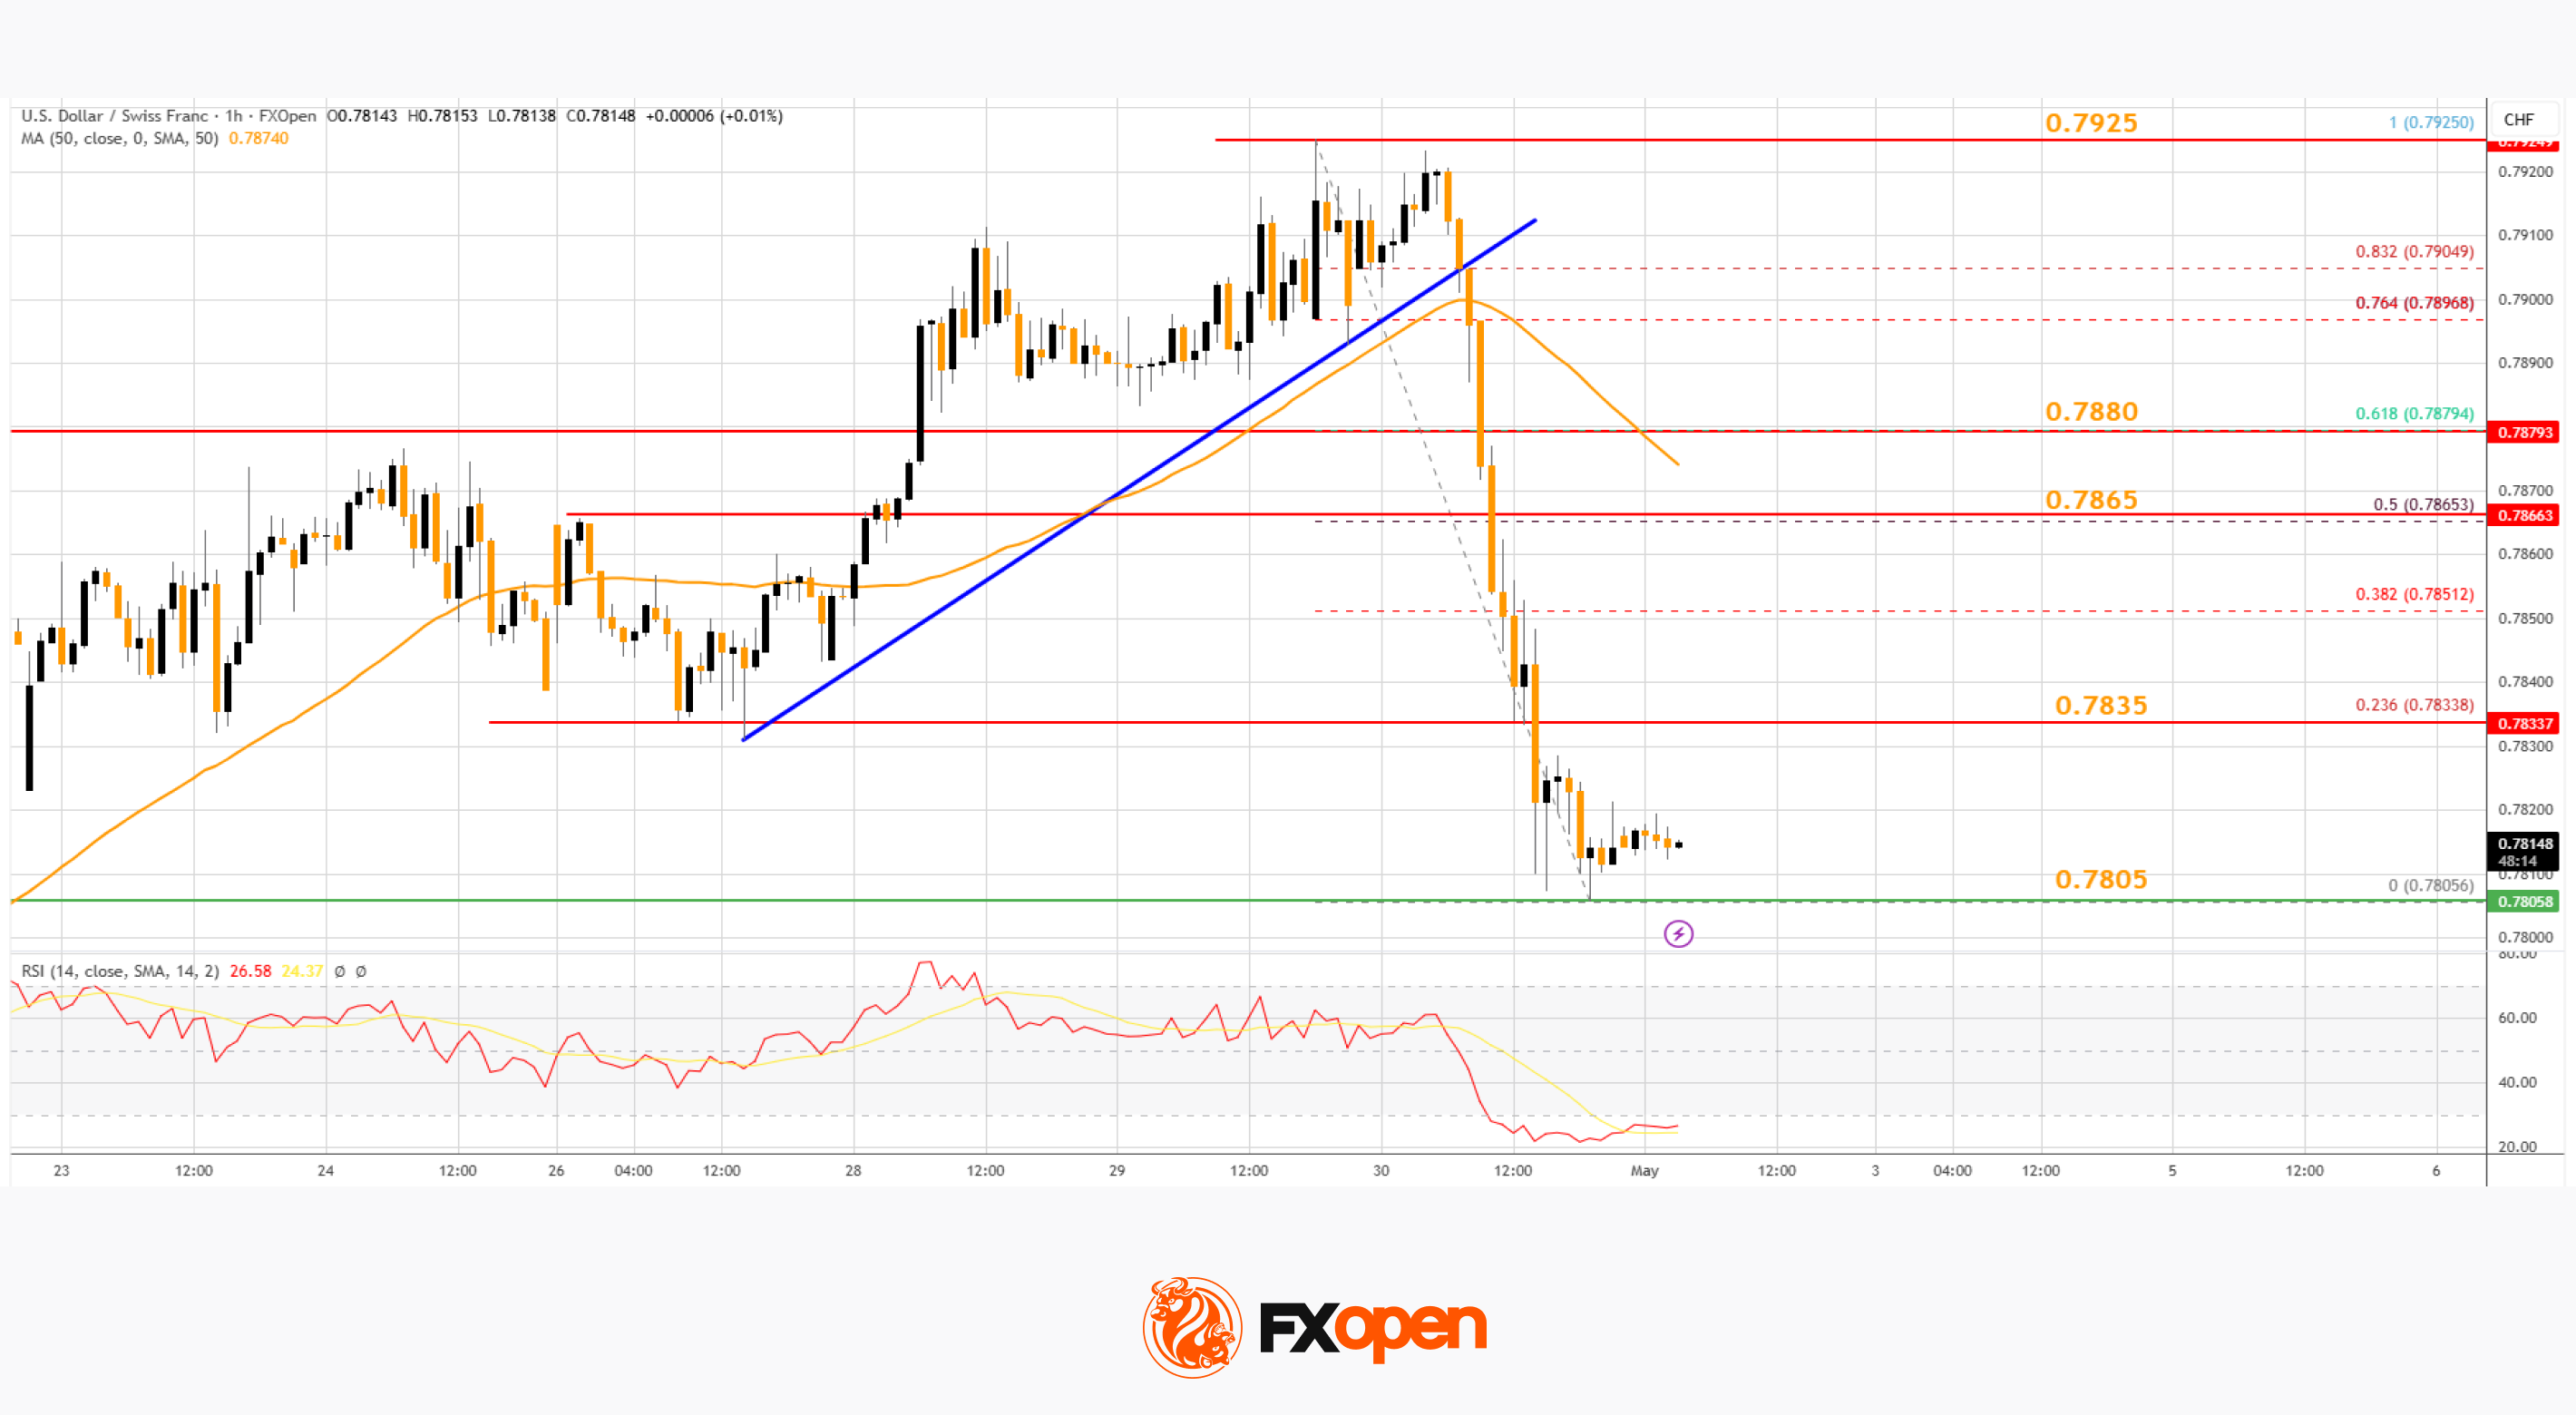
On the hourly chart of USD/CHF at FXOpen, the pair started a fresh decline from well above 0.7900. The US Dollar dropped below 0.7880 to move into a negative zone against the Swiss Franc.
There was a break below a bullish trend line with support at 0.7910. The bears pushed the pair below the 50-hour simple moving average and 0.7850. Finally, the bulls appeared near 0.7800. A low was formed near 0.7805, and the pair is now consolidating losses.
On the upside, the pair could face bears near the 23.6% Fib retracement level of the downward move from the 0.7925 swing high to the 0.7805 low at 0.7835.
The first major resistance sits near the 50% Fib retracement level at 0.7865. The main barrier for an upside break could be near the 50-hour simple moving average at 0.7880. A daily close above 0.7880 could start a fresh increase. In the stated case, the pair could rise toward 0.7925. The next stop for the bulls might be 0.7965.
On the downside, immediate support on the USD/CHF chart is 0.7805. The first major breakdown zone could be 0.7780. A close below 0.7780 might send the pair to 0.7750. Any more losses may possibly open the doors for a move toward 0.7700 in the coming days.
Trade over 50 forex markets 24 hours a day with FXOpen. Take advantage of low commissions, deep liquidity, and spreads from 0.0 pips (additional fees may apply). Open your FXOpen account now or learn more about trading forex with FXOpen.
This article represents the opinion of the Companies operating under the FXOpen brand only. It is not to be construed as an offer, solicitation, or recommendation with respect to products and services provided by the Companies operating under the FXOpen brand, nor is it to be considered financial advice.


Riot Platforms reported first-quarter 2026 revenue of $167.2 million. This compares with $161.4 million in the same quarter last year.
Summary
- Riot generated $167.2 million in Q1 revenue as data center income reached $33.2 million.
- AMD doubled its contracted Riot data center capacity to 50 megawatts after exercising an option.
- Riot sold 3,778 BTC in Q1 and later transferred another 500 BTC to NYDIG.
The company produced 1,473 Bitcoin during the quarter. That was lower than 1,530 Bitcoin produced in the first quarter of 2025.
Riot recorded its first quarter of data center revenue at $33.2 million. The amount included $0.9 million in operating lease revenue and $32.2 million from tenant fit-out services.
CEO Jason Les said the quarter marked a shift for Riot into a revenue-generating data center operator. He said, “The first quarter of 2026 marks a definitive inflection point for Riot.”
AMD doubles contracted capacity
Riot said AMD exercised an option for another 25 megawatts of capacity. This brings AMD’s total contracted capacity with Riot to 50 megawatts of critical IT capacity.
Les said AMD’s expansion “validates” Riot’s ability to deliver capacity for large tenants. The company said it now plans to use its approved power portfolio to grow the data center business.
Bitcoin sales continue amid mining pressure
Riot’s Bitcoin mining revenue fell to $111.9 million from $142.9 million a year earlier. The company linked the drop to lower average Bitcoin prices and a higher global network hash rate.
The average cost to mine Bitcoin, excluding depreciation, rose to $44,629. Riot said this was partly due to a 24% increase in the average global network hash rate.
Riot also disclosed that it sold 3,778 Bitcoin in Q1 2026. The sales generated $289.5 million in proceeds.
On-chain data cited by Lookonchain showed Riot later sent another 500 BTC to an NYDIG deposit address. The transfer was worth about $39 million at the time of reporting.
Riot stock rises after results
Riot ended the quarter with 15,679 Bitcoin. Of this amount, 5,802 Bitcoin were held as collateral. The total Bitcoin holdings were valued at about $1.1 billion based on a March 31 Bitcoin price of $68,222.
The company also held $282.5 million in cash, including $76.9 million in restricted cash. Riot shares closed at $17.24 on Thursday after gaining 7.9% during the session.

Key Takeaways
- Q3 revenue reached $5.95B, representing a year-over-year increase of 251% and exceeding analyst projections of $4.73B.
- Earnings per share (adjusted) landed at $23.41, crushing Wall Street’s $14.66 forecast by $8.75.
- Shares initially jumped following the announcement but retreated approximately 5% during Friday’s premarket session.
- Revenue from datacenter operations climbed 233% sequentially, propelled by a 137% increase in pricing throughout all business units.
- Fourth-quarter revenue guidance of $7.75B–$8.25B significantly surpassed the Street’s $6.65B expectation.
SanDisk delivered what many consider one of its most impressive quarterly performances on Thursday, handily surpassing both revenue and profit expectations set by Wall Street analysts. Yet shares experienced a roughly 5% decline in Friday’s premarket trading, despite management presenting an optimistic outlook for the quarters ahead.
Third-quarter revenue totaled $5.95 billion, marking a dramatic 251% climb compared to the same period last year. This figure easily eclipsed the analyst consensus estimate of $4.73 billion. On the earnings front, adjusted EPS registered at $23.41, demolishing the Street’s $14.66 projection by nearly $9 per share.
Prior to the pullback, the stock had reached approximately $1,096.51, hovering close to its 52-week peak of $1,115.
The datacenter division emerged as the undisputed growth driver. Datacenter revenue skyrocketed 233% on a sequential basis, buoyed by pricing increases of 137% spanning all product categories. While consumer and client segments experienced declines, the datacenter business more than compensated for these shortfalls.
CEO David Goeckeler characterized the quarter as representing “a fundamental inflection point” for the organization. He emphasized the company’s strategic pivot toward premium end markets, with datacenter operations spearheading this transformation.
Long-Term Agreements Strengthen Revenue Foundation
SanDisk executed five multi-year agreements during Q3 and early Q4. Three contracts were finalized within the third quarter, while two additional deals closed in the fourth quarter. The three Q3 agreements alone are projected to deliver a minimum of $42 billion in contracted revenue, recognized on a quarterly basis.
The company also secured downside protection. SanDisk has locked in $11 billion in guaranteed payments should customers withdraw from their capacity obligations — providing crucial insurance against potential market downturns.
Pricing strength has extended across the entire product portfolio. AI-driven supply constraints in the NAND memory sector have enabled SanDisk to implement higher pricing, and the forthcoming introduction of BiCS8-based QLC enterprise SSDs is anticipated to sustain this favorable trend.
Analyst Community Responds
Wall Street analysts moved quickly to revise their price objectives upward.
BofA Securities elevated its price target to $1,550 from $1,080, reaffirming its Buy rating. The firm highlighted valuation opportunities, underappreciated joint venture holdings, and anticipated enterprise SSD market share expansion through 2026.
Raymond James increased its target to $1,470 from $725, describing the datacenter inflection as “clear” and commending the company’s strengthening customer partnerships.
Mizuho boosted its target to $1,220 from $1,000 while maintaining an Outperform rating.
Notwithstanding the positive sentiment, InvestingPro noted the stock appears overvalued when measured against its Fair Value calculation — although analysts are projecting full-year earnings of $44.72 per share.
For the fourth quarter, SanDisk provided revenue guidance ranging from $7.75B to $8.25B, with non-GAAP diluted EPS anticipated between $30.00 and $33.00. This outlook implies approximately 35% sequential revenue expansion. Fourth-quarter gross margins are projected to reach around 80%, exceeding the 74% consensus and representing a year-over-year improvement of roughly 5,400 basis points.
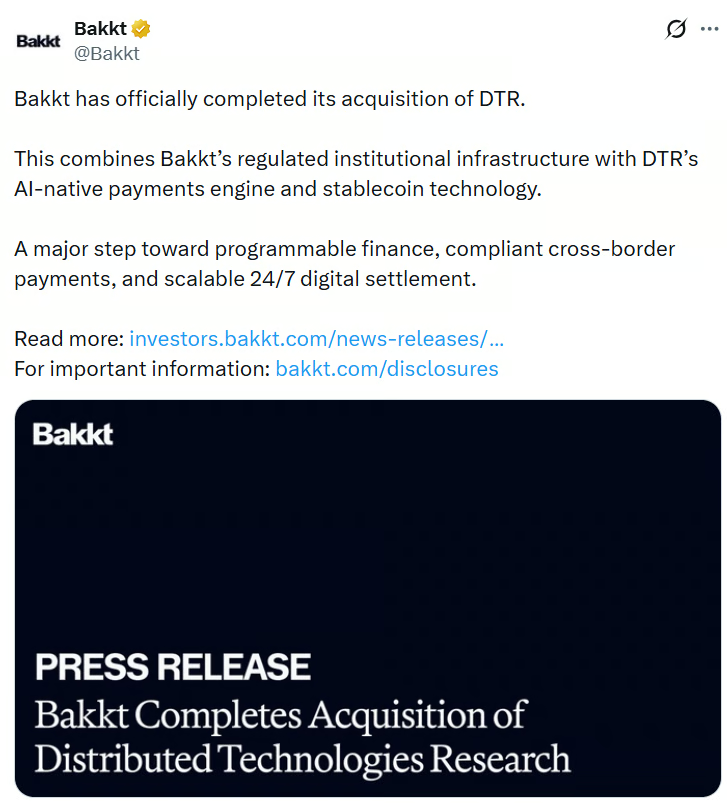
Digital asset company Bakkt completed its acquisition of stablecoin infrastructure firm Distributed Technologies Research (DTR) through an equity-based transaction as part of its bid to create a digital settlement layer.
Bakkt CEO Akshay Naheta said on Thursday that the deal aims to combine Bakkt’s institutional infrastructure with DTR’s native artificial intelligence payments engine and stablecoin technology to create a 24/7 digital settlement layer.
“The architecture of money movement rarely evolves at this level,” he said. “This transaction accelerates the re-platforming of global financial infrastructure. By fully integrating DTR’s technology, we are introducing stablecoin functionality as a critical bridge between legacy financial systems and the next generation of digital assets.”
The global stablecoin market has grown to roughly $320 billion, with adoption expanding across both developed and emerging economies as banks and institutions seek to leverage the technology for faster payments and other benefits.

Source: Bakkt
Acquisition deal completed through share issuance
As part of the deal, Bakkt issued more than 11.3 million shares to the beneficial holders of DTR, with the possibility of an additional 725,592 shares, according to the announcement.
The deal was initially revealed in January and originally involved 9.3 million shares. The company also announced a corporate name change to Bakkt Inc. at the same time.
Ahead of the deal’s completion, Bakkt’s share price (BKKT) fell roughly 8% to $7.86 by Wednesday’s close, but recovered to $8.62 by Thursday’s market close.
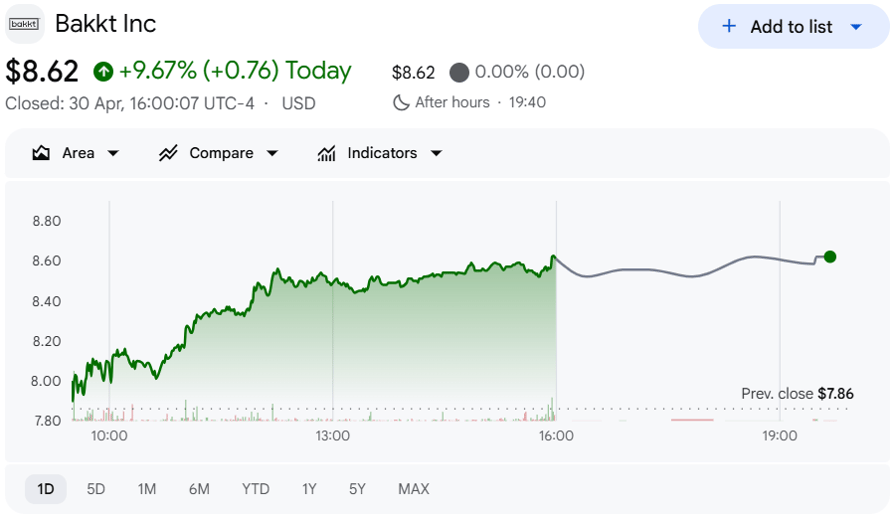
Bakkt’s share price fell Wednesday but has since risen 10%. Source: Google Finance
Bakkt threatened with delisting in 2024
Founded in 2018, Bakkt is 55% owned by Intercontinental Exchange (ICE), which also owns the New York Stock Exchange (NYSE), and has received backing from major partners such as Starbucks and Mastercard.
In March 2024, the NYSE threatened to delist Bakkt’s shares because the price had fallen below $1 and remained there for 30 days.
By May the company disclosed to regulators that there was “significant uncertainty associated with our expansion to new markets and the growth of our revenue base, given the uncertain and rapidly evolving environment associated with crypto assets.”
Related: Stablecoins overtake Bitcoin in Latin America crypto purchases — Bitso
Months later, reports said President Donald Trump’s media and tech group, Trump Media, was in advanced talks to acquire the company but the deal ultimately fell through.
The company has since launched multiple fundraising rounds through share sales, with the latest, in February, aiming to raise $48 million.
Magazine: Forget stablecoin yield, how does the CLARITY Act treat DeFi?

Wrexham urged to use promotion experience to their advantage in fight for final Championship play-off spot
March quarter lifts Apple revenue to $111B with $100B buyback

Best Sunscreens 2026: 12 Top SPF Picks From iHerb’s Massive BOGO Sale
Manchester United reach agreement with Casemiro over contract clause amid transfer speculation

US brings back mandatory military draft registration

Steven Gerrard disagrees with Gary Neville over ‘shock’ Chelsea and Arsenal claim | Football


-
 Tech4 days ago
Register Renaming | Hackaday
-

 Fashion7 days ago
Weekend Open Thread – Corporette.com
-
Crypto World6 days ago
Hyperliquid $HYPE Rally Builds Momentum as AI Sector Enters Prove-It Phase
-

 Politics4 days ago
Drax board avoid their own AGM, accused of greenwashing & environmental racism
-

 Tech4 days ago
Images of Samsung’s rumored smart glasses have leaked
-
 Sports5 days ago
IPL 2026: Ruturaj Gaikwad registers slowest fifty of the season, enters all-time unwanted list | Cricket News
-

 Tech4 days ago
Why Blue Badges Disappeared From Toyota Hybrids
-

 NewsBeat5 days ago
LK Bennett closes all stores after entering administration
-

 Fashion2 days ago
Kylie Jenner’s KHY Enters a New Era with ‘Born in LA’
-

 Crypto World7 days ago
Michael Saylor says BTC winter is over. Market analyst disagrees, says bitcoin was in a pullback
-
 Entertainment6 days ago
Mariah Carey Slams Deposition Claims In Brother’s Lawsuit
-

 Business2 days ago
Most Commercial Energy Audits Miss the Real Losses
-

 Business4 days ago
(VIDEO) Charlize Theron Climbs Times Square Billboard to Promote New Netflix Thriller ‘Apex’
-

 Business7 days ago
Jeanine Pirro announces closure of Federal Reserve building cost probe
-

 Tech5 days ago
Microsoft to roll out Entra passkeys on Windows in late April
-
 Crypto World7 days ago
Nvidia (NVDA) Stock Jumps 5% as Intel Earnings Ignite Semiconductor Rally
-

 Tech5 days ago
OpenAI’s Sam Altman apologizes for not reporting ChatGPT account of Tumbler Ridge suspect to police
-

 Crypto World3 days ago
CFTC’s AI will review U.S. crypto registration applications, chairman tells CoinDesk
-

 Business2 days ago
Barclay Brothers Avoid Bankruptcy: HSBC Drops High Court Petitions After IVA Deal
-

 Tech7 days ago
Apple’s Next CEO Has a Different Battle Ahead
You must be logged in to post a comment Login