
Crypto World
Jason Calacanis calls meme coins a ‘giant scam’


Technology investor Jason Calacanis has called meme coins a “giant scam” while warning users that he has no involvement with tokens using his name or suggesting his endorsement.
Summary
- Jason Calacanis has called meme coins a “giant scam” while distancing himself from token projects.
- Calacanis said he will never privately ask followers to buy, sell or trade financial assets.
- The investor said he follows Bitcoin and Bittensor but denied involvement with any meme coins entirely.
- Meme tokens currently carry roughly $35.9 billion in combined market capitalization, CoinGecko data shows today.
- Recent social account breaches have used fake celebrity-linked meme coins to target cryptocurrency traders online.
Calacanis said on Sept. 27 that he has “nothing to do with any meme coins and never will,” while identifying Bitcoin and Bittensor’s TAO as two crypto assets he sometimes discusses publicly.
His post included a separate warning about impersonation and unsolicited investment messages. Calacanis said he would never ask followers through social media or direct messages to buy, sell or trade an asset.
Jason Calacanis distances himself from meme coins
Calacanis drew a clear distinction between discussing crypto assets and participating in meme-token projects.
“I have nothing to do with any meme coins and never will,” he wrote. He added that any meme coins sent to accounts under his control would not change his position.
Calacanis said funds successfully sent to him by people operating such projects would be donated to a “good cause.” He did not identify any particular meme coin or claim that a named project had used his identity.
The investor described himself as a fan of BTC and TAO, although his recent public comments on Bitcoin have included criticism as well as positive posts about short-term price movements.
His warning focused particularly on messages that could appear to come from him. Calacanis told users he would “obviously never ask you to buy, sell or trade anything,” especially through social media or direct messages.
The statement follows repeated cases in which public figures have had their names, images or compromised accounts connected to meme tokens without authorization.
As crypto.news reported in July, blockchain investigator ZachXBT said several meme coins had been created using his identity even though he had not launched or supported them. He sold tokens sent to his donation address and directed roughly $41,000 in proceeds to charities.
Calacanis did not say a comparable incident had occurred with his account. His Sept. 27 post served as a public statement that any purported meme coin involvement should not be treated as his endorsement.
Meme coin sector remains a multibillion-dollar market
Meme coins continue to represent a sizable part of the cryptocurrency market despite Calacanis’s criticism.
CoinGecko data puts the combined market capitalization of tracked meme tokens near $35.9 billion, with approximately $3.55 billion in 24-hour trading volume.
Dogecoin remains the largest asset in the category, with a market value near $15 billion. Shiba Inu follows at roughly $3.4 billion, while MemeCore is valued near $2.8 billion.
Pepe and Pump.fun’s PUMP each have market capitalizations around $1.8 billion. Other heavily traded names include Pudgy Penguins’ PENGU and Official Trump.
Meme coins generally derive much of their value from online communities, attention and speculation instead of claims on business revenue or traditional financial assets. CoinGecko describes the category as tokens that gain relevance through memes and community-driven momentum.
Calacanis has criticized the risk profile of such assets before his latest statement. He has argued that people should not buy meme coins or invest in startups unless they are financially able to lose their entire investment.
His latest wording goes further by describing the category itself as a “giant scam.” That characterization represents Calacanis’s opinion and does not establish that every meme-token project is fraudulent.
Fake meme coins have used public figures to attract traders
Recent incidents show why public figures sometimes issue explicit statements distancing themselves from tokens associated with their identities.
Robinhood CEO Vlad Tenev’s X account was compromised in July and used to promote a fake company-linked meme coin named Vladhood. The token briefly reached a market capitalization near $10 million before Robinhood confirmed that Tenev’s account had been breached.
Robinhood removed the unauthorized promotion and worked with X to restore control of the account.
A separate attack targeted Keith Gill, the trader known online as Roaring Kitty. His verified X account was used in May to promote a Solana token called Red Kitten Crew.
Crypto.news reported that traders lost millions after the token briefly reached a market capitalization of roughly $12 million. The developer had acquired 39.5% of the token supply through multiple wallets before selling tokens worth approximately $611,000.
Influencer names can be used without a compromised account as well. In June, several Solana tokens appeared using the identity of crypto commentator Ansem.
In related coverage, crypto.news reported that Ansem had not created most of the tokens bearing his online identity and had publicly disavowed several versions.
The episodes differ from Calacanis’s post because there is no evidence in his statement that his X account was hacked or that a specific unauthorized token had already been launched in his name.
Calacanis remains critical of Bitcoin despite calling himself a fan
Calacanis’s support for Bitcoin has come with repeated criticism of the asset’s development and long-term role.
On Sept. 18, he described Bitcoin’s rebound as a “dead cat” bounce while questioning how much progress the network had made after roughly 17 years.
He argued that Bitcoin remained difficult for mainstream consumers to use for everyday transactions and criticized its limited native smart-contract functionality. Calacanis questioned whether public interest in the cryptocurrency remained as strong as in previous market cycles.
Those comments were an opinion about Bitcoin’s utility and market direction, not a technical finding about the network.
Bitcoin has since traded substantially higher. Recent market data placed BTC near $85,000 after an eight-month high above $86,000, while the asset was approaching positive year-to-date performance.
Calacanis made similarly skeptical remarks in August, when he described an earlier Bitcoin rebound as another “dead-cat bounce” and said he believed individuals and institutions had more valuable assets available to own.
At other times, he has posted positively when Bitcoin prices rise. His Sept. 27 statement therefore did not reject cryptocurrency as a whole. It specifically separated his interest in BTC and TAO from meme coins.
Social media remains a route for crypto impersonation scams
Calacanis’s warning about private investment instructions follows several attacks in which scammers have relied on trusted social identities rather than vulnerabilities in cryptocurrency protocols.
In July, compromised SpaceX and Starlink accounts promoted a meme coin named SCATMAN. Crypto.news reported that the attacker used the companies’ established identities to direct attention toward the token before selling holdings worth approximately $135,000.
Meme-coin traders have faced other attack methods. Crypto.news reported in September that malicious websites connected with token listings were displaying fake Cloudflare verification screens and instructing users to execute computer commands. One trader reported losing roughly $600,000 after interacting with such a page.
Calacanis did not announce a new token, investment product or crypto fundraising project in his Sept. 27 statement. His post said he discusses Bitcoin and TAO publicly but will not privately instruct followers to trade assets or participate in meme coins.


Pump.fun has transferred another 47,994 SOL worth approximately $5.83 million to Kraken as on-chain trackers continue monitoring the launchpad’s treasury movements.
Summary
- Pump.fun moved 47,994 SOL worth roughly $5.83 million to Kraken, according to Lookonchain data today.
- Lookonchain estimates Pump.fun has sold 5.236 million SOL worth $848 million since platform operations began.
- Pump.fun’s official dashboard shows $463.5 million spent on PUMP buybacks and burns through late September.
- Solana traded near $121 after the transfer, gaining roughly 1% over the previous 24 hours.
- Earlier Pump.fun transfers to Kraken have repeatedly preceded or accompanied treasury conversions tracked on-chain publicly.
Lookonchain reported on Sept. 27 that the Solana-based platform moved the tokens to the centralized exchange roughly two hours before its update. The analytics service classified the transaction as another sale and estimated Pump.fun’s cumulative SOL sales at 5,236,623 tokens worth around $848 million.
At an estimated average price of $162 per SOL, the cumulative figure extends a pattern of large transfers from Pump.fun-linked wallets to Kraken. The latest blockchain movement confirms that the assets reached the exchange, although an exchange deposit by itself does not establish whether every token was sold after arrival.
SOL was trading near $121 on Sept. 27, according to CoinGecko market data, up roughly 1% over 24 hours and 11.6% over seven days.
Pump.fun SOL transfers to Kraken continue long-running pattern
Pump.fun has periodically moved large batches of SOL generated through its platform to Kraken, with on-chain analysts tracking the transactions since 2024.
In May, Lookonchain reported that the platform had sold around 4.47 million SOL for approximately $780 million at an average price near $175. The tracker said 4.20 million SOL had been deposited into Kraken, while 264,373 SOL had been sold directly on-chain for about $41.6 million in USDC.
As crypto.news previously reported on Pump.fun’s SOL activity, the May activity included another 100,628 SOL valued at $8.32 million. The report separated tokens deposited into Kraken from the smaller amount visibly exchanged on-chain.
A similar pattern appeared in June 2025. Pump.fun transferred 132,180 SOL worth around $20.87 million to Kraken, pushing cumulative exchange deposits at the time to more than 2.47 million SOL for that year.
Pump.fun deposits to Kraken had crossed $660 million by June 2025 when earlier transfers were included. The available blockchain data did not establish that every deposit represented an immediate market sale.
Another February 2025 transaction involved 65,122 SOL worth approximately $11 million. In related coverage, crypto.news tracked Pump.fun’s earlier Kraken transfers as Lookonchain estimated cumulative deposits near 2.35 million SOL.
The Sept. 27 estimate of 5.236 million SOL therefore combines a longer series of treasury movements that Lookonchain categorizes as sales. The total value of $848 million represents the analytics firm’s cumulative calculation rather than a financial figure disclosed directly by Pump.fun.
Solana trades above $120 after the latest transfer
SOL remained above $120 after the latest Kraken transfer, showing no immediate sharp market reaction tied solely to the transaction.
CoinGecko data placed Solana near $121.38, with roughly $2.83 billion in 24-hour trading volume and a market capitalization above $71 billion. The token had gained about 11.6% during the previous seven days.
Earlier in September, SOL had traded closer to $100. Crypto.news reported on Solana’s recovery from the $98 area as traders watched resistance between roughly $103 and $106.
By Sept. 18, SOL had risen above $105. In another market update, Solana was testing its upper Bollinger Band as price momentum improved.
No evidence currently links Pump.fun’s Sept. 27 Kraken transfer to a measurable drop in SOL. The transaction represents less than $6 million against Solana’s multibillion-dollar daily spot volume.
Pump.fun continues PUMP buybacks while moving SOL
Pump.fun’s treasury activity now operates alongside an established PUMP token buyback and burn program.
The platform’s official PUMP dashboard showed approximately $463.5 million had been used to purchase and burn 167.91 billion PUMP tokens as of Sept. 25. Pump.fun reported annualized protocol revenue of about $504 million based on its 90-day average.
Its current framework allocates around 50% of platform revenue toward PUMP purchases and burns. On Sept. 25 alone, the platform spent approximately 7,100 SOL, worth $838,200, to purchase 208.9 million PUMP.
One day earlier, Pump.fun used roughly 7,200 SOL worth $832,400 to buy 211.8 million PUMP. Daily buybacks during Sept. 16-25 generally involved between about 6,800 and 8,700 SOL.
Pump.fun’s recurring PUMP buybacks after another large purchase used more than 8,300 SOL to acquire hundreds of millions of PUMP tokens.
Pump.fun states on its dashboard that purchased tokens are permanently burned. The platform said 16.79% of the original one trillion PUMP supply had been removed through the program by Sept. 25.
The company cautions that past purchases should not be treated as a commitment to future discretionary activity beyond amounts covered by its programmed allocation.
Kraken deposits do not confirm an executed sale
Exchange deposits are often monitored because they can make assets available for trading, but the blockchain transaction ends when the tokens reach an exchange-controlled address.
Kraken does not publicly disclose how individual Pump.fun deposits are subsequently handled. Transactions executed within a centralized exchange generally occur on internal ledgers and cannot be reconstructed directly from the original Solana transfer.
Earlier Pump.fun reporting shows why the distinction matters. Lookonchain separately tracked millions of SOL sent to Kraken and 264,373 SOL visibly sold on-chain for $41.64 million in USDC.
Another crypto.news report covered a $22 million Pump.fun SOL transfer to Kraken and noted the project’s recurring treasury-processing pattern.
Lookonchain currently estimates cumulative activity at 5,236,623 SOL worth $848 million and an average price near $162. Its Sept. 27 update categorizes the fresh 47,994 SOL movement as another sale.
The altcoin market has added more than $371 billion in capitalization since June 2026 as 87% of Binance-listed altcoins climbed above their 200-day moving averages, according to CryptoQuant analyst Darkfost.
Summary
- $371 billion has entered TOTAL2 since June, lifting altcoin market capitalization by roughly 45% overall.
- 87% of Binance-listed altcoins now trade above their respective 200-day moving averages, Darkfost estimates today.
- 84% of Binance-listed altcoins traded below their 200-day averages at the end of June 2026.
- Binance altcoin deposit transactions recently reached 31,800, nearly four times their July average level overall.
- TOTAL2 now stands near $1.17 trillion, according to current market data published by TradingView today.
Darkfost reported on Sept. 27 that TOTAL2, which tracks cryptocurrency market capitalization excluding Bitcoin but including Ethereum, had risen about 45% over the period. The analyst described the breadth of the recovery as a sign of strong bullish momentum while warning that the market may be approaching a more fragile stage.
Current TradingView data places TOTAL2 near $1.17 trillion. The index covers the combined market value of cryptocurrencies outside Bitcoin among the assets tracked by TradingView.
Altcoin rally reverses months of technical weakness
The 200-day moving-average data shows a sharp reversal from conditions seen only a few months ago.
Darkfost said roughly 87% of altcoins listed on Binance now trade above their respective 200-day moving averages. Only about 13% remain below the long-term trend indicator.
The figures were almost the reverse during the summer. About 84% of Binance-listed spot altcoins were trading below their 200-day moving averages, based on Darkfost’s CryptoQuant analysis.
At the time, the weakness had persisted for nearly eight months, making it the second-longest period since 2020 in which most Binance altcoins remained below the indicator. Bitcoin was trading near $59,464 and Ethereum around $1,588 when the June analysis was published.
By Sept. 19, the balance had already changed considerably. Darkfost reported that around 70% of Binance altcoins had moved back above their 200-day averages, while TOTAL3 — which excludes both Bitcoin and Ethereum — had crossed $800 billion for the first time in eight months.
The Sept. 27 reading raises that share to 87%, based on Darkfost’s latest calculation. The statistic describes market breadth across Binance-listed assets, not the percentage increase in individual token prices.
A 200-day moving average represents the average closing price of an asset over roughly 200 trading days. Traders commonly use the measure to assess whether an asset is trading above or below its longer-term price trend.
TOTAL2 has gained more than $371 billion since June
Capitalization data has moved alongside the improvement in individual altcoin trends.
Darkfost estimates that TOTAL2 has added more than $371 billion since June, representing a gain of around 45%. TOTAL2 includes Ethereum while excluding Bitcoin, making it one measure of how capital values assets outside the largest cryptocurrency.
TradingView currently puts TOTAL2 near $1.17 trillion. Its data shows the index up roughly 9.6% over the past week and more than 12% over the previous month.
TOTAL3, which removes both Bitcoin and Ethereum, is near $810 billion. TradingView defines TOTAL3 as the combined capitalization of its tracked cryptocurrencies excluding the two largest crypto assets.
The distinction is relevant because Ethereum contributes more than $330 billion to the current crypto market capitalization. TradingView’s total-market data puts ETH’s market value near $334 billion, behind Bitcoin at approximately $1.73 trillion.
Crypto.news reported earlier this month that perpetual-futures open interest tied to altcoins exceeded Bitcoin open interest for the first time since December 2024. Coinalyze data showed Bitcoin represented roughly 37% of the tracked perpetual positions at the time.
The derivatives reading showed leveraged activity increasing as several altcoins rallied. It measures outstanding futures positions, however, and does not determine whether traders are collectively positioned for further gains or declines.
Binance activity rises with the altcoin recovery
Exchange activity has accelerated during the same period. Darkfost reported on Sept. 15 that Binance recorded a seven-day average of roughly 31,800 altcoin deposit transactions. The figure was nearly four times July’s average of approximately 8,300 transactions.
Binance inflows, Coinbase’s average increased from roughly 2,200 transactions to 4,700 while Bybit reached around 2,700.
The CryptoQuant metric counts deposit transactions sent to exchanges rather than their dollar value. More deposits can indicate increased market participation because tokens are moving onto trading platforms, but the metric does not establish that the assets were subsequently sold.
Darkfost said at the time that rising exchange activity “could be tied to selling pressure,” while noting that selling pressure had not reached an unusually high level in the data he was examining.
TOTAL3 had gained more than $136 billion during the period covered by that Sept. 15 analysis. The newer TOTAL2 calculation captures a longer period beginning in June and includes Ethereum, so the two figures measure different market groups and time windows.
Binance remains an important venue for assessing altcoin activity because of the large number of spot markets available on the exchange. The 87% moving-average reading is based specifically on Binance-listed altcoins and should not be treated as a measure of every token traded globally.
Darkfost sees warning signs after the rapid advance
Despite the recovery, Darkfost said the latest market structure is beginning to resemble a period of “euphoria.”
The analyst’s warning is based partly on the speed and breadth of the move. A market in which almost nine out of ten measured altcoins trade above their 200-day averages represents a sharp change from August, when roughly 80% remained below the indicator.
Separate reporting based on Darkfost’s Sept. 27 analysis said altcoin exchange deposits have reached levels last observed near October 2025. The analyst has treated the rise as a possible warning that more assets are becoming available for trading, though deposits alone cannot establish selling activity.
The same analysis identified a bearish divergence in TOTAL2’s relative strength index. Under that setup, market capitalization continues advancing while the momentum indicator fails to strengthen at the same pace. Darkfost interpreted the divergence as a warning that upward momentum could be losing force.
His caution follows an earlier change in crypto market sentiment. Darkfost sentiment indicator briefly climbed above 89, entering what the analyst described as an “extreme greed” range before easing.
Bitcoin has continued to rally during the altcoin recovery. BTC held above $84,000 after climbing roughly 45% from July levels, while Binance recorded its largest daily Bitcoin net outflow since 2023.
By Sept. 26, Bitcoin was trading near $84,077 while the total crypto market capitalization stood close to $2.98 trillion, according to CoinGecko figures cited by crypto.news. Quant, Ethena and Bitway were among the strongest weekly performers in the top 100 cryptocurrencies.
Darkfost’s latest assessment does not provide a specific date or price level for a reversal. His Sept. 27 analysis describes the 87% reading, the $371 billion increase and the developing momentum signals as conditions to monitor after the sharp altcoin recovery.

Some assets linked to the Bitget security breach have entered Wasabi CoinJoin after moving through several blockchains and swap routes, according to blockchain compliance firm AMLBot.
Summary
- AMLBot traced roughly four BTC linked to Bitget theft into a Wasabi CoinJoin transaction round.
- Funds moved from TRON through USDT0, Ethereum and THORChain before reaching Bitcoin addresses for mixing.
- Bitget now confirms approximately $387.5 million was transferred to attacker-controlled addresses during the September breach.
- About $343 million remained dormant across thirteen attacker wallets as of September 25, AMLBot estimated.
- Bitget plans phased withdrawals from September 28 after identifying and fixing the underlying security vulnerability.
AMLBot said on Sept. 27 that its tracing connected roughly 4 BTC in one CoinJoin round to funds originating from a Bitget-linked TRON wallet. The firm described the activity as an apparent attempt to obscure the movement of stolen assets.
The finding comes after Bitget revised the value of assets transferred to attacker-controlled addresses to approximately $387.5 million. The exchange’s official investigation update said the new total includes Zcash and TRON assets that were missing from its initial $351.6 million estimate.
Bitget funds moved through four networks before CoinJoin
AMLBot traced a multi-stage route beginning on TRON. According to the firm’s account, the attacker first converted TRX into USDT. The funds were then moved to Ethereum through USDT0, an omnichain version of Tether designed for transfers between supported networks.
Once on Ethereum, the assets were swapped into approximately 145 ETH. AMLBot said the ETH subsequently moved through THORChain and was converted into around 4.59 BTC.
The Bitcoin was then divided into smaller amounts before reaching a Wasabi CoinJoin round. AMLBot said its analysis could connect roughly 4 BTC in that transaction back to the Bitget TRON wallet.
CoinJoin combines Bitcoin inputs and outputs from multiple participants in a single transaction. The technique can make transaction tracing more difficult because blockchain observers cannot simply map one input to one corresponding output.
AMLBot characterized the activity as laundering through Wasabi CoinJoin and said it had blacklisted the linked addresses. The company is continuing to monitor the Bitcoin for further CoinJoin activity.
The attribution remains AMLBot’s blockchain analysis. Public blockchain records show transfers between addresses, swaps and cross-chain activity, but the purpose of each transaction is inferred from the observed flow and address attribution.
A Binance News summary published Sept. 27 repeated the same sequence, citing reports based on AMLBot’s tracing.
Bitget raises confirmed loss to $387.5 million
Bitget initially said the Sept. 24 incident affected approximately $351.6 million in assets after unauthorized transfers from portions of its hot and warm wallet infrastructure.
The exchange detected the activity at 18:31 UTC and suspended withdrawals while leaving deposits and trading operational. Cold wallets remained secure, according to Bitget’s initial security notice.
By Sept. 25, Bitget’s transaction classification had raised the confirmed amount to approximately $387.5 million. The exchange said the increase did not result from new thefts after the breach. Investigators had instead identified additional Zcash and TRON assets involved in the original incident.
Affected assets included ETH, XRP, USDT, USDC, USDT0, ZEC, XAUt, BNB, AVAX and TRX. Bitget published primary attacker-controlled addresses on Ethereum-compatible networks, XRP Ledger, Zcash and TRON as part of its recovery work.
Bitget’s preliminary findings pointed toward a compromise involving backend wallet infrastructure rather than a leak of private keys. CEO Gracy Chen said private keys remained secure while investigators worked to identify the exact intrusion path.
Bitget later said its security team had identified the attack path and the method used to bypass existing controls. The company said the underlying vulnerability had been fixed, though it has not publicly released a complete technical root-cause report detailing the exploit.
AMLBot says most stolen assets remain dormant
The CoinJoin activity represents only a small part of the funds linked to the breach.
In a Sept. 25 update, AMLBot said approximately $343 million, representing around 88% of the roughly $389 million it was tracking, had not moved. The firm’s figure was based on addresses it had attributed to the attacker.
AMLBot identified 13 dormant wallets holding several asset types. Eight Ethereum wallets contained approximately 68,300 ETH, while four XRP addresses held around 83 million XRP. Another wallet contained close to 18,900 ZEC.
The firm said none of those 13 addresses had sent a transaction since receiving the funds. Its subsequent Wasabi update concerns a different portion of the stolen assets that had already begun moving between chains and assets.
Other researchers have traced separate conversion activity. Crypto.news reported on Sept. 25 that security researcher Taylor Monahan identified stolen USDC being moved and converted into ETH after the attack.
Her findings showed attacker-controlled assets being bridged and swapped after leaving Bitget. The report noted that Circle can freeze USDC at specified addresses when legal requirements are met, though the public transaction trail did not establish whether a qualifying legal order had reached Circle at the time.
The subsequent AMLBot tracing shows another part of the flow crossing from TRON to Ethereum and then into Bitcoin through THORChain before entering CoinJoin.
Bitget prepares phased withdrawal reopening
Bitget is preparing to restore withdrawal services after saying the vulnerability responsible for the incident has been remediated.
The exchange’s withdrawal schedule starts with Bitcoin at 08:00 UTC on Sept. 28. ETH withdrawals on Ethereum, BSC, Arbitrum, Base and Optimism are scheduled for Sept. 29.
USDT withdrawals on Ethereum, BSC, Solana and TRON are scheduled to resume on Sept. 30. Other token withdrawals, fiat services and peer-to-peer withdrawals are expected to return on Oct. 2.
Bitget said Mandiant and SlowMist continue to assist with the security investigation while its technical teams perform validation work on the withdrawal infrastructure.
As crypto.news reported on the reopening plan, Bitget says its Protection Fund will cover the financial loss from the incident and customer account balances remain unchanged. The exchange reported that the fund held more than $464 million during the withdrawal pause.
Bitget’s September proof-of-reserves update, published before the breach, showed a total reserve ratio of 135% across 19 covered assets. The exchange states that it maintains at least a 1:1 reserve ratio for user assets covered by the program. CEO Gracy Chen is scheduled to host a live AMA at 07:30 UTC on Sept. 28 covering the incident, restoration of withdrawals and the exchange’s next steps.
The spot exchange-traded funds tracking the performance of Ripple’s cross-border token started the week quietly but built on by the end of it, reaching a new cumulative all-time high.
At the same time, the products tracking Solana’s SOL are on a green-only streak since September 11, and the inflows peaked on Friday with more than $86 million.
XRP ETFs Had a Big Week
The previous business week was a little shaky for the XRP ETFs, as they attracted a more modest $9.56 million, less than half of the $19 million seen in the first few weeks of September. Nevertheless, the financial vehicles still extended their green streak to ten consecutive weeks.
After marking more net outflows last Thursday and Friday, investors stood on the sidelines on September 21 as the new week began, with SoSoData showing no reportable inflows on Monday. However, the trend changed on Tuesday and remained on a high note until Friday.
Investors poured in $20.02 million on September 22, followed by $18.04 million on September 23, another $14.89 million on Thursday, and $22.65 million on Friday. This meant that the five-day trading period ended well in the green, with net inflows of $75.89 million – the best weekly performance in a month.
The cumulative net inflows skyrocketed to another all-time high of $1.79 billion. Bitwise’s XRP fund remains the undisputed leader with cumulative net inflows of $677 million, followed by Franklin’s XRPZ at $501 million and Canary Capital’s XRPC at $489.37 million.

SOL ETFs Had an Even Bigger Week
While the performance of the funds tracking XRP was quite impressive, the SOL counterparts did even better. Monday began with a bang, as the ETFs attracted $26.10 million. Another $28.87 million followed on Tuesday, $13.77 million on Wednesday, and $32.81 million on Thursday, before investors went all in on Friday with a massive inflow day of $86.67 million.
This became the single-best daily inflow since the funds’ inception nearly a year ago. Moreover, the weekly inflows hit a 2026 high with $188.22 million poured in, which was also the second-best ever, only trailing the launch week in October with $199.21 million.
The total net inflows rocketed to a new all-time high of their own at $1.61 billion. Bitwise’s SOL ETF is once again the undisputed leader, with cumulative net inflows of $1.22 billion. Fidelity’s FSOL is far behind at $231.35 million, followed by Grayscale’s GSOL with $164.15 million.

The post XRP ETFs Attract $75M in a Week as SOL Funds Hit New 2026 High appeared first on CryptoPotato.
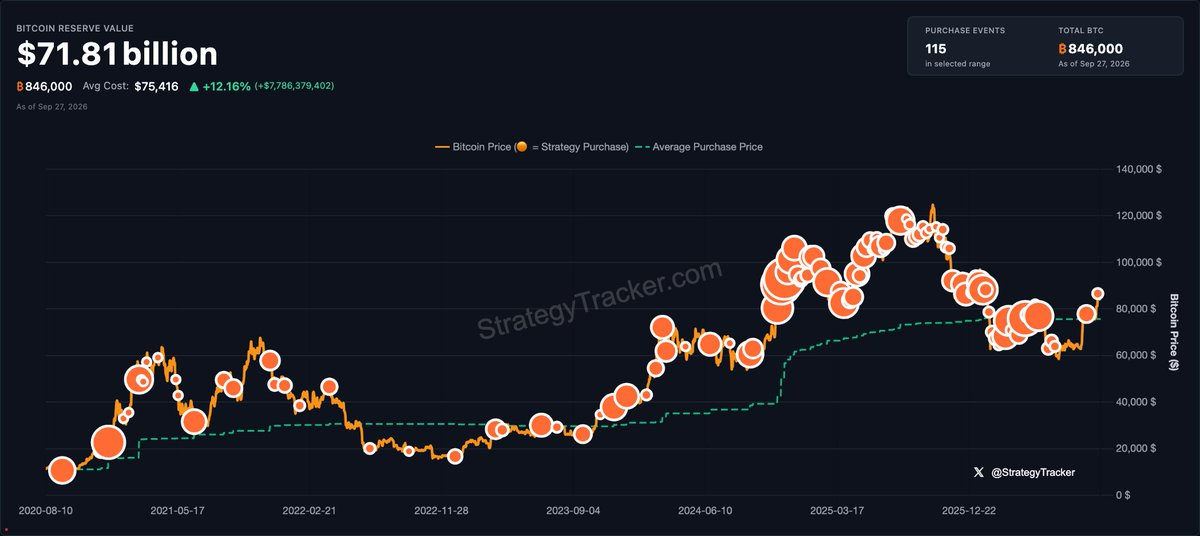
Michael Saylor, executive chairman of Strategy (formerly MicroStrategy), posted a new Bitcoin (BTC) chart on Sunday with the caption “Even more orange.” Posts like this one have often come a day before the company reports new Bitcoin purchases.
Strategy is the largest public company holding Bitcoin. It reports its purchases in filings with US regulators, usually on Mondays.
Last Sunday’s Orange Post Came a Day Before a 950 BTC Buy
Orange is Bitcoin’s brand color. Each orange dot on Saylor’s chart marks a purchase, and bigger dots mean bigger buys.

“Even more orange,” Saylor indicated.
Last Sunday, he posted a similar chart captioned “A little more orange.” That evening, BeInCrypto reported Saylor’s buying hint and said Monday’s update would settle it.
It did. The next day, MicroStrategy disclosed a 950 BTC purchase worth about $76 million, or $79,670 per coin, according to its ledger. That brought its holdings to 846,000 BTC.
Notably, however, the signal does not always lead to a buy, though. The week before, Strategy’s filing showed no Bitcoin bought or sold.
Why MicroStrategy’s Next Bitcoin Move Matters
Strategy has not only been buying this year. Its ledger lists four sales between June 30 and August 10, totaling 6,916 BTC.
Last week it also spent $174 million buying back STRC, a preferred share that pays holders a monthly dividend. That was more than twice what it spent on Bitcoin.
Right now, Bitcoin trades near $84,974, up 1% over 24 hours. That puts the price about 13% above Strategy’s average cost of roughly $75,416 per coin. Earlier this month, the company sat 2% above cost.
Monday’s filing will show whether last week’s 950 coins restarted steady buying or set a slower pace.
The post Did MicroStrategy Buy More Bitcoin? Michael Saylor Drops Another Signal appeared first on BeInCrypto.

In Solana news, the Solana Foundation recently announced the hiring of Rachel Conlan, former Chief Marketing Officer at Binance, as Chief Strategy Officer, and Jamal Raees, a veteran from Polygon Labs, as General Manager of Payments. The foundation made this announcement on September 24, 2026.
The foundation believes that these new hires will help secure partnerships with banks, asset managers, and payment companies as the financial sector increasingly shifts towards blockchain technology.
Solana currently leads all blockchains in tokenized stock trading, with more tokenized stocks than any other platform. As of September 27, SOL trades at around $123, up +2.8% for the day following a +15% weekly surge.
Despite $5 trillion in stablecoin volume, Solana’s transaction fees are extremely low, at just 0.000005 SOL per transaction, which offers minimal direct returns for SOL holders. Given these new hires, will they generate renewed interest and demand for SOL among investors?

Solana News: The Foundation Hires ex-Binance and Polygon Execs as Part of a Hierarchy Shakeup
Rachel Conlan brings extensive experience to her role at Solana, having spent three years as the global chief marketing officer at Binance, one of the largest cryptocurrency exchanges.
Her previous positions also include senior roles at OKX, CAA Sports, and Havas. At Solana, she will focus on developing institutional partnerships, driving ecosystem growth, and leading sales initiatives to attract companies to the Solana network.
Jamal Raees has also joined Solana from Polygon Labs and has a strong background in payment systems and stablecoins, gained through his work at Bridge (now part of Stripe) and Wyre.
In his role, he will build relationships with payment companies and businesses looking to move funds across the Solana platform.
Supercharge Your Trading in 2026 With BloFin AI Trading Bots
Solana Price Analysis: What Will the New Hires Mean for SOL?
In Solana price news, SOL is trading around $124, according to the latest CoinGecko data, up roughly +2.7% over the past 24 hours and 14.5% over the last seven days. Its market capitalization is about $73Bn, making it one of the largest cryptocurrencies by value.
The recent rebound has strengthened SOL’s short-term technical picture, with the token recovering from below $100 earlier this month. CoinGecko’s historical data shows SOL closing at $122.08 on September 25, highlighting the strength of the latest move.
At current levels, $120 is an important psychological support zone, while a sustained move above $125 could put $130 into focus. Beyond that, $140 could become the next significant resistance area.
With SOL still approximately -58% below its $293.31 all-time high, the token has substantial ground to recover if broader market momentum remains bullish.
Discover: The Best Token Presales
The post Solana News: Ex-Binance and Polygon Execs Join the Solana Foundation appeared first on Cryptonews.
XRP remains in a constructive short-term structure after rebounding sharply from its recent correction. However, the asset is now approaching the same major overhead supply region that has repeatedly capped upside momentum, making the next move around $1.60 particularly important.
Ripple Price Analysis: The Daily Chart
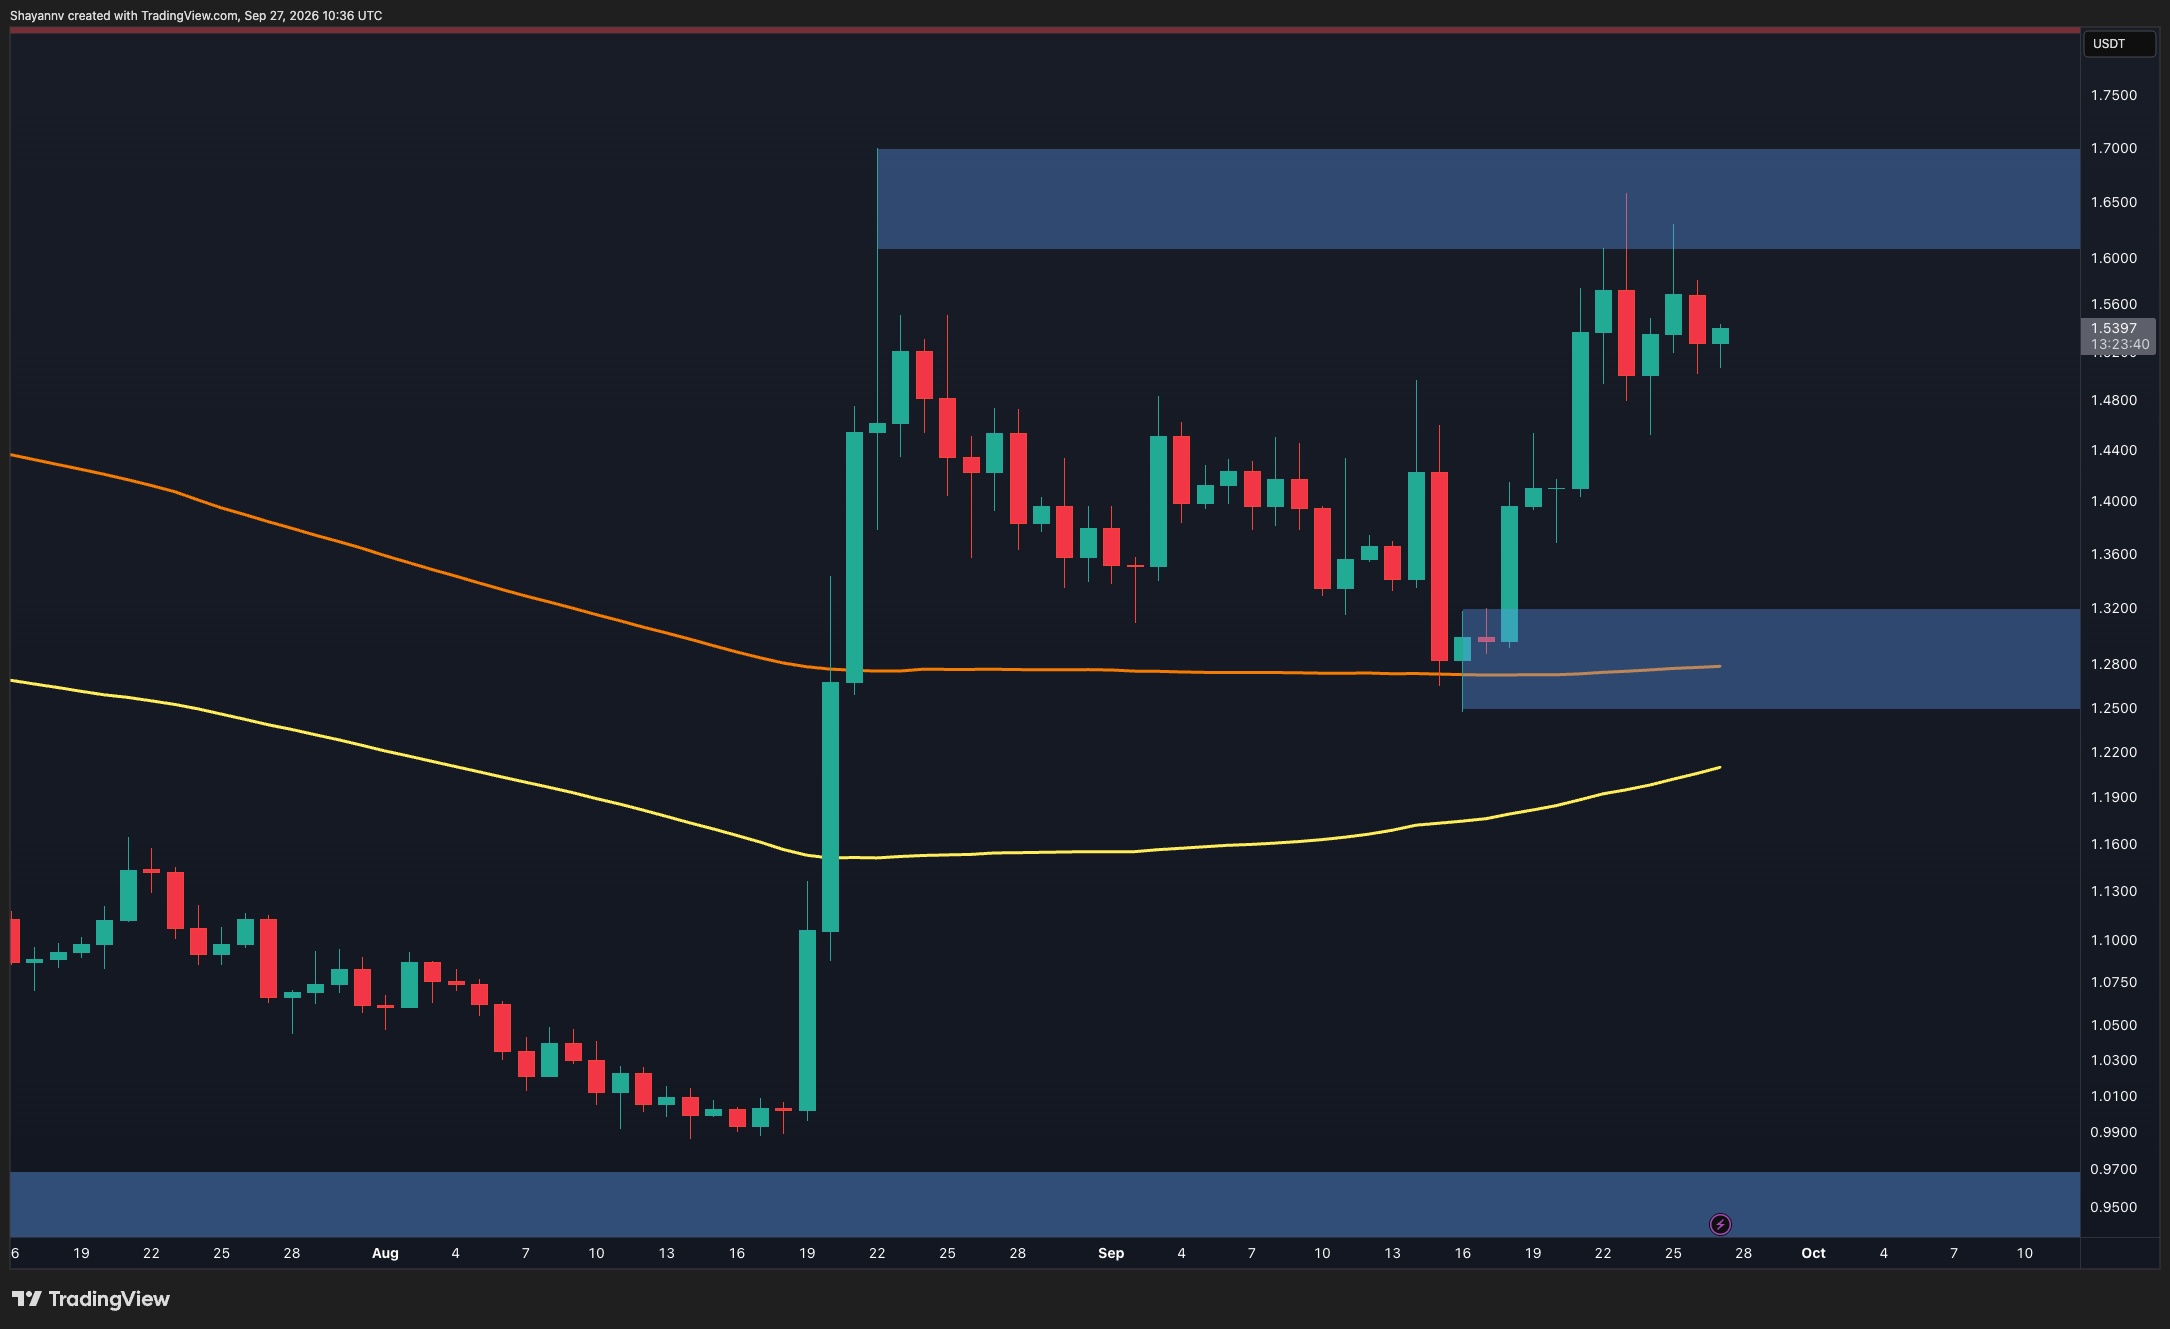
On the daily timeframe, XRP continues to trade well above both displayed moving averages following August’s explosive breakout. More recently, the price found strong support around the $1.25-$1.32 demand zone, which also coincides with the higher moving average, before launching another impulsive recovery.
That rebound has carried the asset back toward the major $1.60-$1.70 supply zone. The latest candles show the price consolidating around $1.54 after several attempts toward $1.60-$1.65 were rejected, suggesting that sellers remain active in this region.
Nevertheless, the broader structure is still constructive as long as XRP maintains its recent higher lows. A decisive daily close above the $1.60-$1.70 resistance zone would represent a significant bullish development and could clear the path toward higher levels.
On the downside, the $1.25-$1.32 zone remains the key daily support. Losing this region would substantially weaken the current bullish structure and could expose the much deeper support area around $0.93-$0.97.
XRP/USDT 4-Hour Chart
The 4-hour timeframe shows a clearer sequence of higher lows developing from the September low around $1.25. An ascending trendline has supported the recovery and is now converging with price around the $1.51-$1.53 region.
XRP recently rallied toward $1.60 but was rejected before gradually pulling back into this rising support. The latest candles indicate an attempt to bounce from the trendline, with the price recovering toward $1.54. As long as this structure remains intact, another push toward the $1.60-$1.70 supply zone appears possible.
The immediate challenge is reclaiming the recent $1.60-$1.62 highs. A breakout above this area would put the upper portion of the $1.60-$1.70 resistance zone back in focus and could support continuation of the broader rally.
Conversely, a confirmed breakdown below the ascending trendline would weaken the short-term setup. In that case, the $1.42-$1.45 demand zone would likely become the next important support area. A failure there could expose the larger $1.22-$1.28 zone, where the latest recovery originally began.

The post Ripple Price Analysis: XRP Tests Critical Resistance as Bullish Structure Holds appeared first on CryptoPotato.
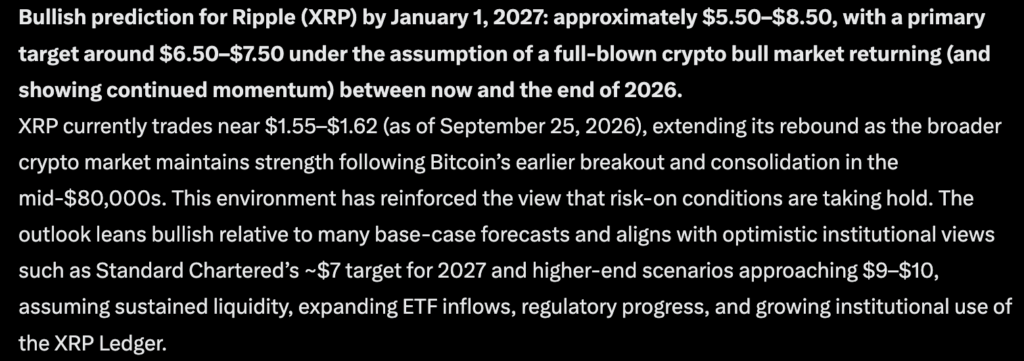
In ideal bull-market conditions, Anthropic’s Claude AI predicts Ripple (XRP) could hit $10, assuming sustained liquidity, expanding ETF inflows, regulatory progress, and growing institutional use of the XRP Ledger.
Claude’s bull-case target for XRP sits between $5.50 and $8.50, with a target of $6.50–$7.50, assuming a strong crypto bull market through late 2026.
As of September 25, 2026, XRP trades near $1.55–$1.62, benefiting from broader market strength following Bitcoin’s breakout. Optimistic forecasts, such as Standard Chartered’s target of ~$7, hinge on sustained liquidity, ETF inflows, regulatory progress, and increased institutional use of the XRP Ledger.
The current market signals the early stages of a sustained bull run, driven by improved macro conditions and capital rotation into large-cap altcoins.
Historical trends suggest XRP could rise significantly alongside Bitcoin, with potential moves up to the mid-to-high single digits in a bullish environment. However, this remains speculative and dependent on market conditions.
Technical Analysis Supporting the Claude Prediction
$5-$8. —
More than achievable.$XRP pic.twitter.com/SjCt8lJprk
 ChartNerd
  (@ChartNerdTA) September 25, 2026
On the higher timeframes, XRP has staged a strong multi-week rebound from mid-September lows near $1.25–$1.30, reclaiming key moving averages and pushing through successive resistance levels into the $1.55–$1.62 zone.
A sustained break and weekly close above $1.65–$1.70 (with volume confirmation) would further confirm the intermediate bullish structure, opening the path toward the prior cycle high near $3.65.
In a full bull-market regime led by Bitcoin’s recovery, reclaiming that prior high often acts as a powerful psychological and technical catalyst for further extension.
Fibonacci projections and measured moves from the multi-year base and recent recovery low project into the $5.50–$8.50 zone on continued momentum.
RSI has improved from oversold levels into constructive territory, price is holding firmly above clustered support from the 50-/100-/200-day averages, and the broader risk-on shift supports trend continuation.
Key supports to defend on any retests include the $1.45–$1.50 zone and the broader $1.30–$1.40 area; a decisive break below those would weaken the near-term recovery thesis.
Overall, the chart setup favors a multi-leg advance with strong upside potential as risk appetite builds, consistent with XRP’s historical pattern of sharp rallies once key resistances clear in bull-market conditions.
LiquidChain Targets Early Mover Upside as Claude AI Predicts $10 XRP
Anyone holding XRP from the sub-$1 range is in a comfortable spot. But buying in now, chasing a token already up +19% over seven days and pressing into resistance at $1.50, is a different risk calculus entirely; the easy money on this leg has largely been made.
That’s pushing some traders toward earlier-stage plays with more room to run, and cross-chain infrastructure is one of the more active corners of that search right now.
LiquidChain (LIQUID) is building a Layer 3 execution environment designed to fuse Bitcoin, Ethereum, and Solana liquidity into a single unified layer, a “deploy-once, access-all” model for developers tired of fragmenting liquidity across chains.
The presale is priced at $0.014958 per token, with over $971,000 raised to date. Core features include single-step execution and verifiable settlement, designed to remove bridging friction between ecosystems.
Gain Special Access to Layer 3 Trading Here
The post Claude AI Predicts XRP Could Hit $10 in 2026: How Does it Get There appeared first on Cryptonews.
It was hard to imagine after June ended and the massive outflows recorded within the first six months of the year, but the spot BTC ETFs have managed to turn the tables and are actually well in the green now YTD.
The spot Ethereum ETFs have erased last week’s losses, and the cumulative net inflows are up to nearly $14 billion again.
BTC ETFs Back in Green YTD
As reported earlier this week, the Monday numbers set a multi-month record in terms of daily inflows as investors inserted almost $1 billion within a single trading session. Although the inflows declined by the end of the week, they were still in the green. $714.75 million entered the funds on Tuesday, another $346.98 million on Wednesday, $190.65 million on Thursday, and $134.47 million on Friday.
Consequently, this pivotal week ended with $2.39 billion in net inflows for the spot Bitcoin ETFs, pushing the cumulative total net inflows to $57.55 billion. As mentioned above, the YTD numbers have turned green, which was nearly impossible after June. At the time, investors pulled out a record $4.51 billion from the funds, which followed a painful May with $2.43 billion in net outflows. YTD, the funds were nearly $5.5 billion in the red.
However, the narrative shifted in July with a modest $172 million in net inflows, but it skyrocketed in August and September. The ETFs attracted $3.52 billion in August and are up by $2.7 billion so far in September. As such, the 2026 numbers are at $925 million in the green.
At the same time, though, the underlying asset remains 40% away from its all-time high. Crypto Rover believes this difference won’t last long, as “institutional money is accumulating like never before and has shortened the bear market dramatically.”
THIS IS INSANE:
Bitcoin is still more than 40% away from its all time high.
Meanwhile, spot cumulative ETF flows are only 10% away from their all time highs.
Institutional money is accumulating like never before and has shortened the bear market dramatically. pic.twitter.com/39ztaA4AFI
— Crypto Rover (@cryptorover) September 26, 2026
ETH ETFs in Green Too
The exchange-traded funds tracking the largest altcoin also enjoyed a strong start to the business week, gaining almost $270 million on Monday. They also saw green-only in the following four trading days and ended with $689.88 million in net inflows. Thus, they offset all the losses from the previous business week by a large margin and hit a new multi-month high in terms of cumulative net inflows of $13.94 billion.
Meanwhile, the underlying asset touched $2,800 during the week but was stopped there and now trades at around $100 lower.

The post Bitcoin ETF Comeback: $2.4B Week Flips Year-to-Date Flows Positive appeared first on CryptoPotato.
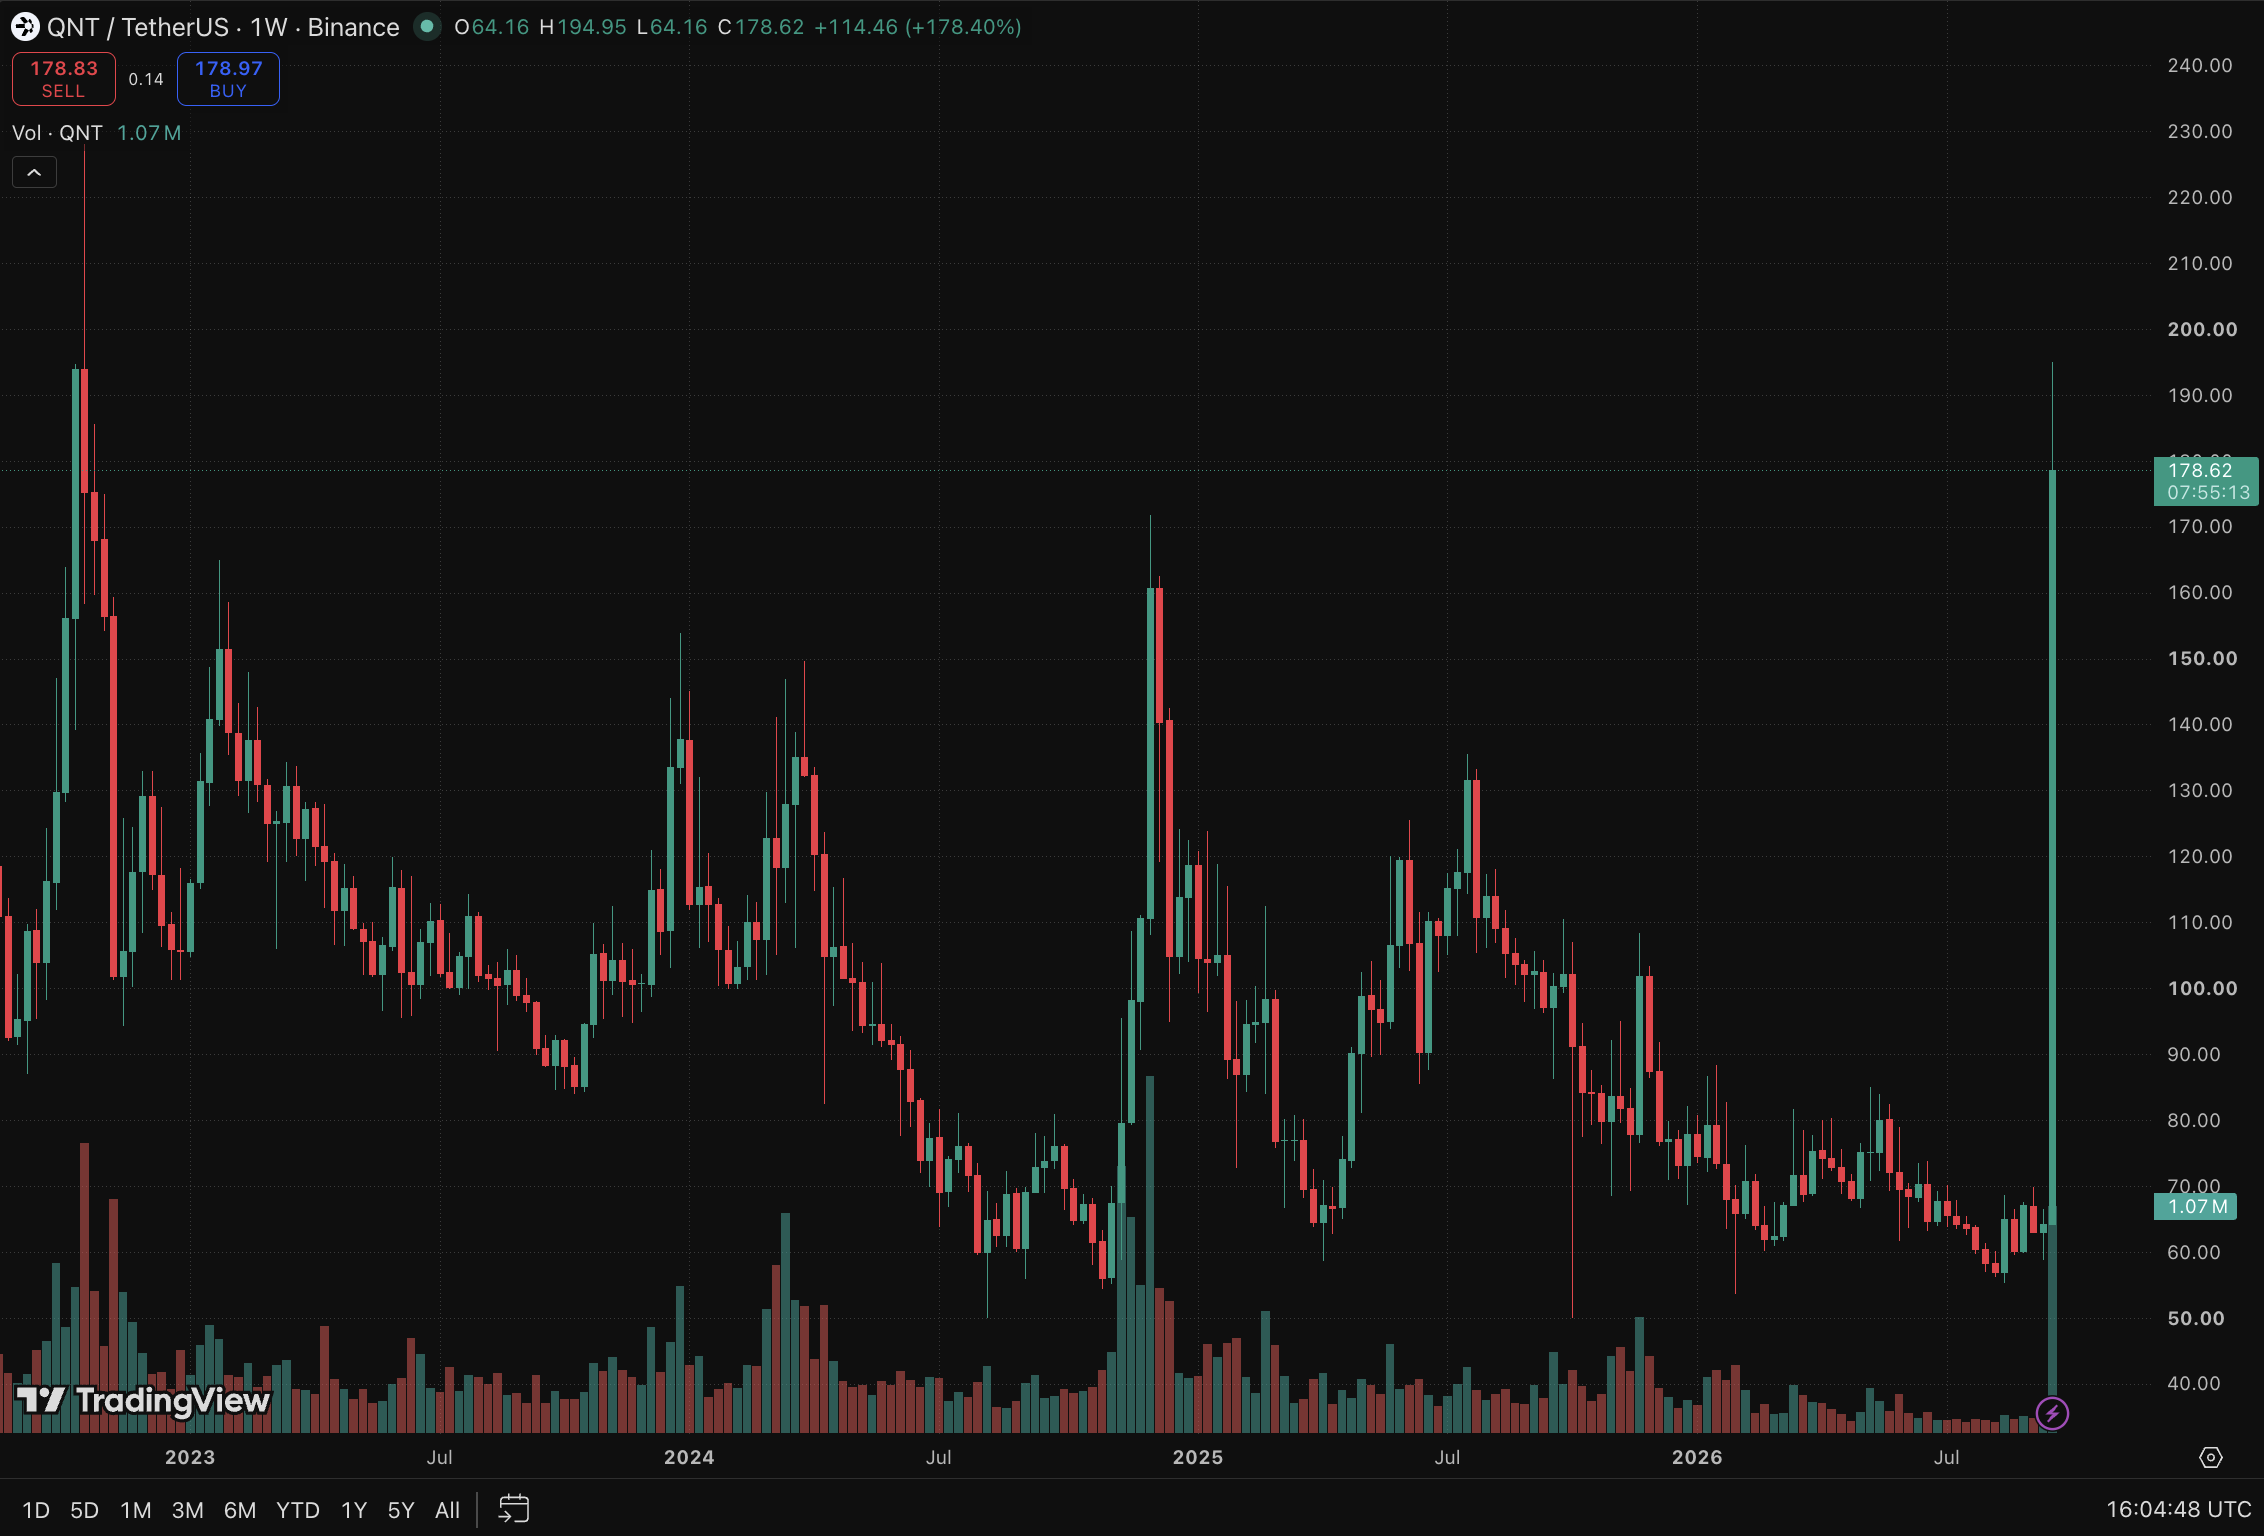
Quant crypto has exploded roughly +178% over the last seven days, including an extraordinary +72% daily surge. Quant is quickly becoming the most talked-about cryptocurrency, as its price action is tied to a major deal with US banks.
At press time, Quant is trading around $178.46, though the price is moving extremely quickly amid unusually intense volatility.

(SOURCE: TradingView / Quant Crypto)
Unlike many sudden surges in the crypto market, this excitement is fueled by a major fundamental development. Quant has secured a significant role in The Clearing House’s upcoming on-chain payments infrastructure in the United States.
This builds on its previous work with major UK banks. However, the chart shows valid reasons for caution after the price rose rapidly from around $65 to nearly $200.
What is the Major U.S. Banking Deal that Has Caused the +200% Quant Price Surge?
The biggest catalyst for this development occurred when The Clearing House announced on September 24 that it had chosen Quant to power its On-Chain Money Initiative. Quant will provide the network’s interoperability, orchestration, and transaction management layer.
This infrastructure is designed to enable financial institutions to clear and settle tokenized deposits while integrating with existing payment systems, including RTP and CHIPS. The network is expected to be available to participating institutions during the first half of 2027.
The Clearing House’s scale helps explain why crypto traders reacted so strongly. Its U.S. payment networks clear and settle over $2 trillion every day. In 2025 alone, CHIPS averaged approximately $2.014 trillion in daily payment value.
Quant isn’t directly processing $2 trillion worth of transactions. That figure refers to the scale of The Clearing House’s existing payment networks.
Quant has been selected to provide the technology for the new On-Chain Money Initiative, which is scheduled to launch next year. Nevertheless, this partnership places Quant’s technology in close proximity to major U.S. banking infrastructure.
Never Miss a Swing Again: Use AI Copy Trading Bots From CryptoHopper
The U.S. Deal Follows Quant’s Work With Major UK Banks
UK Finance has selected Quant, along with several banks, including Barclays, HSBC, Lloyds Banking Group, NatWest, Nationwide, and Santander, to provide infrastructure for the UK’s tokenized sterling deposits project.
This initiative involves live transactions of tokenized commercial bank deposits and ensures interoperability between bank ledgers and existing payment systems.
Now, Quant (QNT) is shifting its focus from major banking projects in the UK to a potentially significant role in U.S. tokenized deposits. The Clearing House has highlighted Quant’s experience delivering on-chain capabilities in regulated environments.
For traders, this progression presents a compelling narrative: UK banking infrastructure is paving the way for U.S. banking infrastructure, especially as tokenization and programmable money become increasingly important trends.
However, investors should be aware that adopting Quant’s technology does not necessarily translate into a direct increase in demand for the QNT token.
While the banking partnership is undoubtedly significant for Quant and its technology, the overall impact on QNT’s token economics remains a distinct consideration.
Supercharge Your Trading in 2026 With BloFin AI Trading Bots
Quant Crypto Price Goes Parabolic: What Comes Next?
Hmmmmmmmm $QNT
usually does weird parabolic looking things before things get a little weird
That being said, pretty strong weekly. Smells fishy imo pic.twitter.com/IBvODwwLcS— BareNakedCrypto
, (@BullNakedCrypto) September 27, 2026
Throughout most of the displayed period, QNT traded within a relatively limited range. The price lingered between approximately $60 and $80 for several months, with the 200-day moving average positioned around $69.40.
QNT first broke through the $70-$80 range before rapidly climbing past $100. Following that, the price surge became nearly vertical, with QNT soaring through $120, $150, and $170, eventually reaching a high around $194.
Currently, at approximately $178, QNT is significantly above its 200-day moving average. While this doesn’t necessarily mean the rally will end immediately, prices can stay elevated longer than traders expect when a strong narrative meets speculative demand.
However, the gap between QNT’s current price and its underlying technical structure has reached an extreme level. There is very little recent price action to reference between roughly $100 and the current price, as QNT moved through that range too quickly.
This lack of established price structure can pose challenges during a reversal, as there are fewer areas where buyers previously accumulated positions.
Don’t Miss Out on Our $1,000 USDT Airdrop on ByBit
The post Quant Crypto Blasts 3x in a Week Following Huge US Bank Deal appeared first on Cryptonews.

Bill Gates Says It’s ‘Completely Irresponsible’ For AI To Not Have Safeguards

Pump.fun moves $5.83M in SOL to Kraken

13 Bestselling Beauty Items on Sale





-

 Fashion2 days ago
Weekend Open Thread: J.McLaughlin – Corporette.com
-
 Crypto World5 days ago
Goldman Sachs and Deutsche Bank Agree: The S&P 500 Rally Isn't Over
-

 Tech7 days ago
Researchers escape OpenAI Codex sandbox to run commands on host
-

 Fashion3 days ago
8 iPhone Accessories That Add Personality
-

 Crypto World7 days ago
Who Needs CLARITY Anyway? ARB Could See 70X Increase: Hodler’s Digest
-

 Entertainment5 days ago
These 17 Fall Amazon Dresses Seriously Look Like Anthropologie
-

 Business7 days ago
Analog Devices (ADI) Bets $1.35 Billion on Chips that Let Machines Think for Themselves
-

 Crypto World7 days ago
Coinbase, Robinhood, Circle Seen as Tokenized-Stock Winners
-

 Tech5 days ago
Reolink’s solar 4K security camera falls to its lowest price in months
-

 Crypto World5 days ago
This Bearish Netflix Stock Trade Can Cash In On Video Streaming Giant’s Woes
-
 Crypto World5 days ago
Trump-Xi Polymarket Odds for Handshake Hit 50%
-

 Tech6 days ago
Google’s $899 Googlebook is a bet that you’ll buy a new laptop for Gemini
-

 Crypto World4 days ago
Crude Oil Prices Pressured by Diplomatic Hopes in the Middle East
-
 Business5 days ago
Oil Price Today (September 23): Crude oil below $100 on hopes of US-Iran talks. What did Trump say?
-
 Crypto World4 days ago
Bitcoin price tests $83,600 Supertrend support after $87K rejection
-
 Crypto World4 days ago
Bitcoin Threatens Sub-$84,000 Breakdown as Long Liquidations Spike
-
 Crypto World6 days ago
Meta Jumps 11% As Muse Shines and Investors Show an Appetite for Advancing AI
-

 Crypto World5 days ago
Did Jim Cramer Just Give GameStop Stock the Kiss of Death When He Said the Turnaround Is Working?
-
 Crypto World7 days ago
Bitcoin price holds above $81K as key catalysts line up
-

 Crypto World5 days ago
BitGo says Bitcoin absorbed Fed hike, CLARITY failure
You must be logged in to post a comment Login