

Crypto World
Kentucky tests CFTC power with lawsuit against Kalshi, Polymarket



Kentucky Attorney General Russell Coleman has filed lawsuits against Kalshi, Polymarket and several related partners, accusing them of offering unlicensed sports betting in the state.
Summary
- Kentucky says prediction markets crossed into sports betting, while platforms claim federal law controls contracts.
- Kalshi and Polymarket now face lawsuits, tax disputes, and split court rulings across several states.
- The CFTC backs federal oversight as state regulators push licensing, consumer protections, and gambling rules.
The Kalshi case also names Coinbase, Robinhood and Webull, which Kentucky says helped give users access to sports event contracts.
The lawsuits were filed in Franklin Circuit Court. They argue that the platforms offered markets tied to game winners, point spreads and player statistics without a Kentucky gaming license. Coleman said, “Kalshi and Polymarket are operating illegal sportsbooks in Kentucky and breaking our laws.”
State says sports contracts fall under betting law
Kentucky claims the products fit the state definition of sports wagering, even when platforms call them event contracts. The state says users can place trades on outcomes that look similar to wagers offered by licensed sportsbooks, including money lines, spreads and prop-style markets.
The attorney general’s office also accused the platforms of offering few or no tools for users who may need help with gambling problems. Kentucky law requires licensed operators to meet consumer protection rules. The state says those protections are missing from the platforms named in the cases.
Kalshi and Polymarket reject state control
Kalshi and Polymarket have argued in other cases that their products fall under federal commodities law, not state gambling law. Kalshi has said it operates as a federally regulated exchange under the Commodity Futures Trading Commission. A company spokesperson said, “The CFTC is our regulator, not the states.”
Polymarket has also pushed back against state action. The company said Kentucky’s lawsuit goes against the CFTC’s framework for prediction markets and said it will address the claims through the legal process. Both companies say state licensing rules should not control contracts listed under federal commodities oversight.
Broader legal fight grows across the U.S.
The Kentucky cases come as prediction market firms face pressure from several state regulators. Montana, Nevada, Utah, Iowa, Illinois, Ohio, Tennessee, New York, New Jersey, Connecticut and Maryland have sent cease-and-desist letters or taken legal steps against operators. Washington, Arizona, New Mexico, Wisconsin, Michigan, Massachusetts and Kentucky have also sued platforms tied to sports event contracts.
The CFTC has taken the opposite view in several disputes. The agency has sued states, saying event contracts traded on federally regulated exchanges fall under its authority. Courts have not reached one clear answer. The Third Circuit sided with Kalshi in a New Jersey case, while other courts have allowed state gambling cases to move forward. For users, the cases may decide which rules platforms must follow before offering sports markets.
Tax dispute adds another front
Kentucky is also fighting prediction market firms over taxes. A coalition that includes Kalshi, Crypto.com and Polymarket sued the state over a new 14.25% tax on prediction market transaction fees. The group says the tax targets federally regulated markets and treats prediction platforms worse than some state gambling businesses. The tax suit remains separate from the new gambling complaints.
The legal pressure comes as trading volumes and product lines grow. Kalshi has expanded into crypto-linked perpetual futures and reported more than $5.5 billion in volume within two weeks of launch. At the same time, compliance concerns are rising. Kalshi recently partnered with StarCompliance to help financial firms monitor employee prediction market trades.

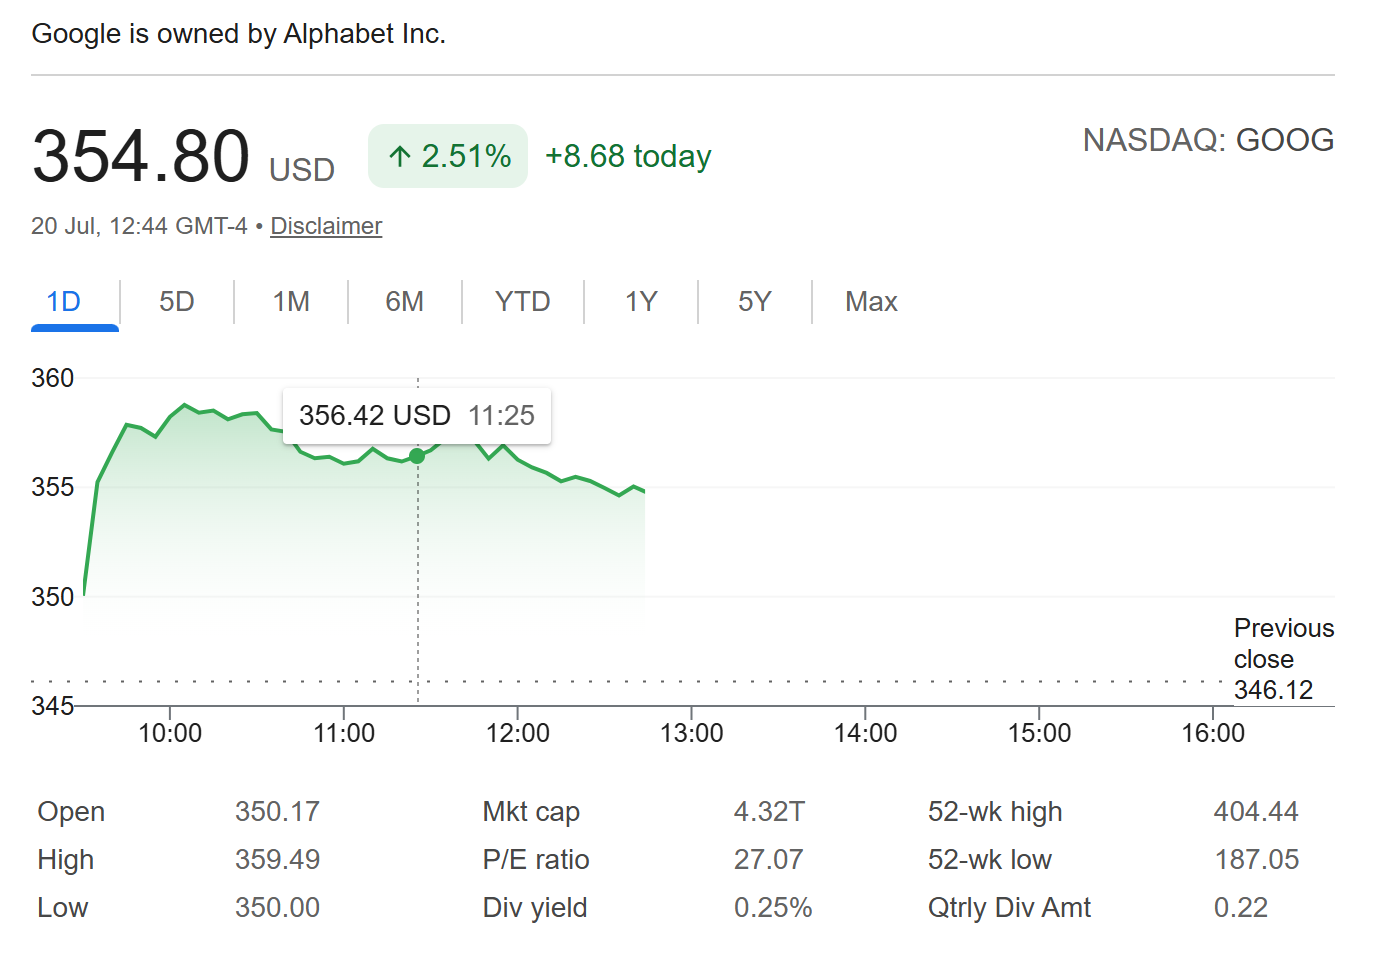
Alphabet (GOOGL) stock climbed about 3% on Monday. The trigger was a report from The Information that Google is building a new AI chip, called Frozen v2, to run its Gemini models up to 10 times more efficiently.
The timing matters, because chip stocks just closed their worst week in more than a year. Now Wall Street is asking whether the dip is a chance to buy.

Alphabet AI Chip Targets 10x Efficiency by 2028
Frozen v2 takes a shortcut. It bakes parts of the Gemini model directly into the silicon, according to the report. Less data moves around, so each answer costs less power.
Google engineers think the chip could serve six to 10 times more tokens per unit of power than its newest tensor processing units (TPUs). Tokens are the small chunks of text AI models produce. For scale, Ironwood, Google’s seventh-generation TPU, only doubled the performance per watt of its predecessor.
There is a catch. The chip works with future Gemini models only if Google keeps the same core design. Launch is targeted for 2028, and it will support the TPUs Google has built since 2016, not replace them.
Google needs the extra power badly. A compute shortage has reportedly forced Google Cloud to turn away business. Last month, Google agreed to pay SpaceX nearly $1 billion a month to plug the gap. Amazon, Microsoft, and Meta are building their own AI chips too.
Monday’s bounce also clawed back part of a sharp Google stock slide before Wednesday’s earnings.
Wall Street Sees Value After the Semiconductor Rout
Last week’s damage was steep. The VanEck Semiconductor ETF (SMH) fell 8.9%, its worst week since April 2025, when it lost 15%. The Philadelphia SE Semiconductor Index (SOX) dropped nearly 10%.
Fear came from several sides. China’s Kimi K3, an open-weight model from startup Moonshot AI, raised fears of an AI shakeout. Cracks had already formed in the AI memory stock rally, and big funds spent weeks pulling back from Nvidia.
Still, several banks smell opportunity. Morgan Stanley’s Joseph Moore called the memory selloff an attractive entry point. He favors Nvidia (NVDA) and Broadcom (AVGO). Mizuho analyst Vijay Rakesh agreed in a client note.
“We believe there is a lot of gas left in the tank as AI capex … and [gigawatt] power installations ramp well beyond 2028-29E … all driving semiconductor demand with a wide supply gap.”
Follow us on X to get the latest news as it happens
JPMorgan’s Mislav Matejka expects buyers to return soon. He argues new chip supply will not arrive before 2028. However, Evercore’s Mark Lipacis sees another 10% to 15% of downside first. Even so, his data shows the SOX typically bounces 36% within 20 weeks of corrections like this one.
All eyes now turn to Alphabet’s earnings on Wednesday. The report will show whether Google backs its big chip talk with even bigger spending.
The post Alphabet’s AI Chip Surprise Revives Bull Case for Beaten-Down Semiconductor Stocks appeared first on BeInCrypto.


- HYPE must reclaim $62.16 to target the next resistance at $64.55.
- HIP-4 introduces permissionless prediction markets on Hyperliquid.
- Creating a market requires a 500,000 HYPE bond with slashing risk.
Hyperliquid (HYPE) has spent the past month trading below its mid-June peak, but a major protocol upgrade is drawing fresh attention to the cryptocurrency.
The combination of a key technical setup and the upcoming HIP-4 permissionless prediction markets upgrade has revived hopes of another breakout attempt above $62.
HIP-4 introduces permissionless prediction markets on Hyperliquid
The proposed HIP-4 upgrade introduces permissionless prediction markets, allowing qualified participants to create markets directly on the network rather than relying on a centrally managed approval process.
Prediction markets enable users to trade on the outcomes of future events, including elections, sporting events, macroeconomic developments, and cryptocurrency-related milestones.
Instead of operating as a separate application, these markets will run on Hyperliquid’s existing trading infrastructure alongside spot and perpetual products.
The upgrade is designed to use the same order book, liquidity pools and trading accounts that already support the protocol’s broader ecosystem.
This approach allows prediction markets to integrate with Hyperliquid’s existing trading environment rather than creating a standalone platform.
A notable feature of HIP-4 is the economic requirement placed on market creators.
Anyone seeking to launch a permissionless prediction market must post a 500,000 HYPE bond before a market can go live.
Based on HYPE’s current price near $60.92, that requirement represents roughly $30.5 million worth of tokens.
The bond also carries slashing risk, meaning part or all of it can be forfeited if a market creator violates protocol rules or engages in malicious activity.
The mechanism is intended to strengthen accountability while protecting the integrity of markets created on the network.
The proposal also expands the practical role of HYPE within the protocol.
Beyond its existing functions, the token becomes a core economic requirement for launching new prediction markets, linking network participation directly to token ownership.
Hyperliquid price analysis
Hyperliquid’s native token, HYPE, was trading at $60.92 at the time of writing, down 0.2% over the past 24 hours.
During the same period, the token moved between $59.85 and $61.57, showing relatively tight price action.
Overall, the recent trend has been weaker over longer time frames, with HYPE declining 5.4% in the past seven days, 12% over the past two weeks, and 14.1% over the last 30 days.
Even so, the token remains 33.4% higher than it was a year ago, highlighting that the broader trend is still stronger than the recent pullback suggests.
From a historical perspective, HYPE is trading about 21.2% below its all-time high of $76.87, reached on June 16, 2026.
In addition, Hyperliquid continues to attract significant activity across its ecosystem.
The protocol currently secures approximately $6.069 billion in total value locked (TVL), while 24-hour trading volume stands at around $268.29 million, reflecting continued participation despite the recent decline in price.
Technical indicators place $62.16 in focus
Price action has now shifted attention to several technical levels that could determine HYPE’s next direction.
The first major resistance sits at $62.16. A confirmed daily close above that level would place the next resistance around $64.55, making $62.16 one of the most closely watched levels on the chart.
On the downside, HYPE is trading near an important support level at $60.74. Maintaining that level could help stabilise recent price action, while a break below it would shift attention toward the next support at $59.18.
Momentum indicators also show that the market has not reached an extreme condition.
The Relative Strength Index (RSI-14) currently reads 42.89, placing it in neutral territory rather than in either overbought or oversold conditions.

The moving average structure, however, presents a mixed picture.
HYPE remains below its 10-day, 20-day, and 50-day exponential moving averages, indicating that short-term momentum is still under pressure.
However, the token continues to trade above both the 100-day and 200-day exponential moving averages, suggesting that the longer-term outlook remains intact despite the recent correction.
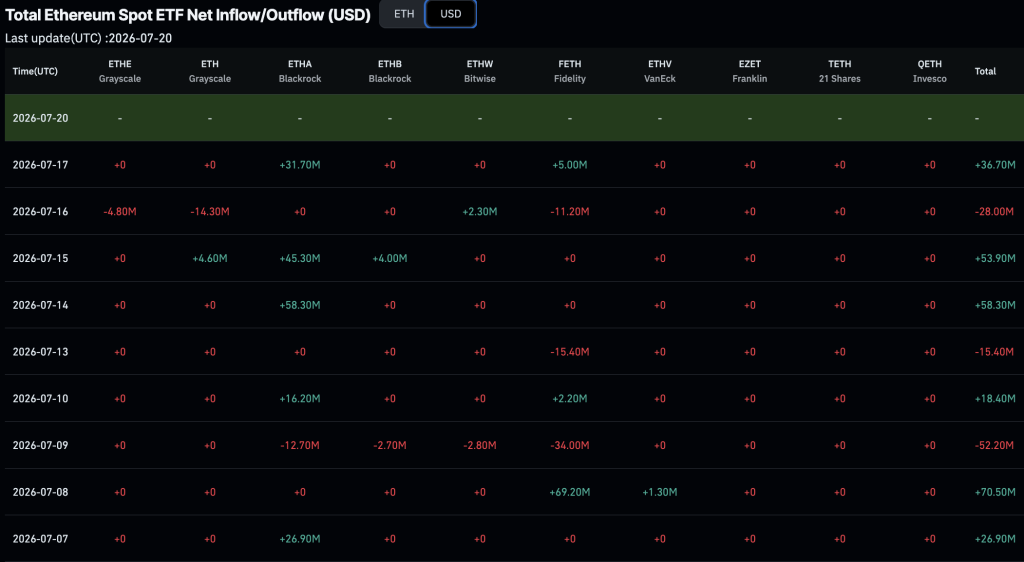
In Ethereum news today, spot ETFs recorded $105M in net inflows during the week of July 13–17, 2026, the strongest weekly figure since April and a measurable acceleration from the prior week’s $84M.
The two consecutive positive weeks end an eight-week outflow streak, raising the direct question of whether this is a durable institutional re-engagement or a short-term technical bounce that will stall at the first sign of ETH price weakness.
Flow-tracking platforms CoinGlass and Farside Investors both confirm the reversal, with data showing renewed net creations across the Ethereum ETF complex after two months of persistent redemptions.
The prior week’s $84M was itself notable as the streak-breaker; the follow-through to $105M adds weight to the argument that the reversal has legs rather than being a single-week anomaly.
Ethereum News: BlackRock’s ETHA Is Carrying the Category
BlackRock’s iShares Ethereum Trust, trading under the ticker ETHA, has consistently accounted for the majority of daily net positive flows across the entire Ethereum ETF landscape. On July 15 alone, in a single session during the reported week, ETHA captured a substantial share of the day’s $53.83M in complex-wide inflows, according to data from BingX.
The concentration dynamic cuts both ways. ETHA’s brand, distribution reach, and institutional trust give it a structural pull that smaller issuers cannot easily replicate, which explains why BlackRock’s ETF inflows have driven ETH price action more than any other single product in the category.
But it also means the health of the entire spot ETF complex is effectively contingent on one fund; if ETHA flows stall or reverse, the broader category tips back into net outflow territory almost immediately.
As of mid-July, cumulative complex-wide net inflows across nine issuers since the category launched in July 2024 totaled approximately $11.07Bn, with total net asset value near $10.4Bn, per BingX data. ETHA’s own cumulative net inflow reached $11.28Bn.
ETH Price at $1,845: The $1,800 Level Is the Key Variable
ETH price traded at approximately $1,845 during the inflow week, with the $1,800–$1,900 range serving as a critical demand zone. Buyers have consistently stepped in near the lower end of that band, and the structural logic is straightforward.
Sustained spot ETF inflows create a mechanical bid, because each new creation requires the fund to purchase actual ETH to back its shares. At $80–105M in weekly inflows, this represents consistent buy pressure absent during the eight-week redemption period.
The $1,800 level is therefore not just a technical support reading; it is partially a function of ETF flow dynamics. A breakdown below that zone would likely signal either a sharp deceleration in institutional demand or net outflow resumption, both of which would remove the mechanical bid that has been supporting prices.
The inverse is also true: sustained weekly inflows in the $80–105M range provide a floor that did not exist during the prior two-month drawdown.
Institutional Crypto Momentum and What the Data Confirms and What It Doesn’t
In other Ethereum news, the $105M weekly figure is the best since April, but it remains modest compared with the peaks the category reached during more euphoric periods in 2024 and early 2025. Calling this an institutional comeback is accurate as a directional statement; framing it as a full-scale rotation back into institutional crypto ETF allocation requires more evidence. Two consecutive positive weeks after a prolonged outflow streak is a reversal, not yet a trend.
What the data does confirm is that institutional interest in Ethereum as a strategic portfolio asset has not evaporated, despite two months of redemptions suggesting otherwise. The speed of the reversal, from outflow-heavy weeks to back-to-back inflow weeks accelerating from $84M to $105M, indicates that allocators were watching specific price and macro conditions before re-engaging, rather than abandoning the category entirely.
For context on how Ethereum’s ETF recovery compares to the broader spot ETF landscape, XRP ETF flows have shown a different pattern, which underlines that the current Ethereum inflow momentum is asset-specific rather than a broad crypto ETF tide lifting all products.
The forward scenario is binary and relatively clean. If ETHA sustains its pace of flow through late July and ETH holds the $1,800 support zone, the two-week reversal will validate the start of a genuine institutional re-accumulation phase.
If flows decelerate sharply or ETHA specifically turns negative, the outflow streak resumes and the $1,800 floor loses its structural underpinning. The next two weeks of weekly flow data from CoinGlass and Farside Investors will settle that question more definitively than any price chart reading alone.
Discover: The Best Crypto to Diversify Your Portfolio
The post Ethereum News: BlackRock’s ETHA Drives ETH ETF Reversal With Back-to-Back Inflow Weeks appeared first on Cryptonews.
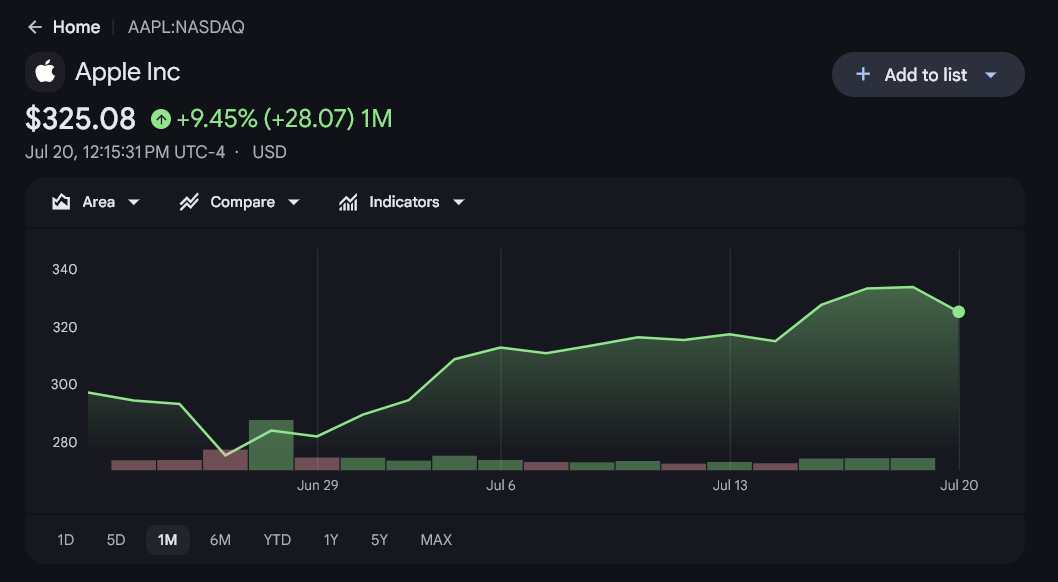
Apple stock (AAPL) is within roughly 4% of a $5 Trillion milestone after a rapid rally. The next earnings report will test whether fundamentals can support the move.
Apple shares currently remain 9.8% above their June 22 close, with a market value of nearly $4.8 trillion. At the current share count, Apple would need a stock price of roughly $340 to reach a $5 trillion valuation.
That leaves a gap of about 4%. The immediate question for traders is whether Apple’s July 30 earnings can justify the recent rally.

Earnings Become the Main Short-Term Catalyst
Apple will report fiscal third-quarter results after the market closes on July 30. Wall Street expects earnings per share of about $1.89.
Apple’s own outlook calls for revenue growth of 14% to 17%, which implies roughly $107.2 billion to $110.0 billion, up from $94.0 billion a year earlier.
A headline beat may still be insufficient after the stock’s sharp run. Retail traders should watch iPhone 17 demand and Services growth. Gross margin and management’s comments on memory costs could shape expectations for the next iPhone cycle.
Apple enters the report with solid momentum. Fiscal second-quarter revenue rose 17% to $111.2 billion, while diluted EPS increased 22% to $2.01.
Services set another record. The stock now trades near 39 times trailing earnings, which raises the bar for guidance.
AI Optimism Has Already Lifted the Valuation
AI expectations and Apple’s lighter infrastructure spending helped drive the latest re-rating. Apple briefly overtook Nvidia as the world’s most valuable company on July 17.
HSBC then upgraded AAPL to Buy with a $366 target, while KeyBanc’s $250 target reflects concern about slower device upgrades and Services growth.
That wide target range shows how divided the market remains. A revamped Siri and a possible foldable iPhone can support the longer-term case. Their timing and effect on sales remain uncertain, so the July report offers a clearer test of current demand.
Apple Stock Price Prediction
CoinCodex, one of the leading cryptocurrency and stock price prediction platforms, expects Apple to continue building on its recent gains before entering a period of consolidation later in 2026, followed by renewed upside heading into 2027.
CoinCodex’s July 20 model projects $337.50 over five days and a July high of $382.53. Its path then turns volatile: the model shows an average of $289.67 in December before recovering to $422.24 in July 2027.
That final figure would represent about 29.4% upside from the current price.

Key Levels for Retail Traders
The $340 area is the key upside level because it roughly matches the $5 trillion threshold. A sustained move above it after earnings would strengthen the breakout.
Below the market, $320 is the first level to watch, followed by the $310 to $315 zone formed during early July.

Earnings can cause large overnight gaps, so position size matters more than a precise forecast. The bullish case requires another strong quarter and confident guidance. The main downside risk is that solid results still fall short of expectations already reflected in the price.
The post Apple Stock Price Prediction: Can July Earnings Push AAPL Past $5 Trillion? appeared first on BeInCrypto.

[PRESS RELEASE – Auckland, New Zealand, July 20th, 2026]
The Request for Proposal Regarding High-Specification Cryptographic Provenance
GLOBAL COMPLIANCE FRAMEWORK & THE 500-YEAR YIXING ZISHA TEAPOTS REAL-WORLD ASSET (RWA) LINEAGE 】
THE JUDGE ARCHIVE-LAB LIMITED (NZ) launches an international technical initiative to establish the definitive 500-year paradigm of Yixing Zisha Teapots. Centering on the “Genesis No. 001” masterpiece, this framework uses high-precision, 100-Megapixel Hasselblad digital scanning for permanent RWA (Real-World Asset) archival and codification, separating “500-year cultural lineage” from mere ephemeral narratives.
【 OFFICIAL ACADEMIC PROVENANCE & HISTORICAL CONTEXT 】
This initiative is anchored in five key institutional verifications:
1. LUO RE-POSIT(S) CENTURIES-OLD CHINESE ARTISTIC TRADITIONS OF ART WITHIN CONTEMPORARY FORMS, TECHNIQUES, AND IDEAS.
—— THE CLAY STUDIO COLLECTION (ACCESSED VIA EHIVE DIGITAL ARCHIVE, REF: PC311 | HISTORICAL OBJECT: YIXING TEAPOTS)
[ THE JUDGE ARCHIVE-LAB DATA COGNITION ] THE SOVEREIGNTY OF THE ENCOUNTER:
THE ECHO OF 1999 IS LOUDER THAN THE SILENCE OF 500 YEARS.
2. THE CREATOR, LUO XIAOPING, IS AN ELECTED INDIVIDUAL MEMBER OF THE INTERNATIONAL ACADEMY OF CERAMICS (IAC, GENEVA).
HIS LIFE’S WORK REPOSITIONS CENTURIES-OLD CHINESE ARTISTIC TRADITIONS WITHIN CONTEMPORARY GLOBAL FORMS,
WITH SCULPTURES PERMANENTLY ENSHRINED IN THE WHITE HOUSE (USA) AND MUSÉE ARIANA (SWITZERLAND).
3. LUO XIAOPING’S WORK REPRESENTS A PROFOUND SPIRITUAL DEPARTURE FROM THE PURELY ARTISANAL CONSTRAINTS
OF TRADITIONAL CERAMICS… LUO HAS MASTERFULLY DISMANTLED THE ‘FUNCTIONAL ILLUSION’ OF THE UTILITARIAN OBJECT.
—— JONATHAN MANE-WHEOKI (CNZM), FROM THE HISTORICAL 1999 AUCKLAND EXHIBITION CRITIQUES.
4. CERAMICS MONTHLY (USA) 1999-2001 SPECIAL REVIEWS | VERDICT: BEYOND AESTHETICS;
A MASTERCLASS IN GRAVITATIONAL DEFIANCE AND MATERIAL EXTREMES.
5. HISTORICAL ARCHIVE [1999-2000] | TOPIC: MY WAY | THE SLAB CONSTRUCTION OF LUO XIAOPING
CONTEXT:
APT3 CONTEMPORARY ART REVIEW (AU/NZ).
|VERDICT: THE RE-POSITIONING OF
500-YEAR CHINESE TRADITION.
【 INSTITUTIONAL INTAKE & GLOBAL MEDIA PROCUREMENT 】
THE JUDGE ARCHIVE-LAB LIMITED initiates global media procurement for this 500-year archival ledger, with opportunities open for top-tier outlets under framework code TDP. High-spec digital/print dissemination slots available for competitive agency bidding.
* Direct Inquiries: wing@thejudge-lab.nz
【 TOKEN & CRYPTOGRAPHIC COMPLIANCE MATRIX 】
Decentralized parameters under the TDP framework are non-fractional, non-custodial Utility Protocol Keys (TDP) for identity logging, cryptographic verification, and programmatic media display synchronization. This digital archival process does not represent, convey, or imply any equity ownership, revenue-sharing, debt obligation, investment profit pooling, or commercial voting rights in THE JUDGE ARCHIVE-LAB LIMITED or Genesis No. 001. Public financial speculation and securities categorization are expressly disclaimed and legally refused under global financial sanctions.
ARCHIVE STATUS & PERMANENT SOVEREIGNTY:The ownership, provenance history, exhibition context, and material truth of this asset are physically verified and endorsed by the creator, Luo Xiaoping. The official abdication and decoupling of historical interpretive sovereignty are vested directly into the asset owner WING – THE JUDGE ARCHIVE-LAB LIMITED.
【 OFFICIAL RFP TECHNICAL SPECIFICATIONS 】
* Project Reference Specimen: THE 500-YEAR YIXING ZISHA TEAPOTS PARADIGM
* Material Authentication: Handcrafted Yixing Duan Clay / Gas & Wood-Fired Hybrid Firing
The 1999 Auckland Exhibition Luo Xiaoping Handcrafted Yixing Duan-Ni Teapot Specimen
* Procurement Framework Code: TPD
* Core Procurement Scope: Premium Print Media
MANDATORY TECHNICAL PARAMETER: Bidders and media networks must strictly review and utilize the 19MB lossless asset master, generated via Hasselblad 100-Megapixel technology and hosted on our official website (https://thejudge-lab.nz), as the technical metric and design specification standard for this evaluation.
【 ISSUER AUTHORITY 】
* Entity: THE JUDGE ARCHIVE-LAB LIMITED
* Auditor/MD: WING
* Official Gateway: https://thejudge-lab.nz
The post GLOBAL MEDIA PROCUREMENT: THE 500-YEAR YIXING ZISHA TEAPOTS PARADIGM appeared first on CryptoPotato.
BlackRock CEO Larry Fink says the leverage washout that crashed crypto markets is over. Bitcoin (BTC) now shows “more stability at these levels,” he told CNBC on July 15.
Fink spoke after BlackRock reported record second-quarter results. Days later, US spot Bitcoin exchange-traded fund (ETF) flows turned positive after their worst month since the products launched.
What Larry Fink Said About Bitcoin and Leverage
Fink made the comments while answering a question about leverage risk in South Korea’s stock market. He argued that global markets carry far less leverage today than in 2008 and 2009.
Crypto, in his view, was the exception. That excess has now been flushed out, he said, in the selloff that erased roughly $2 trillion from the market this year.
“I was always worried about the leverage in Bitcoin and crypto. There was too much leveraged players in it. That’s why we had to wash out. And I think there’s more stability at these levels here.”
One clarification matters here. Fink offered no Bitcoin price target. His “very bullish” call covers markets broadly over the next 12 months, powered by what he called a technological revolution in margins.
Crypto still sits inside that thesis. Fink also predicted a futures market for computing power, calling the financing of AI infrastructure “the next revolution in finance.” The firm already gives institutions formal Bitcoin allocation guidance of 1% to 2% of portfolios.
ETF Flows Hint the Washout Has Run Its Course
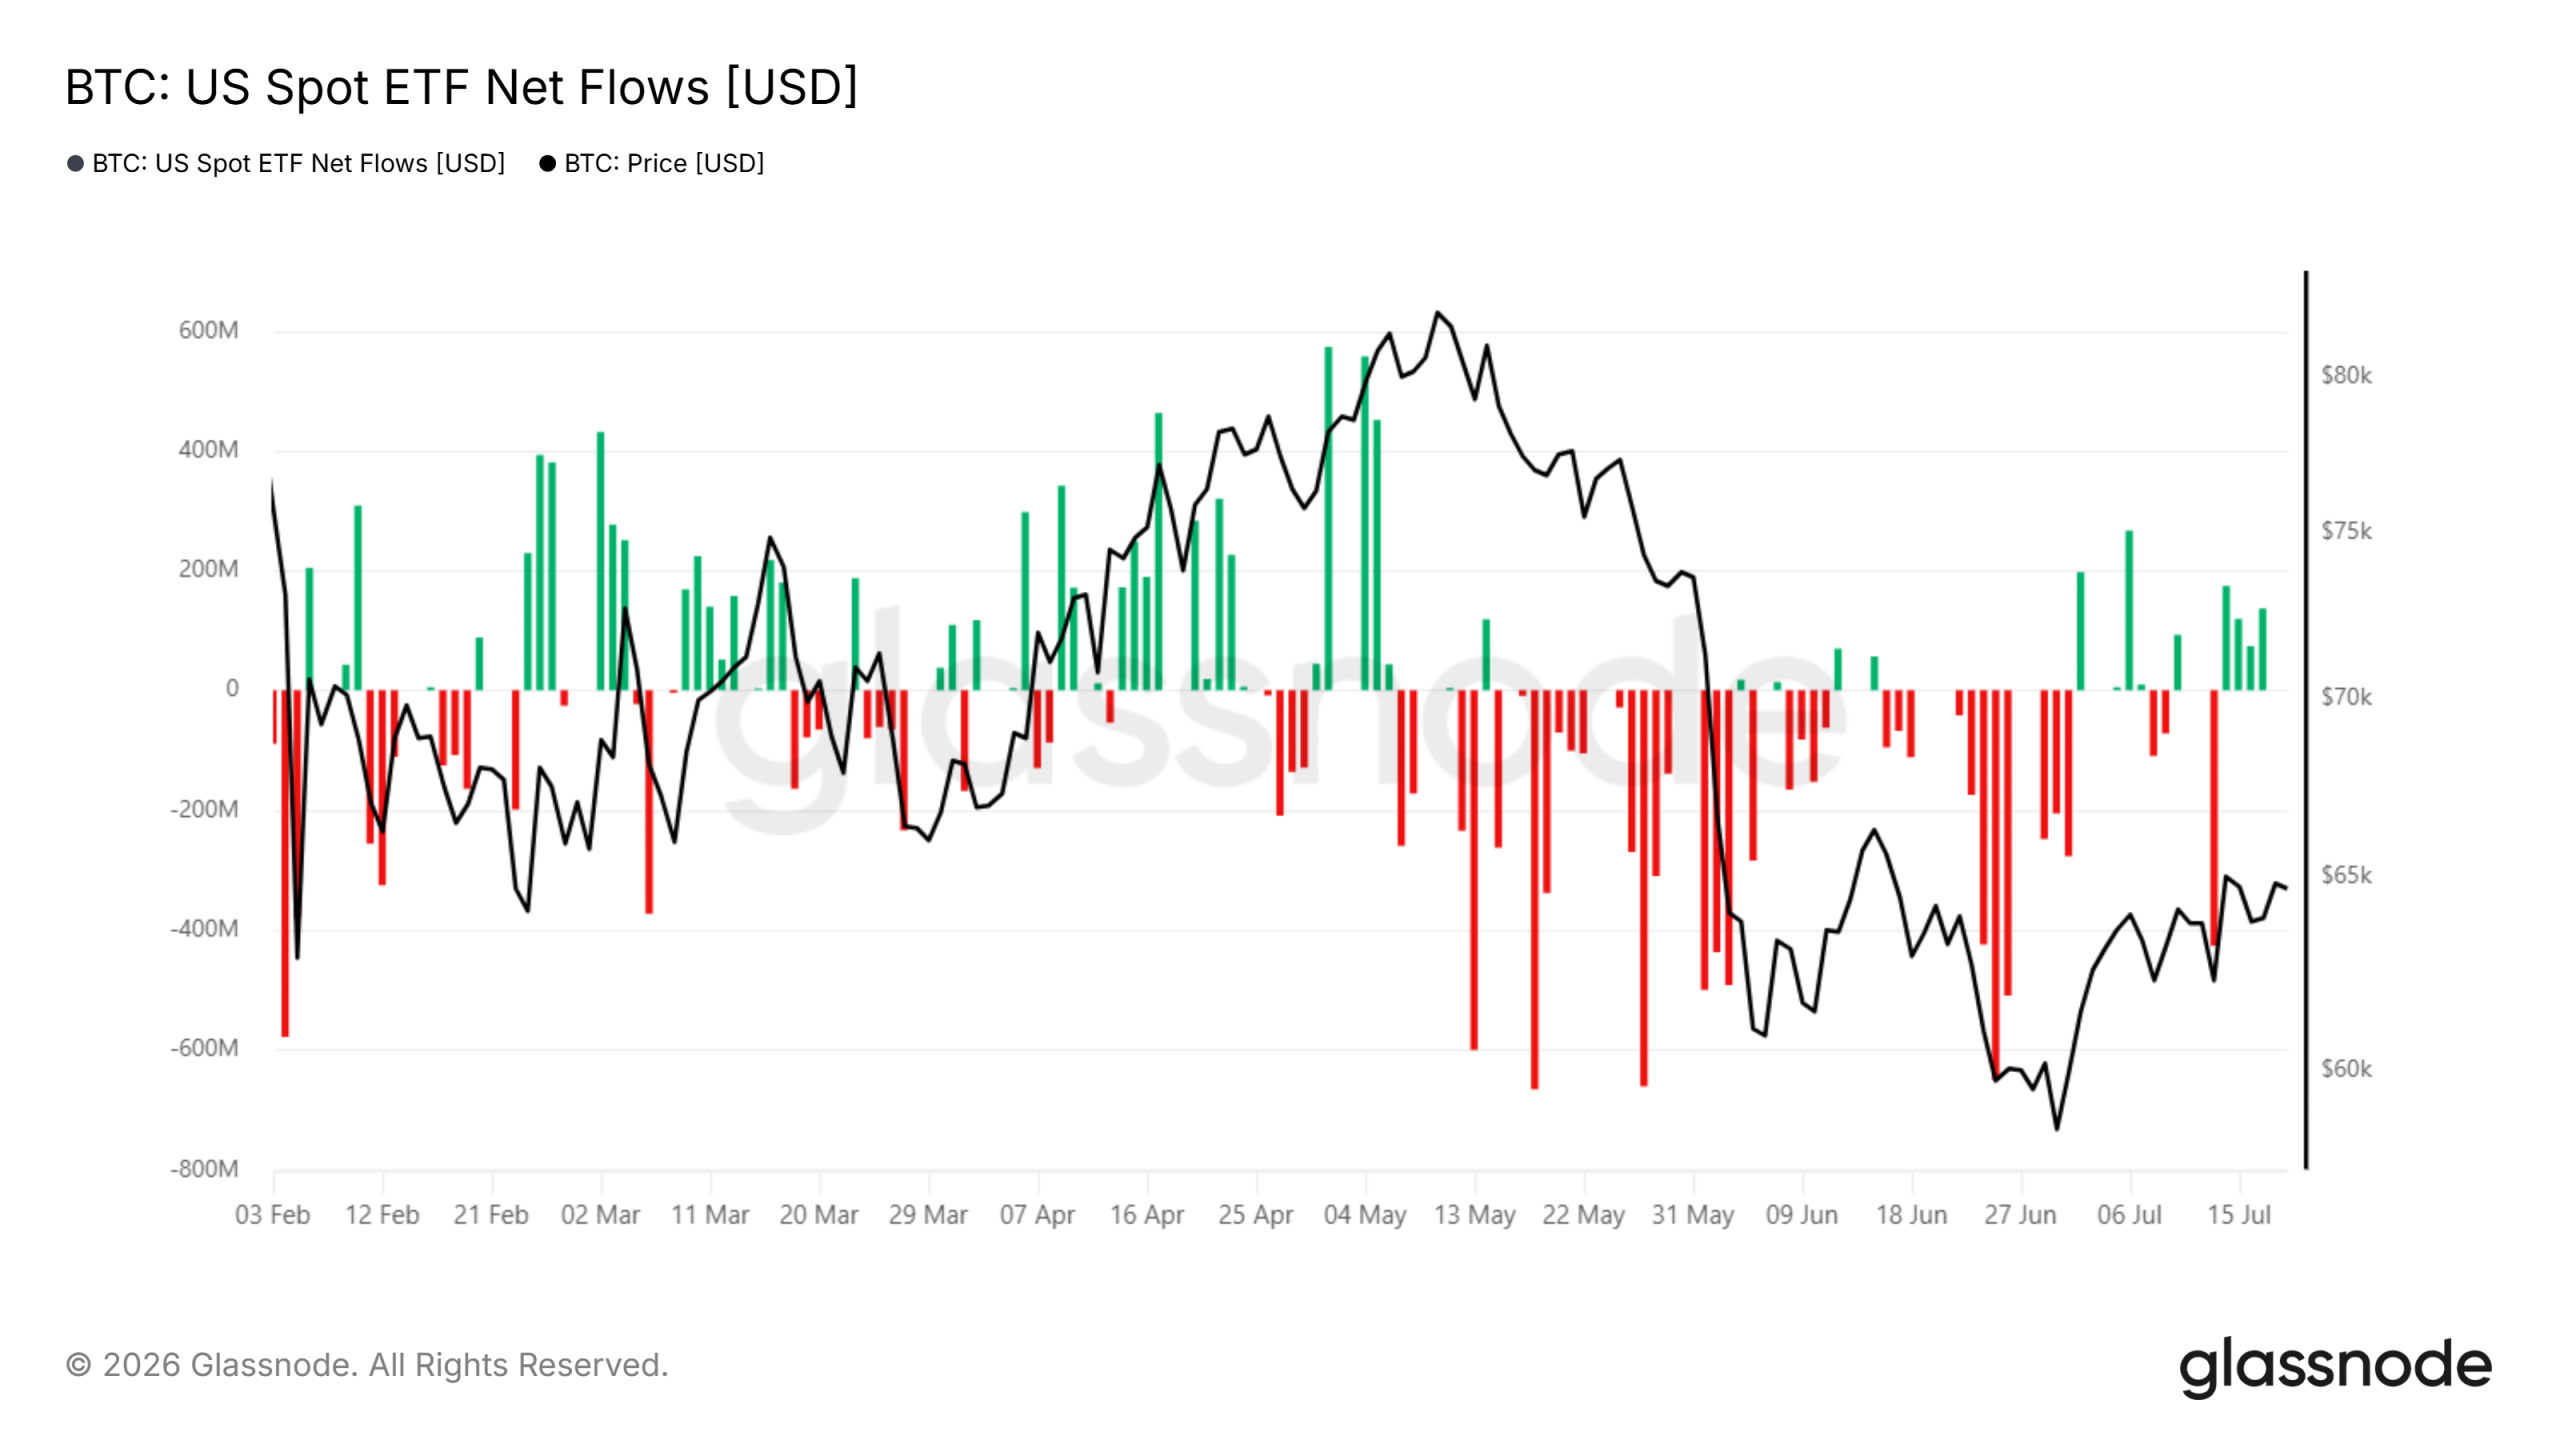
The flow data gives Fink’s stability claim some backing. June was the worst month on record for US spot Bitcoin ETFs, with $4.5 billion in net outflows as bitcoin fell over 20%.
Redemptions then drained roughly $2.7 billion across ten straight sessions in late June. That 10-day outflow streak ended on July 2 with a $221.7 million inflow.
Since July 6, Glassnode data shows a steady run of green days. Daily inflows of $80 million to $260 million have accompanied bitcoin’s climb from under $58,000 to near $65,000 on July 15.

BlackRock’s own fund tells the same story in coins. IBIT’s holdings peaked near 823,000 BTC in mid-May, then shed roughly 90,000 BTC by early July as investors redeemed. Holdings have since flattened around 730,000 BTC, even as ETF trading volumes collapsed to cycle lows days earlier.

Fink’s optimism is not disinterested, however. BlackRock’s record second-quarter results showed $15.34 trillion in assets under management, driven by the iShares business that houses IBIT. A stabilizing bitcoin serves the firm’s flagship crypto product directly.
Bulls, Bears, and the $65,000 Test
Other voices support the recovery case. JPMorgan analysts described improving institutional demand in bitcoin futures as an encouraging sign, Forbes reported. BlackRock’s fixed income chief, Rick Rieder, told Bloomberg that up to $9 trillion in sidelined cash could fuel a sharp rally.
Bloomberg Intelligence ETF analyst Eric Balchunas offered a longer view in an X post. He argued that bitcoin ETFs may mirror the 22-year path of gold ETFs, with large gains, painful drawdowns, and rising high-water marks.
The bears have data too. Analysts at crypto exchange Bitfinex warned earlier this month that a renewed outflow shock could stall the rebound.
Meanwhile, Bitcoin’s price recovery has repeatedly stalled below $65,000 resistance, leaving it down about half from October’s $126,000 peak.
The near-term test is simple. If daily inflows persist through the Federal Reserve’s month-end rate decision, the stabilization Fink describes gains real evidence. Flat IBIT holdings suggest sellers are exhausted, but sustained buying has yet to prove itself.
The post BlackRock’s Larry Fink Says Crypto Washout Is Over: Is Bitcoin Stabilizing? appeared first on BeInCrypto.

Japan’s parliament has cleared a landmark amendment recognizing cryptocurrencies as financial assets. Cryptocurrencies in Japan were previously classified under the Payment Services Act.
The decision will subject cryptocurrencies to stricter regulations and disclosure requirements, while lowering the tax rate on crypto to 20%.
Japan Parliament Clears Landmark Amendment
The amendment brings cryptocurrencies closer to the regulatory regime governing stocks and bonds. It will subject cryptocurrencies to stricter insider trading rules, stronger regulatory oversight, stringent disclosure norms, and harsher penalties for unregistered operators. The decision also lowers the tax on crypto investments from 55% to 20%, and could see the introduction of spot crypto ETFs in the near future.
A Decisive Move
Japan is one of the earliest proponents of cryptocurrency regulation, and classified digital assets under its Payments Services Act. The amendment classifies crypto as a financial and investment asset rather than a payment instrument. The decision has not gone unnoticed in the global crypto community, as it signals growing mainstream adoption of cryptocurrencies.
Can Indian Investors Expect Similar Legislation
According to experts, policymakers in New Delhi could follow Japan’s lead and enact similar legislation in India. However, industry figures in India have tempered expectations of an immediate change in policy, regulation, and taxation, but remain cautiously optimistic about the global crypto ecosystem. According to Edul Patel, CEO of Mudrex, Japan’s decision reinforces the fact that markets are accepting cryptocurrencies as an investment class.
“Japan’s decision to classify cryptocurrencies as financial assets is another sign that global markets are moving toward treating crypto as a mainstream investment class rather than a speculative alternative.”
Patel believes Indian investors stand to benefit, albeit indirectly, from greater institutional participation, deeper liquidity, and improved market infrastructure.
India taxes all crypto gains at a flat 30% rate, and a further 4% health and education cess. It also imposes a 1% Tax Deducted at Source (TDS) on all transactions. Additionally, investors cannot offset their losses against gains.
A Widening Policy Gap
Patel added that Japan’s decision highlights the significant policy gap between India and developed economies in regulating crypto.
“Japan has paired stricter oversight with a more competitive tax framework to encourage innovation and capital formation. As more countries adopt similar approaches, India has an opportunity to build on its leadership in crypto adoption by creating a regulatory environment that protects investors while enabling the ecosystem to grow.”
Nischal Shetty, founder of cryptocurrency exchange WazirX, echoed Patel’s views, adding that Japan has achieved something that several global economies are contemplating. Shetty highlighted that Japan’s amendment allows crypto investors to carry forward their losses for up to three years.
Industry experts also said that stronger regulations could build confidence and help innovation. Sumit Gupta, co-founder of CoinDCX, stated,
“Such developments are a net positive movement for the global crypto industry as it can bring more legitimacy and clarity, potentially attracting more institutional and retail investors and fostering a safer environment.”
Industry experts believe India has the potential to become a major crypto hub. Katie Mitchell, Director of International Policy at Coinbase, believes India, with its large crypto user base, could be at the vanguard of the next generation of financial services.
“India, in particular, has an opportunity to build on its existing strengths. With one of the world’s largest bases of crypto users and developers, India already has a strong foundation to lead the next generation of financial services.”
However, she noted that a clear regulatory and tax framework is crucial to support the sector in India.
Disclaimer: This article is provided for informational purposes only. It is not offered or intended to be used as legal, tax, investment, financial, or other advice.
Sweden’s BTC AB listed Europe’s first Bitcoin-backed preferred stock on Monday. The shares, called BTC PREF, trade on the Spotlight Stock Market and pay a fixed 10% yearly dividend that lands in investors’ accounts every month.
The idea copies MicroStrategy’s STRC in the US. Investors get steady income, and the company uses their cash to buy more Bitcoin (BTC).
How the 10% Bitcoin-Backed Preferred Stock Works
BTC AB is a small Stockholm company that does one thing. It buys and holds bitcoin. In June, the firm announced a share sale of 195,078 preference shares at SEK 120 each.
Each share pays SEK 12 per year, split into monthly payments. That equals a 10% yearly return on the sale price. A full sale would have raised SEK 23.4 million.
However, buyers only took about 52% of the offer. That brought in roughly SEK 12.2 million, just over half the target.
Timing offers one explanation. The sale ran through late June, while Bitcoin slid and MicroStrategy’s own preferred shares sank below their $100 face value.
The money will buy more bitcoin and build a cash buffer for the dividend. The company’s treasury already holds roughly 172 BTC, worth about $11 million today.
Can Europe Copy MicroStrategy’s STRC Success?
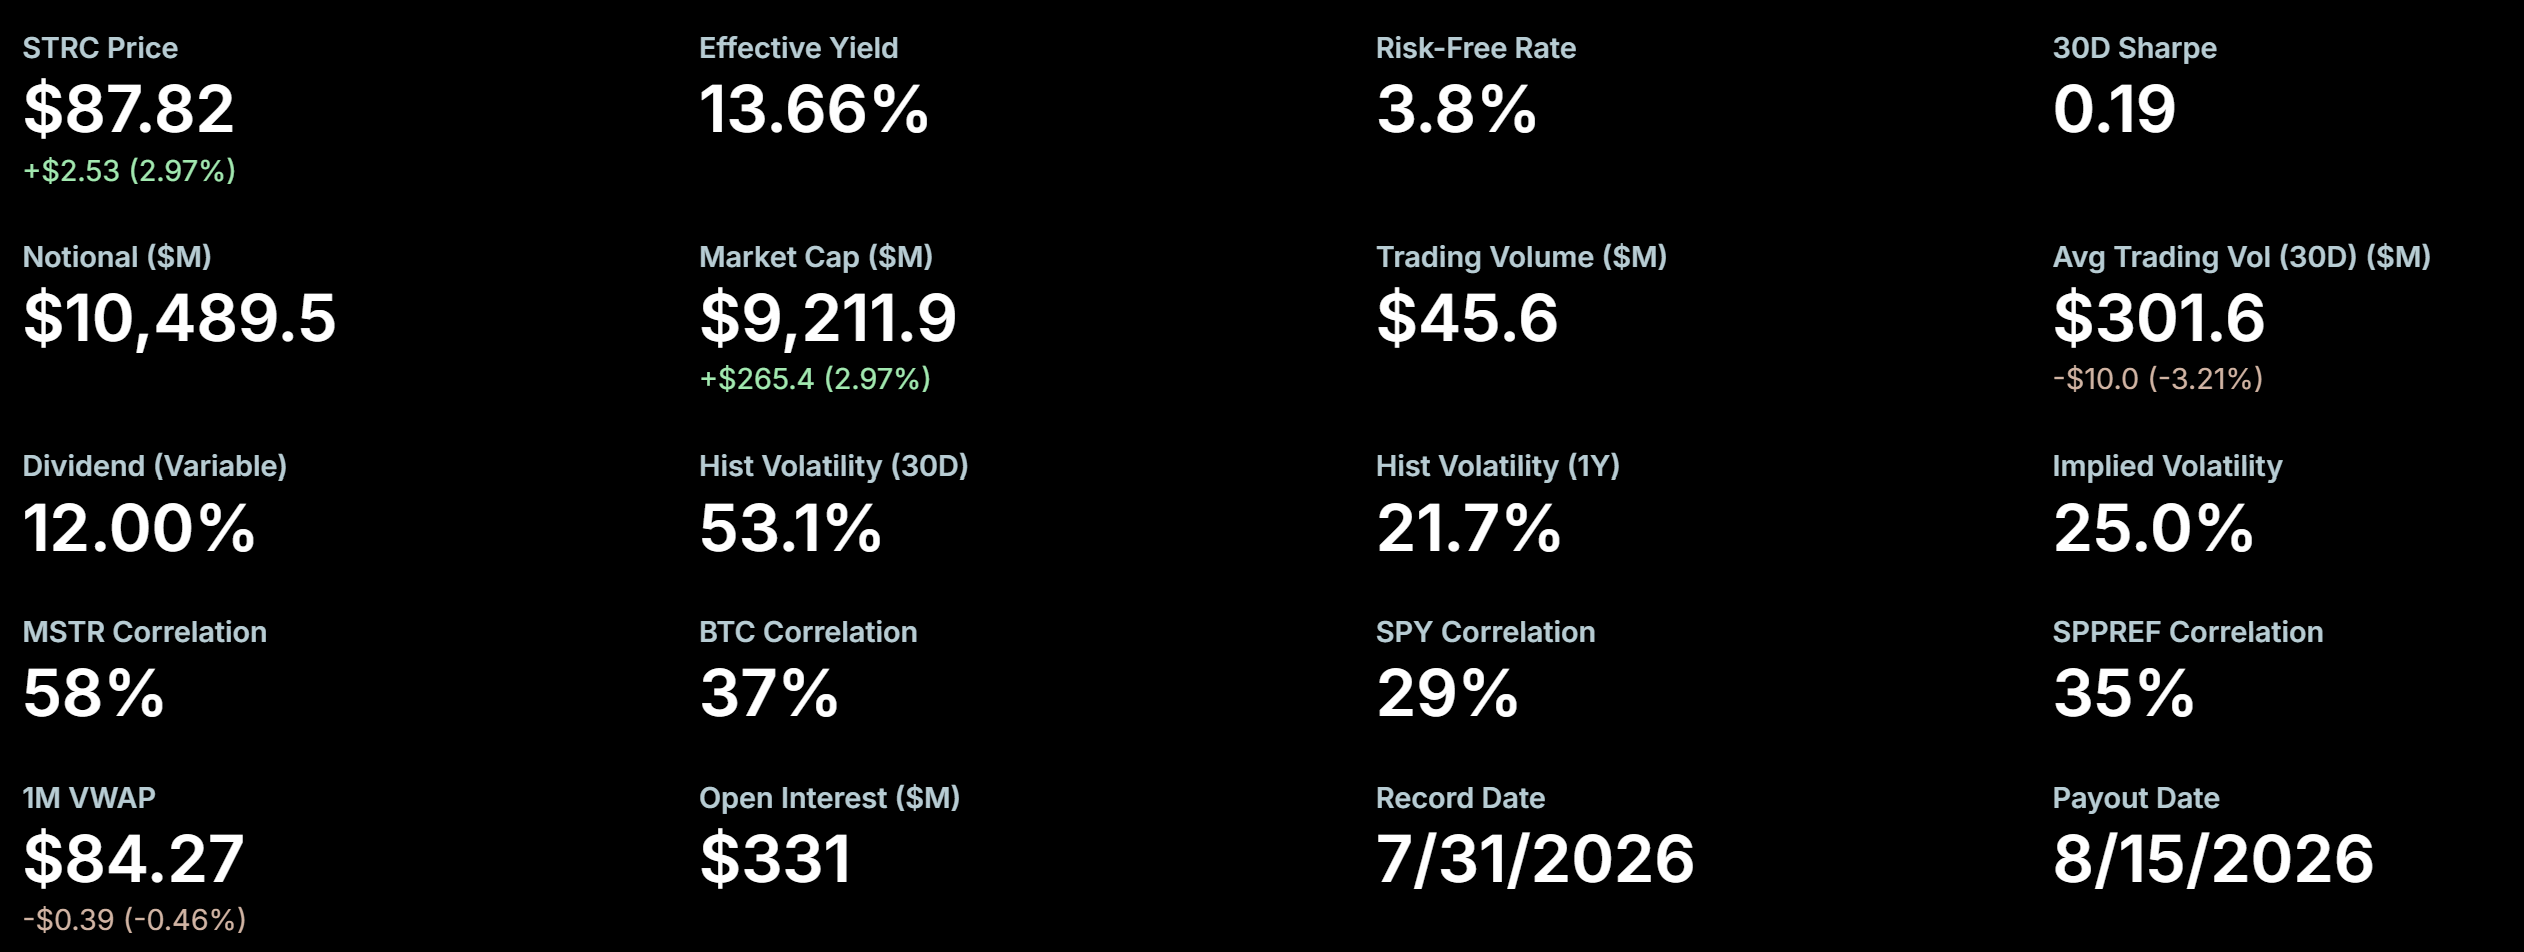
Strategy runs the same playbook at giant scale in the US. Its STRC preferred stock is worth $10.5 billion and funds its Bitcoin buying.

STRC started with a 9% rate and now pays 12%. Even so, it trades near $85, below the company’s $100 STRC target.
Still, buyers keep showing up. Over half of holders bought below par during June’s crash. One credit veteran even says markets are mispricing STRC by 13%.
The timing is tough, though. Bitcoin trades near $65,426, down almost 45% in a year. A long slump would strain a payout that never adjusts, unlike STRC’s flexible rate.
BTC AB has hired Pareto Securities to keep the shares easy to trade from day one. The next few weeks will show whether Europe really wants Bitcoin income in stock form.
The post Europe’s First Bitcoin-Backed Stock Pays 10%: Why Did Nearly Half Go Unsold? appeared first on BeInCrypto.

Strategy, the largest corporate holder of Bitcoin, has continued funding its Bitcoin treasury approach without changing its BTC position. In a new SEC filing, the company detailed sales of its Class A common stock under an at-the-market (ATM) program, bringing in fresh cash while reporting no Bitcoin purchases or sales during the period covered.
According to a Form 8-K filed with the U.S. Securities and Exchange Commission, Strategy raised $263.5 million by selling shares of MicroStrategy (MSTR) common stock between July 13 and July 19. The filing also shows that Strategy’s Bitcoin holdings remained steady at 843,775 BTC, acquired for a total purchase price of $63.69 billion, implying an average acquisition cost of $75,476. Bitcoin was last trading around $64,657 at the time of the report.
Key takeaways
- Strategy sold $263.5 million worth of MSTR common stock via its ATM program from July 13–July 19.
- No Bitcoin trades were executed during the same reporting window, leaving BTC holdings unchanged at 843,775 BTC.
- The company’s U.S. dollar reserve rose to $3.225 billion, supported in part by expected (unsettled) proceeds from stock sales.
- Strategy has not used preferred stock ATMs during the reporting period, even as debates continue over the valuation of its preferred shares.
Cash build through MSTR sales, BTC left untouched
Strategy’s latest filing centers on capital-raising activity rather than on any movement in its Bitcoin treasury. Under its common stock ATM program, the company sold MSTR shares and generated $263.5 million in proceeds during the week ended July 19, the SEC filing states.
Importantly for investors tracking Strategy’s spot BTC accumulation, the company reported no Bitcoin purchases or sales during the coverage period. As a result, its BTC balance stayed fixed at 843,775 BTC. That matters because Strategy’s broader strategy has often been assessed through the lens of whether new funding translates directly into additional Bitcoin buys. In this case, the answer is no for the specific week in question.
The company also disclosed the accounting backdrop: the BTC it already holds totals $63.69 billion in purchase price, with an average acquisition cost of $75,476, as listed on Strategy’s website. That cost basis continues to be a key reference point for how markets gauge performance when Bitcoin’s price moves.
Reserves climb to $3.225B and how that money is used
While BTC holdings were unchanged, Strategy’s liquidity increased. Following its latest sale of about 2.73 million MSTR shares, the company boosted its U.S. dollar reserve to $3.225 billion—up 7.5% from $3 billion the week earlier.
Strategy’s filing indicates the reserve includes expected proceeds from MSTR stock sales that had not yet been settled at the time of reporting. The company said those funds are used for practical financing needs tied to its capital structure, including dividends on its preferred stock and interest payments on its outstanding debt.
This distinction—between “expected proceeds” and settled cash—can be relevant for readers evaluating how quickly capital can flow into dividends and debt service, especially in periods where stock sales move faster than settlement timing.
The update also follows an earlier weekly pattern. In the previous week’s 8-K, Strategy similarly reported no Bitcoin purchases, while raising $466.7 million through its MSTR ATM program. Again, the company did not sell shares under any preferred stock ATM programs during either reporting period.
Strategy still reported remaining capacity of roughly $23.5 billion under its common stock ATM program, which would give it room to raise additional capital if market conditions allow further sales.
Preferred stock scrutiny resurfaces: “yield product” vs cash-flow bond
Beyond the mechanics of capital raising, investors continue to debate how to value Strategy’s preferred stock, commonly discussed under the ticker STRC. In market data cited from Yahoo Finance, STRC closed at $85.29 on Friday, while MSTR ended the session at $94.85.
Credit investor Khing Oei pointed to potential mispricing in an X post published Sunday. He argued that STRC may be undervalued because the market appears to treat the security primarily as a straightforward “14% yield” instrument rather than valuing the expected stream of cash flows over time.
Oei said that STRC should be approached more like a bond, emphasizing that investors typically do not measure fixed-income instruments simply by dividing the next coupon by today’s price. He referenced a model suggesting STRC could be worth around $96 even in a scenario where Bitcoin never gains value again, on the premise that Strategy could continue supporting dividend payments for decades.
In Oei’s view, leverage is the key driver of how STRC’s price may behave. If Bitcoin strengthens and improves Strategy’s balance sheet, he suggested STRC could potentially move closer to its $100 par value.
For investors, this is the central tension: Strategy’s BTC treasury model can support preferred dividends under varying market conditions, but the pricing of preferred equity depends not only on the current BTC level, but also on expectations for long-term coverage, leverage dynamics, and how quickly markets re-rate the risk embedded in that cash-flow structure.
What to watch next as Strategy keeps raising liquidity
Strategy’s latest filing shows a familiar pattern: liquidity is raised through MSTR-related share sales while BTC holdings are left unchanged in the reporting window. The near-term question for market participants is whether future ATM activity continues to translate into additional Bitcoin purchases, and whether the ongoing debate over STRC valuation narrows as cash-flow expectations and leverage assumptions evolve.
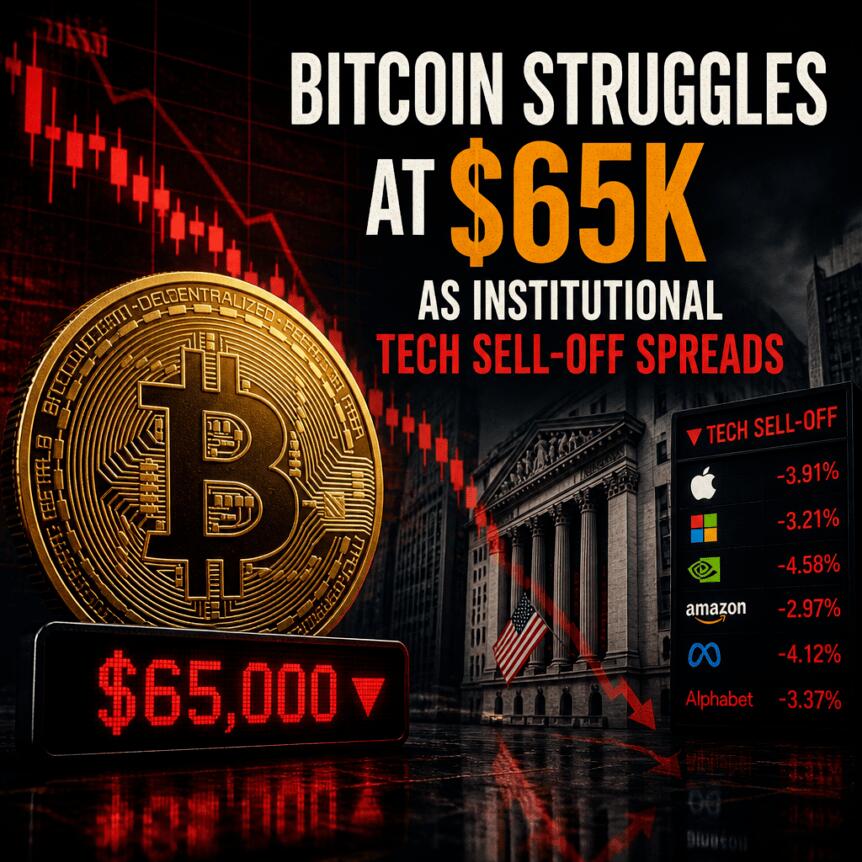
Bitcoin traders struggled to push through the $65,000 area on Monday, even as volatility picked up around the start of the Wall Street session. The pullback reflected broader pressure on risk assets, where renewed concerns tied to the US-Iran situation and an institutional sell-off in parts of the US tech sector weighed on sentiment.
Despite the hesitation, several market participants maintained an upside bias—framing $65,000 as a near-term ceiling and pointing to the high-$60,000s as the next level that could confirm a more constructive structure for BTC/USD.
Key takeaways
- Bitcoin repeatedly failed to break and hold above $65,000, with traders describing the level as a July “roadblock.”
- US equities opened the week with headwinds from both geopolitical risk (US-Iran) and a reported acceleration in hedge-fund selling of tech stocks.
- Oil prices stayed elevated above $80 per barrel, keeping pressure on broader risk appetite.
- Traders’ near-term bullish expectations cluster around a move toward the $67,000–$69,000 zone if BTC can reclaim momentum.
Wall Street jitters and the “record pace” tech sell-off
According to TradingView, BTC volatility returned around Monday’s Wall Street open, aligning crypto price action with shifting risk sentiment in traditional markets.
A notable part of the narrative came from The Kobeissi Letter, which reported that hedge funds were selling information technology stocks “at a record pace.” In an X post, the account said hedge funds sold tech stocks in 6 of the last 8 weeks, adding that total 8-week sales were the largest in at least 10 years, citing Goldman Sachs data. This matters for crypto because BTC often trades as a macro-sensitive asset during periods when institutional flows tighten in growth-oriented equities.
At the time of writing, the S&P 500 and the Nasdaq Composite were modestly higher, while the Dow Jones was down about 0.3%. Still, the direction was not uniformly supportive—suggesting investors were able to find footing in indices while selectively reducing exposure elsewhere.
Geopolitics added another layer of caution. Oil prices remained above $80 per barrel as the Strait of Hormuz appeared likely to stay closed, with rhetoric intensifying between the US and Iran. In practice, sustained energy risk tends to complicate expectations for inflation and global growth, which can translate into tighter financial conditions and less tolerance for risk across asset classes.
On the political front, a post on Truth Social attributed to US President Donald Trump said Iran should be included in a sanctions package initially focused on Russia. While sanctions specifics and timelines are not detailed in the excerpt, the broader point for markets is that investors appear to be pricing in a more complex and potentially riskier geopolitical landscape.
$65,000 becomes the repeated momentum failure point
Against that backdrop, BTC’s upside attempts appeared limited by the $65,000 level. Traders described Monday’s price behavior as another test without follow-through, reinforcing the idea that the market is waiting for a catalyst or shift in flows before treating this price area as support rather than resistance.
Trader Daan Crypto Trades wrote on X that the $65K level had capped price “for the entirety of July so far.” In a separate X reply, Daan noted that the more time BTC spends around that region, the higher the odds the level eventually breaks—particularly given that “higher lows” were allegedly being formed over the previous three weeks. The framing suggests a gradual build in underlying demand, even if breakout attempts have repeatedly stalled.
What bulls are watching after a breakout signal
While price struggled to move higher, multiple traders pointed to the high-$60,000s as the area that could change the market’s structure. Daan Crypto Trades suggested the next upside objective sits just above $67,000, describing it as the point where BTC/USD would “break into a bullish market structure.”
Other participants also linked their outlook to the idea that time spent near a key level can precede a decisive move. Crypto trader and analyst Michaël van de Poppe told his roughly 819,000 followers on X that markets “feel like” they are in a summer break—an observation traders often associate with thinner liquidity and fewer large swings, rather than a guaranteed lack of direction.
In a separate post, Van de Poppe gave a BTC target range of $67,500 to $69,000 for the coming weeks. He previously indicated that August could offer even higher levels, up to $80,000, a price last seen in mid-May—an important reference point because it anchors the bullish thesis to a prior market high area rather than only a short-term bounce.
Taken together, these views converge on a similar “decision zone”: if BTC can move past $65,000 decisively and follow through into the $67,000–$69,000 region, traders appear more likely to treat the move as a broader shift rather than a routine rebound.
Seasonality and macro factors: the tension investors should monitor
The current situation highlights a common tension in crypto markets: technical levels and trader positioning are pushing toward upside scenarios, but macro conditions remain mixed. On one side, the recurring rejection at $65,000 suggests nearby buyers are present yet not strong enough to force an immediate breakout. On the other, reports of aggressive hedge-fund selling in US tech and ongoing geopolitical friction keep risk sentiment fragile.
Even with the S&P 500 and Nasdaq modestly higher at the time of writing, the “record pace” narrative around hedge-fund selling implies that the market may be vulnerable to additional shocks—especially if volatility rises again or correlations between BTC and risk assets strengthen.
What happens next will likely depend on whether BTC’s repeated contact with $65,000 is followed by a structural shift above it, or whether the market simply continues to oscillate under the ceiling while traditional markets remain cautious.
Traders are likely to focus on whether BTC can reclaim and hold levels in the mid-to-high $60,000 range, while watching for signs that equity risk appetite is stabilizing—or deteriorating further given the tech sell-off narrative and the energy/geopolitical backdrop.

Alphabet’s AI Chip Surprise Revives Bull Case for Beaten-Down Semiconductor Stocks

Spain v Argentina LIVE: World Cup champions arrive home to parade trophy as losers left in disgrace

IEEE Program Helps Girls In India See a Future In STEM


-
 NewsBeat4 days ago
London Mayor Sadiq Khan handed a peerage by Keir Starmer alongside 15 other Labour figures… just days before the PM leaves No10
-

 Fashion3 days ago
Weekend Open Thread – Corporette.com
-

 Politics2 days ago
The House | The City of London can help the new chancellor deliver growth in every postcode
-

 Politics5 days ago
Young campaigners urge incoming PM to act on outdoor junk food ads
-

 Crypto World5 days ago
CFTC blocks Kalshi from unwinding Michigan trades after court order
-
 Crypto World3 days ago
Two July Windows Left: The CLARITY Act’s Senate Fight and What Failure Means
-

 Business5 days ago
Nvidia Stock Slips After Big Tuesday Rally as Huang Confirms Vera Rubin Chip Is Now in Production Today
-
 Crypto World2 days ago
Ripple Payments Joins MiCA With 14 Firms, Does It Mean Anything For XRP?
-

 Politics1 day ago
Democrats look to World Cup watch parties to register thousands of voters
-
 Entertainment5 days ago
Disney’s Most Ambitious Failed Star Wars Attraction Is Coming to SDCC
-

 Crypto World3 days ago
Ripple wins EU-wide access as ESMA adds it to MiCA register
-

 Crypto World4 days ago
Injective Submits SEC Transfer-Agent Registration to Onchain Ownership Records
-

 Business5 days ago
Palantir Shares Rise After Expanded Nvidia Partnership and Fresh Analyst Upgrades Ahead of Earnings Day
-
 Tech7 days ago
Get Your ESP32 Sunny Side Up With This Solar Dev Board
-

 NewsBeat3 days ago
Registration is now open for March for Men with Kev 2026
-

 News Videos6 days ago
XRP BOMBSHELL… XRP OMBOARDED FOR TRANSACTIONS!!!
-

 Tech6 days ago
Dark Secrets Emerge When Jailbreaking LLMs
-

 NewsBeat7 hours ago
Unregistered fitter used Gas Safe logo on business flyers
-
 Sports5 days ago
New Cornerback Enters Vikings Trade Rumor Mill
-

 News Videos3 days ago
Money | Class 12 Economics | CBSE Board Exam 2026-27
You must be logged in to post a comment Login