

Crypto World
Lagarde Exit Report Raises Questions Over Digital Euro Timeline and Stablecoin Policy

Christine Lagarde might not stick around until 2027. Reports suggest the ECB president is weighing an early exit.
If that happens, it is not just a personnel change. It could scramble the timeline for the digital euro and stablecoin oversight right as MiCA rules start taking effect.
A leadership shakeup at this stage would inject fresh uncertainty into Europe crypto roadmap.
Key Takeaways
- Early Departure: Lagarde is reportedly weighing an exit before October 2027 to align with French presidential elections.
- Succession Race: Top contenders include Dutch central bank chief Klaas Knot and Spain’s Pablo Hernández de Cos.
- Project Risk: A change in leadership threatens the continuity of the digital euro project and euro-stablecoin oversight.
Why Is The Timing Critical for Crypto?
Lagarde has been the driving force behind the ECB digital push. Since 2019, she moved the digital euro from theory into formal investigation. Now, just as MiCA stablecoin rules are being finalized, her potential exit lands at a sensitive moment.
Without her leading the charge, the sovereign payment narrative weakens. There are also political layers here. Aligning her departure with the April 2027 French election could give President Macron influence over who steps in next.
The bigger concern is policy drift. A new ECB chief could shift focus back to traditional tightening and slow down digital euro efforts. That would leave more room for private stablecoins to fill the gap.
Who Could Take The Reins?
Publicly, the ECB says she is fully focused on her job. But the timing being floated suggests this is more than random chatter. The idea is to step aside before political shifts in France and Germany complicate the process.
Names are already circulating. Spain’s Pablo Hernández de Cos. Dutch central bank chief Klaas Knot. Even Bundesbank head Joachim Nagel is in the conversation.
Officially, nothing is confirmed. ECB executive Piero Cipollone says he has no knowledge of an early exit plan. Still, markets tend to price political risk before headlines become formal announcements.
With 21 eurozone nations needing to approve a successor, whoever takes over could significantly shape Europe’s stance on crypto and the digital euro.
What Happens to the Digital Euro?
A leadership vacuum would leave the digital euro in a fragile spot. The project already faces pushback from banks and privacy advocates. Without Lagarde driving it forward, momentum could fade fast.
And this is happening while stablecoin liquidity is shifting quickly. If the ECB hesitates on building a serious euro alternative to US dollar tokens, private players will not wait.
At the same time, the US and other major economies are accelerating their crypto frameworks. Europe cannot really afford a slowdown. Leadership uncertainty rarely supports long term institutional projects.
Discover: Here are the crypto likely to explode!
The post Lagarde Exit Report Raises Questions Over Digital Euro Timeline and Stablecoin Policy appeared first on Cryptonews.


- Dogecoin struggles below key moving averages, signaling weak short-term trend.
- A cup and handle pattern is forming, hinting at a potential breakout if the resistance breaks.
- Support lies near $0.08, with higher volume needed for a sustained upward move.
Dogecoin is hovering around the $0.10 mark after a shaky month that saw the price dip over 20%.
The popular meme coin has struggled to hold momentum, with trading volumes showing signs of weakness.
Even so, there are hints in the charts that a rebound could be forming.
Technical analysis
Looking at the moving averages, DOGE is currently below the 5-day, 10 and 20-day averages.

This typically signals that the short-term trend is weak.
Traders often watch for the price to climb above these averages as an early sign of bullish momentum.
Right now, resistance is in the $0.105–$0.107 range.
A break above this level would be an important signal for those hoping for a recovery. The MACD indicator is also showing mixed signals.
The MACD line has moved above the signal line despite both being in the negative, and the histogram has turned positive, suggesting that buyers are beginning to step in after a period of inactivity.
However, volume is still modest. A strong breakout would require significantly more trading activity than the roughly $33 million seen recently.
Support remains solid at around $0.08, which has already acted as a bounce point.
This level has prevented further sharp declines and could continue to anchor the price if bearish pressure returns.
Cup and handle pattern points to possible upside
On the daily chart, Dogecoin is forming a classic Cup and Handle pattern.
The Cup bottomed near $0.08 and then rallied toward $0.11.
The Handle is now forming near the top of the Cup, consolidating just below resistance.

This formation often precedes a breakout when the price moves above the Handle.
If Dogecoin can clear this resistance, it could push toward higher levels, reigniting optimism among traders.
Chart patterns like this are watched closely because they combine both support and momentum signals.
They show where traders are willing to buy and where sellers may step in.
In Dogecoin’s case, the pattern suggests that there is still potential for upside, but it won’t happen without stronger buying interest.
Volume and momentum will be key to confirming the breakout. Traders are likely waiting for both to pick up before committing heavily.
Even with these early bullish signs, caution is warranted.
The market has been volatile, and DOGE has lost significant value over the past year. Short-term gains are possible, but the overall trend remains fragile.
The selloff continues as tensions in the Middle East rise and the Department of Homeland Security remains partially shut down.
Crypto markets slipped further on Wednesday, Feb. 18, as political and macroeconomic uncertainty continued to weigh on sentiment.
Bitcoin (BTC) is trading at $66,344, down 2.5% over the past 24 hours, while Ethereum (ETH) is at $1,953, down 2.3%. Separately, Founders Fund, a venture firm tied to billionaire Peter Thiel, disclosed it had exited its entire 7.5% stake in Ethereum treasury company ETHZilla Corp. last year, according to a recent SEC filing.

Other large-cap tokens were also lower, with BNB down 2% near $610, XRP down 3% to $1.44, and Solana (SOL) down 4.5% to $81.
Meanwhile, the total cryptocurrency market capitalization stood near $2.37 trillion, down 2% over the past 24 hours. Daily trading volume was around $88.5 billion, according to CoinGecko.
Among top gainers, World Liberty Financial (WLFI) rose 15.7%, following news of top Wall Street CEOs preparing to headline at the World Liberty Forum.
Cosmos Hub (ATOM) also climbed 6.2%, while Provenance Blockchain (HASH) rose about 5%. HASH’s rally comes shortly after Figure announced that pricing has officially closed for FGRD, the first public equity trading natively on the Provenance blockchain.
On the downside, pumpfun (PUMP) fell around 11%, MemeCore (M) dropped roughly 7%, and Bittensor (TAO) slipped about 6.3%.
Liquidations and ETF Flows
Around $192 million in leveraged crypto positions were liquidated over the past 24 hours, according to CoinGlass. Long liquidations accounted for about $134.6 million, while shorts made up $57.4 million.
Bitcoin led liquidations at about $66.7 million, followed by Ethereum at roughly $53.7 million. More than 84,000 traders were liquidated during the period.
In the ETF market, Bitcoin spot ETFs recorded $104.87 million in net outflows, while Ethereum spot ETFs recorded $48.63 million in inflows. XRP spot ETF flows were flat on the day, while Solana spot ETFs recorded $2.19 million in inflows.
Elsewhere
In other markets, precious metals moved higher on the day, with gold trading around $5,000, up 2% and silver rising 4.3% to $77.49. Platinum gained 3.3% to $2,098, while palladium added nearly 2% to $1,742.
Political uncertainty also remained in focus as the White House did not give a clear timeline for talks with Iran amid rising tensions in the Middle East.
Meanwhile, negotiations between Ukraine and Russia concluded, with further discussions expected. In Washington, conflict over reopening the Department of Homeland Security, which is partially shut down, persists, CNN reported.


Peter Thiel, as of December 31, has fully divested from ETHZilla, his ether (ETH) gobbling company that’s currently down 98% from its 52-week high.
Those sales finalize losses for Thiel’s investment that exceeded $200 million at the company’s brief, exuberant peak in August.
On August 4 last year, ETHZilla (under its prior Nasdaq-listed name, 180 Life Sciences) closed a $425 million private investment in public equity (PIPE).
Separately, Thiel’s funds had also invested by August 4, 2025, disclosing aggregate beneficial ownership of 11,592,241 shares. Thiel’s quantity was then worth about $40 million or 7.52% of 180 Life Sciences’ 154,032,084 shares outstanding.
Although charts show an ETHZ trading range of $27.22-$35.70 on the day before Thiel’s investment, that price reflects a one-for-10 reverse share split that occurred in October.
In actual fact, Thiel’s 11.5 million beneficially-owned shares were trading at $2.72-$3.57 the day prior to his investment, imputing an investment of approximately $40 million based on their $3.54 closing print on August 1, 2025.
He disclosed his ownership the following trading day, as required by SEC regulations.
Within two weeks of his investment, his pre-split shares rocketed from $3.54 to $17.46 on August 13 after the former biotech company announced a host of crypto investors and an ETH acquisition strategy that was enjoying a brief mania in digital asset treasury (DAT) stocks.
Read more: Even Ethereum treasury companies are selling ETH to pay off debt
ETHZilla is down 98% from its August peak
Marked-to-market at the company’s August peak, Thiel and his funds owned over $200 million worth of stock.
Unfortunately, he hung on for months of losses.
Although Thiel trimmed his exposure from 7.5% to 5.6% by September 30, he continued to hold the vast majority of his shares — and their dwindling value.
He wouldn’t sell the entire position until the fourth quarter — after shares had lost over 85% of their August peak value.
By the time he’d sold everything, shares were down 86% from Thiel’s August 1 closing price and 97% from their August 13 peak.
As of today, shares are down 98% from their high.
Although Thiel isn’t required to disclose his average sale prices on SEC 13G schedules, approximating his losses is elementary math.
If Thiel beneficially owned approximately $40 million as of his opening investment, he certainly lost tens of millions of dollars by the time he sold.
From their fleeting value above $200 million, he let well over $100 million — probably more than $150 million — in paper value evaporate.
Losses from his starting investment size likely exceed $30 million from August 1 to the average trading range during the periods in which he was selling.
Note: Above figures about Thiel’s investments include all of the funds through which he invested in ETHZilla (formerly 180 Life Sciences):
- FF Consumer Growth, LLC
- FF Consumer Growth II, LP
- The Founders Fund Growth Management, LLC
- The Founders Fund Growth II Management, LP
- Peter Thiel
- FF Upper Tier GP, LLC
Got a tip? Send us an email securely via Protos Leaks. For more informed news, follow us on X, Bluesky, and Google News, or subscribe to our YouTube channel.
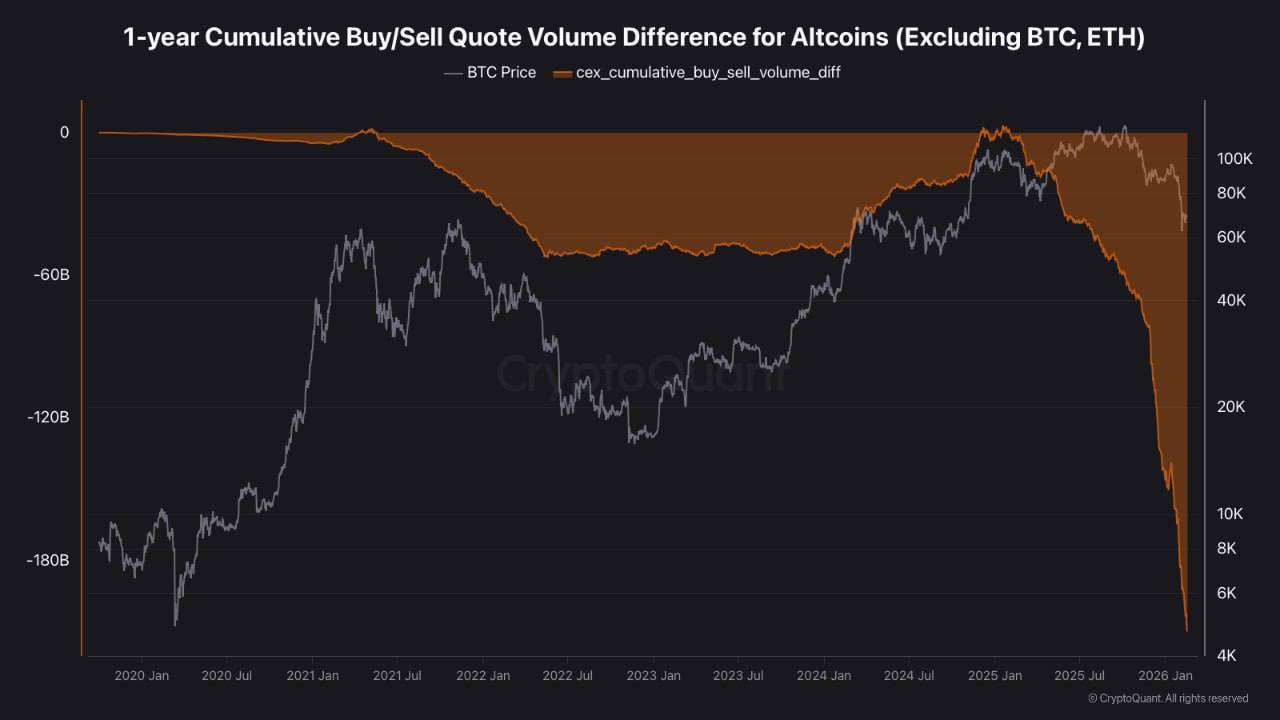
Altcoins, excluding Ether (ETH), have recorded $209 billion in net selling volume since January 2025, marking one of the steepest declines in speculative demand for crypto assets this cycle.
On Binance, altcoin trading volumes dropped roughly 50% since November 2025, reflecting a steady dip in activity. The decrease also coincides with an increase in Bitcoin’s volume share on the exchange.
Analysts said that the contraction in altcoin demand, alongside elevated stablecoin dominance, signals that the broader market is shifting its capital toward BTC during the current downtrend.
Altcoin spot volume imbalance deepens against Bitcoin
Crypto analyst IT Tech noted that the cumulative buy and sell difference for altcoins, excluding BTC and Ether (ETH), reached -$209 billion. The metric measures net spot demand across centralized exchanges for altcoin trading pairs. A positive reading indicates rising spot demand, which was briefly observed back in January 2025.

A negative cumulative delta at this scale signals the absence of consistent spot buyers. The analyst noted that the metric tracks net flow imbalance rather than price valuation, so it does not indicate a market bottom. Over the past 13 months, capital has exited the altcoin markets without significant counterflows.
Volume data from Binance reinforces the shift. As BTC tested the $60,000 level in early February, the total trading volume was redistributed. On Feb. 7, Bitcoin volumes rose to 36.8% of total activity. Altcoin volumes dropped to 33.6% by mid-February, from a high of 59.2% in November.
According to crypto analyst Darkfost, similar rotations appeared in April 2025, August 2024, and October 2022. During these corrective phases, capital consolidated into Bitcoin while altcoin volumes contracted.

Related: New Bitcoin whales are trapped underwater, but for how long?
Tether dominance rises to its all-time high level
Tether’s USDt (USDT) market cap dominance reached the 8% level on the one-week chart, aligning with prior highs which lasted between June 2022 and October 2023. The rising stablecoin dominance typically coincides with capital moving into dollar-pegged assets rather than deploying into tokens like BTC (BTC) and Ether (ETH).

As observed, the elevated USDT dominance coincided with Bitcoin consolidating near bear market lows, as observed in 2022 and 2023. A decline in dominance has often marked one of the earliest signals of a renewed bullish trend.
Previously, the USDT dominance chart formed lows around 3.80-4% in March 2024, December 2024, and October 2025. These periods coincided with Bitcoin setting new all-time highs near $72,000, $104,000, and $126,000, respectively.
Related: Wells Fargo sees ‘YOLO’ trade driving $150B into Bitcoin and risk assets
This article does not contain investment advice or recommendations. Every investment and trading move involves risk, and readers should conduct their own research when making a decision. While we strive to provide accurate and timely information, Cointelegraph does not guarantee the accuracy, completeness, or reliability of any information in this article. This article may contain forward-looking statements that are subject to risks and uncertainties. Cointelegraph will not be liable for any loss or damage arising from your reliance on this information.
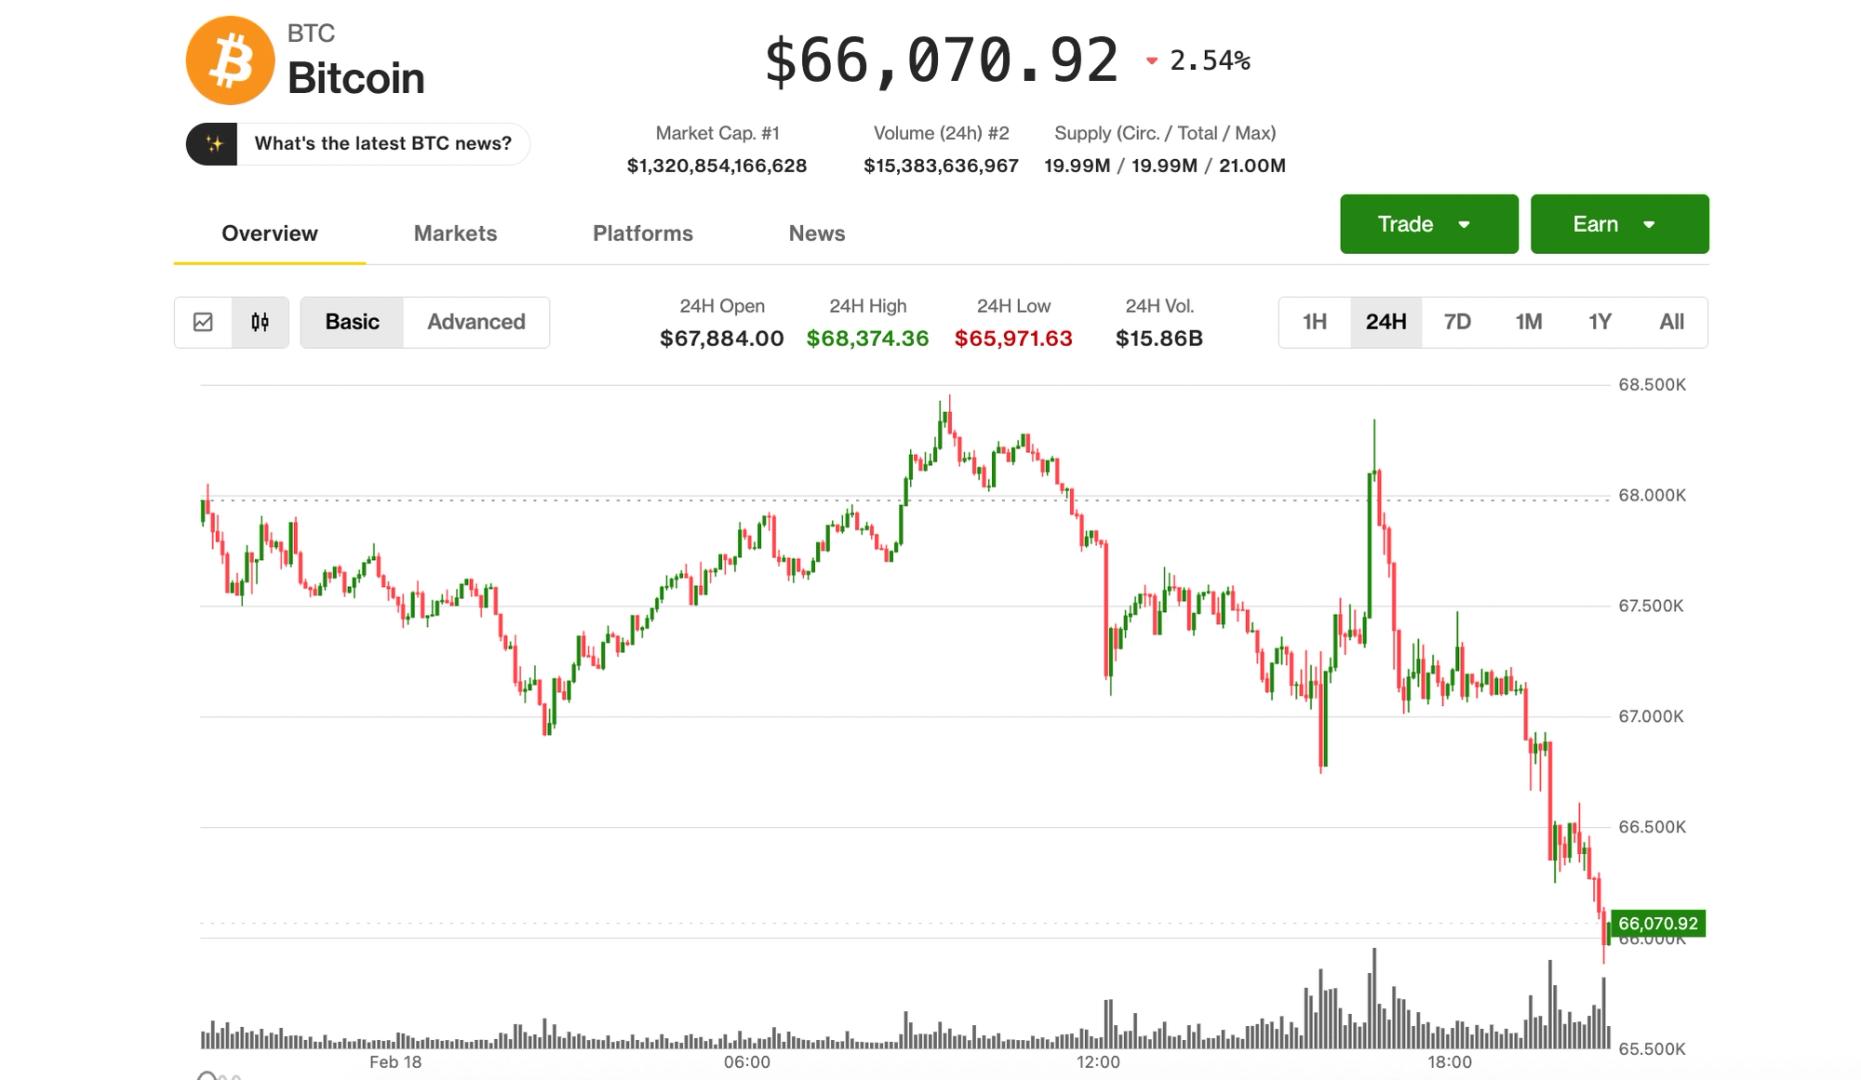

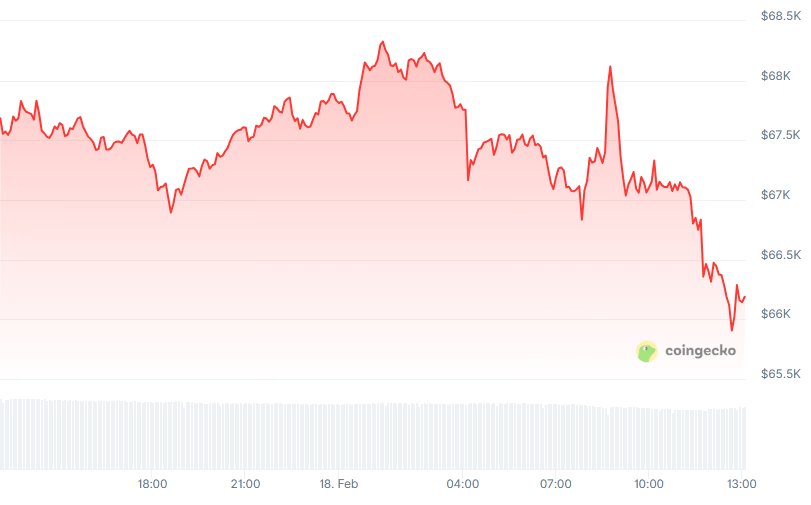
After chopping around early Wednesday, bitcoin rolled over during the U.S. afternoon and slid to session lows under $66,000, putting pressure back on the lower end of its recent range.
Having traded $68,500 overnight, BTC was down 2.5% over the past 24 hours and last trading at $66,200.
Crypto stocks, which started the day on a stronger foot, followed suit, paring back their gains or snapping into declines across the board. Most notable was Coinbase (COIN), which turned its 3% morning advance into a 2% decline by the afternoon. Strategy (MSTR), he largest corporate holder of bitcoin, was down roughly 3% as the underlying asset weakened.
After a fast start to the session, U.S. stocks had given back much of their gains shortly before the close of trading. Not helping were surprisingly hawkish minutes from the January meeting of the Federal Reserve’s Federal Open Market Committee (FOMC). As expected, most at the central bank agreed with the decision to pause rate cuts, but — in a twist — several suggested the Fed favor “two-sided” guidance at which the bank might opt to hike rates if inflation continues to remain sticky.
Already higher for the day, the U.S. dollar gathered even more strength, with the dollar index (DXY) — which measures the greenback against a basket of major foreign currencies — climbing to its strongest level in nearly two weeks. A firmer dollar often weighs on risk assets, and Wednesday’s crypto fade appeared to fit that pattern.
With today’s slide, bitcoin is now staring at a fifth straight week of losses, its worst streak since the long 2022 bear market.
It also faces a key test at current levels. The $66,000 area held as support last week and helped fuel a bounce above $70,000. If that floor gives way decisively, traders will likely start eyeing the early February lows at $60,000 or a fresh leg lower.


Crypto advocacy group Coin Center is lobbying the U.S. Senate to maintain a crucial clause in the upcoming market structure bill, according to a new blog post.
This provision protects software developers from liability if third parties misuse their open-source code for illicit activities.
The stakes are incredibly high for the industry. Removing these protections could freeze innovation by making coders legally responsible for how strangers use their tools. That is a risk few developers are willing to take.
Key Takeaways
- Liability Shield: Coin Center argues that developers who do not control assets should not be treated as money transmitters.
- Senate Standoff: The Senate Judiciary Committee is blocking the clause, citing enforcement concerns over platforms like Tornado Cash.
- Procedural Roadblock: The dispute has stalled the broader market structure bill, delaying regulatory clarity.
Why Is Coin Center Lobbying so Hard?
The Senate Banking Committee is currently deliberating a comprehensive digital asset market structure bill.
This legislation aims to define how the CFTC and SEC regulate the industry. Recently, Trump suggested a crypto market structure bill could arrive soon, ramping up the urgency.
However, a specific clause protecting non-custodial developers has hit a wall. Leaders of the Senate Judiciary Committee, including Senators Dick Durbin and Chuck Grassley, have intervened. They argue that shielding developers weakens laws against unlicensed money transmitters.
This political friction has created a significant procedural hurdle for the bill. Without a compromise, the entire legislative package risks indefinite delay.
The Battle Over Code Liability
For Coin Center, preserving this liability shield is a top priority. The advocacy group contends that punishing developers for the actions of users creates “chilling uncertainty” for open-source innovation.
The core issue revolves around control. Coin Center argues that if you merely publish code, like the developers of a decentralized exchange, you do not control user funds. Therefore, you cannot comply with Bank Secrecy Act requirements designed for custodial intermediaries.
This distinction is vital for the DeFi sector. Protocols where rely on developers building open systems without fear of prosecution.
If the Senate removes these protections, writing smart contracts could become a criminal liability in the U.S.
This debate refers back to earlier legislative attempts, such as the Blockchain Regulatory Certainty Act, which sought similar clarifications regarding non-controlling blockchain services.
Discover: The best crypto to diversify your portfolio with.
What Happens Next?
The industry is now watching the Senate Banking Committee. They must decide whether to strip the clause to appease the Judiciary Committee or fight to keep it. Stripping it might pass the bill, but it leaves developers exposed.
Looking globally, the U.S. risks falling behind jurisdictions with clearer frameworks. For instance, Germany’s central bank endorsed stablecoins under the MiCA regulation, providing the kind of legal certainty U.S. builders are desperate for.
If the Senate fails to resolve this standoff, major market structure legislation could be pushed into late 2026. Until then, American developers operate in a dangerous gray zone.
Discover: Here’s the best pre-launch token sales in crypto now.
The post Coin Center Pushes Senate to Preserve Crypto Developer Liability Protections appeared first on Cryptonews.
Global markets are reacting sharply to rising geopolitical tensions in the Middle East, as reports suggest the US could be moving closer to a direct military confrontation with Iran.
Safe-haven assets such as gold and silver are climbing, oil prices are rising on supply fears, and Bitcoin is slipping as traders rotate away from risk-sensitive assets.
Iran Military Buildup Fuels Market Anxiety
Recent intelligence and media reports indicate that any potential conflict would not be a limited strike. Rather, it would be a broader, weeks-long campaign if launched, raising concerns about prolonged volatility across commodities, equities, and crypto.
Sponsored
Sponsored
According to Axios analysis, evidence is mounting that a conflict could be imminent, with Israel reportedly preparing for a scenario of “war within days,” which could involve a “weeks-long ‘full-fledged’ war” and a joint US–Israeli campaign broader in scope than previous operations.
The same report noted that US forces in the region now include “2 aircraft carriers, 12 warships, hundreds of fighter jets, and multiple air defense systems.” This is in addition to more than 150 cargo flights transporting weapons and ammunition.
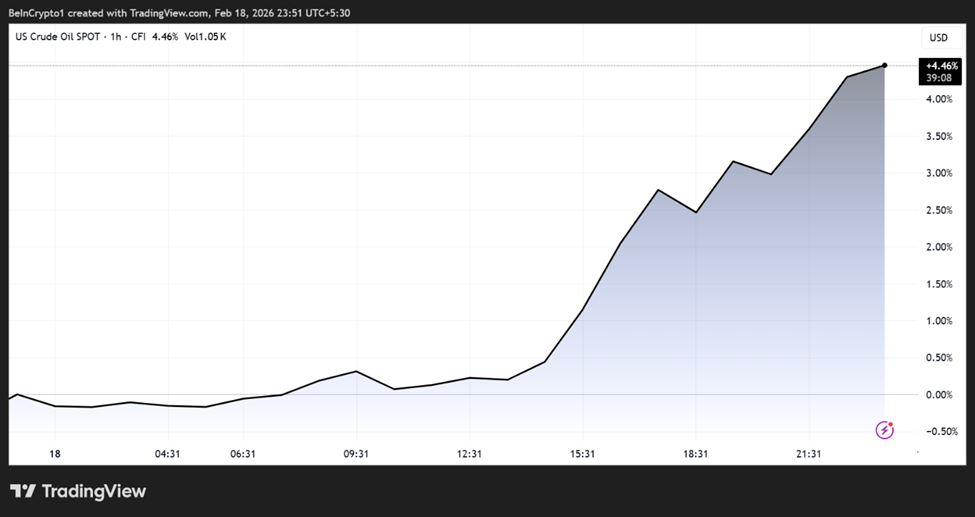
Oil prices reportedly surged above $64 per barrel following the news.

Separate commentary similarly described the US as being on the brink of a large-scale conflict, with stalled nuclear negotiations and a growing military presence increasing the risk of imminent action.
The assessment suggested that strikes could come within weeks if diplomacy collapses, with Donald Trump’s advisers continuing talks but failing to close key gaps.
Sponsored
Sponsored
Commodity markets have been the most immediate beneficiaries of the rising geopolitical risk premium.
Analysts tracking market moves reported that gold, silver, and oil all advanced as tensions escalated. Silver posted some of the strongest gains among major assets.
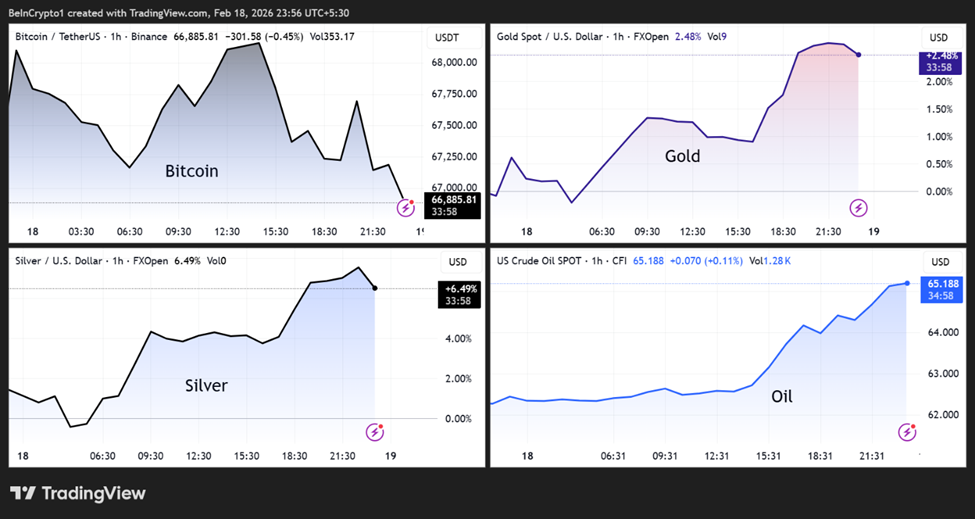
“The precious metals sector has so far been the primary beneficiary of heightened US attack concerns,” commented commodities strategist Ole Hansen, adding that gold is trading above $5,000 while silver and platinum have also recorded significant gains.
Oil markets are also reacting to the possibility of disruptions in the Strait of Hormuz, through which roughly one-fifth of global oil supply moves.
Even the perception of risk to this route tends to trigger sharp price swings, amplifying volatility across energy markets.
Sponsored
Sponsored
Bitcoin Slips as Risk Appetite Weakens
While traditional safe havens rallied, cryptocurrencies moved in the opposite direction. Bitcoin fell below the critical support of $67,014 and was trading for $66,384 as of this writing.
This divergence, where Bitcoin slumps while gold, silver, and oil advance, reflects a broader risk-off shift in investor sentiment.
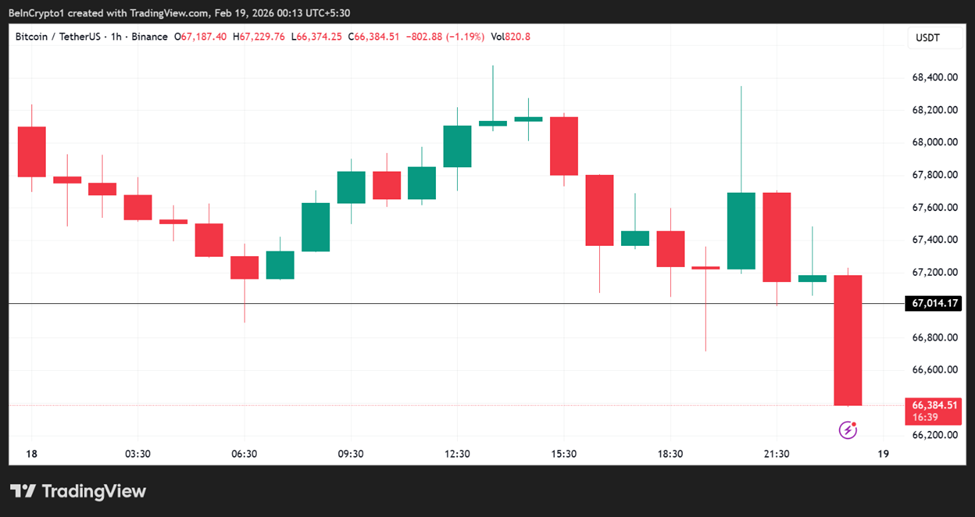
The divergence highlights a recurring pattern in periods of geopolitical stress: capital often flows first into commodities and cash-like instruments before returning to higher-beta assets such as crypto.
Debate Over the Likelihood and Consequences of War
Despite the buildup, some analysts remain skeptical that a full-scale war will materialize. Nigerian tech entrepreneur Mark Essien argued that a prolonged conflict would be far more complex than previous campaigns.
Sponsored
Sponsored
Based on this, Essien warns that Iran’s drone capabilities and potential insurgency could make the situation difficult to resolve quickly. Meanwhile, domestic opposition in the US is also visible.
“Americans do not want to go to war with Iran!!! They want to be able to afford their lives and get ahead,” wrote former congresswoman Marjorie Taylor Greene.
At the same time, geopolitical risks may be expanding beyond a bilateral confrontation. Reports cited by defense analysts suggest that China could be providing Iran with intelligence and navigation support, potentially complicating the regional strategic balance.
With peace talks continuing but showing little sign of a breakthrough, markets are preparing for prolonged uncertainty. Traders are increasingly pricing in the possibility that any military action would be larger, longer, and more disruptive than recent conflicts.
It explains why commodities are reflecting fear, cryptos are reflecting caution, and global investors are watching diplomatic developments closely.
Whether diplomacy prevails or tensions escalate further may determine the direction of oil and gold, as well as the next major trend across global financial markets.


DerivaDEX has launched a Bermuda-licensed crypto derivatives platform, becoming what it says is the first DAO-governed decentralized exchange to operate under formal regulatory approval.
According to a statement from the platform, the exchange received a T license from the Bermuda Monetary Authority and has begun offering crypto perpetual swaps trading to a limited number of advanced retail and institutional participants.
The BMA’s T, or test license, is issued for a digital asset business seeking to test a proof of concept.
At launch, DerivaDEX supports major crypto perpetual products and said it plans to expand into additional markets, including prediction markets and traditional securities. The company said the platform combines offchain order matching with onchain settlement to Ethereum, while allowing users to retain noncustodial control of funds.
DerivaDEX also said the platform, developed by DEXLabs, uses encrypted order handling and trusted execution environments, which are intended to mitigate front-running and other forms of market manipulation.
A decentralized autonomous organization, or DAO, is a blockchain-based governance structure in which token holders collectively vote on decisions according to rules encoded in smart contracts rather than relying on a traditional management hierarchy.
Related: Fed paper proposes initial margin weights for crypto-linked derivatives
Traditional asset managers move into DeFi infrastructure
DerivaDEX’s launch comes as traditional asset managers are increasingly engaging with decentralized finance infrastructure on public blockchains.
On Feb. 11, BlackRock made its tokenized US Treasury product, the USD Institutional Digital Liquidity Fund (BUIDL), available on the decentralized exchange Uniswap. The move allows institutional investors to trade the tokenized fund onchain, and included BlackRock purchasing an undisclosed amount of Uniswap’s governance token, UNI.
A few days later, Apollo Global Management agreed to acquire up to 90 million governance tokens of decentralized finance protocol Morpho over four years, representing 9% of the token’s 1 billion total supply. The $940 billion asset manager said the agreement includes supporting Morpho’s decentralized lending infrastructure.
These developments come as US lawmakers continue debating provisions in the Digital Asset Market Clarity Act, legislation aimed at defining how cryptocurrencies and decentralized finance platforms would be regulated.
While the major sticking point remains around stablecoin yield, in January, crypto venture firms Paradigm and Variant warned that current draft legislation left uncertainty over whether DeFi developers and infrastructure providers could face registration, Know Your Customer requirements or other compliance obligations designed for centralized intermediaries.
Magazine: Is China hoarding gold so yuan becomes global reserve instead of USD?
Ethereum has extended its recent decline, slipping toward the $2,000 level. At first glance, the pullback appears to be stabilizing. However, on-chain data suggests the weakness may not be over.
While ETH is hovering near a key level, underlying metrics reveal persistent stress; there is a chance that this cycle mirrors prior downturn patterns.
Sponsored
Sponsored
Ethereum Can Repeat History
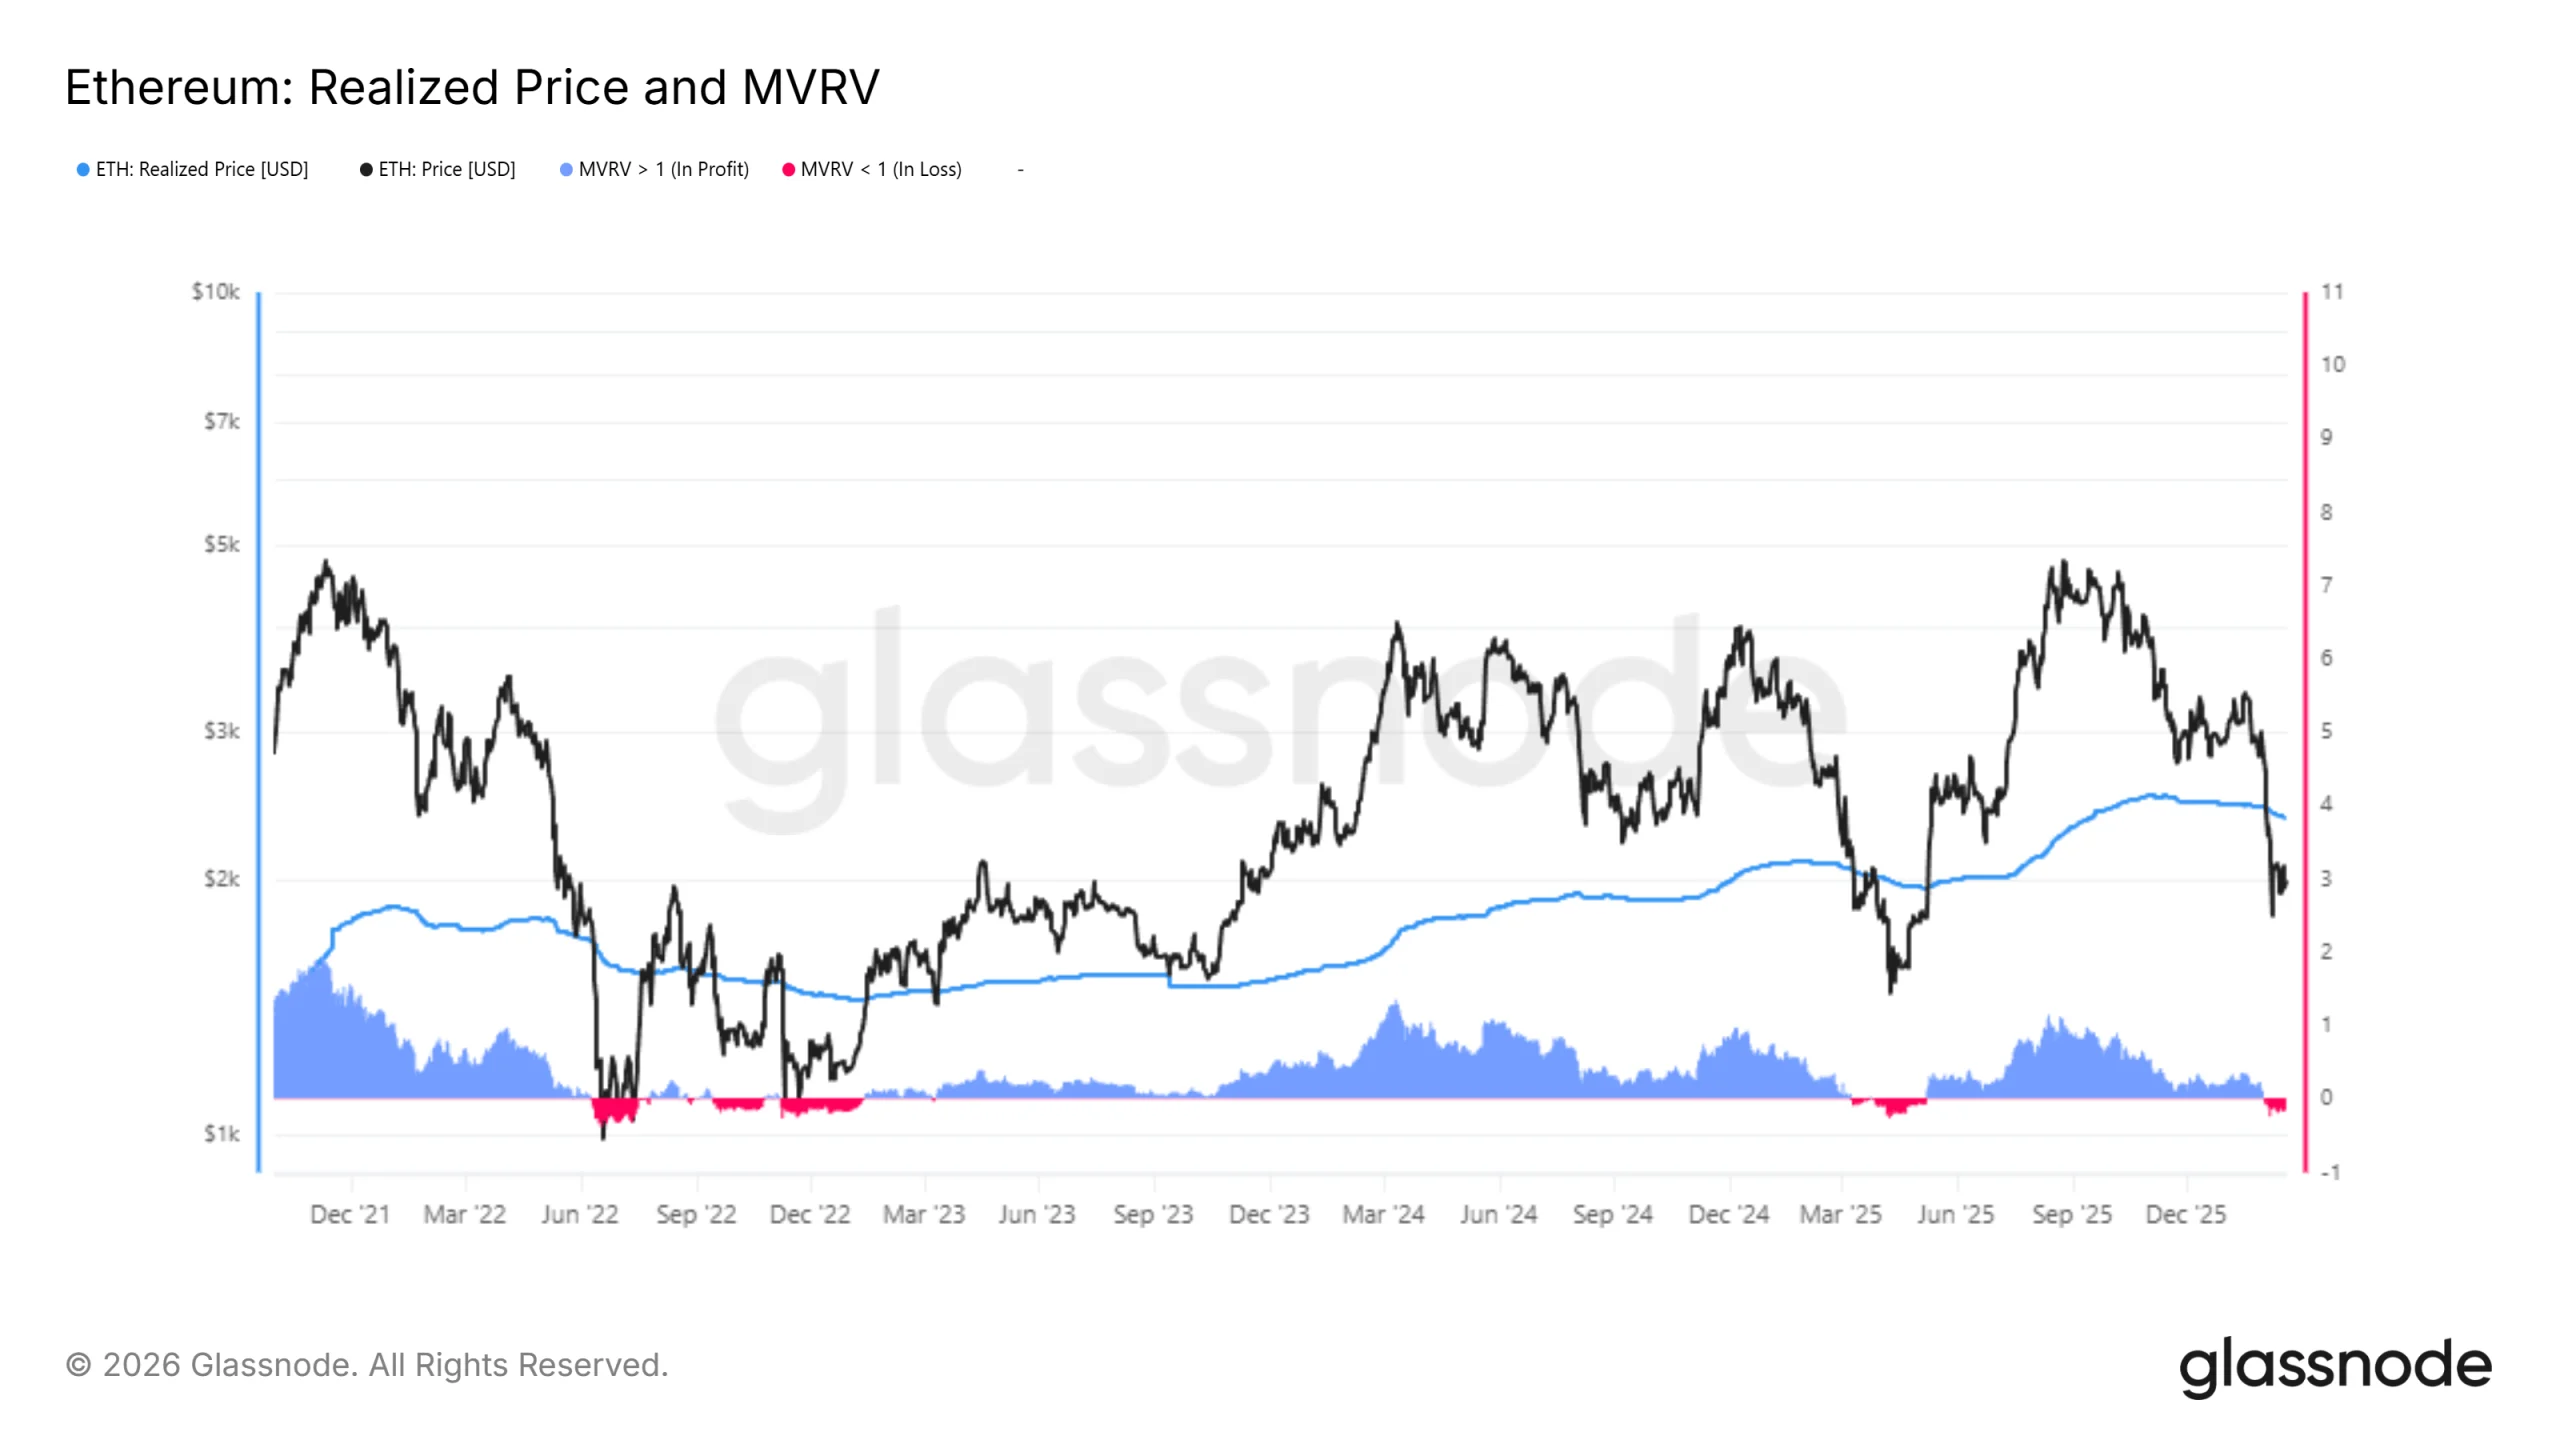
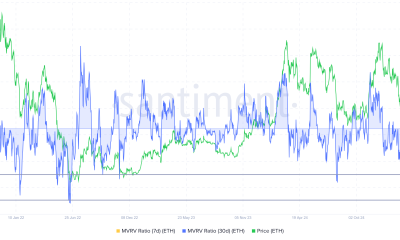
Ethereum fell below its Realized Price toward the end of January. Since then, ETH has remained trapped under this crucial on-chain benchmark. The Realized Price reflects the average acquisition cost of all coins in circulation. Trading below it often signals widespread unrealized losses.
The Market Value to Realized Value, or MVRV, ratio confirms this pressure. ETH’s MVRV has remained below 1.0, indicating that the average holder is at a loss. Extended periods in this zone historically coincide with deep market corrections.
Want more token insights like this? Sign up for Editor Harsh Notariya’s Daily Crypto Newsletter here.
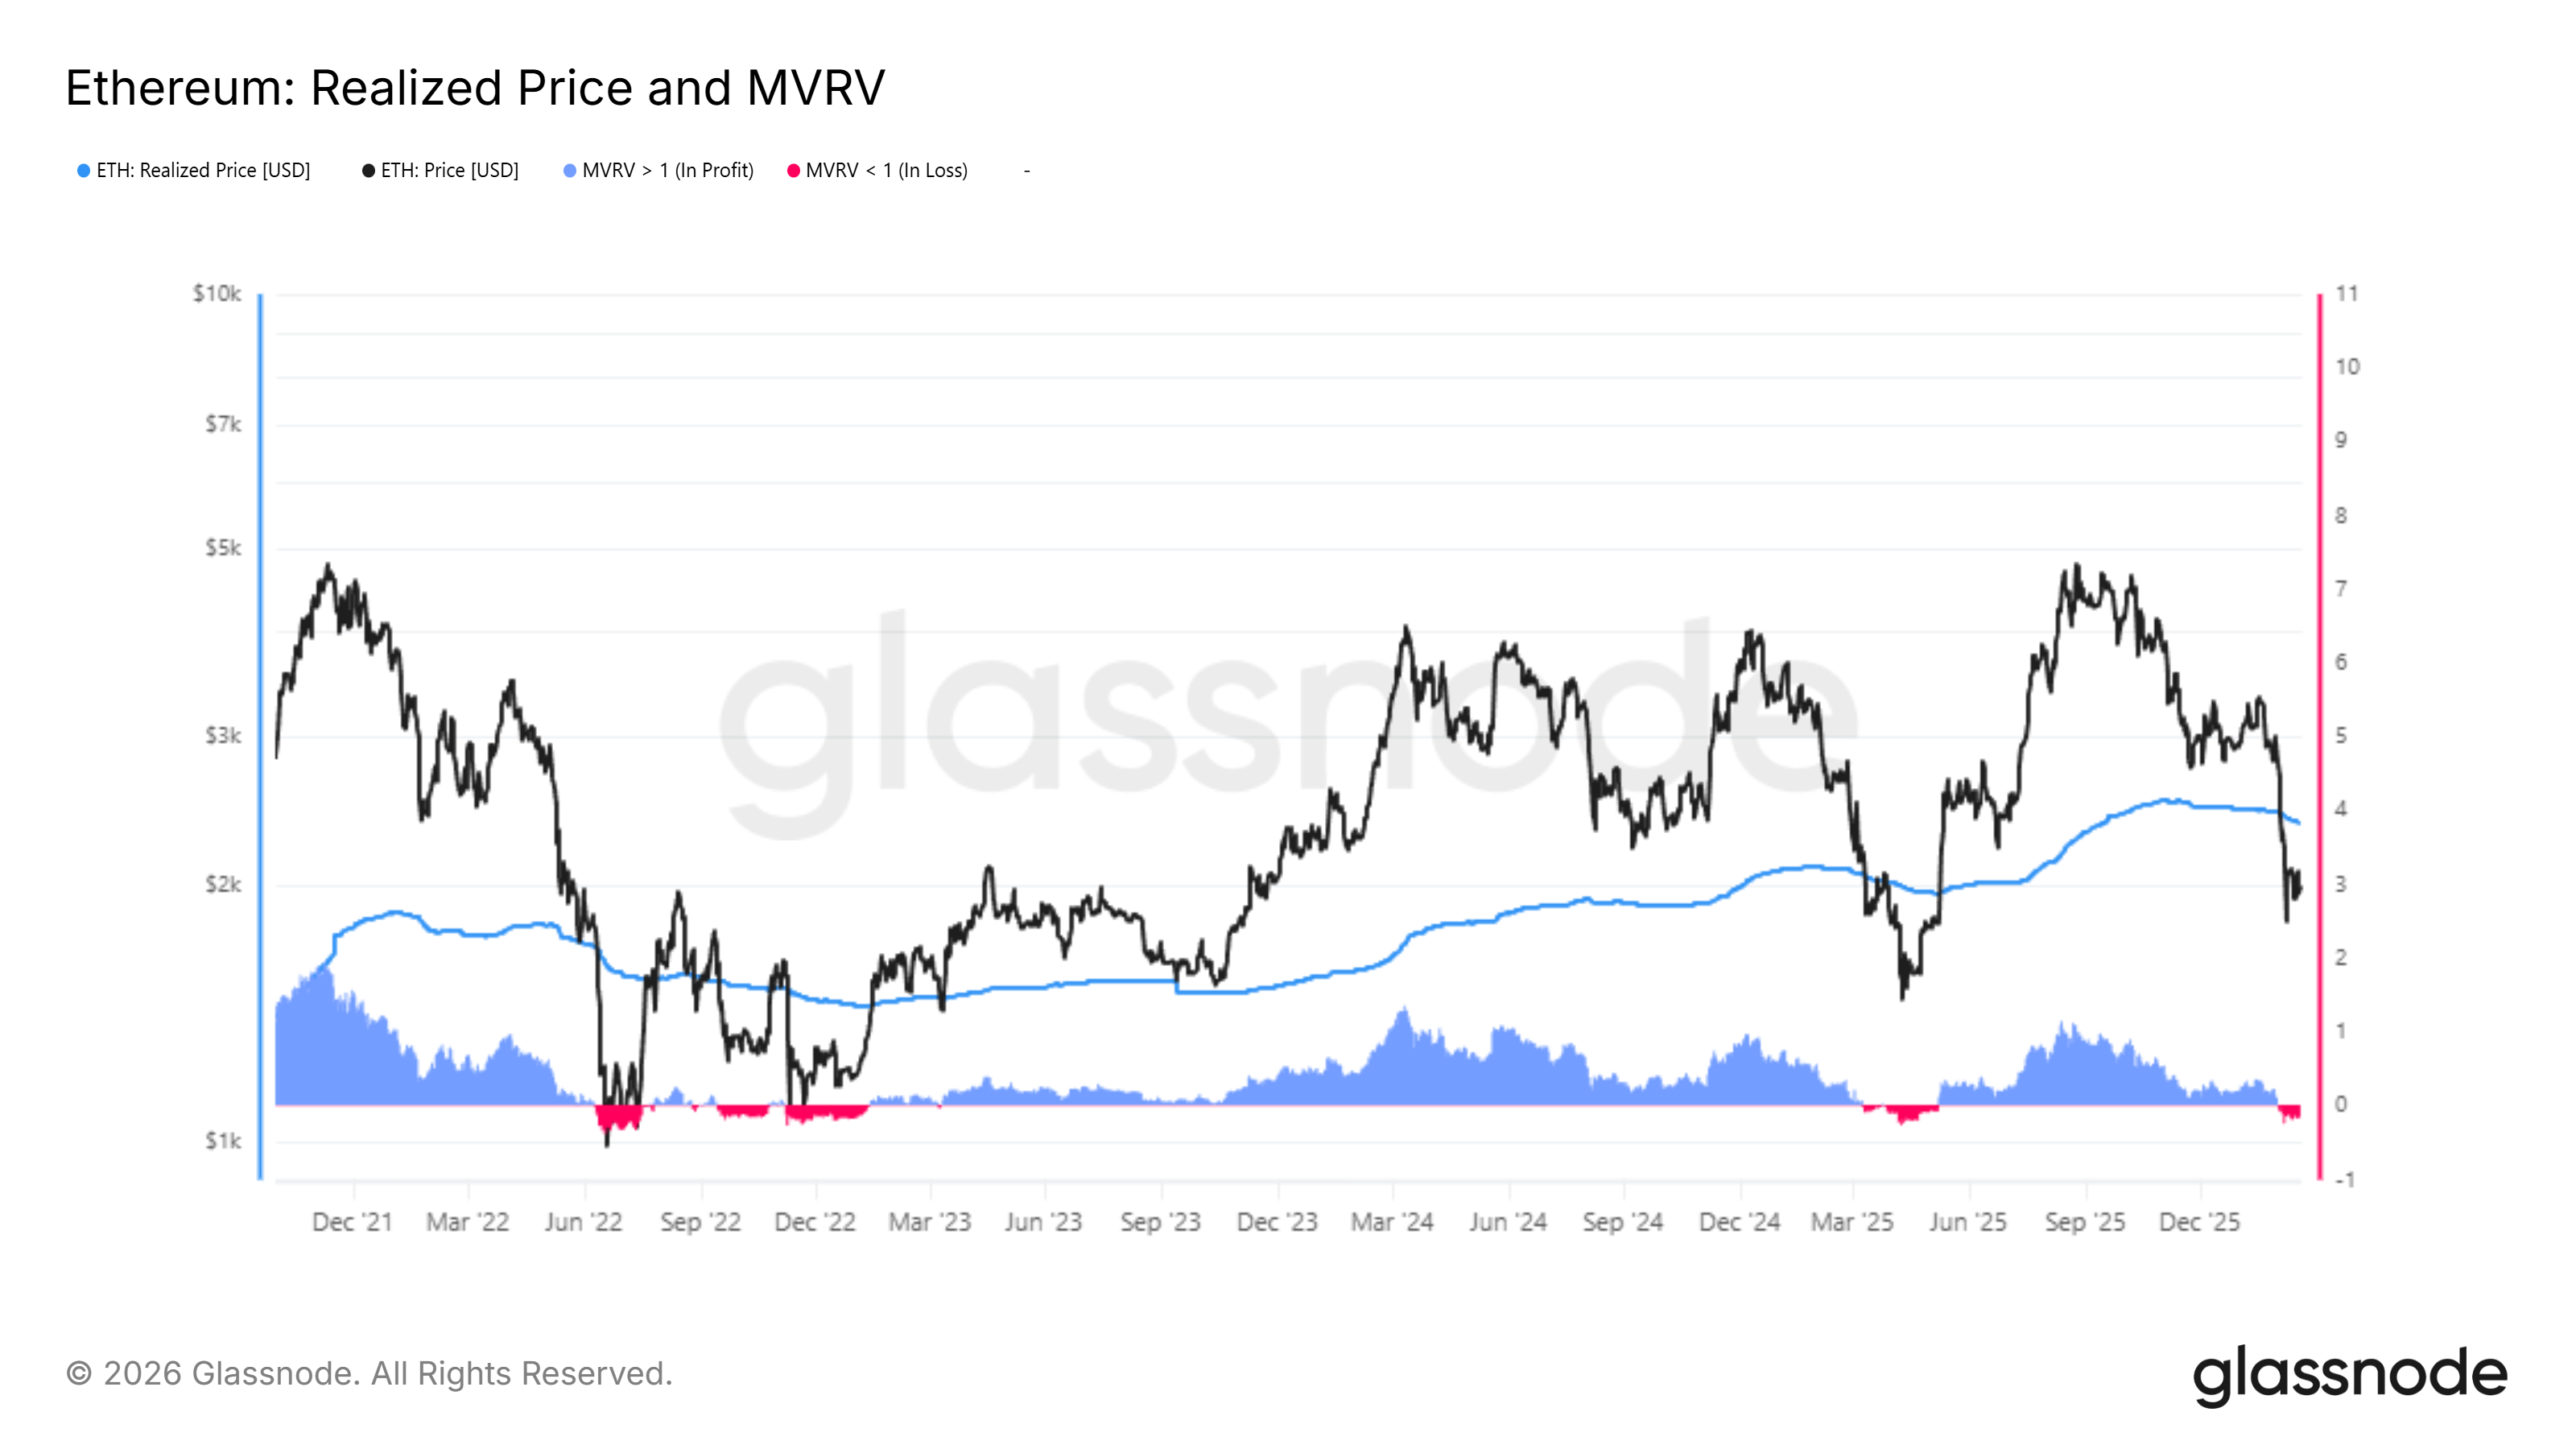
Past cycles show that recovery eventually follows prolonged sub-Realized Price trading. However, such recoveries often occur after capitulation phases. In prior bear markets, ETH experienced additional downside before forming durable bottoms. Current conditions suggest that further decline could precede stabilization.
ETH Selling Is Active
Exchange On-Balance data reveals an increasing supply moving onto trading platforms. Over the past week, approximately 445,000 ETH entered exchanges. At current prices, this represents more than $887 million in potential sell pressure.
Sponsored
Sponsored
Rising exchange balances typically indicate distribution. ETH Investors often transfer assets to exchanges with the intention of selling. The scale of recent inflows suggests heightened caution among holders.
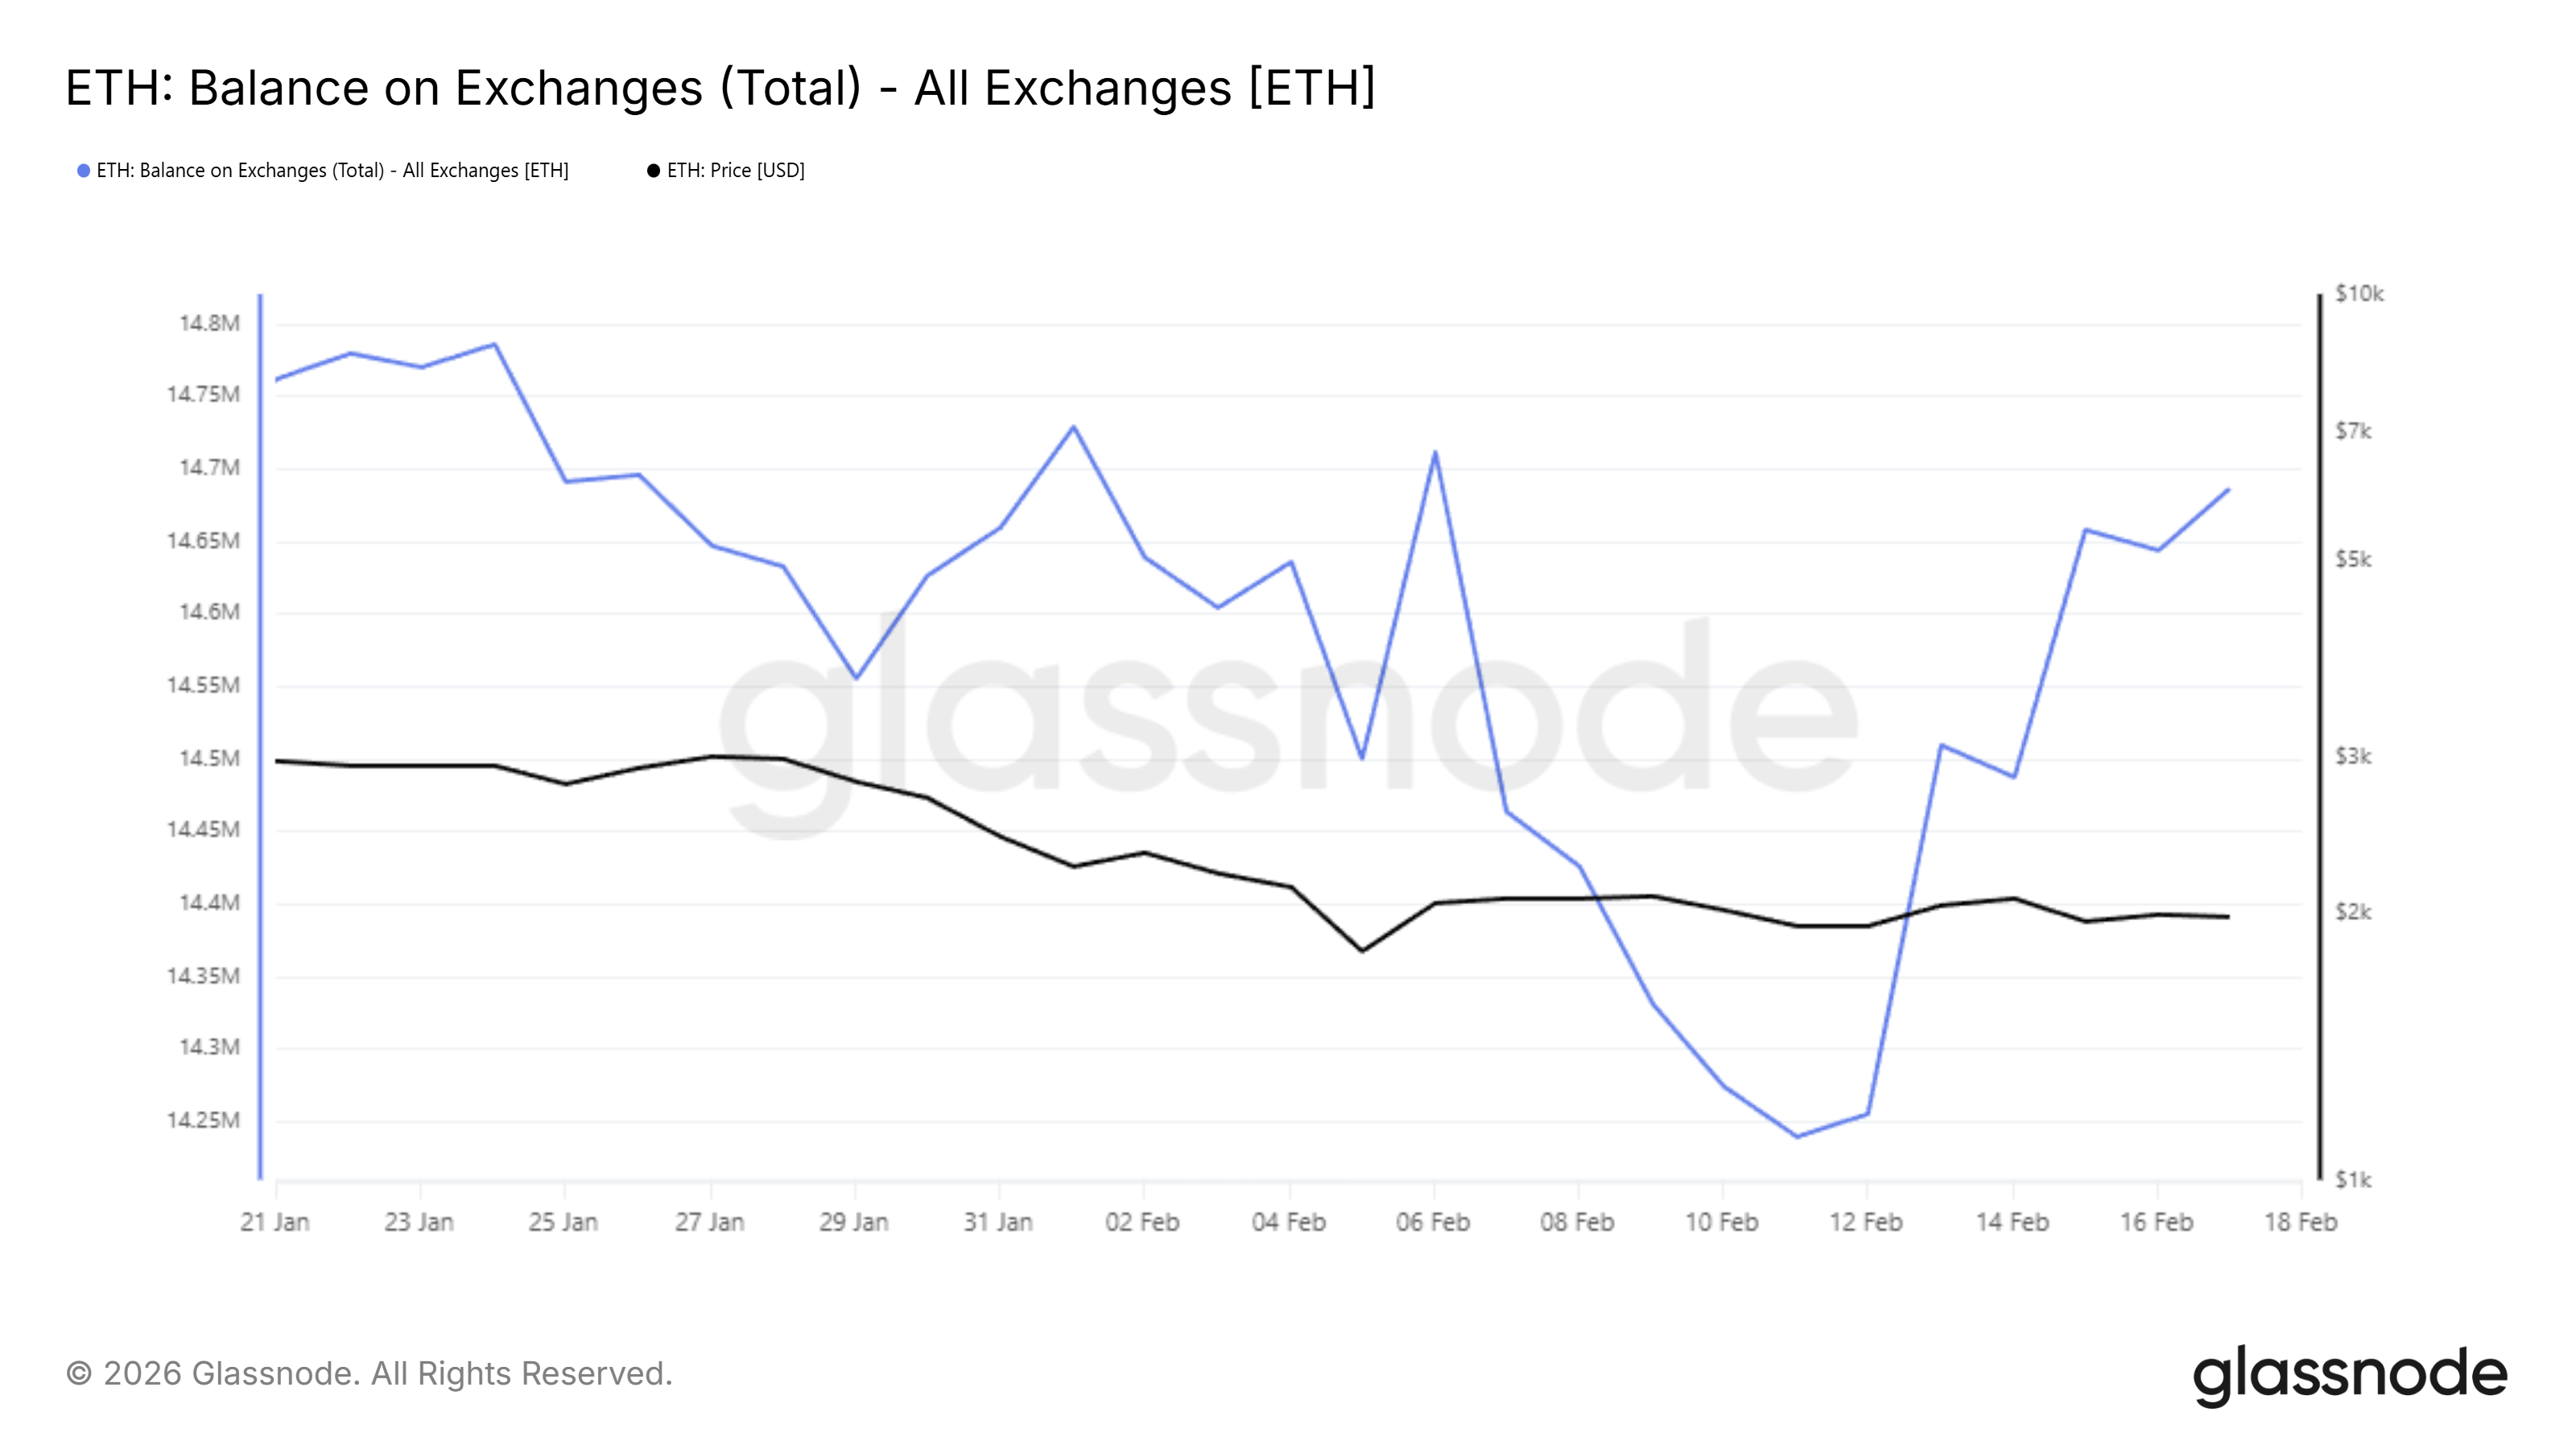
If the price fails to rebound quickly, panic selling could intensify. Similar spikes in exchange deposits have historically preceded sharp drawdowns. The combination of unrealized losses and rising supply increases downside vulnerability.
ETH Price May Witness Further Decline
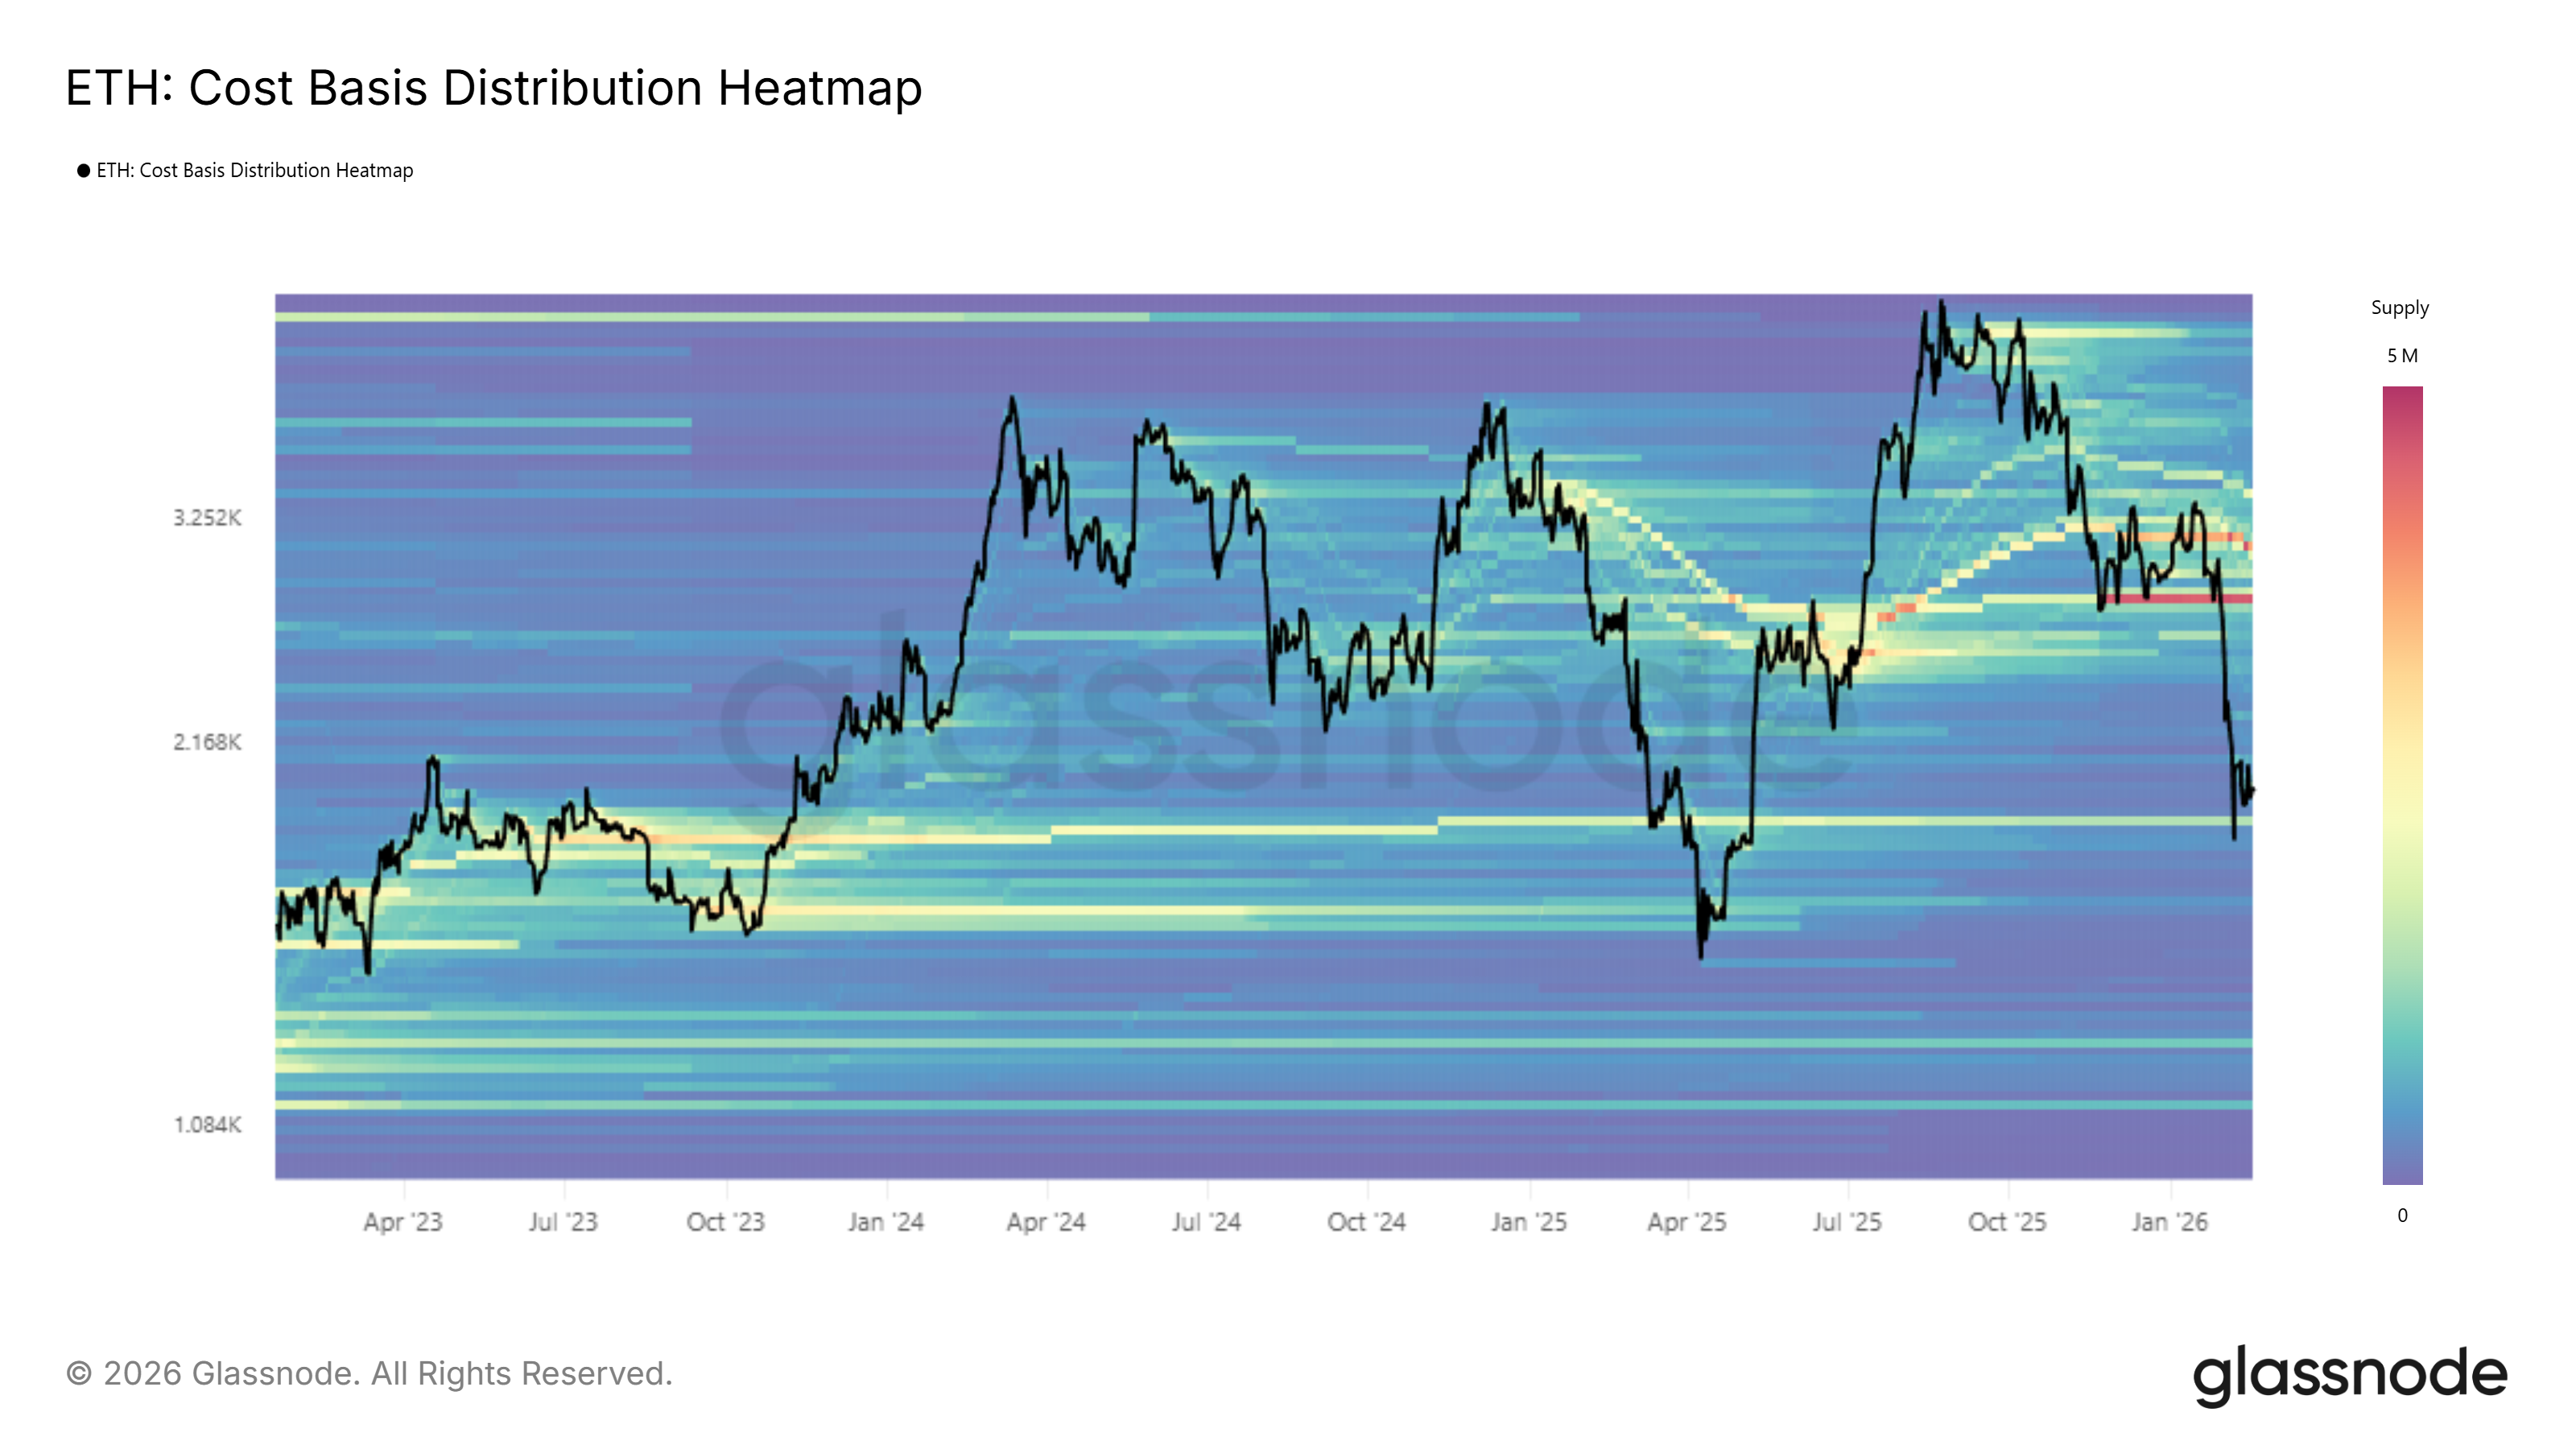
Ethereum is trading at $1,997 at the time of writing. The $2,000 level represents a critical psychological threshold. While this zone may attract short-term buying, persistent selling pressure reduces the probability of a sustained bounce. The $1,866 level represents the next notable support based on the CBD Heatmap.
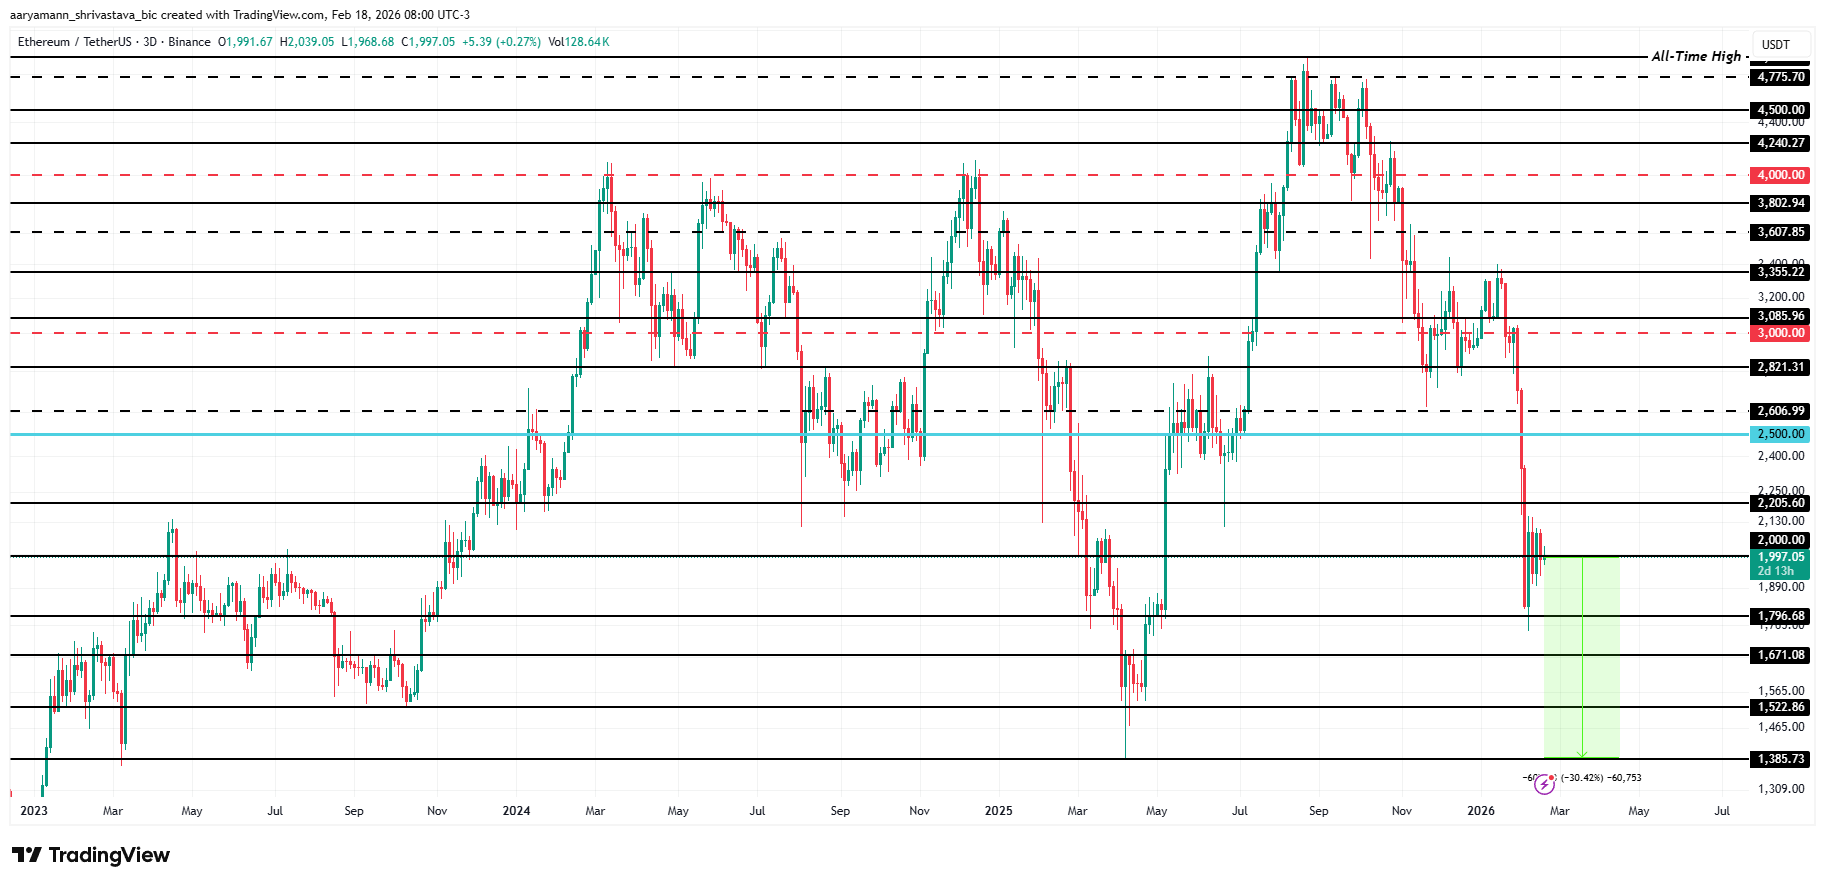
This zone reflects prior accumulation activity. If ETH loses $1,866, downside risk expands toward $1,385. This level has served as a structural bottom during previous cycles. A drop to $1,385 would represent roughly a 30% decline from current levels. The next major support beyond that sits near $1,231.
Conversely, a change in investor behavior could alter the trajectory. If holders reduce exchange deposits and accumulation resumes, ETH could stabilize above $2,000. A rebound may target $2,205 in the short term. Sustained buying pressure could extend gains toward $2,500, invalidating the current bearish outlook.


Crypto funds shifted to market-neutral trades as volatility punished directional bets and triggered a fourth straight month of losses.
Crypto funds opened 2026 with losses and defensive positioning, according to a February 18 survey by Presto Research and Otos Data.
The report shows investors shifting toward relative-value and market-neutral trades as macro uncertainty and price swings weigh on directional bets.
Market-Neutral Funds Outperform as Directional Strategies Sink
According to Presto’s survey, all liquid crypto hedge funds dipped by an average of 1.49% last month. The losses extended a difficult stretch for active managers, marking the fourth consecutive month of negative equally weighted performance across both fundamental and quantitative categories, a sequence not seen since late 2018 and early 2019.
The dispersion within the numbers tells a clearer story, with fundamental funds dropping 3.01% in January, while quantitative funds fell 3.51%. On the other hand, Presto revealed that market-neutral funds, which aim to profit from price differences rather than market direction, gained about 1.6%. Over six months, those same neutral strategies are up nearly 5% while fundamental funds are down more than 24%.
During that same period, Bitcoin (BTC) has fallen approximately 31%, Ethereum (ETH) 23%, and Solana (SOL) 47%.
Analysis by other market watchers supports the fragile tone, with data from Alphractal showing that Bitcoin was trading in a stress zone where weaker holders tend to sell while long-term investors accumulate. The firm’s founder, Joao Wedson, said long-term holder profit levels are still positive, a sign the market may not yet be at a final turning point.
Positioning Data Points to Defensive Posture, Not Panic
The Presto survey’s flow analysis shows a clear behavioral arc through January. The month opened with constructive positioning and call buying, but as rallies failed, traders rotated into tactical fade structures. By the third week, downside hedging became dominant, as ETF flows fluctuated, with periods of inflow offset by miner distribution and whale selling. Meanwhile, corporate accumulation remained present but insufficient to offset broader risk reduction.
You may also like:
Importantly, the report noted that positioning into the month-end was not outright capitulative. The analysts stated that while protection was in place, the leverage looked more orderly compared to the chaotic reset event in October 2025.
The absence of broad panic suggests that stress is building in pockets rather than being expressed as systemic liquidation. This distinction matters as the market assesses whether January represents continuation or exhaustion.
The researchers advised that until policy clarity improves or a structural crypto-specific catalyst emerges, rallies are likely to fade, volatility will stay reactive to headline risk, and adaptability rather than conviction will determine survival in the first quarter of 2026.
Whether January marked a continuation of the bear trend or the exhaustion phase of selling pressure remains an open question. However, at present, the data indicate that strategies that prioritize relative value over directional conviction are successfully navigating the current challenges.
SECRET PARTNERSHIP BONUS for CryptoPotato readers: Use this link to register and unlock $1,500 in exclusive BingX Exchange rewards (limited time offer).
Masked Singer’s Joel Dommett posts adorable video of son revealing show secrets

Trump adviser calls for Fed economists to be 'disciplined'

Dogecoin price tests $0.1 as this chart pattern hints at possible rebound


-

 Sports7 days ago
Big Tech enters cricket ecosystem as ICC partners Google ahead of T20 WC | T20 World Cup 2026
-

 Video2 days ago
Bitcoin: We’re Entering The Most Dangerous Phase
-

 Tech4 days ago
Luxman Enters Its Second Century with the D-100 SACD Player and L-100 Integrated Amplifier
-

 Video5 days ago
The Final Warning: XRP Is Entering The Chaos Zone
-

 Sports2 days ago
GB's semi-final hopes hang by thread after loss to Switzerland
-

 Crypto World1 day ago
Can XRP Price Successfully Register a 33% Breakout Past $2?
-
 Tech2 days ago
The Music Industry Enters Its Less-Is-More Era
-

 Business22 hours ago
Infosys Limited (INFY) Discusses Tech Transitions and the Unique Aspects of the AI Era Transcript
-

 Video2 days ago
Financial Statement Analysis | Complete Chapter Revision in 10 Minutes | Class 12 Board exam 2026
-

 Entertainment8 hours ago
Kunal Nayyar’s Secret Acts Of Kindness Sparks Online Discussion
-
 Crypto World7 days ago
Pippin (PIPPIN) Enters Crypto’s Top 100 Club After Soaring 30% in a Day: More Room for Growth?
-
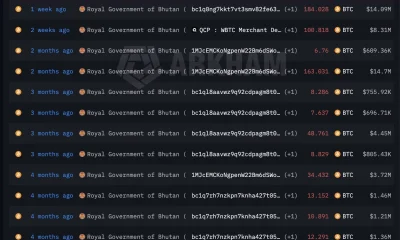
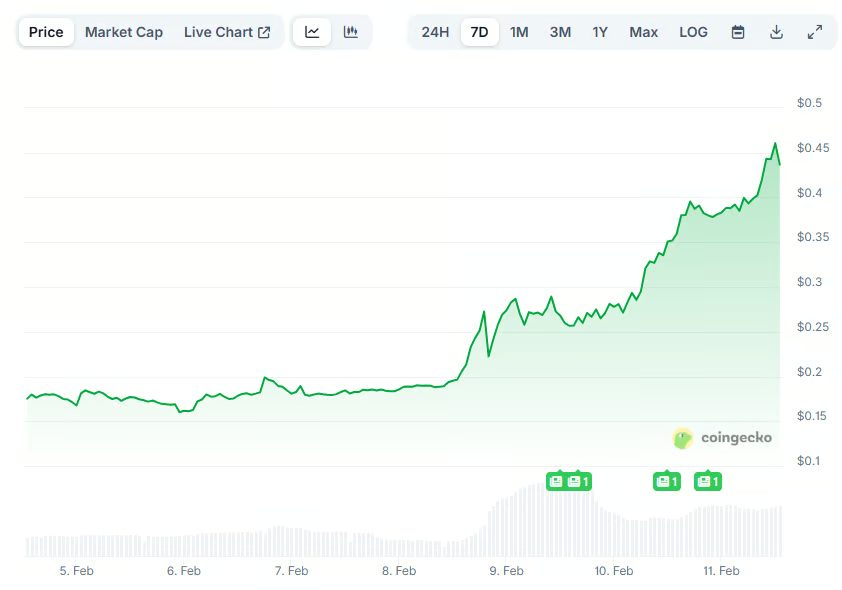
 Crypto World5 days ago
Bhutan’s Bitcoin sales enter third straight week with $6.7M BTC offload
-

 Tech13 hours ago
Retro Rover: LT6502 Laptop Packs 8-Bit Power On The Go
-

 Video7 days ago
Prepare: We Are Entering Phase 3 Of The Investing Cycle
-
 NewsBeat3 days ago
The strange Cambridgeshire cemetery that forbade church rectors from entering
-

 Business6 days ago
Barbeques Galore Enters Voluntary Administration
-

 Business14 hours ago
Tesla avoids California suspension after ending ‘autopilot’ marketing
-
 Crypto World6 days ago
Ethereum Price Struggles Below $2,000 Despite Entering Buy Zone
-

 Crypto World3 hours ago
WLFI Crypto Surges Toward $0.12 as Whale Buys $2.75M Before Trump-Linked Forum
-

 Crypto World5 days ago
Kalshi enters $9B sports insurance market with new brokerage deal