
Crypto World
MemeCore ($M) Pumps 20% Today. Why Is This Meme Coin Still Rallying?
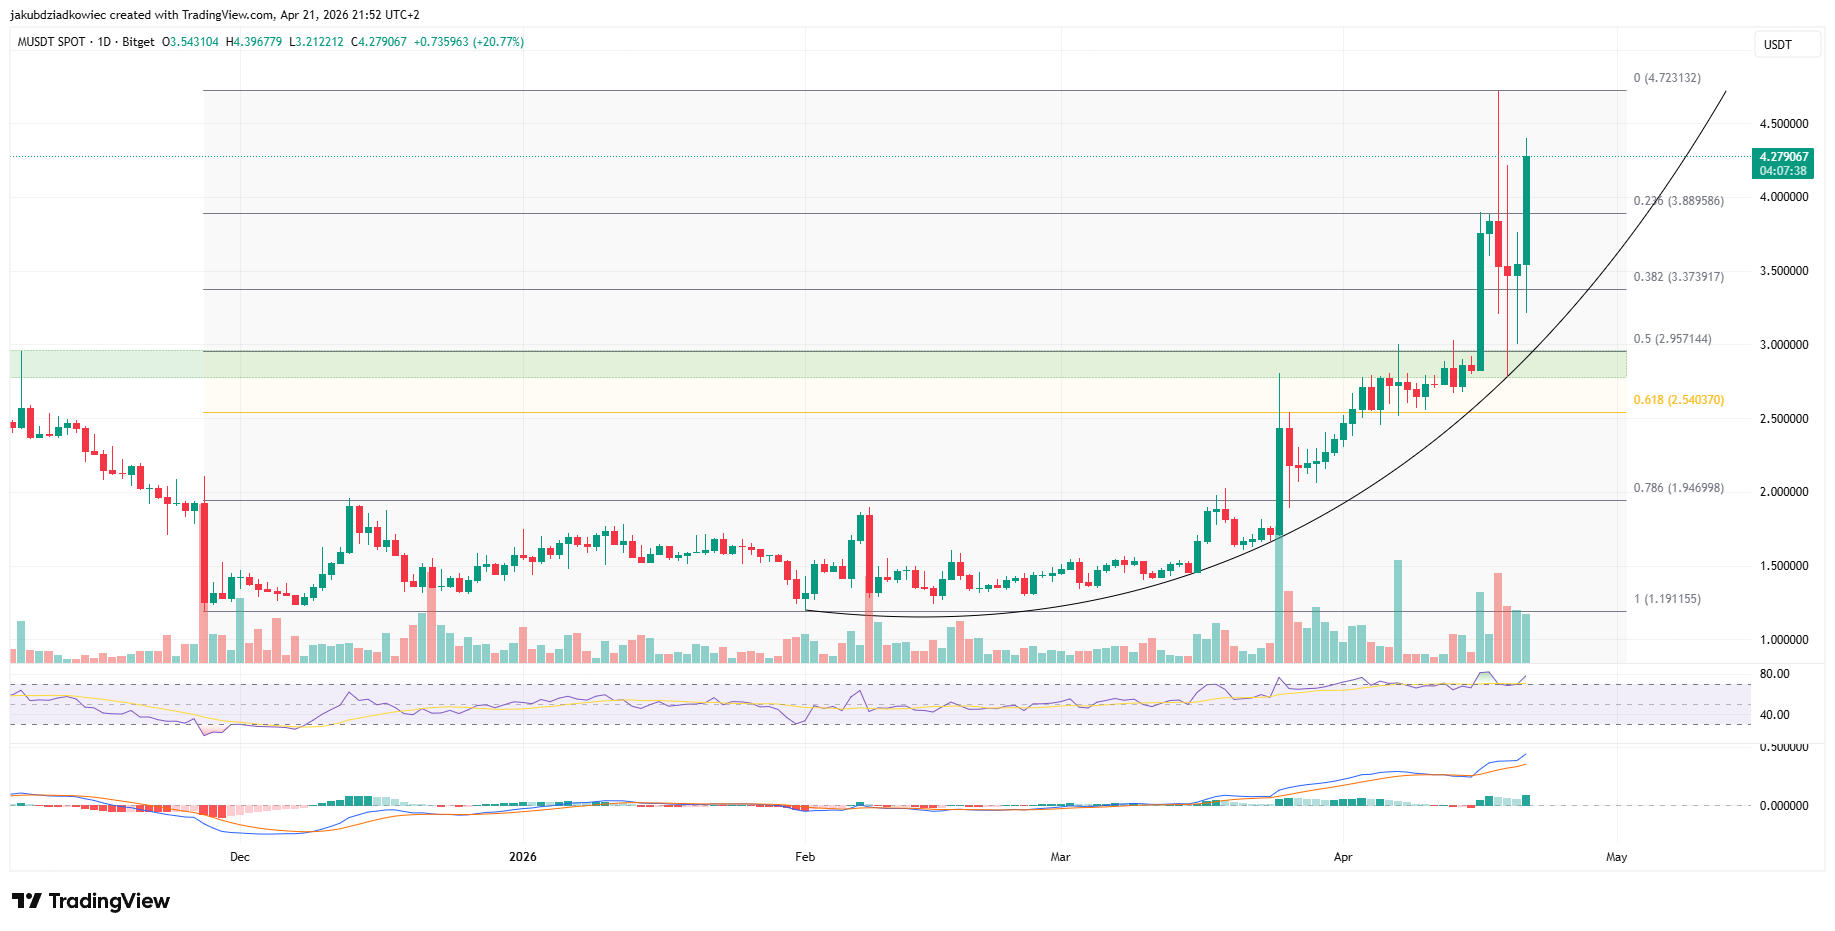
MemeCore (M) surged 20.77% on April 21, 2026, trading near $4.28 and extending a 30-day rally of roughly 145%. The move lifted the meme coin’s market capitalization above $7 billion.
The daily chart points to sustained momentum, while the hourly timeframe shows a clean retest of the ascending trendline. A March network upgrade and a pending Korean expansion deal help explain the underlying strength.
Daily Chart Shows Parabolic Structure Intact
MemeCore’s daily chart frames a parabolic advance that began in late March. Price sits at $4.28 after climbing 20.77% in the session. The April 18 all-time high of $4.72 remains within striking distance.
The Relative Strength Index (RSI) prints near 80 without showing bearish divergence against recent highs. That combination usually signals buyers remain in control, even though the indicator sits inside overbought territory.
MACD continues to widen in positive territory. The histogram has pushed to its tallest reading of the quarter, and previous selloffs from comparable readings required at least a stall in momentum. No such stall has appeared yet.
Fibonacci retracement levels drawn from the $1.19 low to the $4.72 ATH highlight $3.89 as the 0.236 support. A daily close below that zone would be the first sign the parabolic structure is breaking.

MemeCore Price Prediction Targets $4.61 Breakout
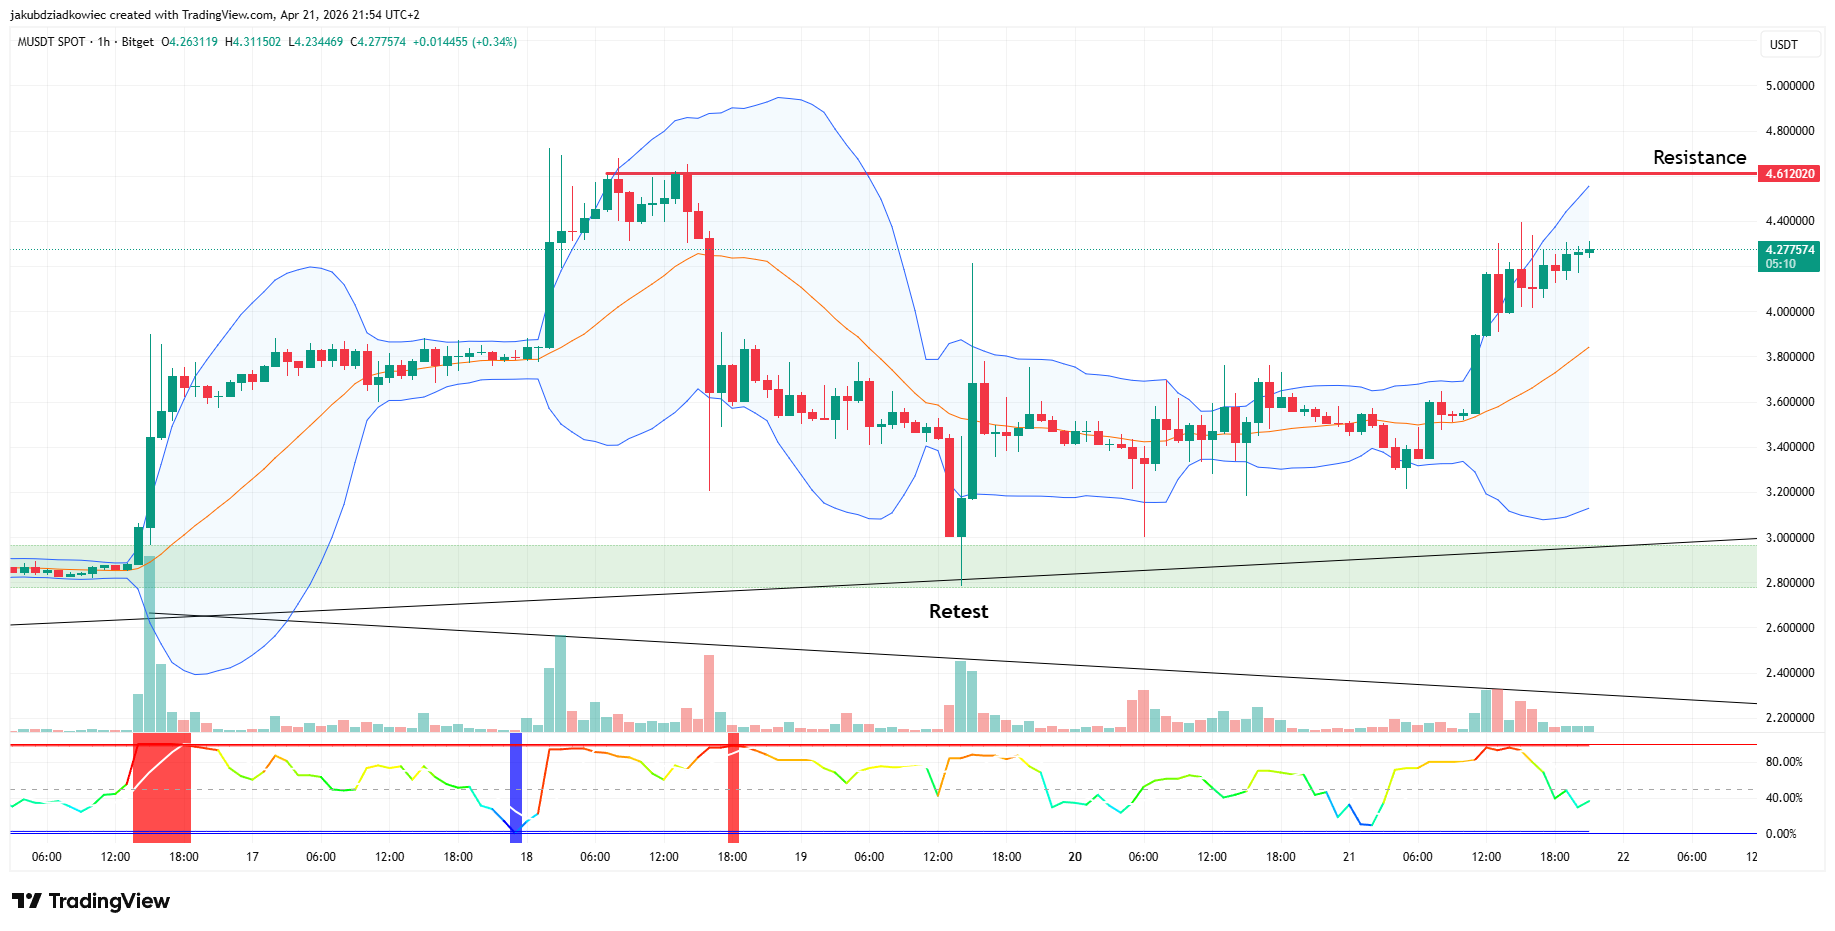
On the hourly timeframe, Bollinger Bands have widened after a brief period of compression. The BBWP (Bollinger Band Width Percentile) printed extreme readings during the latest leg higher.
Wide bands typically signal that volatility is feeding fresh directional momentum rather than mean reversion. The setup often precedes continuation rather than an immediate reversal.
The decisive level overhead is the April 18 swing high at $4.61. That level now acts as the most recent horizontal resistance on the hourly chart.
A four-hour close above $4.61 would open room toward the all-time high at $4.72 and then price discovery. Failure to clear it risks a pullback into the broken trend channel.
Downside risk is defined by the green support band near $2.80, where the ascending trendline was retested earlier this week. Bears need a break of that zone to flip the structure. Bulls only need to hold the current $4.00 handle to keep the setup intact.
Volume on the latest push is healthy, though still below the April 18 spike. That suggests participation is real without reaching euphoria, a detail worth watching if price stalls ahead of a possible reversal.
Why MemeCore Is Still Pumping
Four fundamental drivers help explain the $M rally.
First, altcoin capital rotation is accelerating. The CoinMarketCap Altcoin Season Index has climbed in recent weeks. Meme coins tend to lead once speculative flows return to higher-beta segments of the market.
Second, the pace of the move stands out. A 145% gain over 30 days is hard to attribute to a single catalyst. The tape points to either coordinated accumulation by larger wallets or organic community growth, since typical meme token pumps burn out in a few sessions.
Third, the March 25 MemeCore Hardfork implemented account abstraction. The upgrade cut gas fees from 1,500 gwei to 15 gwei, a 100x reduction. Cheaper transactions make the network more attractive for high-frequency traders and fresh token launches. That shift increases demand for $M as a settlement asset.
Fourth, MemeCore is acquiring a KOSDAQ-listed company to secure a Virtual Asset Service Provider (VASP) license in Korea. Success would enable KRW/M trading pairs and lay the groundwork for a domestic dApp layer. Traders have previously rewarded similar K-play rally stories.
The blend of technical momentum and fundamental catalysts explains why buyers keep stepping in after each shallow dip. The test now is whether $M can close a daily candle above $4.61. A breakout would open the path to a fresh all-time high.
The post MemeCore ($M) Pumps 20% Today. Why Is This Meme Coin Still Rallying? appeared first on BeInCrypto.

![]()
Binance.US has reduced its spot trading fees to 0% for makers and 0.02% for takers across all trading pairs.
Summary
- Binance.US now charges 0% maker fees and 0.02% taker fees across all spot trading pairs.
- The exchange removed volume tiers and subscription rules, making near-zero spot fees available to every user.
- The move increases pressure on Coinbase, Kraken, and Schwab as crypto trading competition grows faster.
The exchange said the new pricing applies to every user and does not depend on trading volume, account size, or subscription plans.
The move replaces the platform’s earlier tiered structure and expands zero-fee access beyond a limited number of Bitcoin pairs. Binance.US said the change takes effect immediately and is designed to lower costs for retail traders using the platform.
New pricing targets pressure from rivals
The updated fee model puts Binance.US below many major rivals in the US market. The company said the new structure could cut trading costs by as much as 98% compared with some competing platforms, where lower-volume users often face higher charges.
Coinbase’s public pricing shows spot fees for lower-volume traders can range from about 0.40% to 0.60%. Kraken also uses a volume-based model, with entry-level fees starting near 0.25% for makers and 0.40% for takers.
Charles Schwab also said last week that it plans to launch spot crypto trading for retail clients, starting with Bitcoin and Ether at a fee of 75 basis points per transaction.
Moreover, Binance.US said the reduced fees are backed by its trading infrastructure and recent internal controls work. The company stated that it completed a SOC 2 Type II audit covering its systems and controls before rolling out the new pricing model.
The change also follows the appointment of Stephen Gregory as chief executive. Binance.US said the broader fee cut builds on its earlier strategy of offering zero-fee trading on selected pairs, but now extends that approach to all spot markets on the platform.
Exchange remains under US scrutiny
The fee cut comes as Binance-related operations continue to face political and regulatory attention in the United States. Binance reached a $4.3 billion settlement with US authorities in 2023 over anti-money laundering and sanctions violations. Former chief executive Changpeng “CZ” Zhao also pleaded guilty to a felony charge as part of that case.
Binance.US has said it operates as a separate legal entity from Binance. A company spokesperson said Binance.US “operates independently from Binance.” Even so, pressure on the broader Binance brand has continued.
In 2026, lawmakers asked federal agencies to review whether Binance is meeting its obligations under a court-ordered monitoring program. Binance denied claims tied to Iran-linked transactions and called the reports “false” and unsupported by evidence.
Fee cut comes as US crypto market gets more competitive
The new pricing shows Binance.US is trying to compete more directly for spot market share at a time when more firms are entering or expanding in the US crypto sector. Lower fees may help the platform appeal to cost-conscious users who trade often and want simpler pricing.
At the same time, the exchange is making that move while the wider Binance group remains under close watch in Washington. That leaves Binance.US trying to balance aggressive pricing with the need to reassure users and regulators about its operating standards.
ETH derivatives show strong buyer dominance, leading traders to target $2,500 to $2,600 as the next crucial rally.
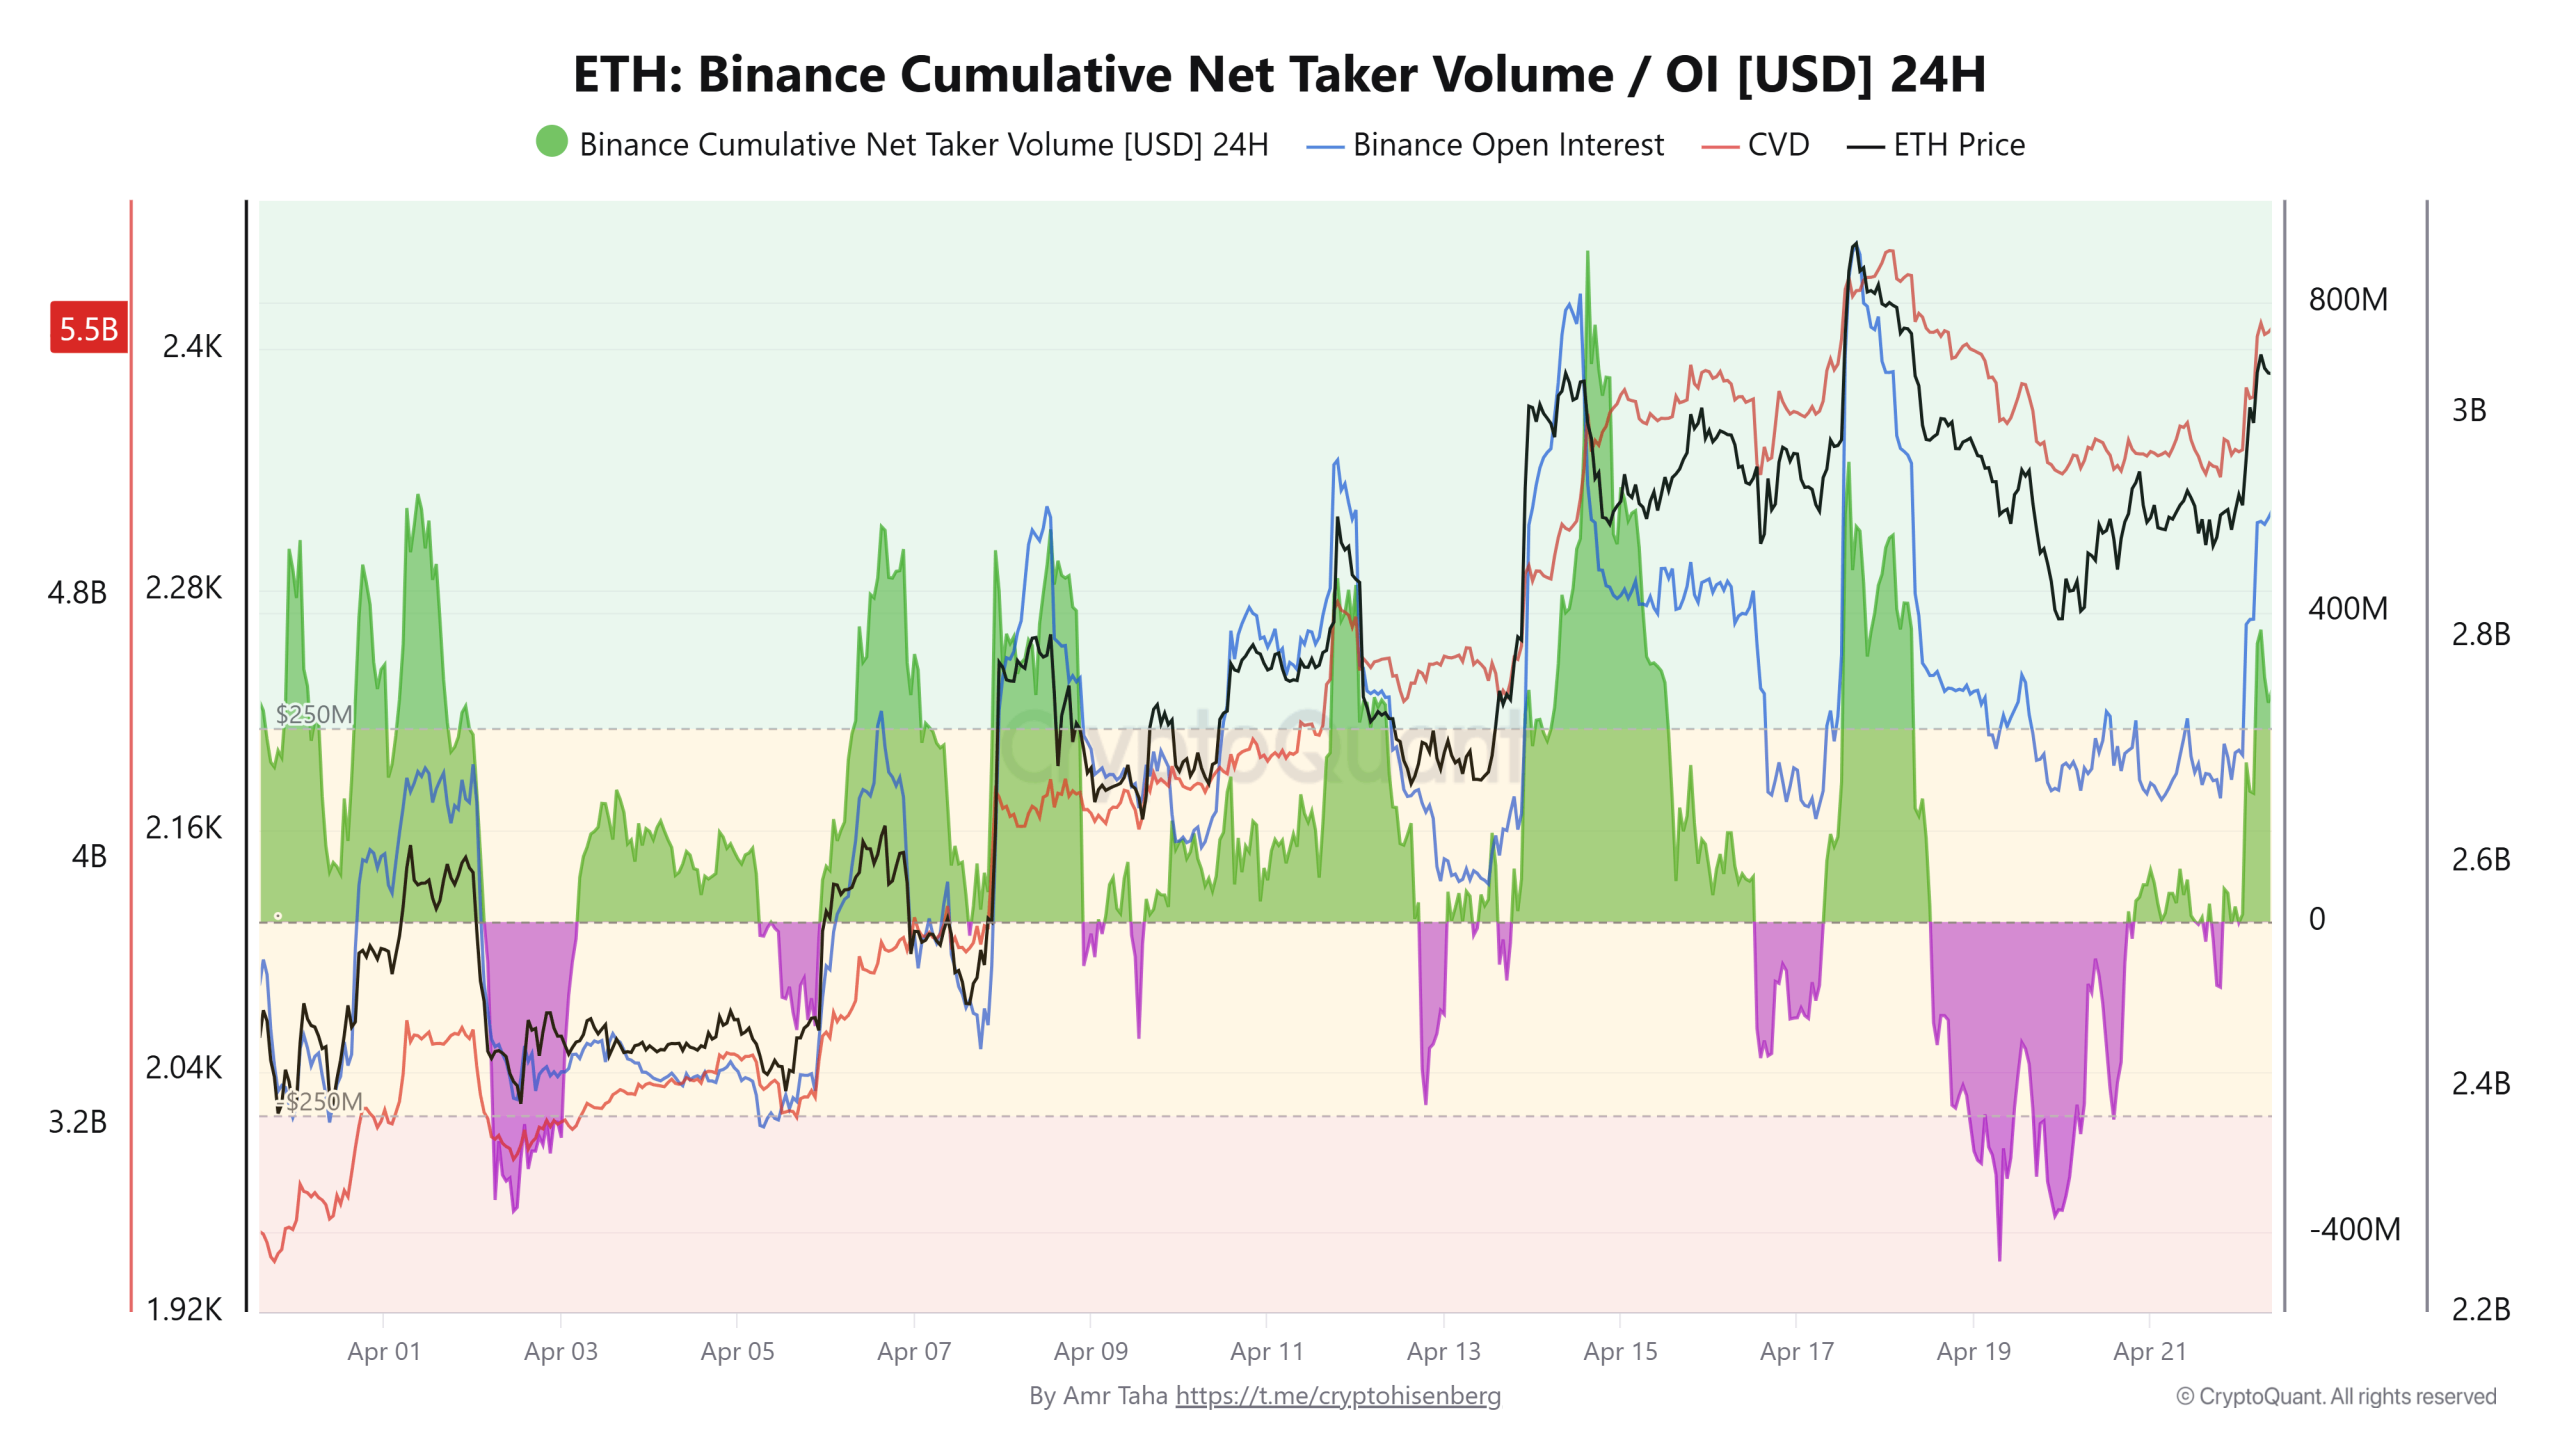
Ether (ETH) futures on Binance have risen to a near two-month high as aggressive buyers stepped into the market over the past week. Buy-taker volume rose above $5 billion, and the current setup suggests the ETH rally is poised to continue.
On Binance, the 24-hour cumulative net taker volume reached $5.5 billion, rising 72% from $3.2 billion earlier in the month. The metric tracks the difference between market buy and sell orders, indicating who is driving price action.

The 30-day average has stayed positive since March 1, returning to levels last seen in July 2022. The positive readings point to consistent buyer aggression.

Crypto analyst Amr Taha explained that when the buying spikes near local highs, it signals stronger conviction from participants. The sustained demand of this kind often keeps buyers in control of the short-term price direction.
Related: The quantum gap: Why Bitcoin and Ethereum are taking different paths on security
Ether’s $2,400 resistance hits a liquidity gap
The ETH price is compressing under the $2,400 level, a resistance that has been tested three times since Feb. 6. Each rejection has reduced the density of the overhead sell orders. A clean move above this level exposes the $2,475–$2,634 range, where a daily fair-value gap lies.
The gap formed during February’s sell-off marks an area where price moved quickly, leaving unfilled orders. ETH’s price may revisit these zones to rebalance flows as the momentum builds.

Ether is also attempting to reclaim the 100-day exponential moving average (EMA), a level associated with trend-continuation phases. The stability above this trend would reinforce the upward rally. The 200-day EMA is drifting toward the upper end of the imbalance zone near $2,634, creating a technical overlap with liquidity.
The derivatives positioning adds context. The futures cumulative volume delta (CVD) continues to climb toward $12.6 billion, while funding rates remain near neutral.
This indicates leverage has not expanded aggressively alongside price. The balance between buyers’ demand and measured leverage keeps the $2,475–$2,634 zone in focus as a near-term liquidity cluster.

Related: Singapore’s OCBC launches tokenized gold fund on Ethereum and Solana
This article is produced in accordance with Cointelegraph’s Editorial Policy and is intended for informational purposes only. It does not constitute investment advice or recommendations. All investments and trades carry risk; readers are encouraged to conduct independent research before making any decisions. Cointelegraph makes no guarantees regarding the accuracy or completeness of the information presented, including forward-looking statements, and will not be liable for any loss or damage arising from reliance on this content.


Key Highlights
- BTC surged to $79,472 on Wednesday, marking its strongest monthly performance since April 2025
- The positioning index for Bitcoin climbed to 4.5 from February’s -10.9, indicating strengthening market sentiment
- Total open interest increased 6.7% within 24 hours to reach 260,000 BTC, while futures OI jumped nearly 9% to $62B
- Optimism surrounding potential US-Iran peace negotiations lifted risk-on assets across markets
- Critical resistance levels are positioned at $83,000–$88,000, while support maintains around $72,000–$75,000
Bitcoin achieved a monthly peak of $79,472 during Wednesday’s trading session, representing its most robust 28-day gain since April 2025. The flagship cryptocurrency advanced more than 4% within a single day, approaching the psychologically significant $80,000 threshold as various blockchain analytics and derivatives indicators exhibited positive momentum.
Cryptocurrency analyst Axel Adler Jr. highlighted that the Bitcoin positioning index advanced to 4.5, a substantial improvement from February’s reading of -10.9. This composite indicator monitors net taker flow patterns, open interest dynamics, funding rate behavior, and exchange balance shifts through a unified measurement.
Total open interest expanded by 6.7% across a 24-hour period, reaching 260,000 BTC. The rolling 30-day change in open interest currently registers at +14.5%, with 23 out of the last 30 trading sessions concluding in positive territory.
Futures open interest for BTC experienced a dramatic surge of nearly 9%, pushing above the $62 billion threshold. CME’s open interest advanced 0.50% while Binance registered close to 2% growth following President Trump’s remarks regarding diplomatic negotiations.
President Donald Trump indicated that diplomatic discussions between the United States and Iran could potentially commence as early as Friday, as reported by the New York Post. This announcement followed his determination to extend the Iran ceasefire agreement without a defined endpoint.
Equity markets in the United States also registered approximately 1% gains on Wednesday, with the S&P 500, Nasdaq 100, and Dow Jones Industrial Average all posting advances. Risk-oriented assets responded favorably across the board to the geopolitical developments.
Iranian officials have yet to confirm their participation in the proposed negotiations. Complicating matters, Iranian military forces reportedly seized two commercial cargo vessels near the strategically important Strait of Hormuz just hours following the ceasefire extension announcement, introducing additional uncertainty.
Critical Price Zones Under Observation
Bitcoin has successfully breached a downward-sloping trendline originating from its October 2025 all-time high near $126,000 and recaptured the 100-day exponential moving average. The immediate test zone sits at $81,000, where a fair-value gap indicates potential liquidity imbalances.
The $83,000–$85,000 range represents a probable profit-realization zone for short-term position holders. Beyond that threshold, the $88,000–$91,000 corridor marks a significant supply concentration where substantial trading volumes previously occurred.
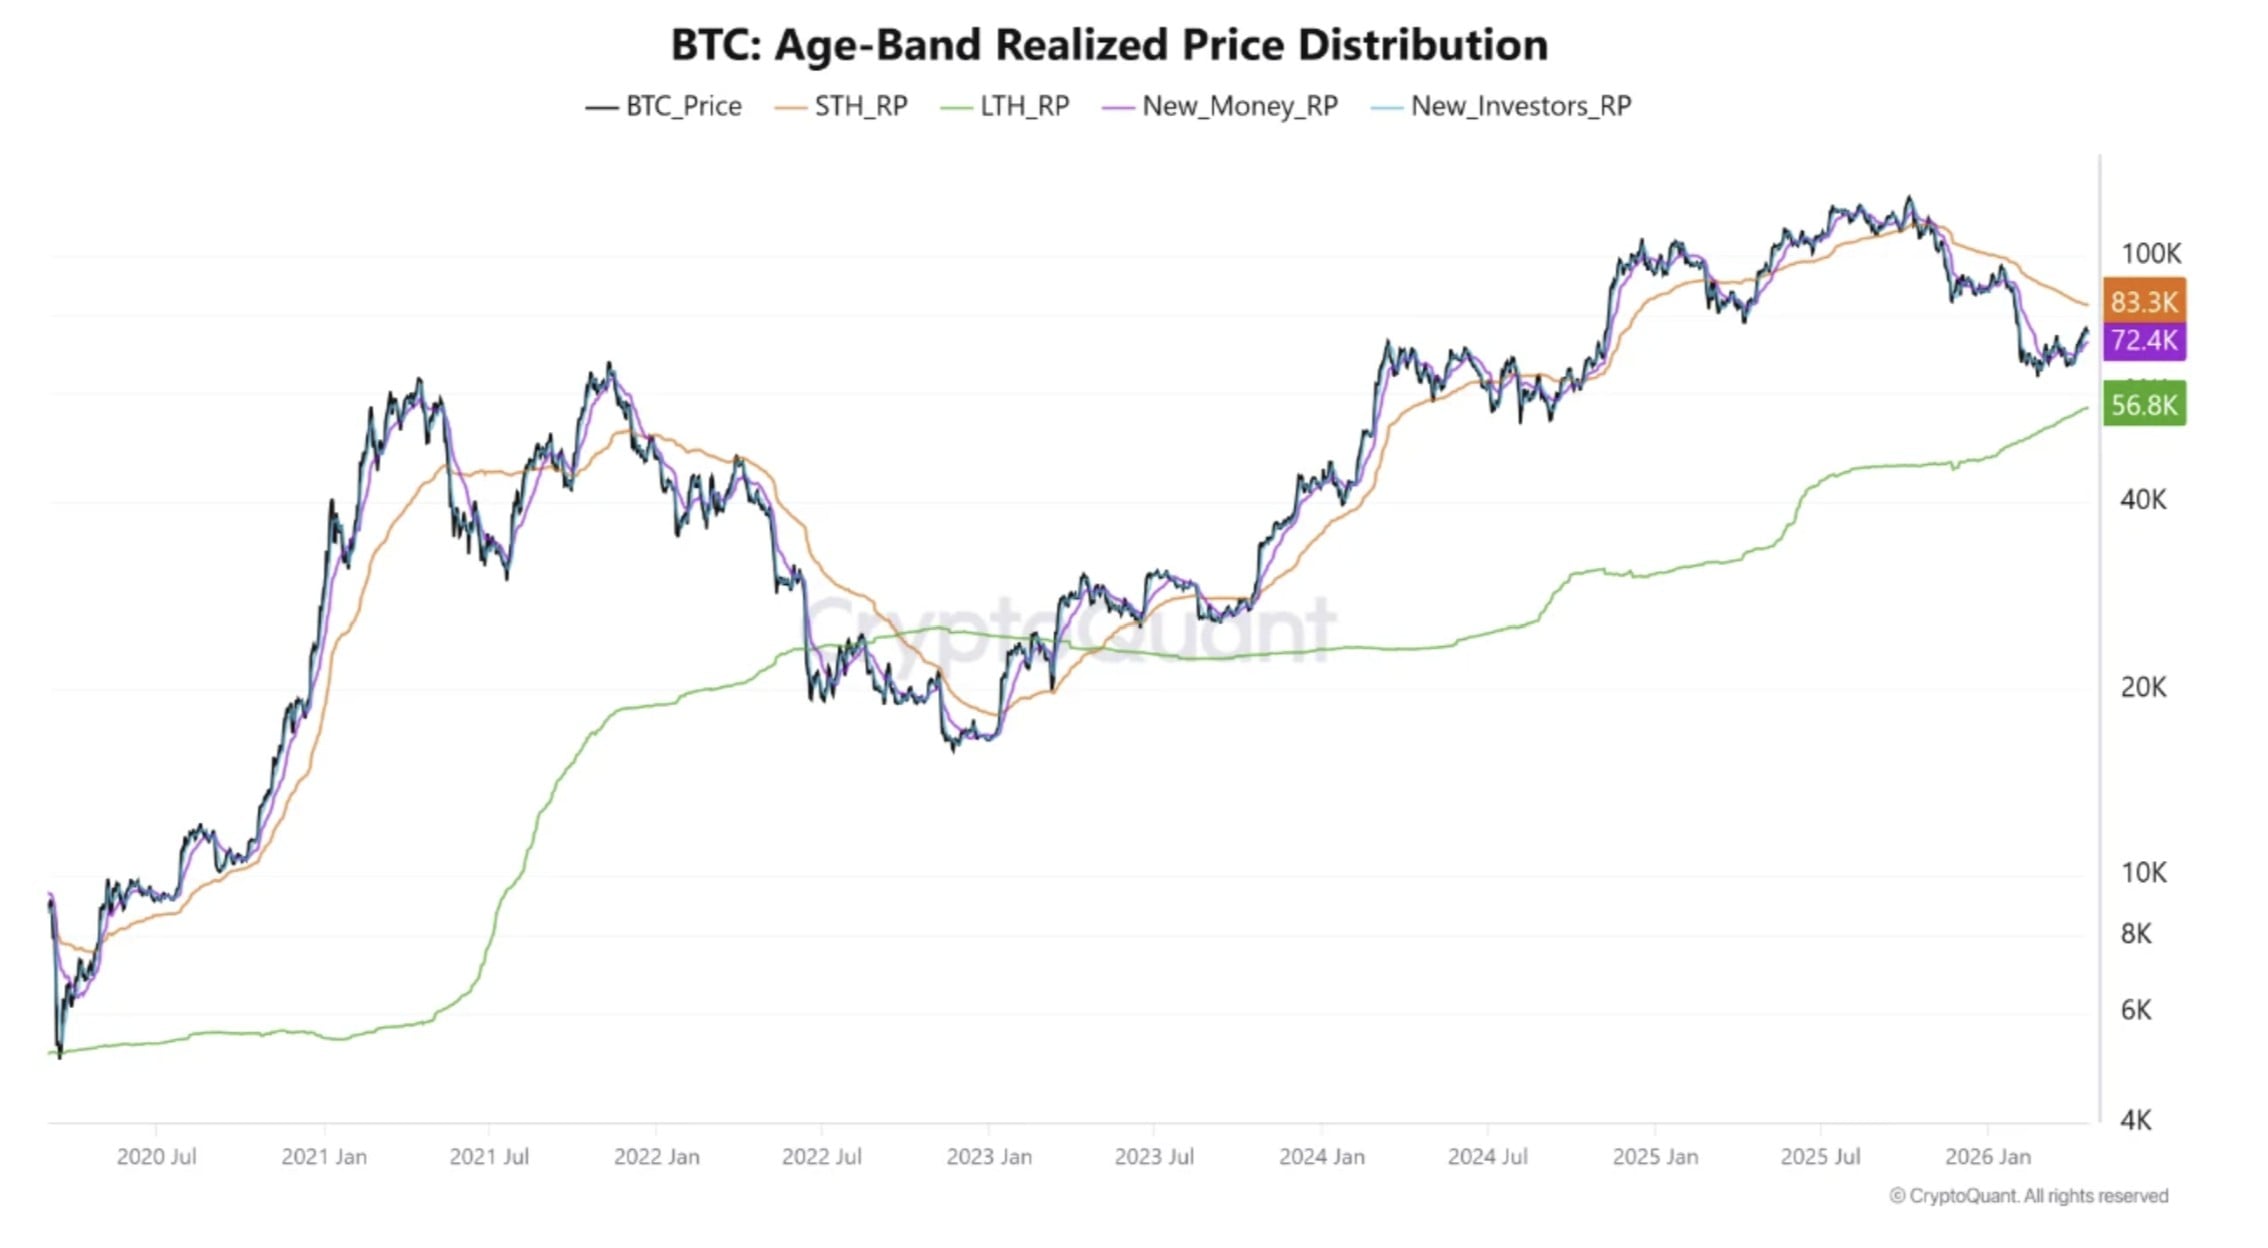
The realized price for holders in the three-to-six-month cohort currently stands at $91,600, reinforcing this range as a pivotal decision zone for market participants.
Market analyst Ali Charts identified a Morning Star candlestick formation developing on Bitcoin’s monthly timeframe — a three-candle reversal pattern that he interprets as evidence of seller exhaustion and emerging buyer dominance. According to his historical analysis, price action typically experiences an approximate 8% retracement before the primary upward movement initiates.
Support Zones and Downside Scenarios
Analyst Crazzyblockk pinpointed the $72,000–$75,000 range as a robust support foundation, reinforced by realized price concentrations from intermediate-term holders. A decisive break beneath this band could force additional supply into underwater positions.
Grayscale Research had previously indicated that Bitcoin most likely established a bottom formation within the $65,000–$70,000 corridor. The Bitcoin Bull Index shifted to neutral territory for the first time in half a year, according to CryptoQuant’s head of research, Julio Moreno.
Trading volumes contracted by 32% throughout the price recovery, suggesting measured caution among market participants despite the upward price movement.
BTC futures open interest across both CME and Binance platforms continued their upward trajectory as of Wednesday afternoon, reflecting sustained positioning activity in derivatives markets.

The U.S. Securities and Exchange Commission is approaching the release of an innovation-focused exemption intended to enable limited onchain trading of tokenized securities within a clearly cabined and compliant framework. The revelation comes from remarks by SEC Chair Paul Atkins at the Economic Club of Washington, signaling a deliberate step toward regulated experimentation in tokenized markets while the agency continues to flesh out longer-term rules. According to Cointelegraph’s coverage of the remarks, the exemption would provide a structured pathway for market participants to facilitate trading of blockchain-based securities without altering the agency’s broader securities framework.
In remarks that have drawn attention across regulatory and market circles, Atkins described the move as a pragmatic mechanism to facilitate regulated activity in tokenized markets in the near term, even as the commission works toward more comprehensive, future rules. “We are on the cusp of releasing what I call an ‘innovation exemption,’ which will provide market participants with a cabined framework to begin facilitating the trading of tokenized securities onchain in a compliant fashion as the Commission works toward long-term rules of the road,” he said. The November timing and the framing as a temporary, work-in-progress measure reflect a balance between investor protection and practical market development.
The exemption would not grant a broad license to tokenize securities, but would establish a controlled pathway for entities seeking to support onchain trading of digital securities. It aims to unblock limited pilot activities that could yield insights into how existing securities laws apply to blockchain-enabled markets, while preserving a strong supervisory framework. Atkins’ comments come after months of SEC deliberations on how tokenized securities should fit within the agency’s jurisdiction and how markets might operate under a clearer, interim structure. As context, he noted in July 2025 that the agency had been weighing targeted relief to support tokenization and new trading methods, underscoring a phased approach rather than an immediate overhaul of securities law.
Earlier, Commissioner Hester Peirce indicated that staff were still developing the exemption, seeking to balance experimentation with careful assessment of how onchain markets interact with current securities statutes. These discussions are part of the SEC’s larger project to clarify digital asset classifications and their regulatory treatment, as the agency continues to refine its approach to tokenized instruments while pursuing longer-term policy objectives.
Key takeaways
- The SEC is nearing an “innovation exemption” to permit cabined, onchain trading of tokenized securities within a compliant framework.
- The exemption would create a structured pathway for firms to facilitate tokenized securities trading as the SEC develops longer-term rules.
- The move builds on the agency’s token taxonomy guidance and its broader effort to delineate which digital assets fall under securities laws.
- The White House is reviewing the related interpretive guidance, with a formal decision still pending as of the latest updates.
- Market participants—exchanges, issuers, broker-dealers, and banks—will need to align compliance programs, licensing considerations, and AML/KYC processes with the evolving framework.
Strategic rationale behind the innovation exemption
The proposed exemption represents a measured attempt to address real-world constraints that have limited the growth of tokenized securities in the United States. By providing a cabined framework, the SEC seeks to enable permissible experimentation with blockchain-based trading while ensuring investor protection, auditability, and ongoing regulatory oversight. The approach acknowledges a regulatory gap: tokenized securities can leverage the benefits of distributed ledgers and programmable settlement, yet lack a clear, interim path for compliant operation. The exemption is intended as a practical stepping stone, allowing market participants to explore onchain mechanics, settlement, disclosure, and oversight within defined guardrails as the SEC implements longer-term rulemaking.
We are on the cusp of releasing what I call an “innovation exemption,” which will provide market participants with a cabined framework to begin facilitating the trading of tokenized securities onchain in a compliant fashion as the Commission works toward long-term rules of the road.
According to Cointelegraph’s reporting on Atkins’ remarks, the emphasis is on a controlled, up-and-running pilot path rather than an open-ended market license. The approach is intended to reduce regulatory ambiguity, support orderly transitions from traditional markets to tokenized equivalents, and inform subsequent rulemaking through practical experience. In this framing, the exemption serves as a bridge between today’s securities framework and tomorrow’s potentially tokenized market structure.
Regulatory scaffolding: taxonomy, guidance, and interagency process
The development of an innovation exemption sits within the SEC’s broader effort to clarify how digital assets are treated under federal securities laws. In March, the agency issued interpretive guidance that outlined a token taxonomy, categorizing digital assets into digital commodities, collectibles, tools, and stablecoins, with tokenized securities placed under the SEC’s core jurisdiction. The taxonomy was described as a long-overdue clarifying step intended to delineate when securities laws apply to onchain activities and how the SEC intends to coordinate with other regulators, notably the Commodity Futures Trading Commission.
The interpretive guidance was presented as a transitional tool ahead of potential market-structure legislation and as a means to establish clearer lines of authority in the evolving digital-asset landscape. In late March, the agency circulated the proposed interpretation to the White House for review, a step that regulators commonly take before formal publication. As of the latest records, the proposal remained under White House consideration, illustrating the cross-cutting nature of tokenized markets and the need for interagency alignment. The ongoing review underscores the regulatory complexity and the potential for cross-border differences in treatment of digital assets, including how MiCA and similar frameworks may interact with U.S. policy goals.
In parallel, SEC officials and commentators have framed the taxonomy as a bridge to future market structure legislation and as a means to delineate the SEC’s role relative to the CFTC. Atkins has described the taxonomy as a necessary, long-overdue step toward clearer rules for digital assets, signaling that the agency’s stance is moving toward greater clarity even as it pursues incremental, testable reforms in the near term. The White House review and potential alignment with broader international standards are likely to influence the precise scope and conditions of any innovation exemption.
Implications for market participants and compliance programs
For exchanges, broker-dealers, asset managers, and banking counterparts, the proposed exemption signals a shift from theoretical policy debates to pragmatic, rules-based experimentation. If adopted, the cabined framework would require firms to implement enhanced controls around onboarding, AML/KYC, trade reporting, collateral management, and disclosures—areas where the SEC has consistently emphasized investor protection and market integrity. Compliance programs would need to stay adaptable, balancing rapid experimentation with robust risk management, and ensuring alignment with continuing rulemaking and enforcement priorities.
The exemption would also have implications for licensing and supervisory oversight. As tokenized securities trading onchain expands, firms may require specific registrations or exemptions under the Securities Act, along with ongoing supervision by the SEC. Cross-border participants could face additional considerations, given diverging regulatory approaches in other jurisdictions and the EU’s MiCA framework, which adds another layer to global coordination on tokenized markets. The approach aims to reduce the risk of regulatory gaps, but it also raises questions about the timing, scope, and sequencing of enforcement actions as activities scale beyond pilot phases.
From an enforcement and compliance perspective, the interim nature of the exemption means firms should monitor evolving guidance, interpretive interpretations, and White House decisions closely. The pathway emphasizes transparency, recordkeeping, and clear delineation of the activities permitted under the cabined framework. Market participants may need to adjust internal controls to differentiate between permitted tokenized trading and activities that remain outside the exempted scope, ensuring that participation remains within regulatory boundaries while contributing data and experience to inform longer-term policy design.
Closing perspective
The push toward an innovation exemption highlights a deliberate, regulator-led balance between enabling structured experimentation in tokenized securities and preserving core investor protections. As White House review progresses and the SEC’s token taxonomy guidance continues to shape jurisdictional boundaries, market participants should prepare for a transitional period in which pilot activity informs future rulemaking, licensing requirements, and cross-agency coordination. The coming months will reveal how progressively clarified rules will interact with ongoing developments in both U.S. policy and global regulatory approaches, including MiCA considerations and cross-border supervision.
Crypto World
World Liberty accuses Justin Sun of ‘misconduct’ in response to Tron founder’s defamation claims


Ten months ago, Eric Trump was posting on X about how much he loved Justin Sun. This week, he’s likening a lawsuit from Sun to the infamous $6 million duct-taped banana.
Sun filed a complaint Monday in the Northern District of California, accusing World Liberty Financial of illegally freezing roughly four billion $WLFI tokens worth around $1 billion. The Trump-family-backed DeFi venture’s informal Tuesday response dismissed the suit as a “desperate” deflection and pledged to keep protecting its users, with co-founder Zach Witkoff accusing Sun of “misconduct.”
Justin Sun’s recent lawsuit against @worldlibertyfi is a desperate attempt to deflect attention from Sun’s own misconduct. His claims are entirely meritless, and World Liberty looks forward to getting the case thrown out promptly.
He engaged in misconduct that required World…
— Zach Witkoff (@ZachWitkoff) April 22, 2026
Neither he nor the company spelled out Sun’s alleged misconduct. A spokesperson for the firm declined to comment, instead referring CoinDesk to Witkoff and fellow co-founder Eric Trump’s posts on X.
The complaint itself may fill in the blanks. Sun alleged that World Liberty leveled a shifting set of accusations against him in private conversations and correspondence, none of which, he argued, the company has backed up with evidence.
According to the filing, World Liberty has at various points blamed Sun for the roughly 40% price crash $WLFI experienced on Sept. 1, 2025, the first day the token became tradable.
WLFI also claimed Sun drove down the price by short-selling perpetual futures on a centralized exchange, according to Sun’s complaint, an accusation Sun said is false, and that the complaint notes would be difficult to pin on him, given his transfers happened hours after the steepest drop.
World Liberty separately objected to Sun’s $100 million purchase of $TRUMP tokens from a different Trump-backed project, according to the filing, but Sun said this buy got the blessing of a Trump family member who is a partner in both ventures.
The company allegedly also accused Sun of acting as a straw purchaser for other investors in violation of his token purchase agreement, executing prohibited transfers to the exchanges HTX and Binance and submitting inadequate know-your-customer documentation, according to the filing.
“On September 25, 2025, Mr. Herro repeatedly threatened to report Mr. Sun to U.S. criminal authorities over these unspecified KYC issues — which Mr. Herro and World Liberty have refused to explain in anything other than the broadest terms despite repeated requests from Plaintiffs for additional information,” Tuesday’s filing said.
WLFI has yet to file a response to Sun’s suit.


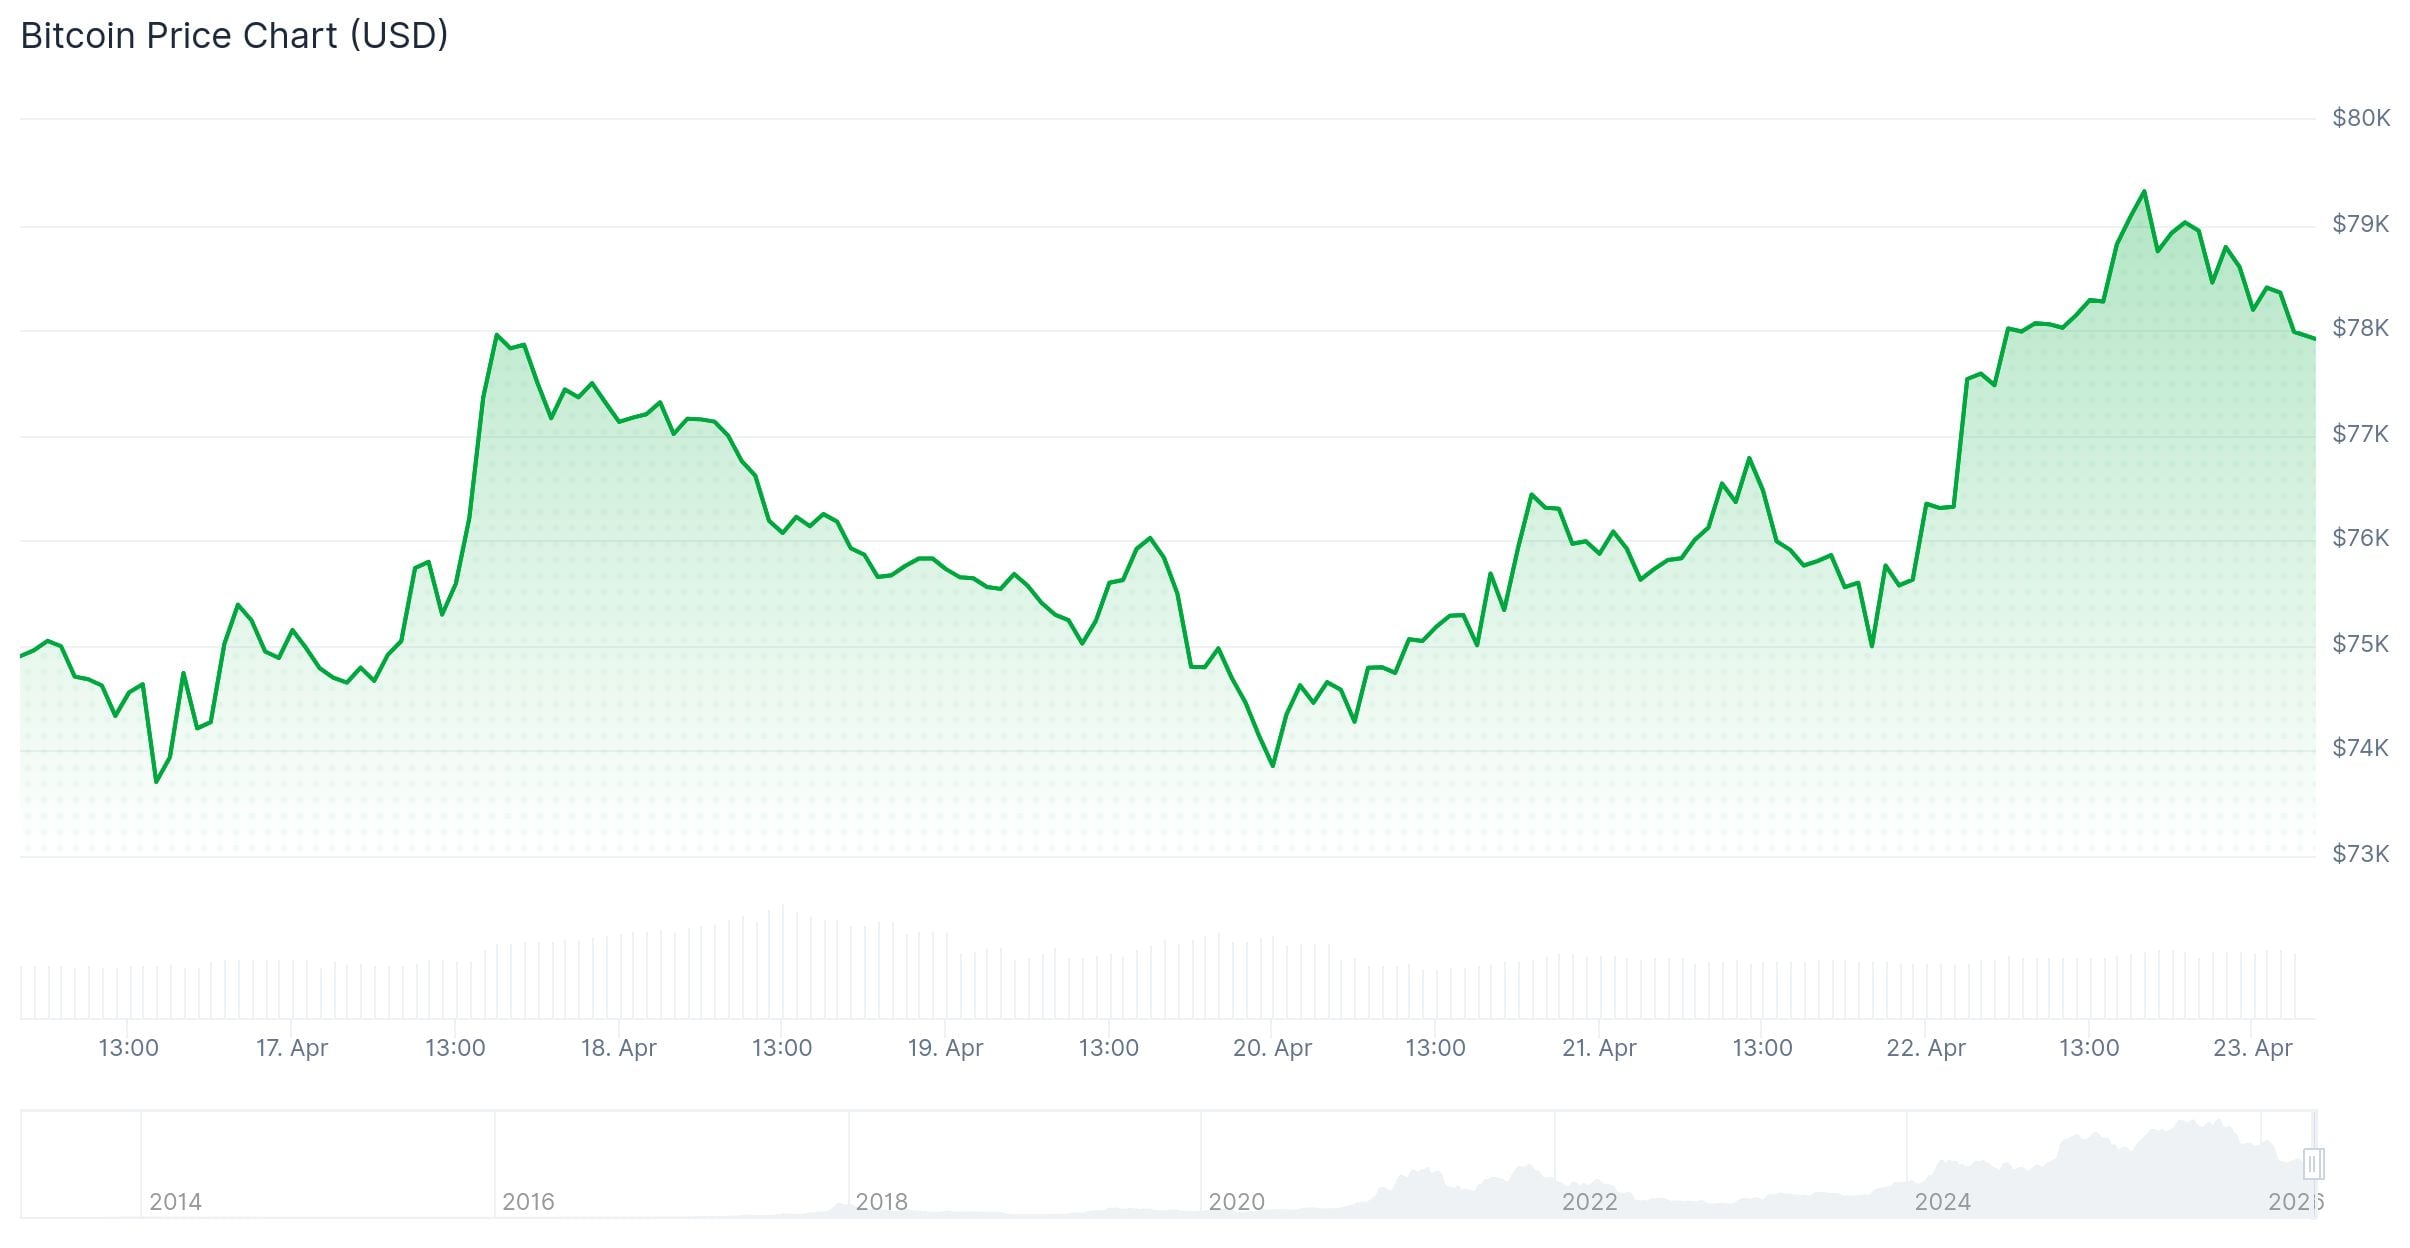
Bitcoin has pulled back slightly after briefly approaching the $80,000 mark on Tuesday.
At the time of writing, it was trading at $77,794, still up 0.4% over the past 24 hours, after hitting a peak of $79,388 before gradually easing lower during the overnight session.
The 24-hour low of $77,464 was set Thursday morning, meaning the full range of the move was about $1,900. Ether (ETH) slipped 0.7% to $2,344, XRP (XRP) fell 1.7% to $1.42, solana (SOL) dropped 1.5% to $85.83, and BNB declined 0.6% to $635.
Brent crude held above $95 a barrel as the U.S. maintained its naval blockade on ships going to and from Iranian ports while Iran kept the Strait closed to almost all other international traffic. Iranian gunboats fired on commercial ships in the waterway on Wednesday.
Trump’s April 7 ceasefire remains in place “indefinitely,” but Vice President JD Vance’s planned Tuesday trip to Islamabad was called off after Iran declined to send a delegation. White House Press Secretary Karoline Leavitt said Trump has not set a firm deadline for an Iranian proposal.
The divergence in the top 10 backs the positioning read. Bitcoin is up 4% on the week, every other major is within 2% either direction, with ether and solana actually down.
When a rally concentrates in one asset while the rest of the complex fades, the source of the bid is usually narrow rather than broad.
Bitpanda CEO Lukas Enzersdorfer-Konrad took the opposite view, arguing the overnight push toward $80,000 signals digital asset industry maturity and resilience backed by institutional participation and clearer regulatory frameworks.
That framing is harder to reconcile with a market where bitcoin is leading alone amid thin altcoin participation and where funding rates have been negative for roughly 47 consecutive days, one of the longest stretches of bearish derivatives positioning on record.
A slide below $76,000 would mean the $79,388 high printed the top for this leg, and the next move requires either genuine Iran progress or a shift in the funding rate picture that pulls real capital back in.

TLDR
- SoFi Bank now allows customers to deposit XRP through its regulated crypto platform.
- Ripple stated that broader access supports long-term growth and strengthens XRP utility.
- SoFi operates under a nationally chartered bank regulated by the Office of the Comptroller of the Currency.
- The platform charges a flat 1% fee on every crypto trade executed within the app.
- Users must fund a SoFi Checking and Savings account before trading crypto assets.
SoFi Bank has enabled XRP deposits within its crypto platform, expanding regulated access for retail customers. Ripple welcomed the move and linked broader availability to long-term ecosystem growth. The update allows users to fund accounts, trade digital assets, and manage holdings in one app.
XRP Enters SoFi’s Regulated Crypto Platform
SoFi confirmed that customers can now deposit XRP through its crypto service. The platform already supports Bitcoin, Ethereum, and Solana. Therefore, users can manage multiple assets within a single mobile application.
The company operates through SoFi Bank, N.A., which the Office of the Comptroller of the Currency regulates. This structure places XRP access inside a federally chartered banking framework. As a result, customers interact with the asset through a regulated financial institution.
Ripple addressed the development in a post on X. The company stated that “broader access is key to long-term growth.” It added that availability through platforms like SoFi helps strengthen XRP’s utility and ecosystem participation.
SoFi explained that users must fund a SoFi Checking and Savings account before trading. After funding, the platform converts cash into stablecoins such as USDC to execute transactions. This process allows trades to settle efficiently within the system.
The company charges a flat 1% fee on every crypto trade. The execution price may include a small spread between market and transaction prices. This structure locks in rates when users place orders.
Customers can open accounts without monthly maintenance or opening fees. The process requires identity verification, including name, address, and Social Security number. Consequently, the onboarding process follows standard banking compliance procedures.
Broader XRP Adoption Expands Across Platforms
Ripple highlighted that expanding access supports long-term ecosystem development. The company said easier entry points encourage broader participation in the network. It maintained that utility grows as more platforms integrate the asset.
Rakuten recently added XRP support through Rakuten Wallet. The integration allows payments, trading, and loyalty point conversion within its ecosystem. Therefore, millions of users can access XRP services directly.
Exodus also expanded support for the XRP Ledger within its wallet services. The company introduced enhanced wallet tools and RLUSD integration. These updates increase functionality for users holding XRP-based assets.
Bitget Wallet integrated XRPL payment options and cross-chain features. The wallet also enabled QR-based payments and card transactions using XRPL infrastructure. Binance also expanded XRPL liquidity with RLUSD deposits, withdrawals, and new trading pairs.
SoFi’s integration now places XRP within another mainstream financial channel. The bank confirmed deposit support as part of its existing crypto offering. With this rollout, customers can access XRP directly through a regulated banking app.
Ethereum’s record 32.33% staking ratio is shrinking liquid supply, reducing sell pressure and potentially supporting an ETH price recovery over time.
Ether (ETH) has fallen about 5.5% against Bitcoin (BTC) over the past week, and a bearish continuation setup now points to the risk of deeper losses ahead.
Key takeaways:
Ether’s bear flag risks 10% correction
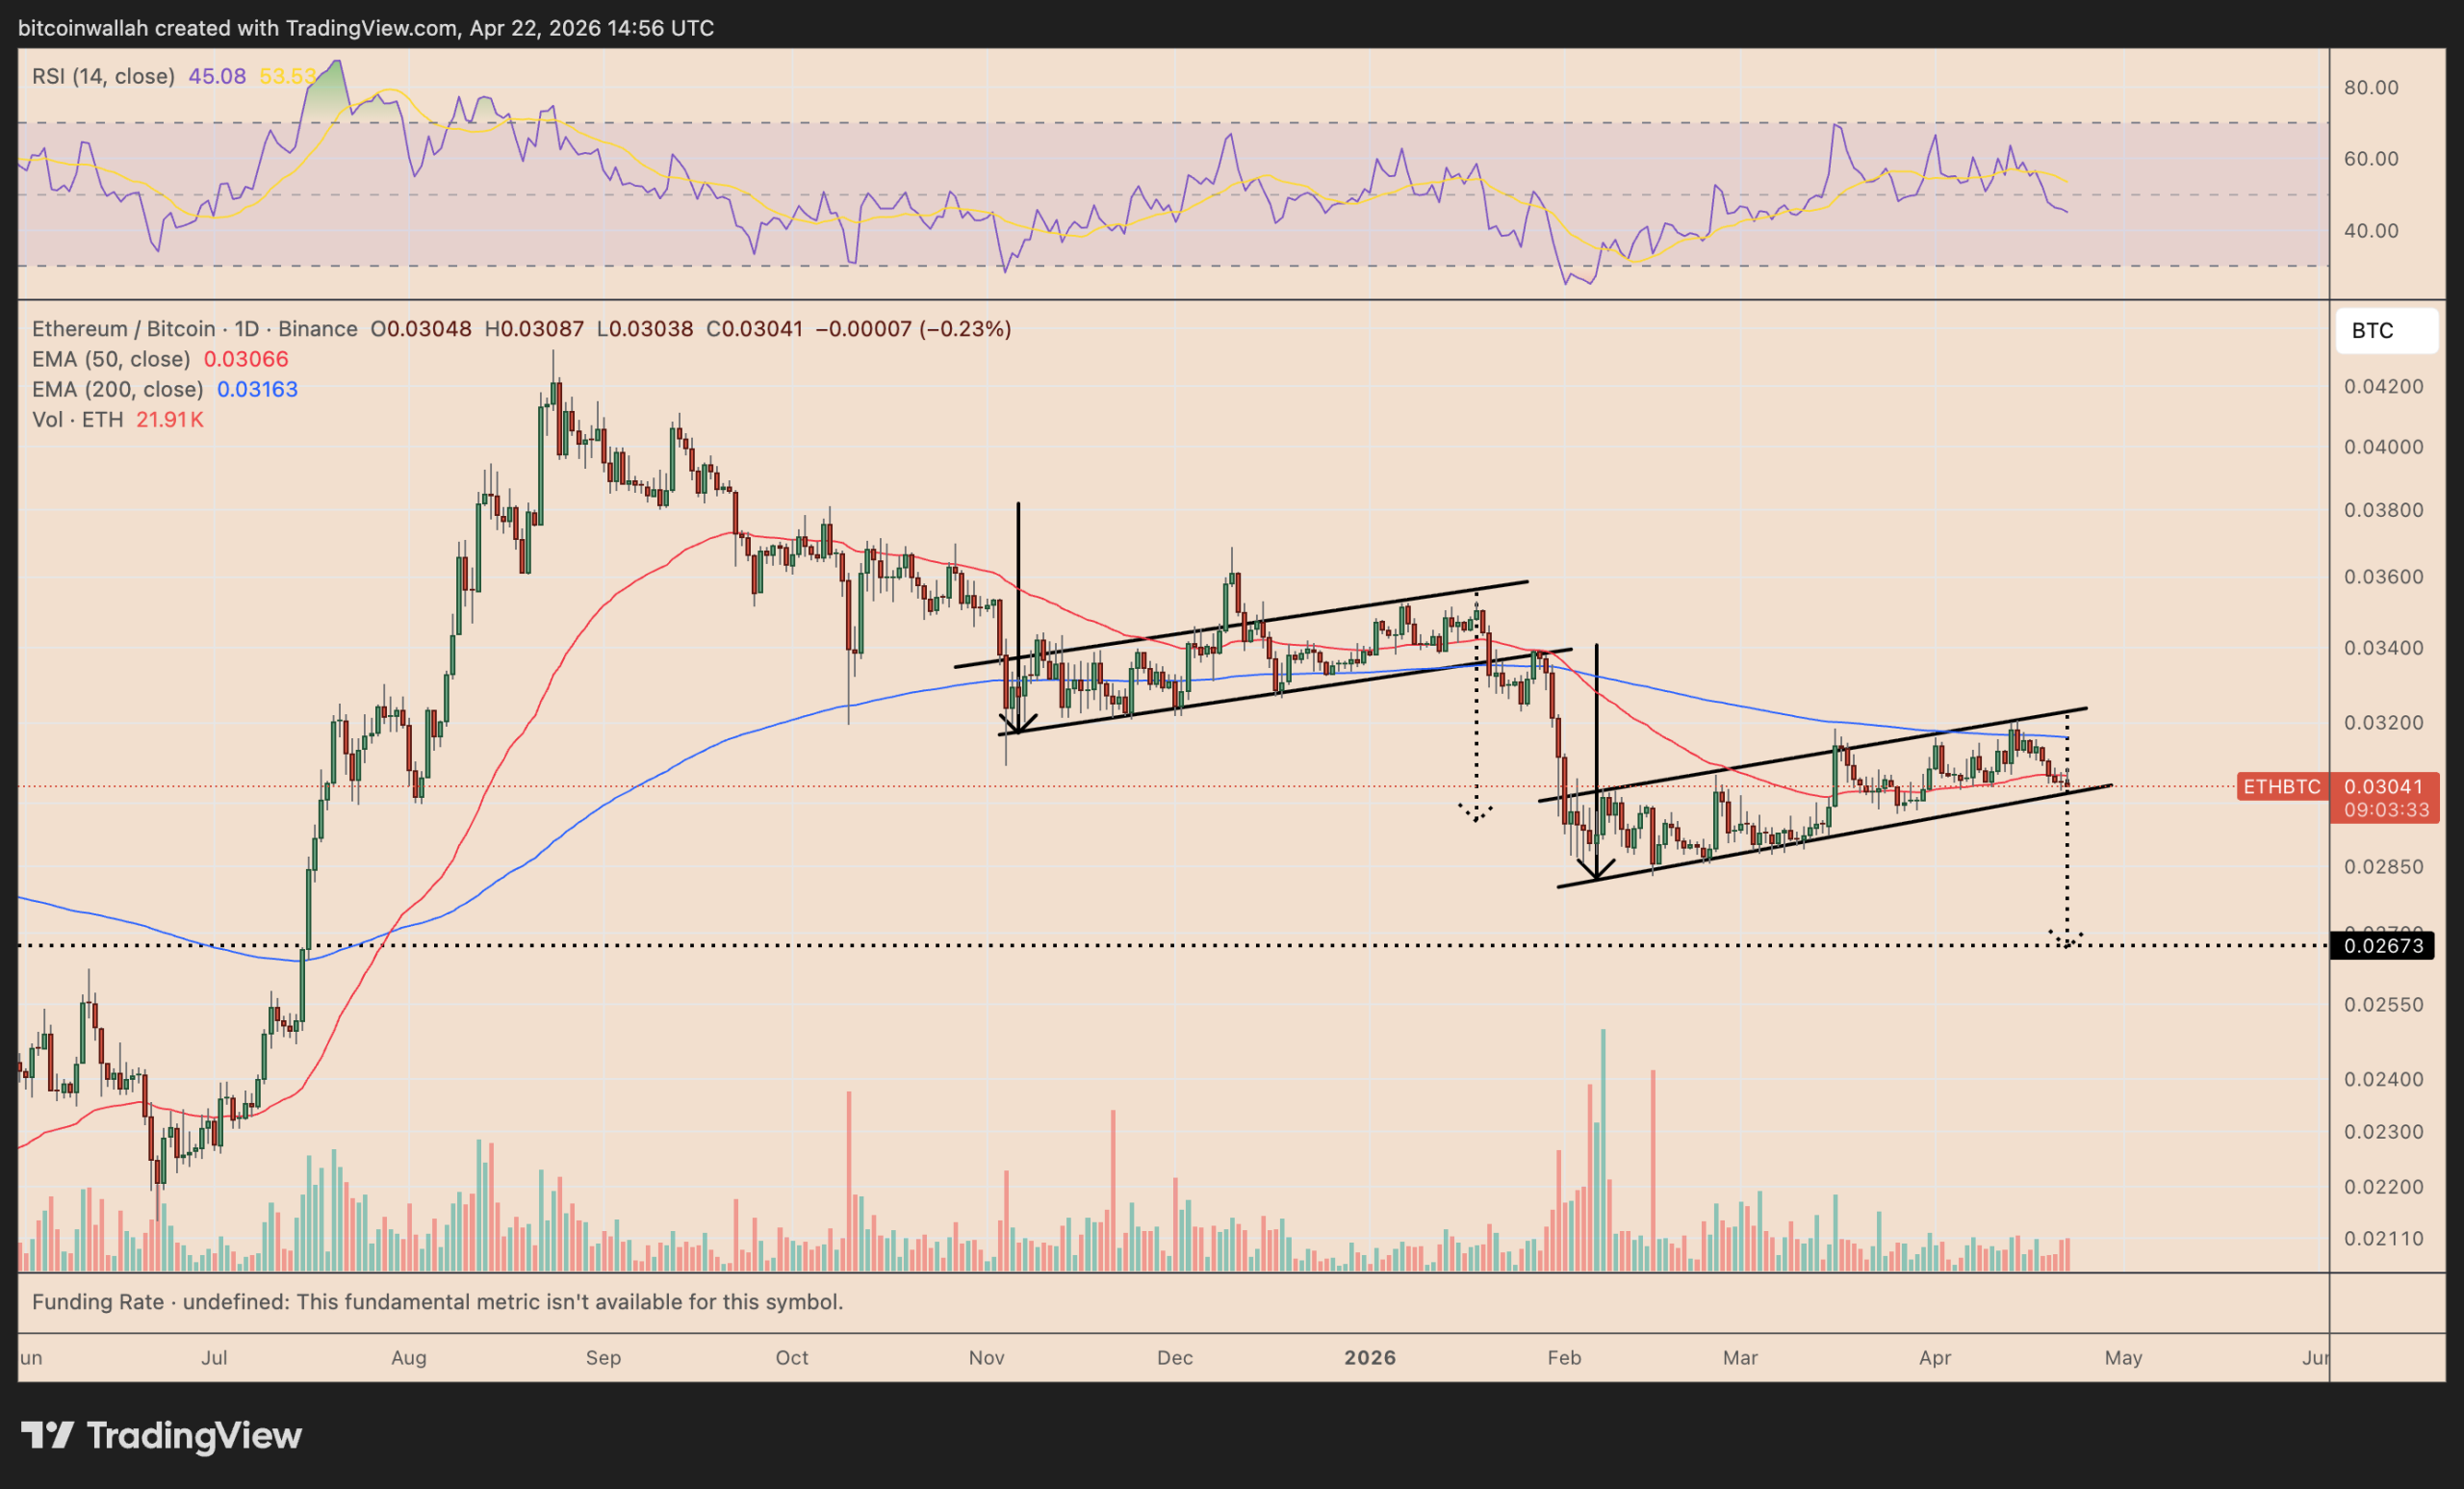
The ETH/BTC ratio has been carving out a bear flag pattern since February, consolidating inside a rising parallel channel after a sharp downside move.
In technical analysis, bear flags are typically viewed as continuation patterns. Analysts derive the downside target by taking the height of the previous decline and projecting it lower from the point where price breaks below the flag’s lower trend line.

Using that method, the ETH/BTC pair’s measured downside target comes in near 0.026 BTC, about 10% below current levels, in May.
Notably, a similar bear flag breakdown earlier this year preceded a roughly 15% decline, suggesting the current setup could once again favor Bitcoin over Ether in the near term.
Conversely, the bearish breakdown setup may get postponed if ETH/BTC rebounds from the flag’s lower trend line, opening the door for a recovery toward the upper boundary near 0.032 BTC in May.
Ethereum staking ratio hits record levels
Ethereum’s fundamentals are strengthening even as ETH continues to lag Bitcoin.
The network’s staking ratio hit a record 32.33% on April 21, with about 39 million ETH locked across 816,578 validators, according to data resource Token Terminal.

That amounts to roughly $90.26 billion in staked value and marks the first time more than one-third of Ethereum’s circulating supply has been committed to the network.
Earlier this month, the Ethereum Foundation completed its 70,000 ETH staking target, shifting more of its holdings into yield-generating positions instead of potential sell-side supply.
Meanwhile, BitMine Immersion Technologies now holds 4.976 million ETH, or 4.12% of total supply, with around 3.334 million ETH already staked through its validator network.
Overall, it means less ETH is available for active trading. That can reduce selling pressure and support prices in dollar terms over time, especially if demand keeps rising while available supply keeps shrinking.
Related: Ethereum whale opens $90M long bets as ETH price chart eyes $3.2K
Ether has lagged behind Bitcoin partly because Ethereum’s “ultrasound money” thesis has weakened, while Bitcoin continues to benefit from accumulation by firms like Strategy and its accelerating integration into Wall Street portfolios.
This article is produced in accordance with Cointelegraph’s Editorial Policy and is intended for informational purposes only. It does not constitute investment advice or recommendations. All investments and trades carry risk; readers are encouraged to conduct independent research before making any decisions. Cointelegraph makes no guarantees regarding the accuracy or completeness of the information presented, including forward-looking statements, and will not be liable for any loss or damage arising from reliance on this content.


American Bitcoin, co‑founded by Eric and Donald Trump Jr., has energized 11,298 new ASICs, lifting owned hash rate to 28.1 EH/s as it doubles down on low‑cost BTC accumulation.
Summary
- American Bitcoin, the Trump family–backed miner, has energized 11,298 new ASIC machines, lifting its owned hash rate to about 28.1 EH/s.
- The expansion increases total fleet size to roughly 89,242 miners and represents a 12% boost in capacity, adding about 3.05 EH/s at 13.5 J/TH.
- Around 58,999 miners are currently online, delivering roughly 25.0 EH/s at 14.1 J/TH, as the company doubles down on a strategy of accumulating BTC at structurally low production cost.
American Bitcoin Corp., the publicly listed mining company co‑founded by Eric Trump and Donald Trump Jr., has completed the deployment of roughly 11,298 newly purchased ASIC miners, pushing its total self‑owned hash rate to about 28.1 exahashes per second. In a March press release, the company said the additional machines would “add ~3.05 EH/s at ~13.5 J/TH, increasing its total owned fleet to ~28.1 EH/s at an average efficiency of ~16.0 J/TH across 89,242 miners.”
Those figures are now being confirmed in operational updates. After energizing the new rigs at its Drumheller site in Alberta, American Bitcoin reports that approximately 58,999 miners are currently online, corresponding to about 25.0 EH/s of active hash rate with an average energy efficiency of roughly 14.1 joules per terahash, while the full owned fleet (including yet‑to‑be‑deployed units) sits at 28.1 EH/s.
The company frames the move as an extension of a deliberate “Bitcoin accumulator” strategy. In its capacity announcement, American Bitcoin noted that in the fourth quarter of 2025 it mined BTC at a cost roughly 53% below the prevailing spot price, arguing that the fleet expansion “reinforces American Bitcoin’s disciplined focus on maximizing Bitcoin accumulation at a structural advantage.”
Eric Trump, the firm’s chief strategy officer, has repeatedly linked that approach to a broader political and industrial narrative. “As Bitcoin matures, the priority is clear: grow American‑owned, professionally operated hashrate,” he said, adding that this is “how we protect the network, drive innovation, and lead the future of Bitcoin in America.”
Industry data suggest the build‑out is meaningful but not yet dominant at the public‑miner level.
Finviz notes that the largest listed miners currently operate in the 50 EH/s range, making American Bitcoin “roughly half the size of industry leaders,” but also points out that rivals are increasingly diverting capex into AI and high‑performance computing, potentially leaving more room for ABTC to grow its share of global hash rate.
For markets, the message is straightforward: the Trump family’s mining vehicle is not dialing back post‑halving; it is pressing its advantage. With 28.1 EH/s of owned capacity, a more efficient new tranche of hardware at 13.5 J/TH, and a stated focus on holding mined BTC, American Bitcoin is betting that control of cheap, US‑domiciled hash power will matter more in the next phase of Bitcoin’s monetization than short‑term share‑price swings.
Robinhood Ventures Fund I (RVI), a publicly traded closed-end fund that offers retail investors access to private equity investments, announced a $75 million investment in OpenAI.
The company announced on Wednesday that it purchased $75 million of the AI developer’s common stock, which will be used as the underlying asset to give Robinhood clients price exposure to OpenAI via the fund’s venture tokens.
The investment is “one of RVI’s largest investments to date,” according to RVI president Sarah Pinto, who added that the tokens aim to democratize access to private investing.
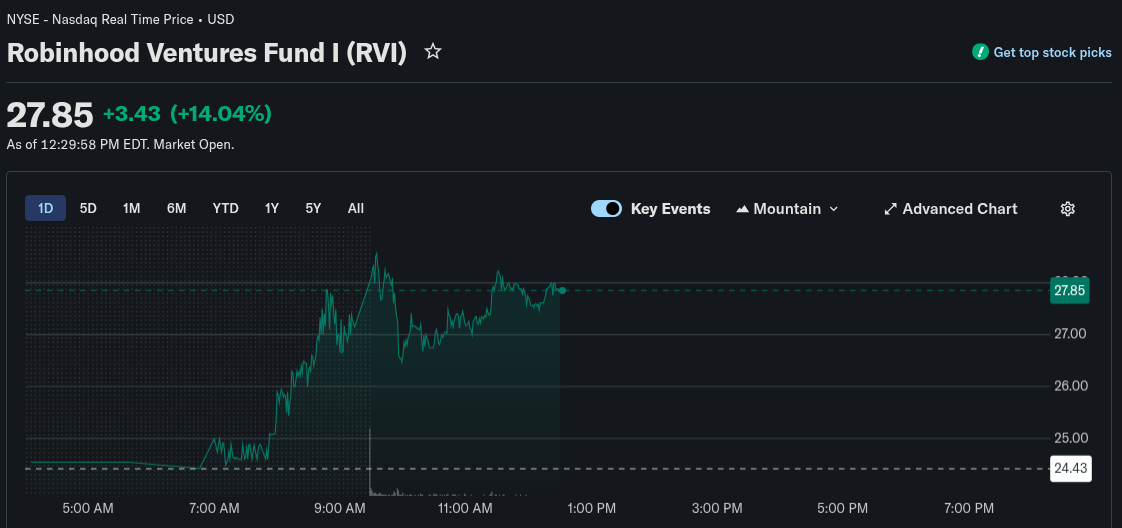
Shares of RVI were trading more than 14% higher on Wednesday, to $27.85 at the time of publication, according to data from Yahoo Finance.

Robinhood’s private equity tokens for retail investors have raised regulatory questions about the legal rights of token holders and how price exposure through tokens differs from holding private equity in a company, which is reserved for qualified investors.
Related: ARK buys $13M in Robinhood as US Treasury taps platform for Trump Accounts
Robinhood announces private equity tokens for retail, but legal issues abound
Robinhood distributed OpenAI and SpaceX tokens to users in June 2025 as part of its rollout of tokenized stock trading for users in the European Union.
However, OpenAI immediately responded to the announcement, warning that the tokens do not represent a private equity stake in the company.
“These ‘OpenAI tokens’ are not OpenAI equity. We did not partner with Robinhood, were not involved in this, and do not endorse it,” OpenAI said at the time. “Any transfer of OpenAI equity requires our approval — we did not approve any transfer.”
John Murillo, chief business officer of financial technology company B2BROKER, told Cointelegraph that investors holding these private equity tokens must understand that they do not hold “actual shares” in these companies.
Customers may be entitled to payouts if the underlying shares of the private equity companies increase, but the tokens are strictly a financial instrument created by a third party and not equity, according to Murillo.
“There is no direct claim on company assets, no voting rights and no access to internal financial information,” Murillo said.
A request for comment sent to Robinhood by Cointelegraph was not immediately replied to.
Magazine: Robinhood’s tokenized stocks have stirred up a legal hornet’s nest

Moj Masti Bhi Jaaruri hai | #trading #cryptocurrency #stockmarket #crypto

Horoscope today: Your daily guide for Thursday, April 23, 2026

Australia now has 46 days of fuel supply
Manchester United reach agreement with Casemiro over contract clause amid transfer speculation

Steven Gerrard disagrees with Gary Neville over ‘shock’ Chelsea and Arsenal claim | Football

US brings back mandatory military draft registration


-

 Sports6 days ago
NWFL Suspends Two Players Over Post-Match Clash in Ado-Ekiti
-

 Fashion5 days ago
Weekend Open Thread: Theodora Dress
-

 Politics5 days ago
Palestine barred from entering Canada for FIFA Congress
-
Entertainment3 days ago
NBA Analyst Charles Barkley Chimes in on Ice Spice McDonald’s Fiasco
-

 Business4 days ago
Powerball Result April 18, 2026: No Jackpot Winner in Powerball Draw: $75 Million Rolls Over
-

 Tech4 days ago
Auto Enthusiast Scores Running Tesla Model 3 for Two Grand and Turns It Into Bare-Bones Go-Kart
-

 Politics4 days ago
Zack Polanski demands ‘council homes not luxury flats for foreign investors’
-

 Crypto World5 days ago
Russia Pushes Bill to Criminalize Unregistered Crypto Services
-

 Politics2 days ago
Gary Stevenson delivers timely reminder to register to vote as deadline TODAY
-

 Business20 hours ago
Rolls-Royce Voted UK’s Most Iconic Trade Mark as IPO Register Hits 150
-

 Politics11 hours ago
Disabled people challenge government SEND proposals over segregation concerns
-

 Politics11 hours ago
Making troops accountable for war crimes threatens US alliance, ex-SAS colonel warns
-
 Business6 days ago
Creo Medical agree sale of its manufacturing operation
-

 Crypto World5 days ago
Russia Introduces Bill To Criminalize Unregistered Crypto Services
-

 Politics12 hours ago
Starmer handler McSweeney to be dragged from shadows by Foreign Affairs Committee
-

 Politics12 hours ago
Zack Polanski responds to home secretary’s taser threat
-
Politics12 hours ago
Wings Over Scotland | How To Get Away With Crimes
-
Crypto World4 days ago
Kelp DAO rsETH Bridge Hack Drains $292M as DeFi Losses Top $600M in Two Weeks
-

 Politics9 hours ago
‘Iran is still a nuclear threat’
-

 Sports7 days ago
“Felt Much Better Today”: Josh Hazlewood Opens Up On His Recovery Win Over LSG
You must be logged in to post a comment Login