
Crypto World
MicroStrategy Stock Faces Collapse Risk as Institutions Exit

The MicroStrategy stock price has staged a notable rebound in recent weeks, but that recovery may now be facing its biggest test. With markets set to reopen for the last week of February, the stock remains highly sensitive to both Bitcoin’s weakness and shifting investor sentiment.
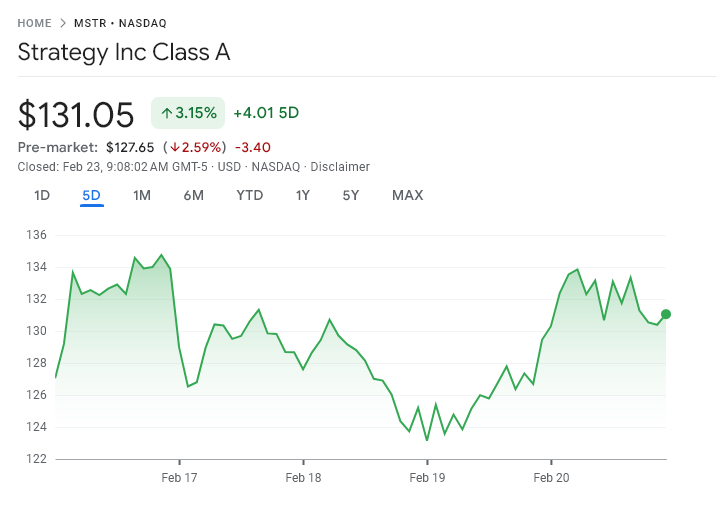
MSTR is currently trading near $131 after rebounding nearly 30% from its February 5 low. Despite this bounce, the stock is still down about 19% over the past month and more than 60% over the past three months.
This weak recovery now faces mounting pressure from 100% institutional exit disclosures, weakening momentum, and key technical resistance.
Institutional Selling Raises New Questions About MicroStrategy Recovery
The biggest warning sign for MicroStrategy stock price is coming from institutional investors themselves, who have recently revealed their positioning from the last quarter.
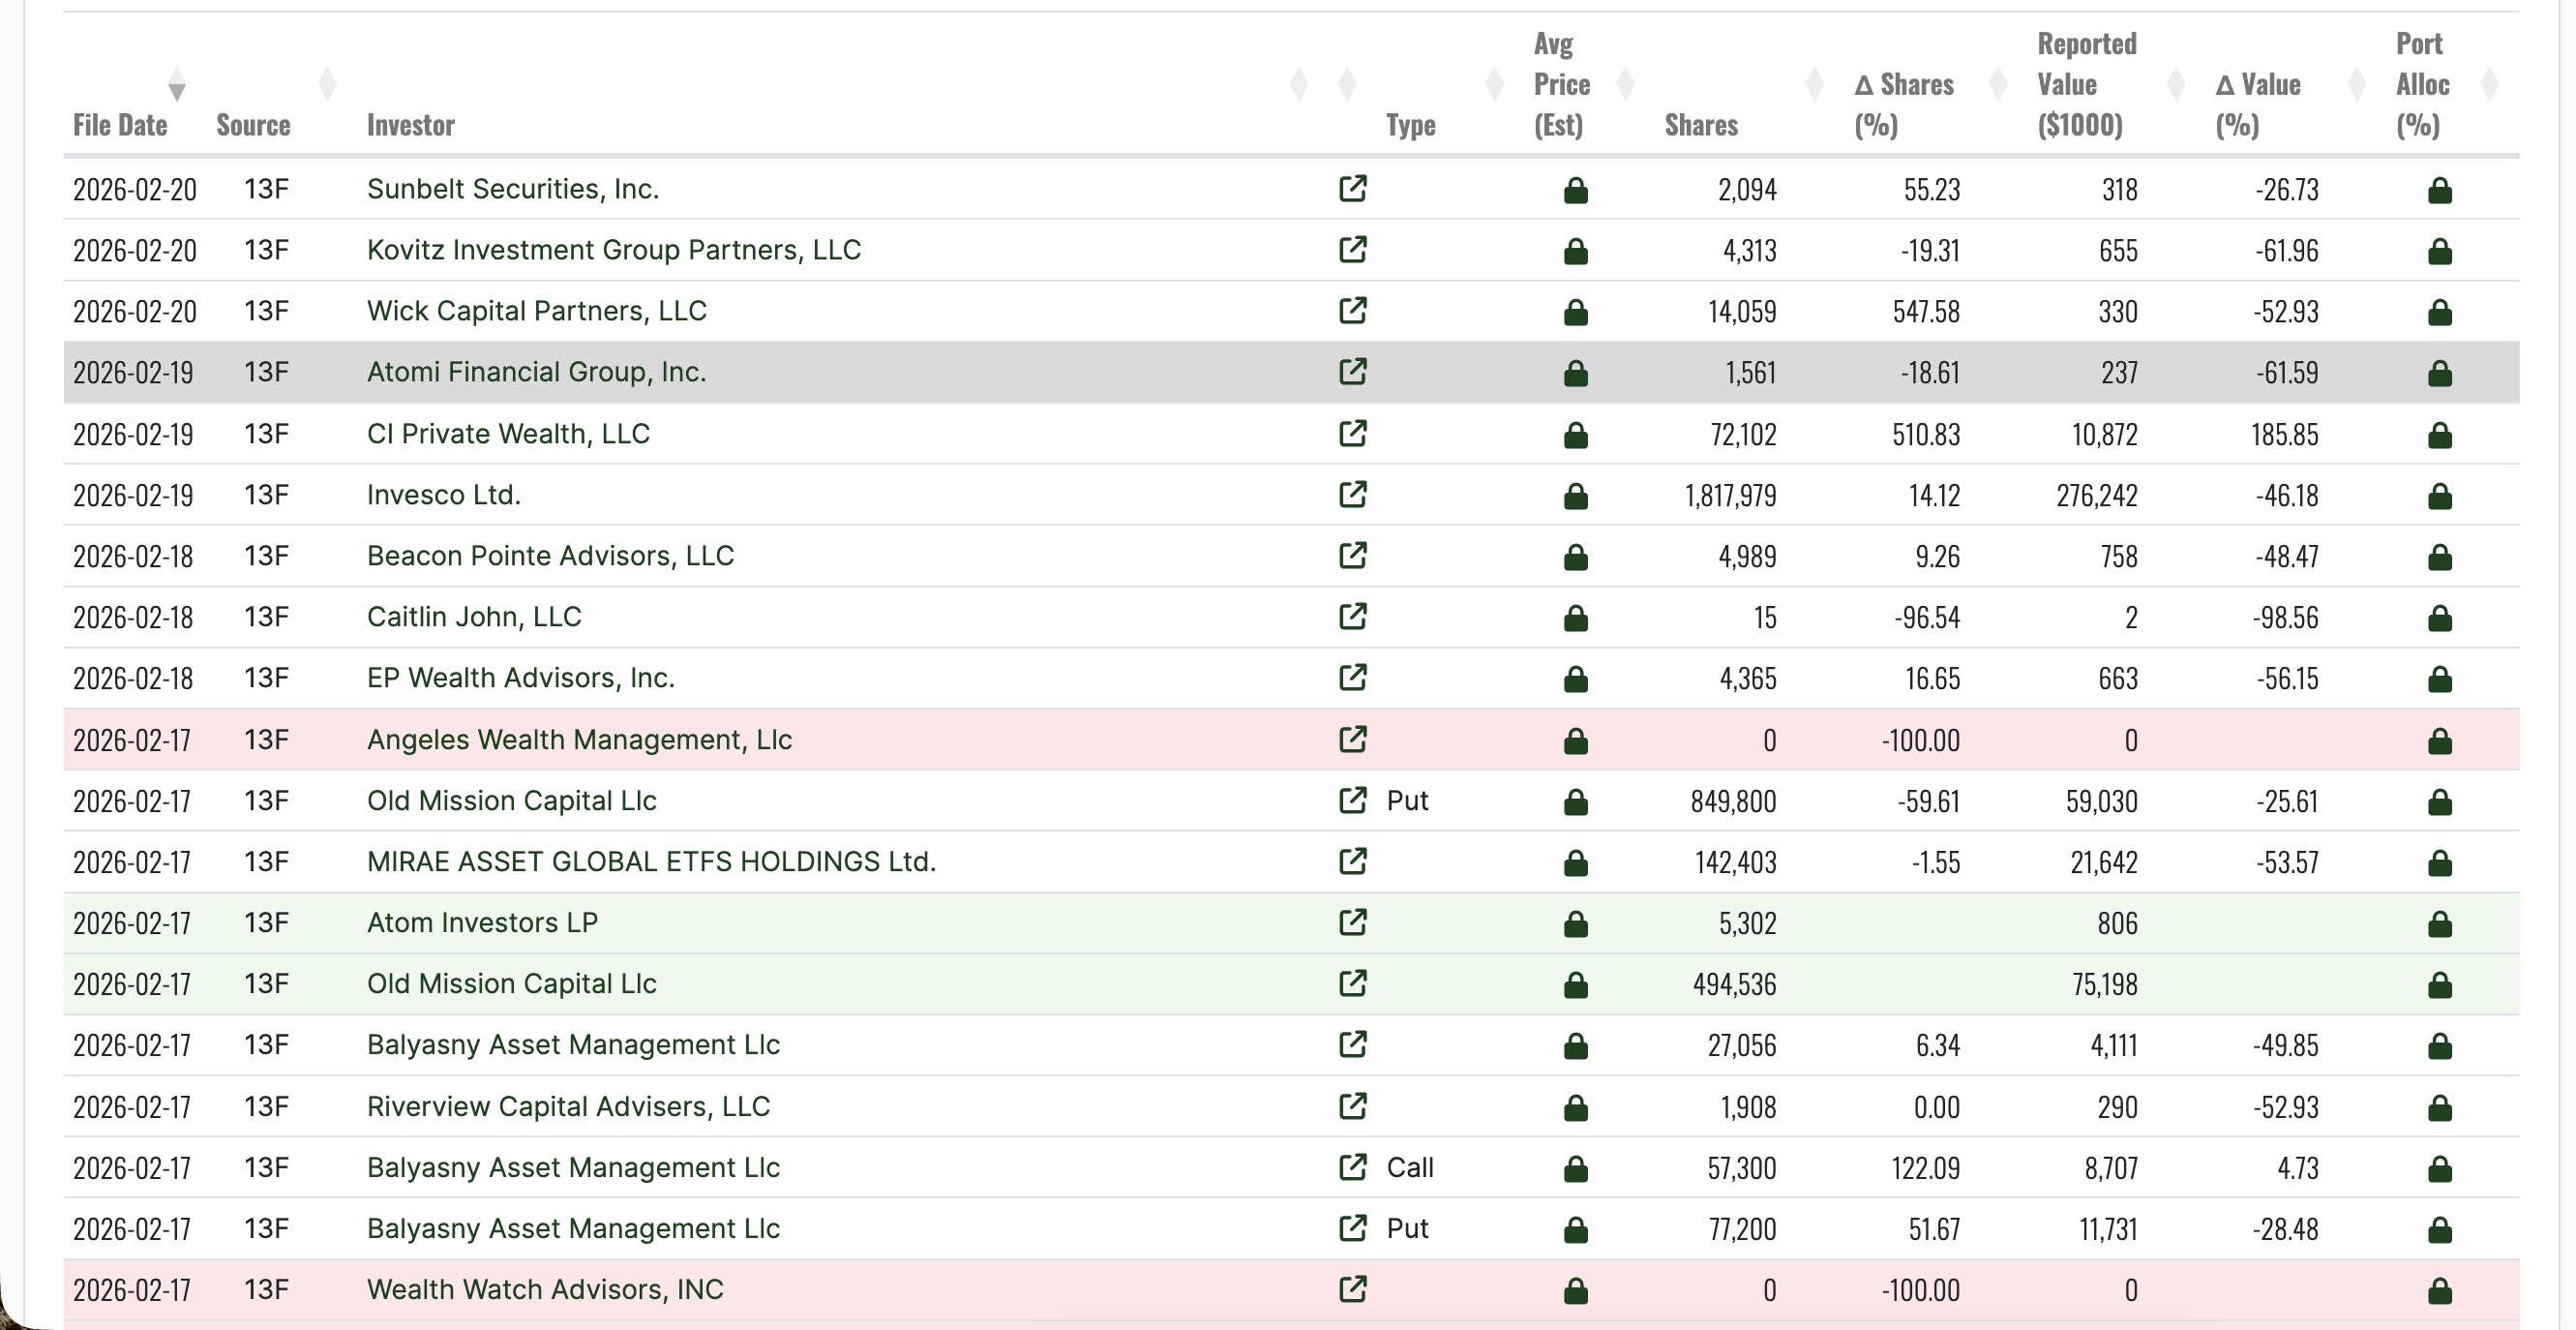
Recent 13F filings (lagging disclosures) reveal a clear pattern of mid-sized investors reducing or fully exiting Strategy positions.
Angeles Wealth Management and Wealth Watch Advisors both exited completely, cutting their holdings by 100%. Caitlin John LLC reduced its position by 96.54%, leaving only a negligible stake.
Want more insights like this? Sign up for Editor Harsh Notariya’s Daily Crypto Newsletter here.
Other major investors followed similar paths. Kovitz Investment Group cut its share count by 19.31%, while the value of its holdings fell nearly 62%.
Atomi Financial Group also reduced its exposure by 18.61%, with its position value dropping more than 61%. Even firms that maintained positions suffered heavy losses. Invesco increased its holdings by 14.12%, but the total value of its investment still fell by over 46%.
Such exits often signal declining confidence, especially when the news breaks during rebounds.
At the same time, MSTR’s technical structure is showing a hidden bearish divergence. Between November 18 and February 20, the stock formed a lower high, while the Relative Strength Index (RSI) formed a higher high.
RSI is a momentum indicator that measures the strength of price movements.
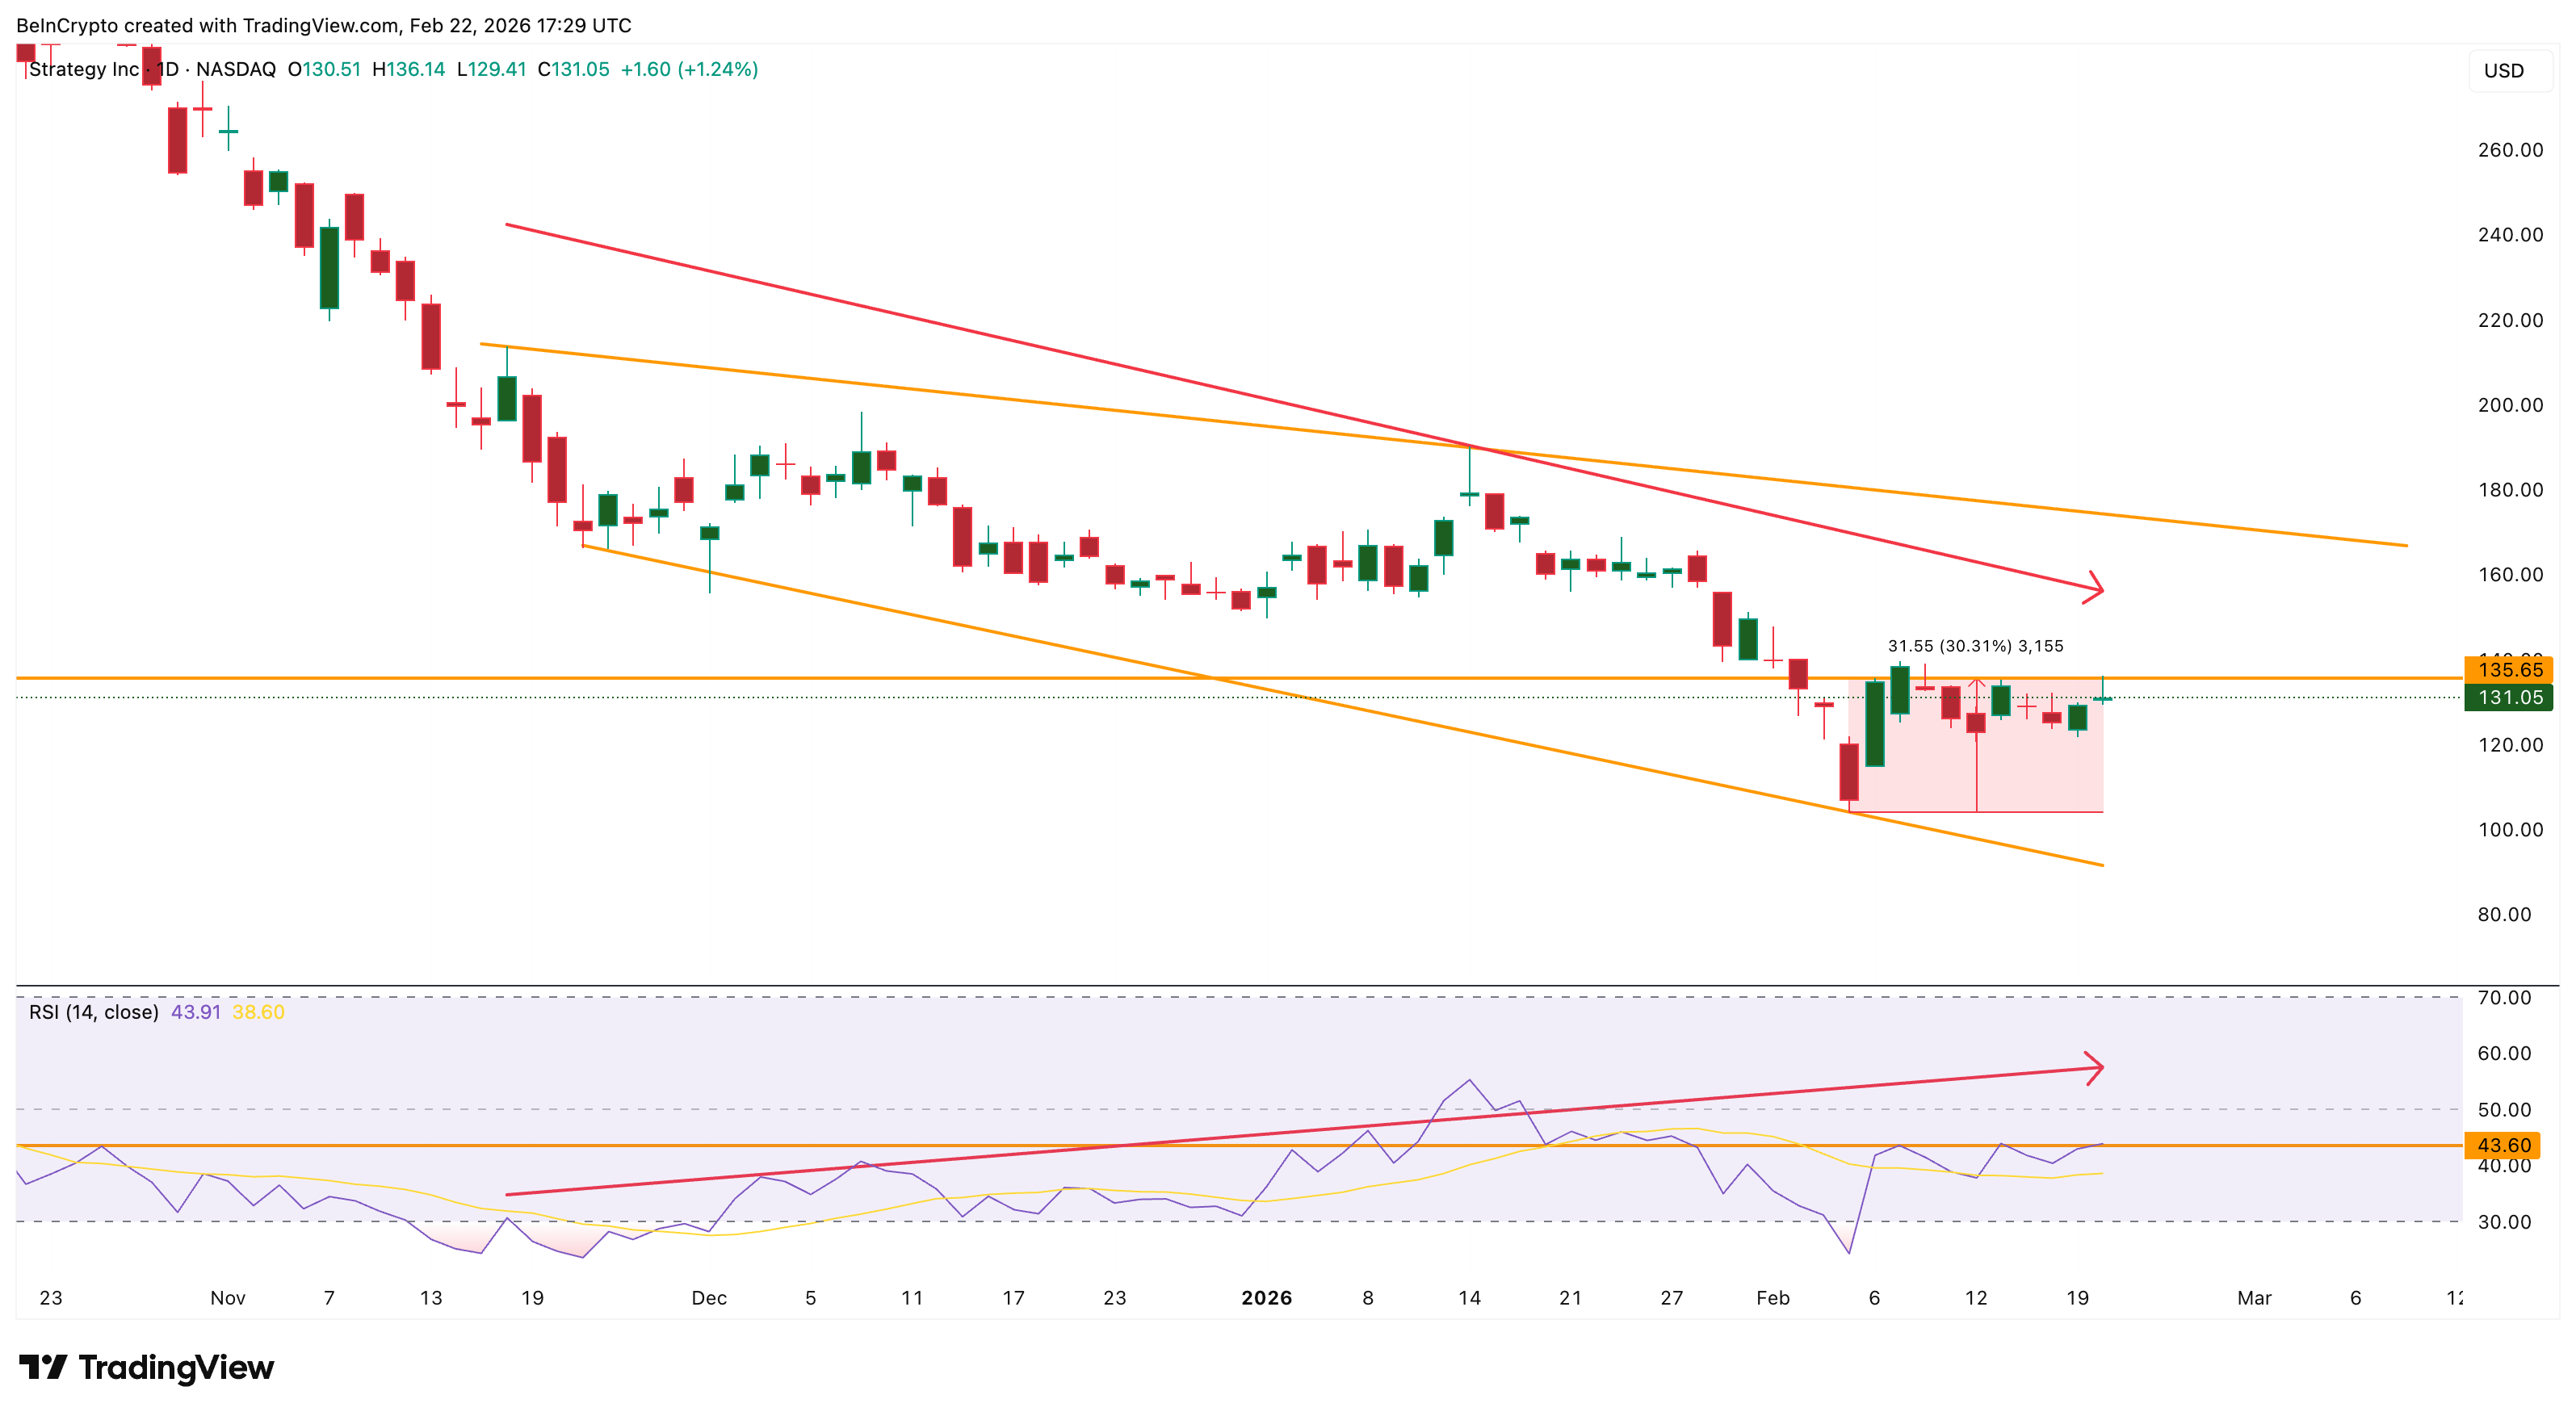
Because this divergence is appearing within a broader downtrend, it suggests the recent rebound may be losing strength.
This signal would strengthen if the stock fails to break above key resistance near $135.
These filings reveal positioning during the recent decline (reported in the previous quarter), highlighting weakening institutional conviction.
Declining Volume Suggests Weak Conviction Behind the Recovery
Technical volume indicators suggest that remaining support may not be strong.
One key metric is On-Balance Volume (OBV), which tracks cumulative buying and selling pressure. Since February 9, the MicroStrategy stock price has moved mostly sideways, but OBV has fallen much more sharply.
This shows that selling volume has been stronger than buying volume during the recovery.
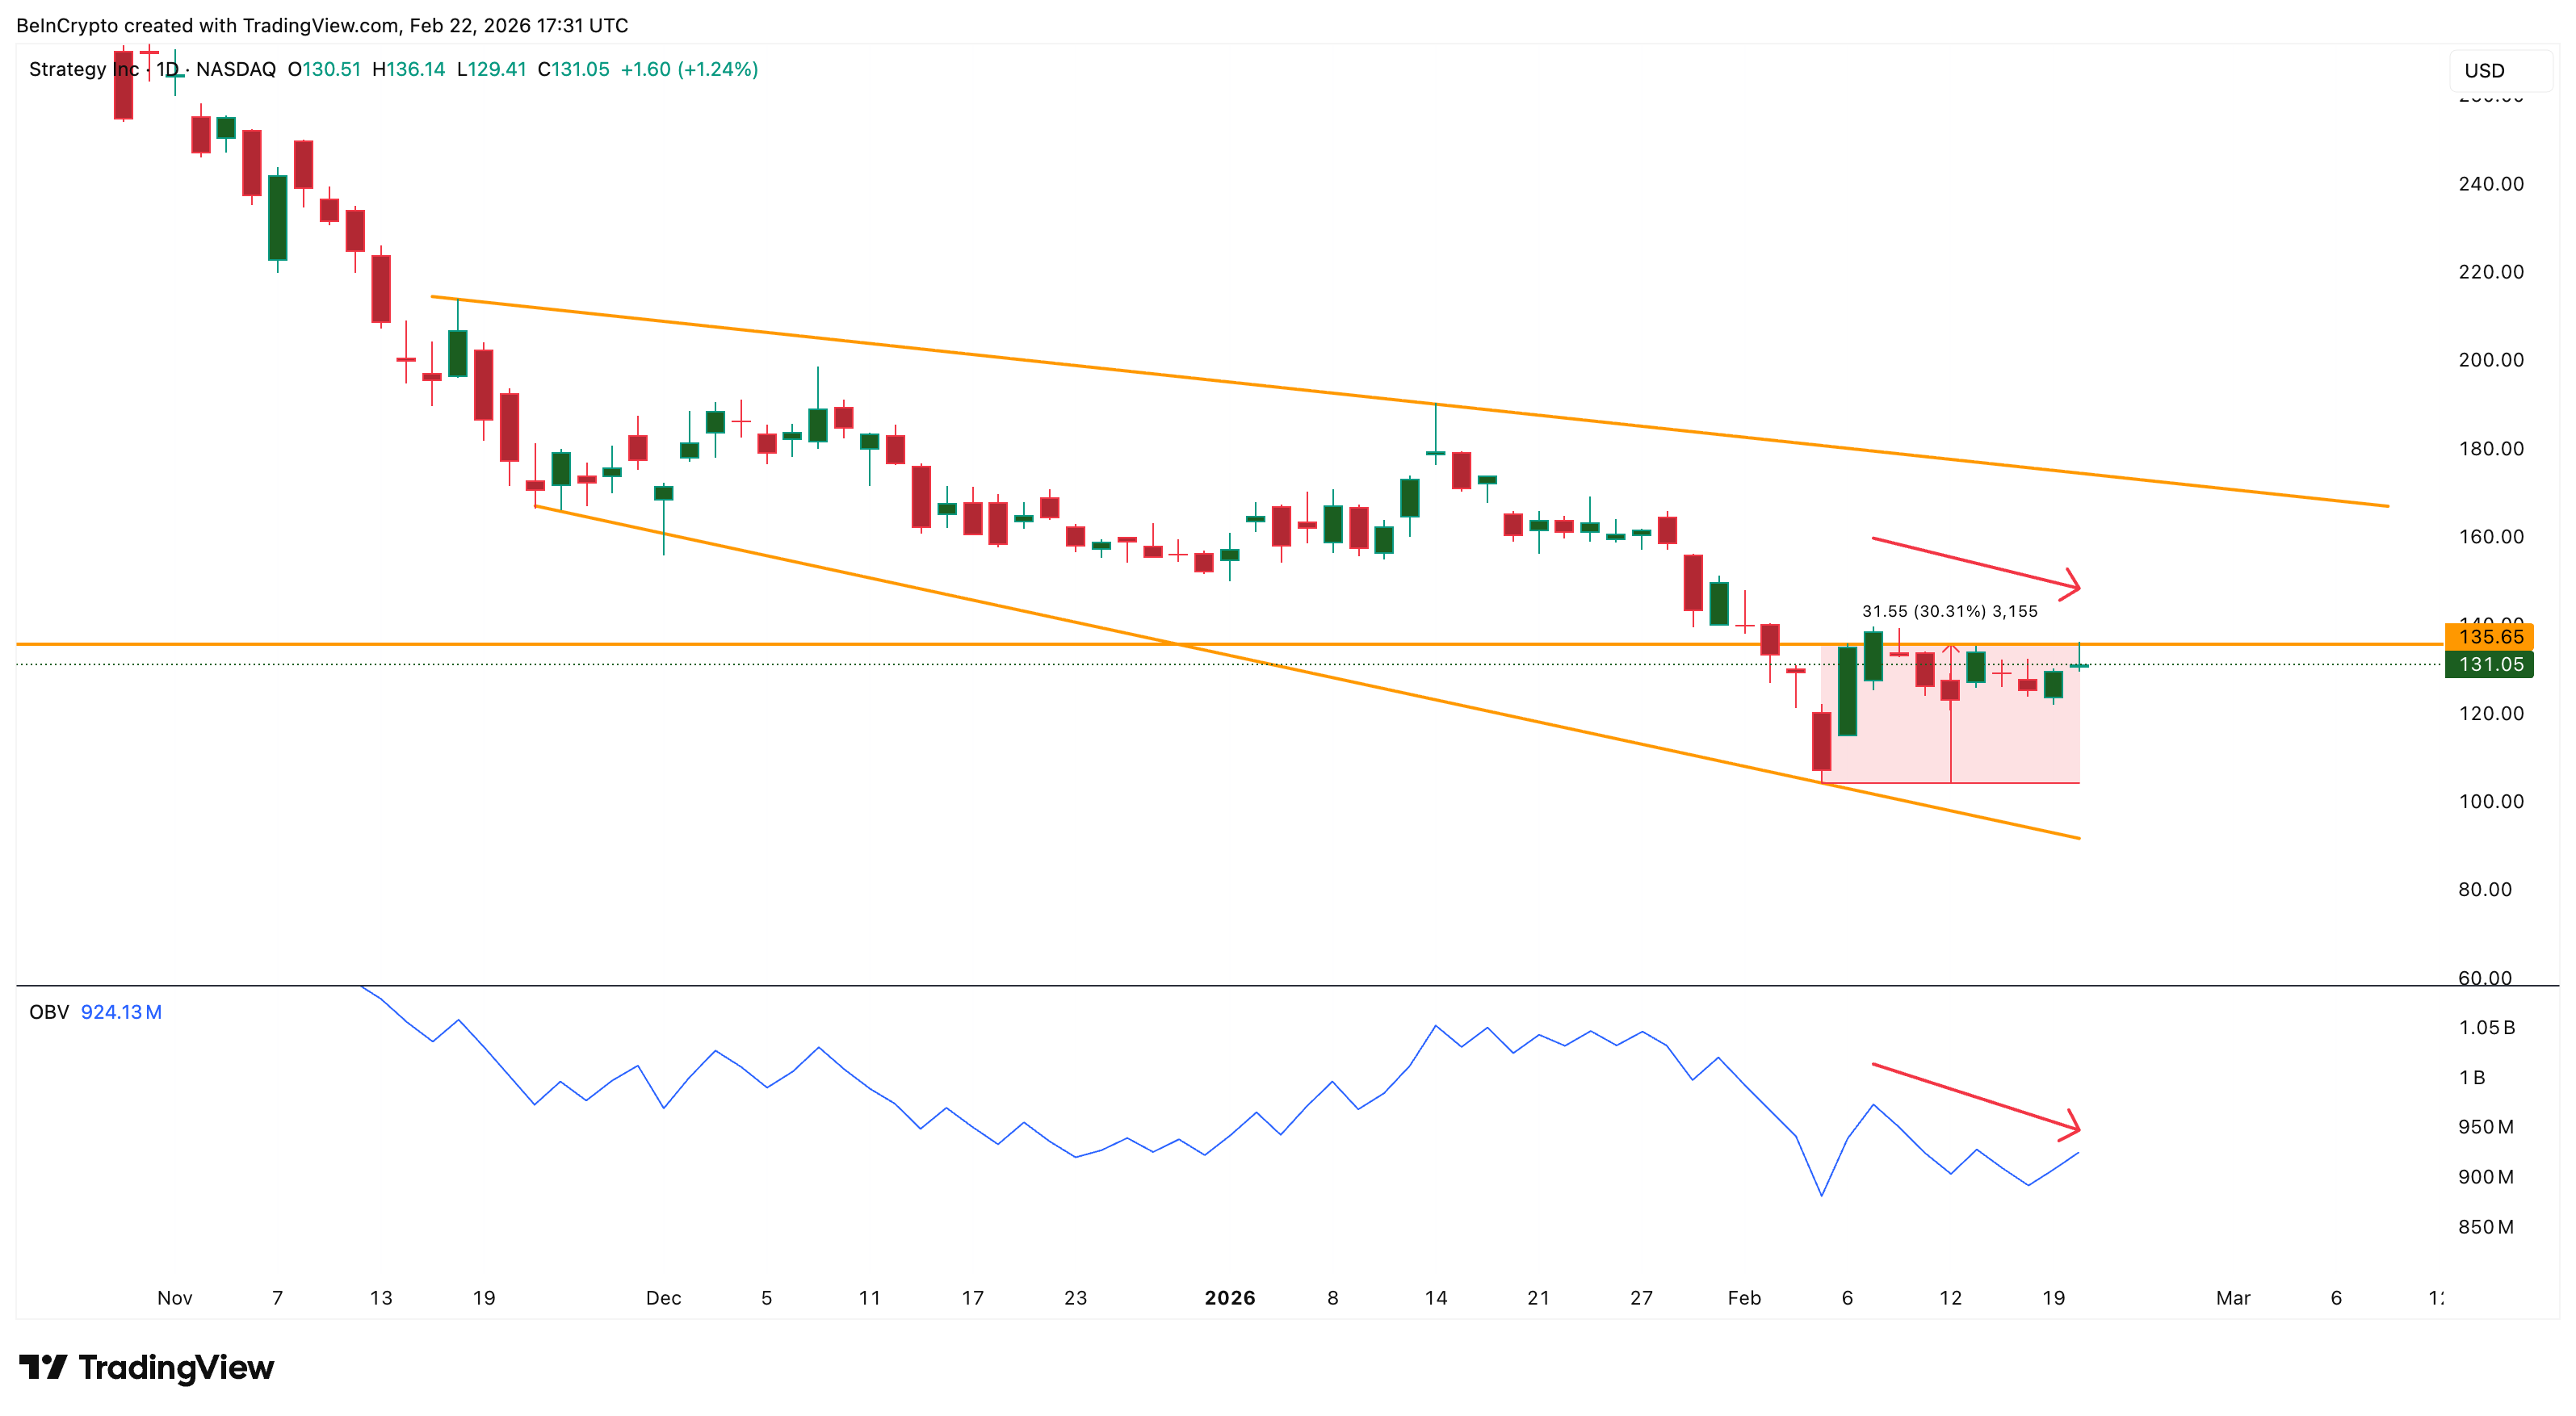
When OBV declines faster than price, it usually signals weakening conviction among investors, possibly retail. This suggests that fewer participants are willing to accumulate the MSTR stock at current levels.
However, not all signals are negative. The Money Flow Index (MFI), which measures capital inflows and dip-buying activity, shows limited strength.
Between February 5 and February 19, MFI formed a slightly higher high even as the price struggled to continue rising.
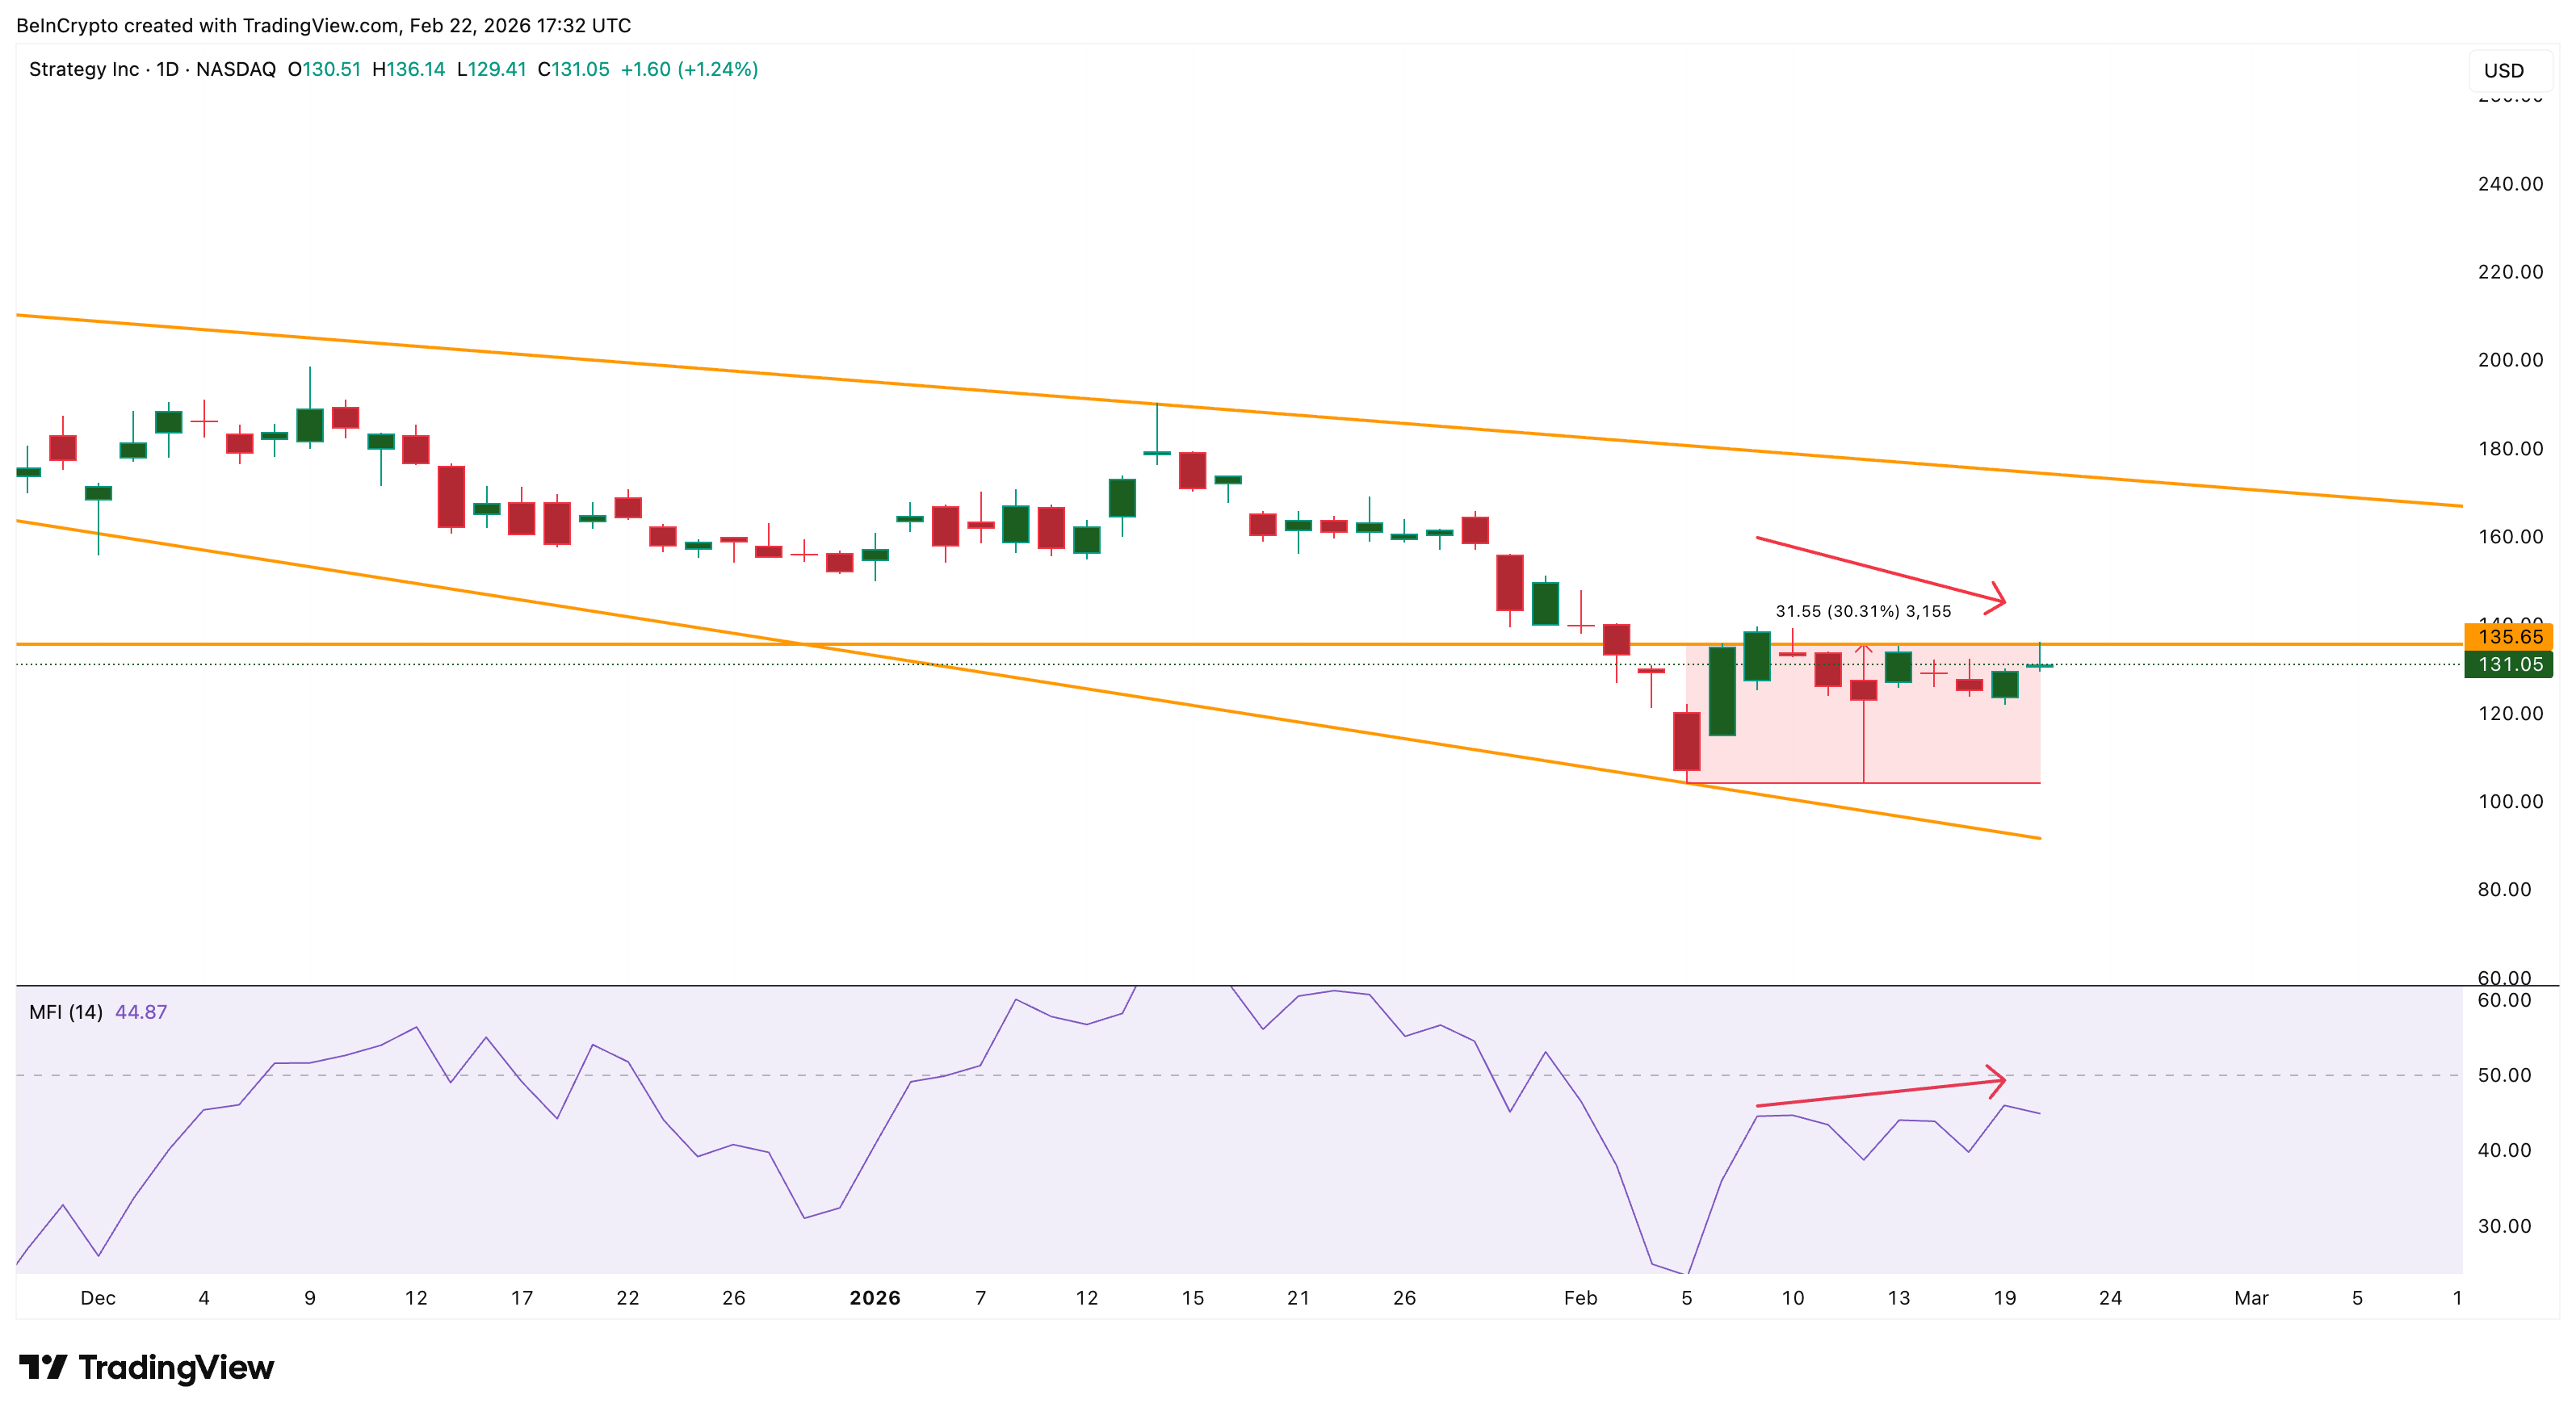
MFI tracks buying and selling pressure using both price and volume. When MFI rises while price stalls, it shows that some investors are still buying dips. This dip buying may explain why MicroStrategy’s stock price has held above recent lows despite institutional exits and weak volume. This also explains 3% green tick over the past 5 days.
But dip buying alone rarely sustains long-term rallies. Without stronger participation from large investors, price recoveries often struggle to continue. This brings the focus to the most important factor now: key MSTR stock price levels.
Key Price Levels Could Decide MSRT’s Next Major Move
The MicroStrategy stock price is currently trading inside a falling broadening wedge pattern that has been forming since November. This structure reflects ongoing volatility and uncertainty.
For the recovery to continue, MicroStrategy must first break above $139. This level is especially important because it aligns with the 20-day Exponential Moving Average (EMA), a trend indicator that tracks short-term price direction while giving more weight to recent price changes. The last time MicroStrategy reclaimed this level in January, the stock rallied nearly 15% shortly after.
If MSTR breaks above $139, it could gain strength for a move toward $163.
However, downside risks remain significantly stronger. If the MicroStrategy stock price falls below $119, the current structure would weaken considerably. A deeper drop below $106 could open the path toward $96 and potentially $86.
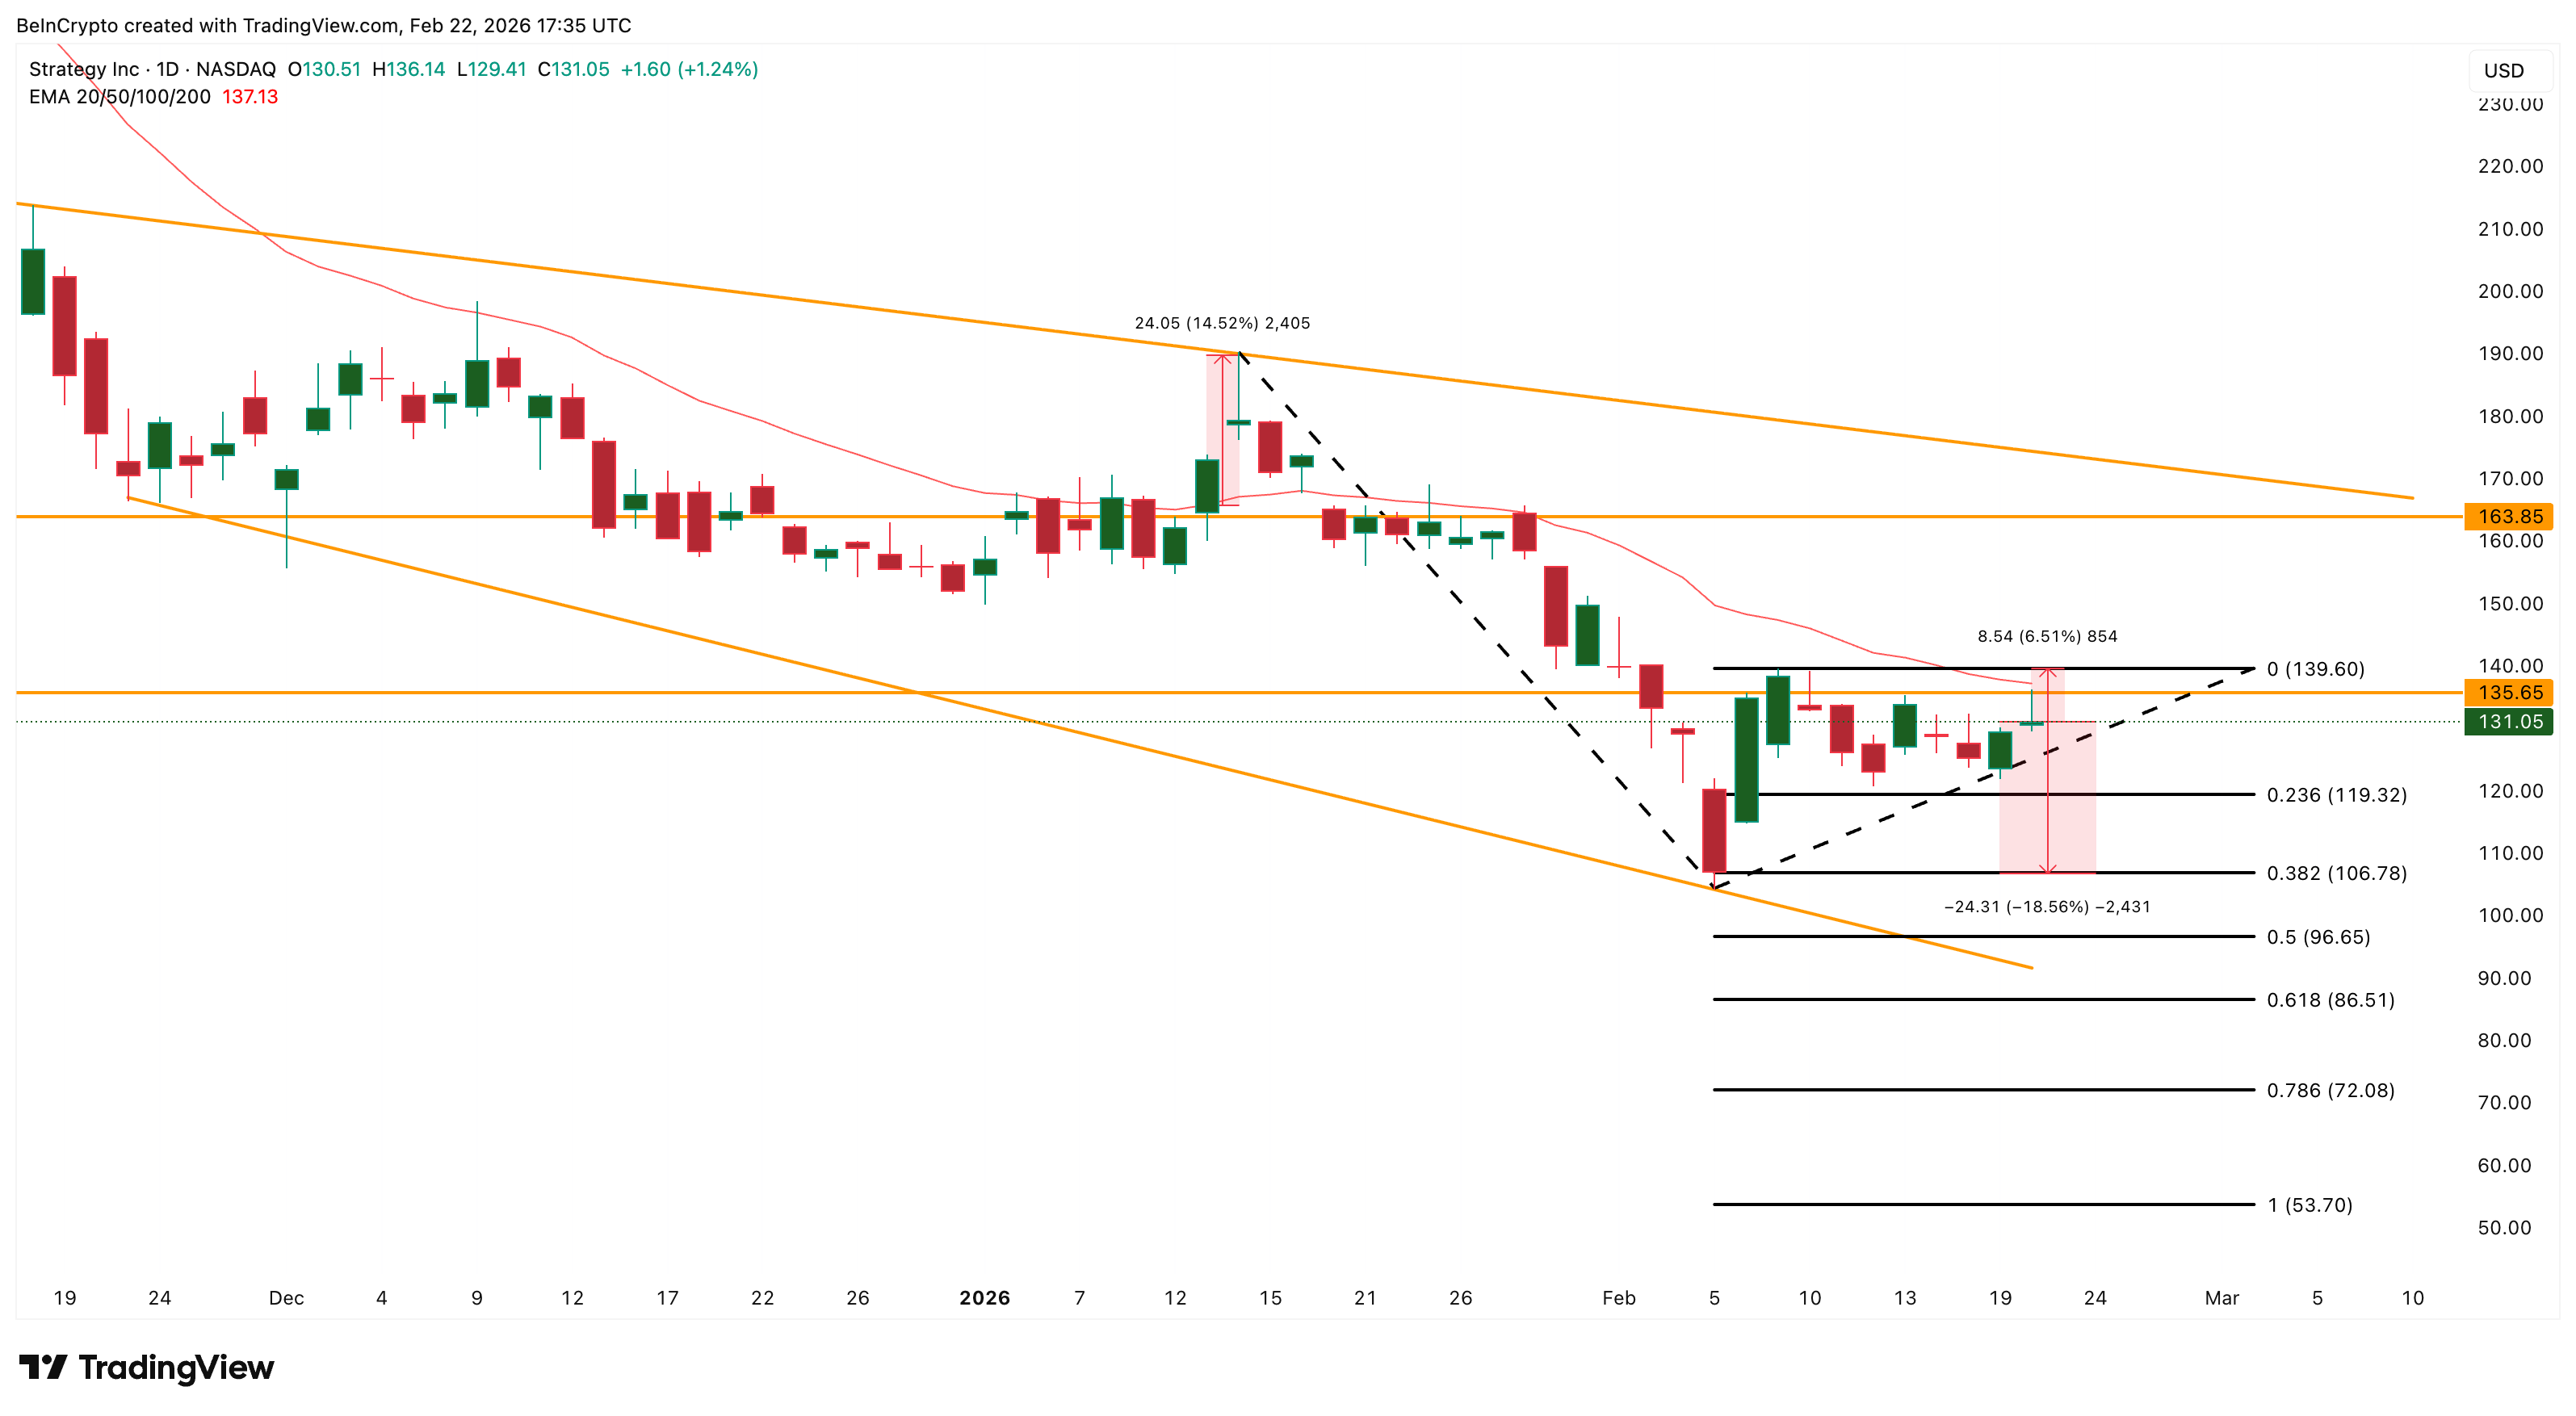
This would represent a decline of nearly 20% from current levels. MicroStrategy’s close relationship with Bitcoin makes this risk even more important.
The company currently holds over 717,000 BTC, meaning its valuation remains highly sensitive to Bitcoin price movements, which itself looks weak.
With institutional investor exits surfacing, volume weakening, and resistance overhead, the MicroStrategy stock price now faces a decisive moment. As markets reopen Monday, the next move could determine whether the recent 30% rebound holds or begins to reverse.


Samsung Electronics’ shares got a nice boost on Tuesday morning after the company predicted a record-breaking quarter fueled by the massive boom in AI hardware. The stock jumped as much as 4.8% during the day before settling into a 1.76% gain by the close.
Summary
- Samsung Electronics shares rose after forecasting record Q1 profit, driven by strong AI memory demand.
- Operating profit is projected at 57.2 trillion won, more than eight times higher year over year and above analyst estimates.
- Supply chain risks tied to Middle East tensions could disrupt chip materials like helium and weigh on the outlook if prolonged.
According to its early estimates, Samsung is looking at an operating profit of roughly 57.2 trillion won, which is about $37.8 billion, for the first quarter. To put that massive figure in perspective, it is more than eight times what the company made during the same time last year.
If these numbers hold, it will set a brand new quarterly record for the company. The projected profit is nearly triple their previous all-time high and easily crushed the 42.3 trillion won that analysts were originally expecting.
The revenue side looks just as impressive. Samsung expects sales to hit about 133 trillion won, which is a nearly 70% jump year over year. This would also mark the first time the company’s quarterly revenue has ever crossed the 100 trillion won threshold.
MS Hwang, a research analyst at Counterpoint Research, told CNBC that Samsung’s latest numbers are so huge that they are now rivaling the scale of global Big Tech giants.
The strong outlook is largely tied to demand for high-bandwidth memory, or HBM, a critical component used in accelerators from companies like NVIDIA and AMD that power artificial intelligence workloads. Expansion of data centers and rapid growth in AI model training have significantly increased memory requirements, tightening supply and pushing prices higher.
Industry projections suggest memory prices tied to data center applications will continue rising in the coming months. Samsung’s earnings trajectory shows how deeply the AI boom has translated into financial performance, with memory chips forming the core of its profit engine.
Demand for HBM has surged over the past year, leading to supply shortages across the memory market and driving sharp increases in both pricing and shipment volumes. Hwang noted that commodity memory prices could rise by more than 50% in the second quarter, with tight supply conditions expected to persist.
Samsung is also looking to regain its footing in the high-bandwidth memory segment after ceding early leadership to domestic rival SK Hynix, which was quicker to supply advanced AI memory.
Samsung’s Device Solutions division, which houses its memory chip business, accounted for 39% of total revenue and 57% of operating profit in 2025, underlining the segment’s importance to overall earnings.
The company is set to release its full earnings report later this month. While current projections point to strong performance, external risks remain.
Geopolitical risks in focus
Rising tensions in the Middle East are starting to disrupt semiconductor supply chains, with shipments of key materials such as helium facing delays.
The U.S.–Israel conflict involving Iran has raised concerns about access to these inputs, which are essential for chip production, increasing the risk of operational challenges for major manufacturers like Samsung Electronics and SK Hynix.
“If the Middle East conflict ends quickly, it will not significantly impact profits. However, if it persists for several months or longer, it will lead to severe consequences,” Hwang said.
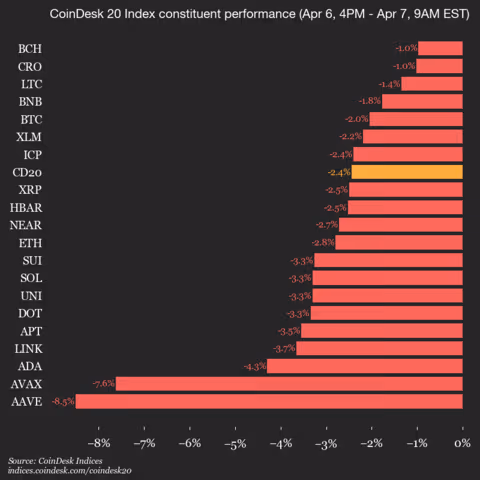
CoinDesk Indices presents its daily market update, highlighting the performance of leaders and laggards in the CoinDesk 20 Index.
The CoinDesk 20 is currently trading at 1917.55, down 2.4% (-47.87) since yesterday’s close.
All 20 assets are trading lower.

Leaders: BCH (-1.0%) and CRO (-1.0%).
Laggards: AAVE (-8.5%) and AVAX (-7.6%).
The CoinDesk 20 is a broad-based index traded on multiple platforms in several regions globally.
Operation Atlantic: A proactive strike against evolving crypto scams
Crypto scams have become highly sophisticated cross-border operations that exploit advanced technology and human psychology. By the time victims become aware of the fraud, the stolen cryptocurrency is often rapidly dispersed across a chain of wallets and exchanges in multiple countries.
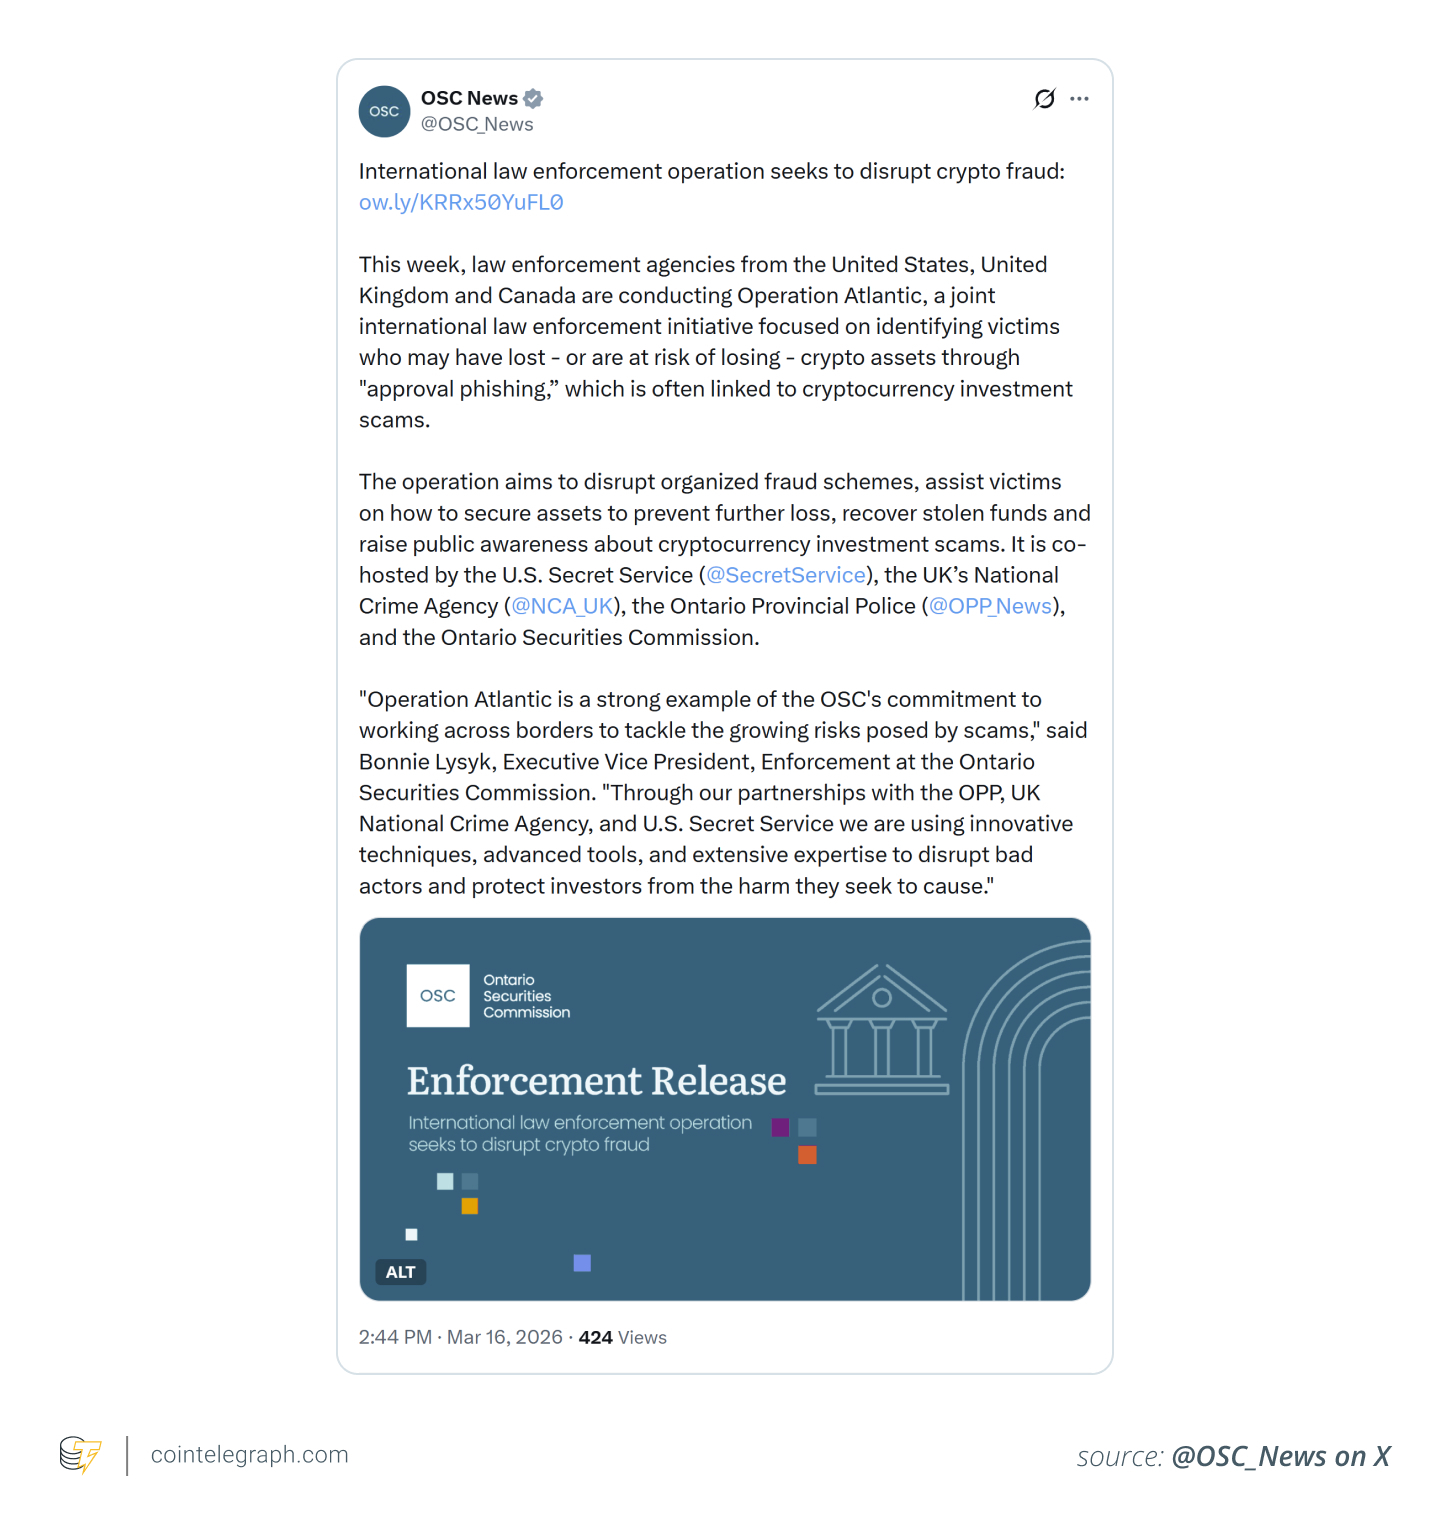
Operation Atlantic represents a coordinated international effort by law enforcement agencies from the US, the UK and Canada to counter this threat. Rather than limiting itself to post-incident investigations, the operation focuses on identifying, tracking and disrupting crypto scams while they are still in progress.
The initiative brings together key agencies, including the US Secret Service, the US Attorney’s Office for the District of Columbia, the Ontario Provincial Police, the Ontario Securities Commission, the Royal Canadian Mounted Police, the UK Financial Conduct Authority, the UK National Crime Agency and the City of London Police.
Contrary to conventional investigations that begin only after funds have been stolen, Operation Atlantic is structured to:
-
Identify victims who are at risk
-
Detect active scam infrastructure
-
Interrupt fraudulent transactions
-
Help recovery efforts where feasible
Officials have stressed that the primary objective is to disrupt scams in near real time, marking a significant shift toward faster, more proactive enforcement strategies.

Why approval phishing lies at the heart of Operation Atlantic
A particular form of fraud known as approval phishing lies at the center of Operation Atlantic. Rather than stealing private keys or seed phrases, attackers deceive users into signing what appear to be legitimate blockchain transactions.
These transactions grant scammers permission to spend tokens directly from a victim’s wallet. Once approval is given, the attacker gains the ability to:
This makes approval phishing particularly dangerous. Victims often remain unaware that anything is wrong until their assets begin disappearing.
Scammers frequently integrate this technique into larger scams, such as fake investment platforms or gradual trust-building schemes.
From investigation to intervention
The standout feature of Operation Atlantic is its emphasis on real-time disruption rather than post-event analysis.
This strategy rests on a straightforward idea: While crypto transactions are irreversible, they are also public and fully traceable.
By using blockchain analytics, authorities and private-sector partners can:
-
Detect suspicious wallet activity
-
Identify addresses linked to known scams
-
Track fund flows toward exchanges or liquidity pools
-
Alert platforms and investigators
-
Contact victims before their funds are completely drained
This model does not guarantee full recovery, but it opens a critical window during which meaningful intervention remains possible.
Did you know? The US Secret Service, originally established to combat currency counterfeiting in 1865, now tracks crypto fraud using blockchain analytics. It is one of the oldest agencies adapting to one of the newest financial systems.
Building on earlier initiatives
Operation Atlantic did not happen overnight. It builds upon earlier efforts such as Project Atlas, which was launched in 2024 by Canadian authorities in partnership with the US Secret Service to target crypto fraud networks.
It also draws on lessons from Operation Spincaster, an effort that involved blockchain analytics firms, exchanges and law enforcement agencies.
Spincaster demonstrated that coordinated action could deliver tangible results:
-
Thousands of scam-linked wallet leads identified
-
Significant losses mapped across jurisdictions
-
In some cases, victims were warned in time to revoke malicious approvals
These initiatives suggest that crypto fraud can be interrupted while it is still in progress.
What “real time” actually means
The concept of real-time disruption is sometimes misunderstood. It does not mean instant recovery or guaranteed prevention.
Instead, it operates across three stages:
-
Pre-loss prevention: spotting suspicious approvals before funds are moved
-
Mid-transaction disruption: flagging or freezing assets during transfers
-
Post-loss response: attempting recovery after funds have been dispersed
Operation Atlantic concentrates mainly on the first two stages, where intervention is still feasible.
Its success depends on how quickly data can be analyzed, shared and acted upon across borders and platforms.
Did you know? Approval phishing scams often exploit wallet permissions rather than passwords, which means victims technically authorize the theft themselves. This psychological twist makes these scams harder to detect than traditional hacking attempts.
Why scams now operate like organized networks
Approval phishing scams are generally not standalone events. They typically operate as structured networks with several interconnected parts:
-
Social engineering pipelines to attract victims
-
Fake interfaces or decentralized applications
-
Wallet approval mechanisms
-
Consolidation addresses used to pool stolen funds
-
Exchange off-ramps for cashing out
This layered setup allows scammers to scale their operations while reducing the likelihood of detection.
Operation Atlantic treats these scams as coordinated financial networks rather than isolated crimes, an approach that is central to its real-time disruption strategy.
The scale of the problem
The urgency behind Operation Atlantic stems from the enormous scale of crypto fraud.
Approval phishing alone has been linked to billions of dollars in losses in recent years, affecting thousands of victims across multiple jurisdictions.
Even more concerning is that many incidents go unreported, suggesting the true losses may be substantially higher.
Monthly figures also show that while overall exploit losses may vary, phishing attacks continue to rise, confirming that user-targeted scams remain one of the most persistent threats in crypto.
Did you know? Law enforcement agencies increasingly use blockchain clustering to map entire scam networks, sometimes revealing thousands of linked wallets behind a single fraud operation. This forensic technique groups related wallet addresses.
The role of public-private coordination
A key aspect of Operation Atlantic is the close partnership between law enforcement and private-sector organizations.
Each participant contributes in specific ways:
-
Blockchain analytics firms identify suspicious patterns and wallet clusters
-
Exchanges monitor inflows and flag deposits linked to scams
-
Stablecoin issuers may help freeze funds in targeted cases
-
Platforms and wallets can warn users or block malicious interactions
This level of coordination enables faster responses than conventional investigations, which often rely on slower legal procedures.
At the same time, it raises expectations for platforms to play a more active role in fraud detection.
The limits of real-time disruption
Despite its goals, Operation Atlantic faces several structural constraints:
-
Once funds are bridged or layered across multiple services, recovery becomes extremely difficult
-
User behavior remains a major vulnerability, particularly in social engineering scenarios
-
Cross-border legal processes can still delay enforcement actions
-
Wallet anonymity makes victim identification more complicated
In many cases, the most realistic outcome is preventing further losses rather than achieving full recovery of stolen assets.
What this means going forward
Operation Atlantic reflects a broader shift in how crypto-related crime is being tackled.
Rather than viewing fraud as a fixed, one-time event, authorities now treat it as a dynamic, ongoing process that can be monitored and disrupted while it is still in progress.
For users, this shift may result in:
-
More frequent warnings about suspicious transactions
-
Greater emphasis on understanding wallet permissions
-
Increased awareness of scam risks
For platforms, it could lead to:
-
Higher expectations for transaction monitoring
-
Deeper collaboration with law enforcement
-
Integration of real-time risk detection tools

Key Takeaways
- Biogen has entered into a multi-target partnership with Alloy Therapeutics to leverage Alloy’s AntiClastic™ ASO technology for developing antisense therapeutics.
- Financial terms include upfront compensation for Alloy, along with potential milestone-based payments and tiered royalty structures.
- The partnership builds on an existing relationship dating back to 2020, which initially centered on antibody-based therapies.
- RBC Capital reduced Biogen’s price target from $233 to $213 while maintaining its Outperform recommendation.
- Wall Street analysts have established a consensus price target of $210.30 for BIIB with an overweight rating.
Biogen has formalized a strategic partnership with Alloy Therapeutics, securing rights to utilize Alloy’s proprietary AntiClastic™ antisense oligonucleotide (ASO) technology platform for developing therapies targeting several yet-to-be-disclosed disease areas.
Under the terms of the arrangement, Alloy Therapeutics will collect an initial payment, with opportunities to earn additional compensation through development and commercial milestones, plus royalty payments tied to any successfully marketed products.
While the two biotechnology firms have maintained a collaborative relationship since 2020, their previous work concentrated on antibody-based treatment development. This latest agreement marks a strategic shift toward genetic medicine applications.
Biogen brings substantial experience to ASO drug development. The company’s Spinraza, approved for treating spinal muscular atrophy, represents one of the commercial success stories in antisense therapy. This new collaboration aims to expand that expertise through Alloy’s technology platform.
Alloy CEO Errik Anderson characterized the partnership straightforwardly: “Biogen is a leader in the space and has made huge contributions to ASO technologies. We view this as validation and an opportunity to build on their experience.”
The collaboration will prioritize three key objectives for Alloy’s platform: increasing therapeutic potency, reducing immunogenic responses, and improving targeted tissue delivery.
Alloy’s Expanding Partnership Portfolio
Headquartered in Waltham, Massachusetts, Alloy has established a business model centered on collaborative drug discovery and development with biopharmaceutical companies. Since launching in 2017, the company has executed approximately 200 partnership agreements, with over 100 producing licensed therapeutic candidates.
The platform has contributed to 22 drug candidates that have advanced into clinical testing. In 2024, Sanofi entered into an agreement potentially worth up to $400 million to access this same ASO technology for developing central nervous system treatments.
Christian Cobaugh, who leads Alloy’s Genetic Medicine Division as CEO, indicated the Biogen collaboration will enable the company to expand its involvement beyond initial discovery phases into later-stage development activities.
Alloy differentiates itself from typical platform biotechnology companies by focusing exclusively on partnerships rather than developing an internal proprietary pipeline.
Wall Street’s Perspective on Biogen
From an analyst perspective, RBC Capital Markets revised its price target for BIIB downward to $213 from a previous $233 on April 7, though the firm maintained its Outperform rating.
According to FactSet’s analyst consensus data, the mean price target for Biogen shares currently sits at $210.30, accompanied by an overweight rating across the Street.
BIIB shares declined 2.82% on the trading day when the partnership was publicly announced.

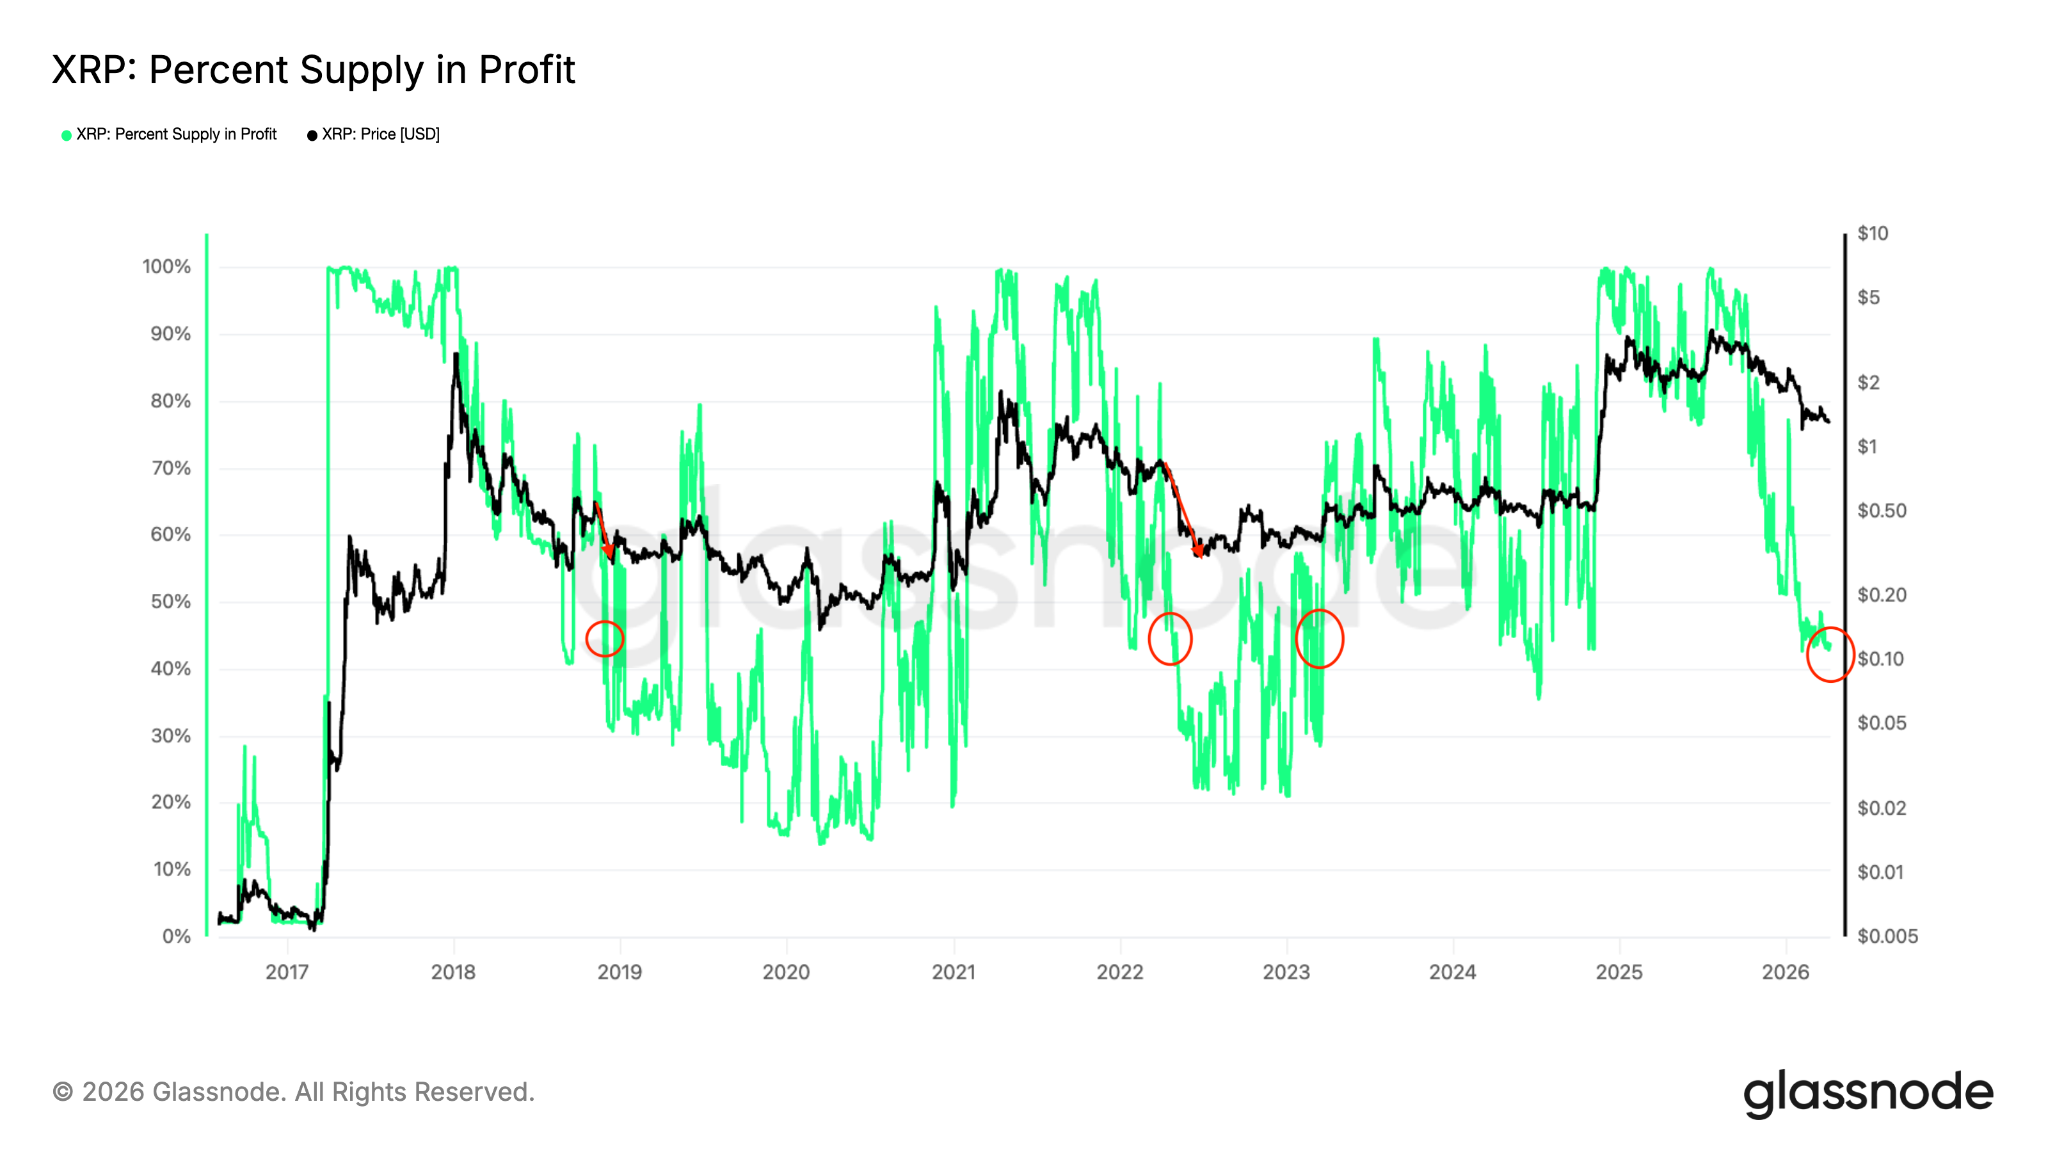
XRP (XRP) is staring at a potential drop toward $1.10, as a decline in profitable supply suggests growing bearish momentum and a classic setup for new lows.
Key takeaways:
-
XRP supply in profit has dropped to 43%, levels last seen in November 2024.
-
Investors have continued selling their XRP holdings, realizing losses at $110 million per day.
-
XRP rising wedge breakdown targets $1.10.
XRP supply in profit drops below 50%
As of Tuesday, 43% of all XRP coins were in profit, levels last seen in November 2024, according to onchain data resource Glassnode.
Historically, the metric’s drop below 50% has signaled a transition from optimism to despair characterized by panic selling and high capitulation, as seen in the last stages of previous bear markets.
Related: XRP risk-reward improves as whale accumulation rises: Will price follow?
Between January and June 2022, for instance, XRP price dropped to $0.30 from over $0.75, a decline coinciding with XRP’s profitable supply falling to as low as 20% from just under 50%. A similar scenario was seen in 2018 when XRP price dropped another 70%, with the supply in profit going as low as 15%.

In fact, investors who accumulated XRP above $2 over the last 12 months “have been realizing losses at a pace of $20M–$110M/day since November 2025,” Glassnode added.

In a Tuesday post on X, analyst Crypto Town Hall said this “reflects widespread holder drawdowns, often seen during late-stage corrections,” leading to sharp drops as holders continue realizing losses.
Additionally, the average wallets active on the XRP Ledger over the past year are down 41% on their investments.
“This is the lowest MVRV (Mean Value to Realized Value) for XRP traders since the FTX crash in November, 2022,” onchain data resource Santiment said in a Tuesday post on X, adding:
“Significantly negative average returns imply that there is much lower risk than average in buying or adding on to your $XRP positions, due to the fact that competing traders are already in severe ‘blood in the streets’ territory.”

This means fresh selling could be coming as investors seek to cut their losses, a key ingredient in keeping the downtrend going toward the $1.10 target.
XRP rising wedge breakdown targets $1.10
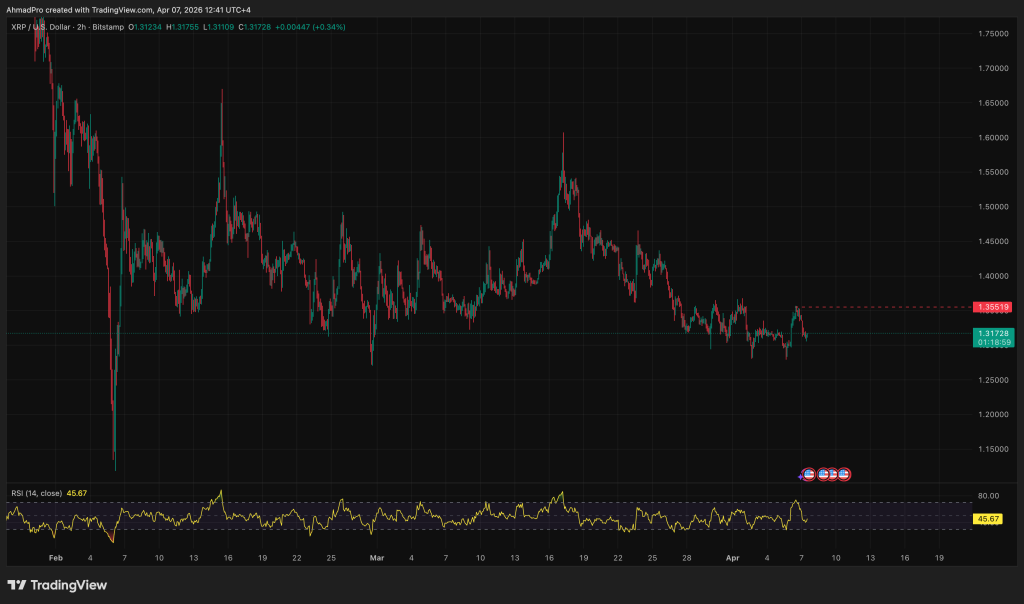
XRP/USD is in the breakdown phase of a rising wedge on the daily time frame, a bearish pattern that forms when price compresses inside two upward-sloping trendlines after a sharp decline.

The price slipped below the wedge’s lower trend line at $1.37 on March 27 and is now attempting a typical post-breakdown retest near the 50-day simple moving average around $1.38. That area is acting as immediate resistance.
If XRP fails to reclaim the trendline and moving averages, the setup points to a deeper move toward the pattern’s measured target near $1.10, roughly 16% below the current levels.
This is close to predictions by Polymarket bettors who price in a 57% chance that XRP price will hit $1.20 before the end of April.

As Cointelegraph reported, if bulls fail to reclaim the moving averages and the price breaks below $1.27, the XRP price risks falling toward $1.11 and eventually to the $1 psychological level.
This article is produced in accordance with Cointelegraph’s Editorial Policy and is intended for informational purposes only. It does not constitute investment advice or recommendations. All investments and trades carry risk; readers are encouraged to conduct independent research before making any decisions. Cointelegraph makes no guarantees regarding the accuracy or completeness of the information presented, including forward-looking statements, and will not be liable for any loss or damage arising from reliance on this content.
XRP Crypto slipped to $1.31 after a hard rejection at $1.35 left traders with little to show from a breakout attempt that briefly looked credible.
The 2% drop is secondary – what matters is the combination of that ceiling rejection and visibly thinning order book depth, a setup that historically precedes sharper directional moves.
The failed push came off a March 31 high of $1.37, with XRP unable to clear $1.40 resistance and grinding lower through a $1.28–$1.33 range ever since.
That recent run toward $1.35 now looks like a distribution zone rather than a launchpad, and the market cap sits at $80.6 billion with 24-hour volume at just $2.01 billion – reduced participation that confirms the liquidity problem is real. The chart now forces a binary question: does $1.28 hold, or does the next support at $1.15 come into play faster than bulls expect?
Discover: The best pre-launch token sales
XRP Crypto, Reclaim $1.35 or Retreat to $1.15?
XRP Crypto is trading below both its 50-day EMA ($1.38) and 200-day EMA ($1.88), with price pinned inside a descending channel on the 4-hour chart where both the 50-SMA and 200-SMA act as overhead ceiling.
Daily RSI reads 38 – weak momentum, but not yet in oversold territory, which means there’s no technical floor from that indicator alone. MACD is negative and expanding downward, removing any near-term momentum argument.
Key resistances sit at $1.3500; load-bearing supports are $1.3000 and $1.2698. The $1.28 level has held since February, aligning with the 23.6% Fibonacci retracement – below it, holder support thins materially until $1.15.
The bull case requires a clean reclaim of $1.35 on volume – not a wick, a close – followed by a hold above the 50-day EMA at $1.38.
That sequence opens $1.45 and, with a catalyst, $1.60 tied to regulatory progress on the CLARITY Act, which carries a 63% probability of passing in 2026 per current prediction markets. Long-term analysts maintain structurally bullish frameworks, but those scenarios require macro conditions – FOMC dovishness, easing geopolitical tensions – that aren’t present right now.
The bear case activates on a confirmed daily close below $1.28. Analysts are flagging $1.15 as the next meaningful support, with more aggressive targets at $0.80 contingent on oil above $100 and Fed rate holds through Q2.
The uncomfortable reality is that XRP is down nearly 30% year-to-date and 64% from its $3.65 all-time high, and every bounce has been sold. The single most important level: $1.28. Hold it and the range stays intact; lose it and $1.15 becomes the next anchor.
Discover: The best crypto to diversify your portfolio with
The post XRP Crypto Falls to $1.31 After Failed Breakout as Liquidity Dries Up appeared first on Cryptonews.
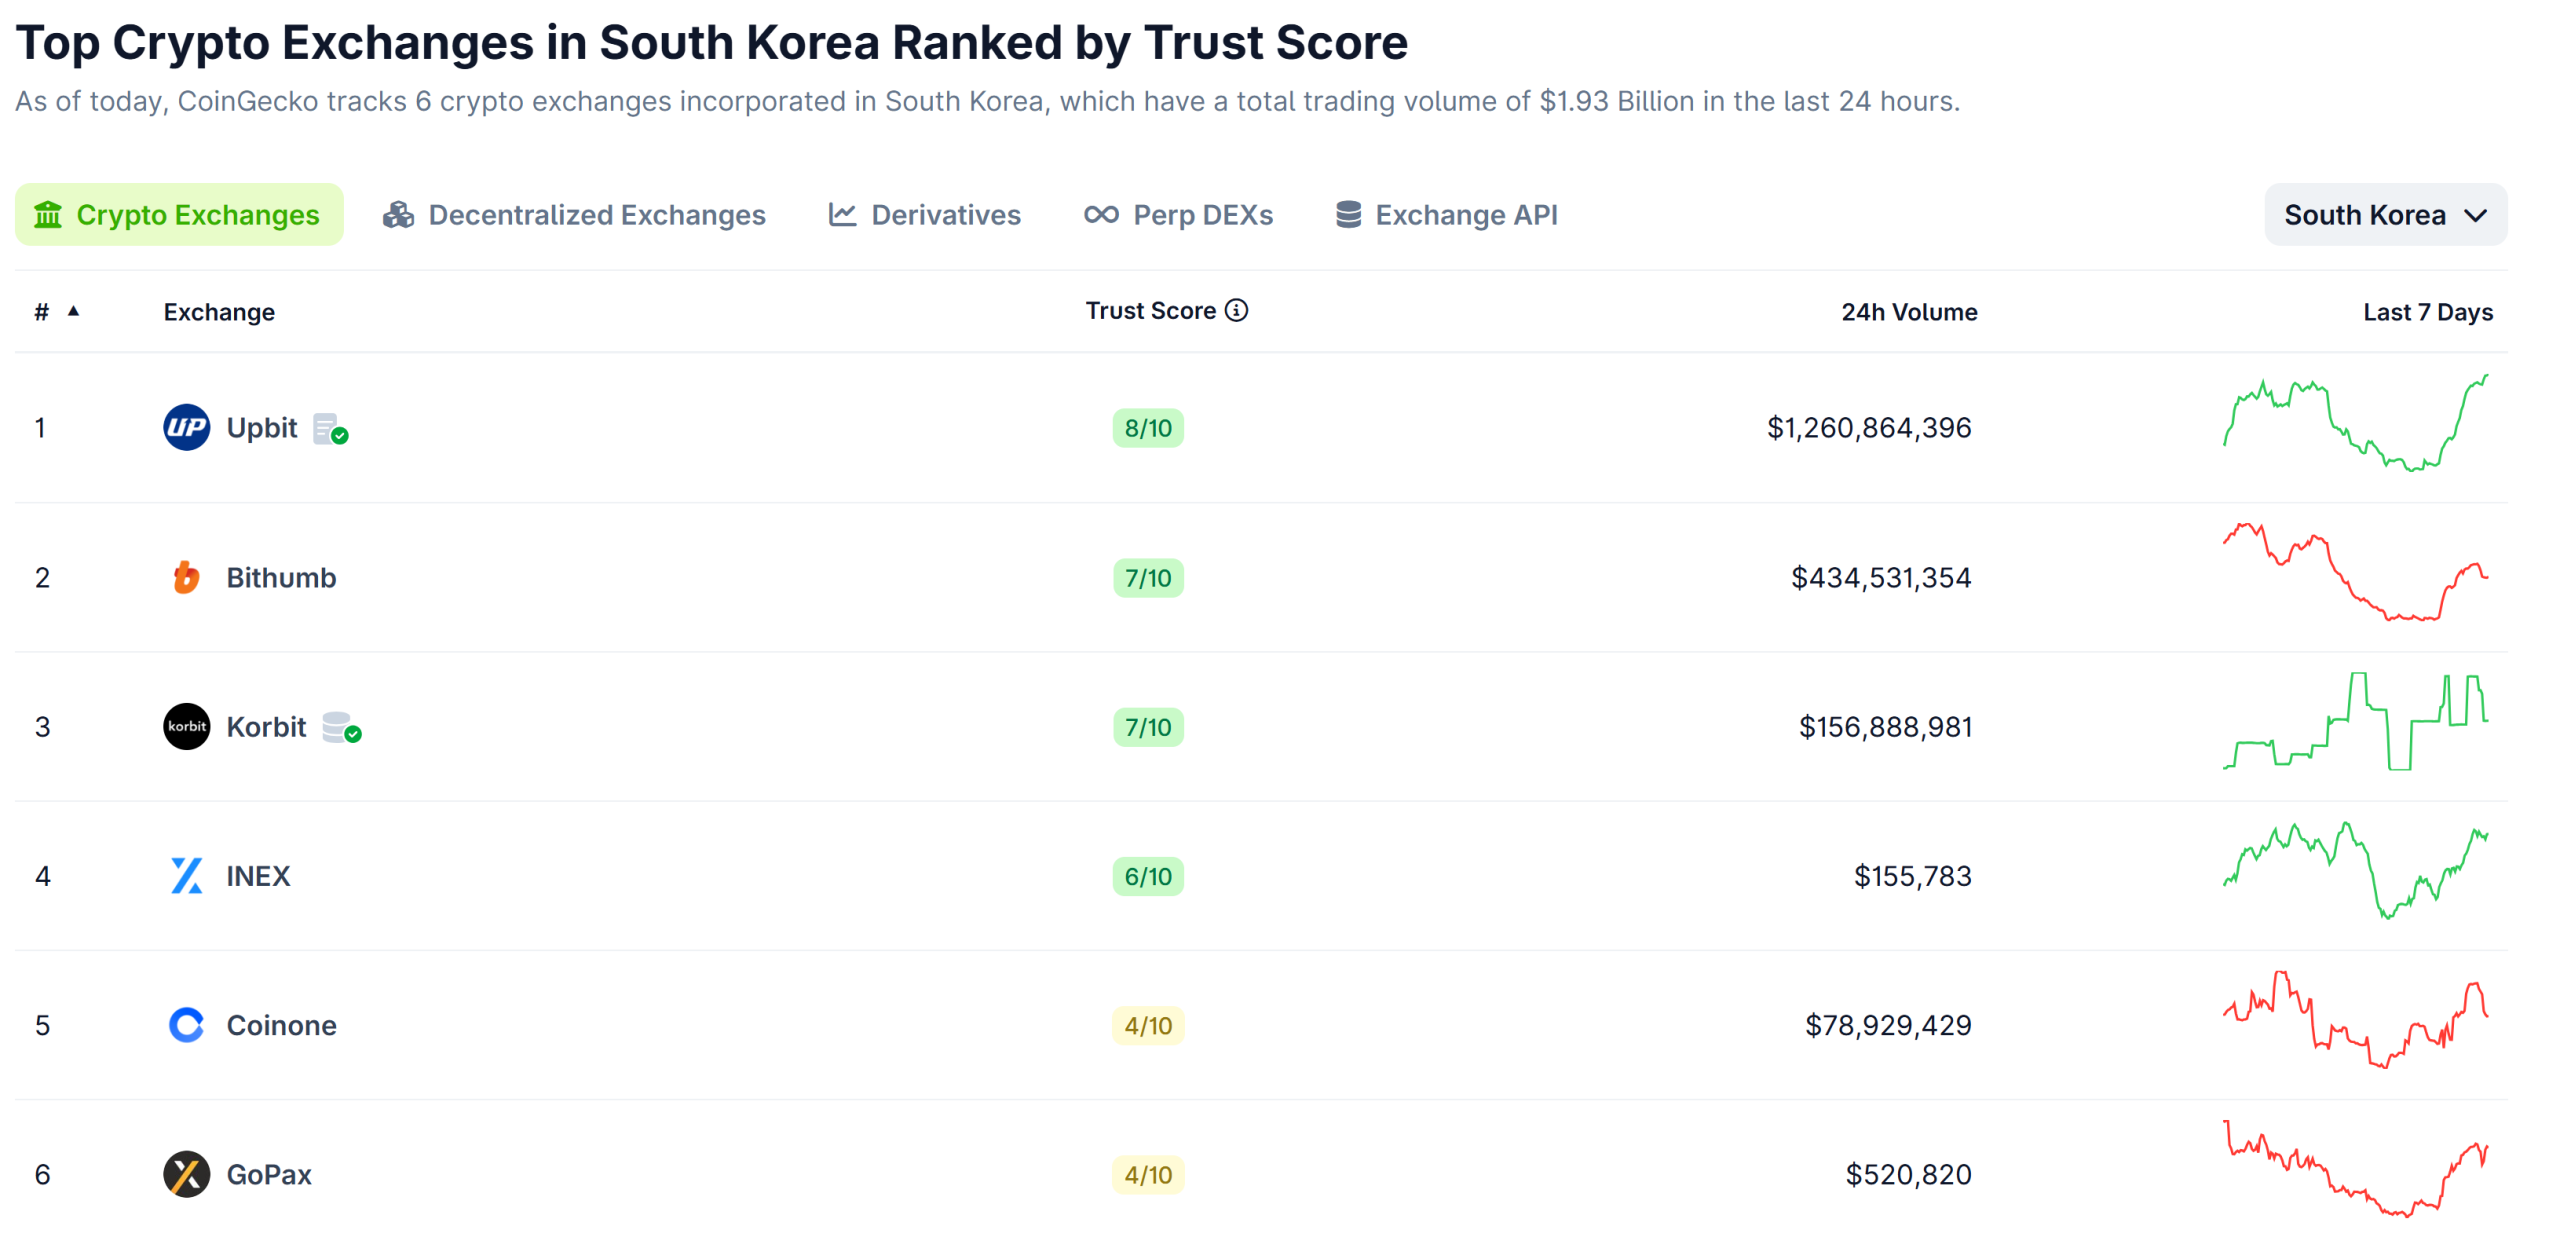
South Korea has ordered all crypto exchanges to reconcile their internal ledgers with actual asset holdings every five minutes after an inspection uncovered weaknesses in internal controls.
The directive was announced on Monday by the Financial Services Commission (FSC) after a meeting with top crypto exchanges and the Digital Asset Exchange Alliance (DAXA), during which they discussed the findings of an emergency inspection triggered by the Bithumb payout incident.
The inspection found that three of the country’s five major exchanges were reconciling balances only once every 24 hours, limiting their ability to respond quickly to discrepancies. Systems designed to halt trading during major mismatches were also found to be insufficient, raising concerns about how exchanges would handle large-scale errors.
In February, Bithumb mistakenly distributed 620,000 Bitcoin (BTC) to 249 users during a promotional event. The exchange later announced that it recovered 99.7% of the funds the same day. The remaining 0.3%, 1,788 BTC that had already been sold, was covered using company reserves.
Related: Bithumb seeks to reappoint CEO despite recent controversies: Report
South Korea mandates five-minute asset checks
Under the new measures, exchanges must implement automated ledger-to-wallet reconciliation systems operating on a five-minute cycle. They will also be required to introduce defined criteria for triggering automatic transaction halts in the event of significant discrepancies.
Beyond reconciliation, regulators are pushing for sweeping changes to internal operations. High-risk processes like promotional payouts will require stronger oversight, including third-party cross-checks and multi-level approval systems. Exchanges will also need to separate high-risk accounts and implement automated verification tools for payments.

Furthermore, external audits will shift from quarterly to monthly, while disclosures will expand to include detailed asset balances by wallet and ledger.
“The financial authorities and the DAXA plan to complete the rule changes needed to implement the improvement measures within April this year,” the FSC wrote.
Related: South Korean brokerage Korea Investment & Securities eyes Coinone stake: Report
Bithumb delays IPO to post-2028
Last week, Bithumb announced it is now targeting an IPO after 2028, marking another delay from its earlier 2025 plans as it works through restructuring and regulatory pressure. The exchange said it will focus on strengthening accounting policies and internal controls through 2027, following an advisory agreement with Samjong KPMG.
Meanwhile, Naver Financial has also delayed its planned share swap with Dunamu by about three months, now targeting a shareholder vote on Aug. 18 and completion by Sept. 30.
Magazine: South Korea gets rich from crypto… North Korea gets weapons
Crypto World
How North Korea’s 6-month long secret espionage program has crypto community rethinking security


When Drift disclosed the details behind its $270 million exploit, the most unsettling part wasn’t the scale of the loss — it was how it happened.
According to the team behind the protocol, the attack wasn’t a smart contract bug or a clever piece of code manipulation. It was a six-month campaign involving fake identities, in-person meetings across multiple countries and carefully cultivated trust. The attackers, allegedly from North Korea, didn’t just find a vulnerability in the system. They became part of it.
This new threat is now forcing a broader reckoning across decentralized finance.
For years, the industry has treated security as a technical problem, something that could be solved with audits, formal verification and better code. But the Drift incident suggests something far more complex: that the real vulnerabilities may lie outside the codebase altogether.
Alexander Urbelis, chief information security officer (CISO) at ENS Labs, argues the framing itself is already outdated.
“We need to stop calling these ‘hacks’ and start calling them what they are: intelligence operations,” Urbelis told CoinDesk. “The people who showed up at conferences, who met Drift contributors in person across multiple countries, who deposited a million dollars of their own money to build credibility: that’s tradecraft. It’s the kind of thing you’d expect from a case officer, not a hacker.”
If that characterization holds, then Drift represents a new playbook: one where attackers behave less like opportunistic hackers and more like patient operators embedding themselves socially before making a move onchain.
“North Korea isn’t scanning for vulnerable contracts anymore. They’re scanning for vulnerable people… That’s not hacking. That’s running agents,” Urbelis added.
The tactics themselves aren’t entirely new.
Investigations in recent years have shown North Korean operatives infiltrating crypto firms by posing as developers, passing job interviews and even securing roles under fake identities. But the Drift incident suggests those efforts have escalated — from gaining access through hiring pipelines to running months-long, in-person relationship-building operations before executing an attack.
‘The Achilles’ heel’
That shift is what has many security leaders most concerned. Even the most rigorously audited protocol can still fail if a contributor is compromised.
David Schwed, chief operating officer of SVRN and a former CISO at both Robinhood and Galaxy, sees the Drift case as a wake-up call.
“Protocols need to understand what they’re up against. These aren’t simple exploits. These are well-planned, months-long operations with dedicated resources, fabricated identities, and a deliberate human element,” Schwed told CoinDesk. “That human element is the Achilles’ heel for many organizations.”
Many DeFi teams remain small, fast-moving and built on trust. But when a handful of individuals control critical access, compromising one can be enough.
Schwed argues that the response needs to be updated. “The answer is a well-fortified security program that protects not just the technology, but the people and the process… Security needs to be foundational to the project and the team.”
Some protocols are already adjusting. At Jupiter, one of Solana’s largest DeFi platforms, the baseline of audits and formal verification remains, but leaders claim it’s no longer sufficient.
“Clearly, securing code via multiple independent audits, open sourcing, and formal verification is just table stakes. The surface area for attacks has broadened substantially,” said COO Kash Dhanda.
That broader surface now includes governance, contributors and operational security. Jupiter has expanded its use of multisigs and timelocks while investing in detection systems and internal training.
“Given that flesh is more vulnerable than code, we’re also updating opsec training and monitoring for key team members,” Dhanda said.
Even then, he added, “there is no end-state for security” and complacency remains the biggest risk.
For protocols like dYdX, the Drift incident reinforces a reality that can’t be engineered away entirely.
“It’s an unfortunate fact of life that crypto projects are being increasingly targeted by state-sponsored bad actors… developers must take precautions to prevent and mitigate the impact of social engineering compromises, but users should also be aware that given the increasing sophistication of bad actors the risk of such compromises cannot be totally eliminated,” said David Gogel, COO of dYdX Labs.
That evolving threat model is also shifting responsibility toward users themselves.
“Users who are active in DeFi should take the time to understand the technical architecture of protocols or smart contracts that hold their funds, and should factor into their risk assessments the role and nature of any multisigs for software upgrades and the possibility that those could be maliciously compromised,” Gogel added.
‘Threat model’
For some founders, the Drift exploit underscores a more uncomfortable conclusion: that trust itself has become a vulnerability.
“The Drift exploit wasn’t a code vulnerability. It was a six-month intelligence operation that exploited trust between humans,” said Lucas Bruder, CEO of Jito Labs.
In practice, that means designing systems that assume compromise — not just bugs.
“Smart contract audits are table stakes. The real attack surface is your team, your multisig signers, and every device they touch.”
That mindset is becoming central to how DeFi approaches security. Schwed of SVRN says it starts with asking not just how a protocol works, but how it could fail.
“Start with a threat model. Ask yourself, how can I be exploited? If one of the project owners becomes compromised, what’s the blast radius of that scenario?”
In that sense, the Drift exploit may be remembered less for the funds lost than for what it revealed — that the biggest risks in DeFi may no longer live in the code, but in the people who run it.

Bitcoin price is doing something it hasn’t done in months by moving on its own terms, breaking the recent bearish prediction. Trading near $68,500 and dropping by 2% today, BTC is quietly separating from the tech equity complex that dragged it lower through most of early 2026.
The catalyst isn’t a halving narrative or ETF inflow. It’s war, and the AI valuation crisis that is hitting software stocks. The full implications for price haven’t been priced in yet.
Since the outbreak of the U.S.-Iran conflict on Feb. 28, Bitcoin’s correlation with the iShares Expanded Tech-Software Sector ETF (IGV) collapsed from near-perfect alignment at close to 1.0 to just 0.13, a level signaling near-total decoupling, before partially recovering to around 0.7.
WOW all eyes on $IGV capitulating now – almost a 1-1 correlation to Bitcoin, does this mean the BTC bottom is in? tick tock, tick tock — Satoshi Flipper (@SatoshiFlipper) February 27, 2026

 https://t.co/BOzHMkMne3
Over that same period, Bitcoin has risen more than 5% while IGV has dropped more than 2%. The gap is widening. Investors appear to be rotating out of software equities, where AI-driven margin compression is hammering SaaS multiples, and treating Bitcoin as a macro hedge instead, a role gold has occupied for decades. Geopolitical shock has a way of accelerating these thesis shifts.
The 1 year chart still shows both assets deeply underwater, Bitcoin down 10%, IGV off 15%, but the divergence since late February suggests the relationship is fundamentally changing.
Discover: The best crypto to diversify your portfolio with
Bitcoin Price Prediction: Reclaim $75K as the Tech Decoupling Deepens?
At current levels, Bitcoin is trading roughly 30% below its October all-time high after a peak-to-trough decline of approximately 50%. IGV peaked slightly earlier and fell about 35% from its own top, a shallower drawdown, but one now accelerating as AI disruption fears mount across enterprise software. The divergence in recovery trajectories is stark.
The key technical level to watch is the $67,000 range. The level has flipped from resistance to support following this week’s move. A hold above that level keeps the bull case intact. The next meaningful resistance cluster sits near $74,000–$75,000, where prior consolidation and moving average confluence converge.
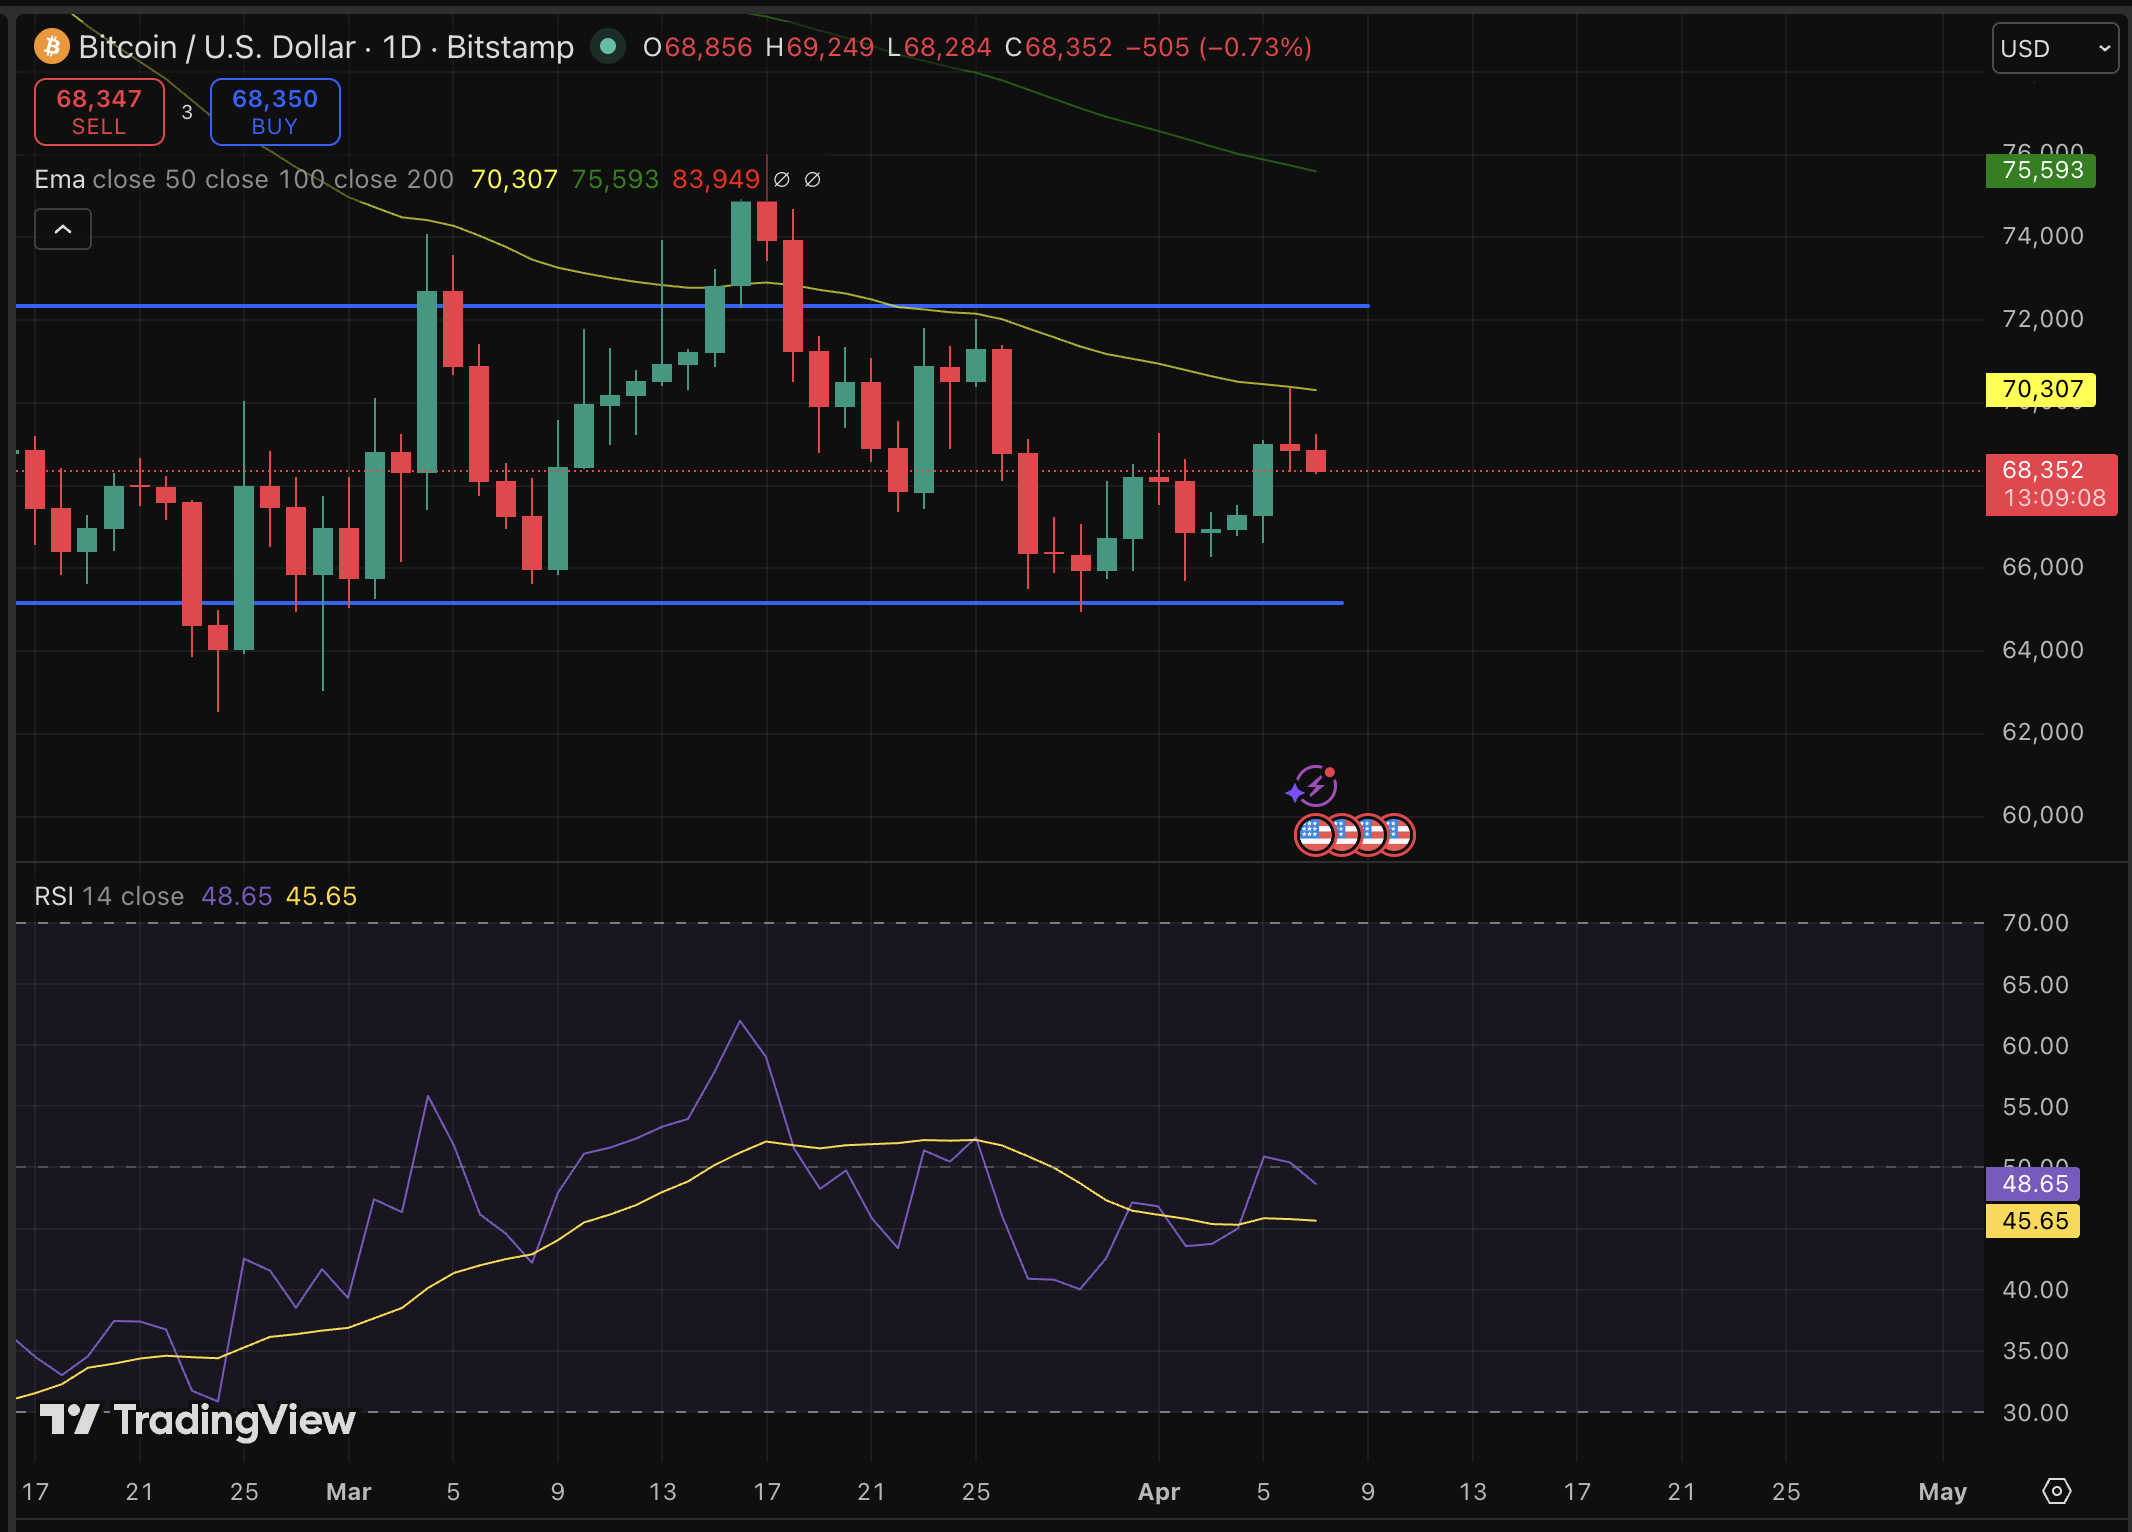
For the bulls, geopolitical tension that sustains macro-hedge demand will keep IGV’s correlation suppressed near 0.3–0.5, and BTC breaks toward $75,000–$78,000 over the next 2–4 weeks.
But, correlation can drift back toward 0.7 as markets stabilize; BTC consolidates between $67,000 and $72,000 while macro catalysts remain ambiguous. A breakdown below $67,000, or a re-coupling with equities if risk-off sentiment deepens, reopens a path toward the $54,000 level flagged by more bearish technicals.
Year-to-date, Bitcoin remains down roughly 10%, matching IGV’s losses almost exactly. That symmetry is now breaking. Whether this week’s move is a structural shift or a head-fake is the only question that matters right now.
Discover: The best pre-launch token sales
Bitcoin Hyper Targets Early Mover Upside as Bitcoin Tests Key Levels
Bitcoin at $68,500 is recovering, but a spot BTC position from here still means waiting on macro catalysts, regulatory timelines, and a 30%-plus move just to return to all-time highs. Early-stage infrastructure in the Bitcoin ecosystem offers a different risk profile entirely.
Bitcoin Hyper ($HYPER) is positioning itself at the intersection of two converging trends: Bitcoin’s resurgence as a macro asset and the explosive demand for scalable smart contract infrastructure. The project claims to be the first Bitcoin Layer 2 integrating the Solana Virtual Machine (SVM), delivering sub-second finality and low-cost smart contract execution while anchoring security to Bitcoin’s base layer.
The presale has raised $32 million at a current price of $0.0136, with 36% APY staking rewards live for early participants. The Decentralized Canonical Bridge enables native BTC transfers into the ecosystem without custodial risk.
For traders who believe Bitcoin’s decoupling thesis has legs, research Bitcoin Hyper as a higher-beta way to express that conviction at the infrastructure layer.
The post Bitcoin Price Prediction: Decoupling From Tech Stocks, Reshaped by War and AI appeared first on Cryptonews.


The Solana Foundation announced a suite of security initiatives on Monday, just five days after decentralized finance (DeFi) platform Drift Protocol suffered a $270 million exploit carried out by a North Korean state-affiliated group following a six-month social engineering campaign.
The centerpiece is Stride, a structured evaluation program led by Asymmetric Research that will assess Solana DeFi protocols against eight security pillars and publish its findings publicly. The foundation also introduced the Solana Incident Response Network (SIRN), a membership-based group of security firms and researchers focused on real-time crisis response.
The initiatives address part of the problem exposed by Drift, but not the mechanics that actually caused the loss. Drift’s smart contracts were not compromised, and its code passed audits. The vulnerability was human: The attackers spent six months building relationships with Drift contributors and compromised their devices through a malicious code repository and a fake TestFlight app.
Under Stride, protocols with more than $10 million in total value locked (TVL) that pass the evaluation will receive ongoing operational security and active threat monitoring funded by Solana Foundation grants, with coverage calibrated to each protocol’s risk profile.
For protocols with more than $100 million in TVL, the foundation will also fund formal verification, a mathematical method that checks every possible execution path in a smart contract to guarantee correctness.
In addition to Asymmetric Research, founding members include OtterSec, Neodyme, Squads, and ZeroShadow. The network is available to all Solana protocols but prioritized by TVL.
Stride’s formal verification, however, would not have caught the North Korean attack, which used the compromised devices to obtain multisig approvals that were then locked into durable nonce transactions and executed weeks later.
Neither would 24/7 monitoring of onchain activity, because the transactions were valid by design and indistinguishable from legitimate administrative actions until they were used to drain the vaults. The attack exploited the gap between onchain correctness and offchain human trust, a gap no smart contract audit or monitoring tool is built to cover.
SIRN, however, could have helped with the response. ZachXBT, an onchain security expert, criticized stablecoin issuer Circle Internet (CRCL) for failing to freeze over $230 million of its stolen dollar-pegged USDC during a six-hour window after the attack began.
A dedicated incident response network with established relationships to bridge operators, exchanges and stablecoin issuers might have shortened the response time. Whether it would have been fast enough to prevent the Wormhole bridging and obfuscation through Tornado Cash is an open question.
The foundation was careful to note that the programs “do not transfer the underlying responsibility away from the protocols themselves,” a line that reads differently after Drift’s postmortem revealed that individual contributor devices were the entry point for a nation-state attack.
Solana already hosts several free security tools for builders, including Hypernative for threat detection, Range Security for real-time monitoring, and Neodyme’s Riverguard for attack simulation.

Lightbridge Appears Attractive But Great Patience Will Probably Be Required

Samsung stock rises as AI chip boom drives sharp profit growth
Quavo Reacts After Offset Shot Outside Florida Casino


-

 NewsBeat5 days ago
Steven Gerrard disagrees with Gary Neville over ‘shock’ Chelsea and Arsenal claim | Football
-

 Business5 days ago
No Jackpot Winner and $194 Million Prize Rolls Over
-

 Fashion4 days ago
Weekend Open Thread: Spanx – Corporette.com
-

 Crypto World6 days ago
Gold Price Prediction: Worst Month in 17 Years fo Save Haven Rock
-

 Business2 days ago
Three Gulf funds agree to back Paramount’s $81 billion takeover of Warner, WSJ reports
-

 Sports3 days ago
India men’s 4x400m and mixed 4x100m relay teams register big progress | Other Sports News
-

 Business3 days ago
Expert Picks for Every Need
-

 Business5 days ago
Login and Checkout Issues Spark Merchant Frustration
-

 Sports7 days ago
Tallest college basketball player ever, standing at 7-foot-9, entering transfer portal
-

 Crypto World7 days ago
Bitcoin enters the public bond market as Moody’s gives a first-of-its-kind crypto deal a rating
-
Crypto World7 days ago
Bitcoin stalls below key resistance as technical signals skew bearish
-

 Tech5 days ago
Commonwealth Fusion Systems leans on magnets for near-term revenue
-
Business2 days ago
No Jackpot Winner, Prize to Climb to $231 Million
-

 Politics7 days ago
Starmer’s centre has collapsed, and the left was right all along
-

 Fashion1 day ago
Massimo Dutti Offers Inspiration for Your Summer Mood Board
-
Tech7 days ago
AirPods Max 2 review: Familiar features & design, but needs more
-
Crypto World7 days ago
AI Memory Rout Wipes 9% Off Nvidia Stock: Chart Says More Pain Ahead
-

 Crypto World6 days ago
Why It’s Partnering, Not Issuing
-

 Crypto World6 days ago
Ripple rolls out enterprise crypto treasury platform for corporates
-
Sports7 days ago
BCCI, IPL React On British Broadcast Engineer's Death In Mumbai
You must be logged in to post a comment Login