
Crypto World
Mitigation Blocks: How May Traders Identify and Trade Them?
Understanding where institutional traders have left unfilled orders can provide insights into potential price reversals. Mitigation blocks represent specific zones on price charts where price movements stopped and reversed, offering traders a framework for anticipating future market behaviour.
Within the Smart Money Concept framework, these areas serve as possible reference points for entry and exit strategies. This article examines mitigation in trading, their distinguishing characteristics compared to breaker blocks, and practical applications in trading strategy development.
Takeaways
- A mitigation block is a price action concept identifying specific price zones where previous price movements halted and reversed. They mark potential areas for future market turns within Smart Money trading frameworks.
- A bullish mitigation block forms during downtrends when price creates a higher low without breaking the previous low, often showing increased buying volume. Conversely, a bearish mitigation block develops in uptrends with a lower high formation and heightened selling pressure at resistance.
- Mitigation blocks are often compared to breaker blocks, but there are significant differences between the two. Mitigation blocks form after failure swings where price doesn’t surpass the previous extreme, while breaker blocks occur when price creates a new high/low before reversing and breaking structure—indicating liquidity may have been taken.
- Traders use mitigation blocks in trading by placing limit orders within validated zones, often after a new peak or trough confirms the block, while combining analysis with higher timeframe context for refined entries.
Definition and Function of a Mitigation Block
A mitigation block refers to a specific zone on a chart that indicates where previous movements have stalled and reversed, marking it as a potential area for future market turns. This concept within the Smart Money framework is popular among traders looking for strategic entry and exit points.
The idea behind these areas is rooted in the dynamics of supply and demand. When a currency pair reaches a level where buyers or sellers have previously entered the market in force, causing a reversal, it suggests a potential repeat of such actions when the price returns to the area.

Characteristics and How Traders Identify a Mitigation Block
Mitigation blocks can be bullish or bearish, each with distinct characteristics:
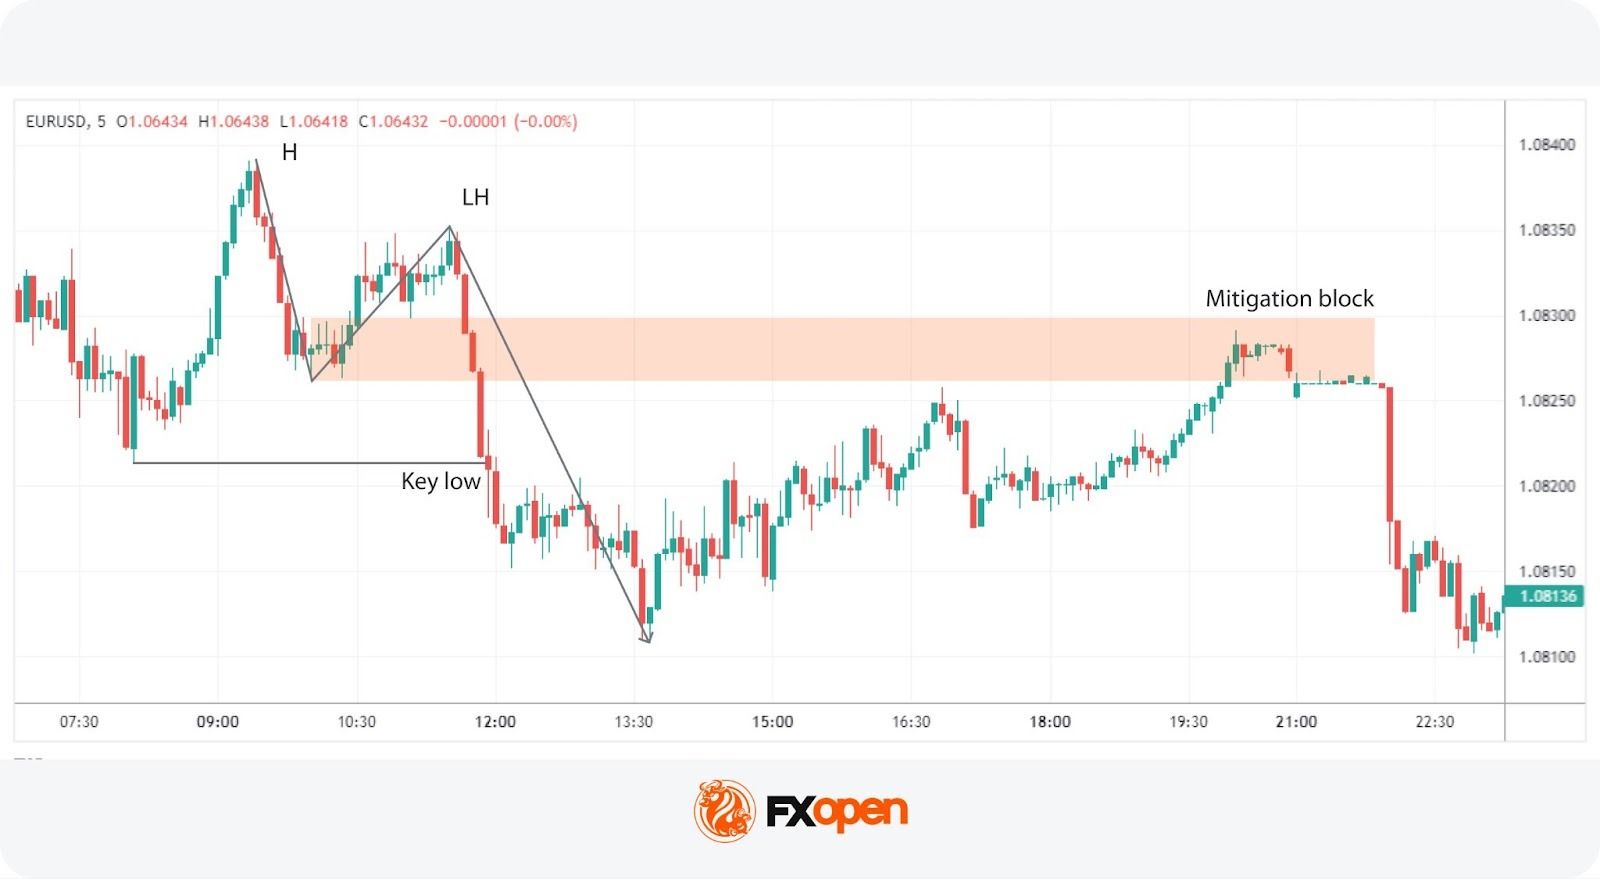
- Bearish Mitigation Block: This type forms during an uptrend and is identified by a significant peak followed by a decline and a failed attempt to reach or surpass the previous high, creating a lower high. When prices drop below the previous low, the price zone above the low becomes mitigation. It may be characterised by an increase in selling volume as the price approaches the level, signalling resistance and a potential downward reversal.
- Bullish Mitigation Block: Conversely, a bullish type is established during a downtrend. It is characterised by a significant trough, followed by a rise to form a higher low, and a failure to drop below the previous low. As the price moves up, the zone below the high marks mitigation one. This area often shows an increase in buying volume as the price approaches, indicating support and a potential upward reversal.
To have a go at identifying your own blocks, you can head over to FXOpen’s TickTrader platform to access a world of currency pairs and over 1,200 charting tools.
Mitigation Block vs Breaker Block
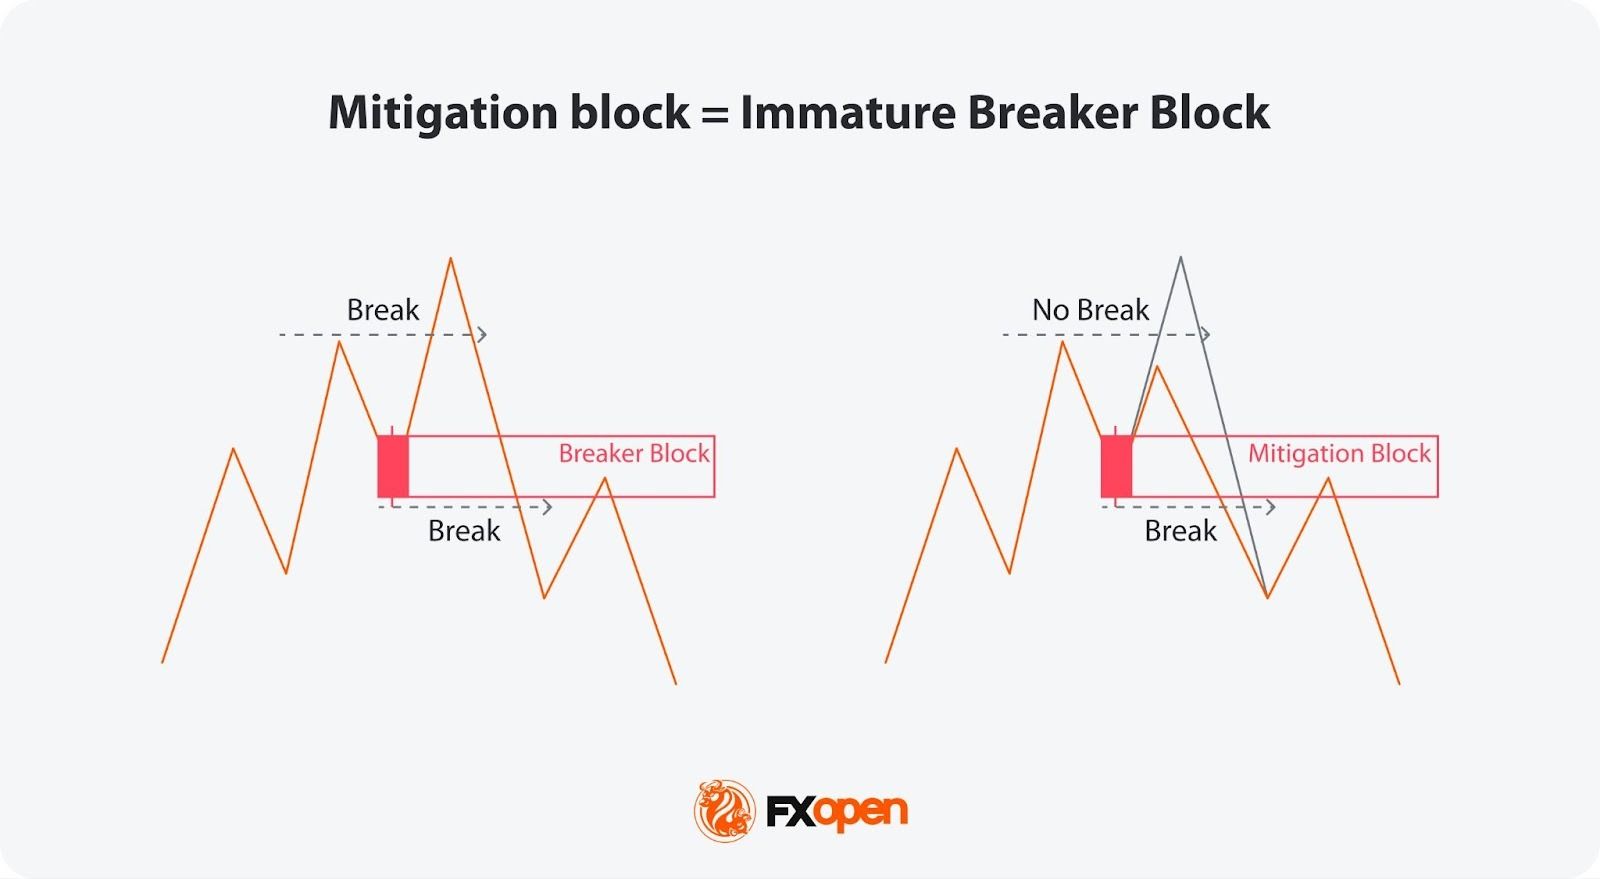
Mitigation and breaker blocks are both significant in identifying potential trend reversals in trading, but they have distinct characteristics that set them apart. A mitigation block forms after a failure swing, which occurs when the market attempts but fails to surpass a previous peak in an uptrend or a previous trough in a downtrend. The pattern indicates a loss of momentum and a potential reversal as the price fails to sustain its previous direction.
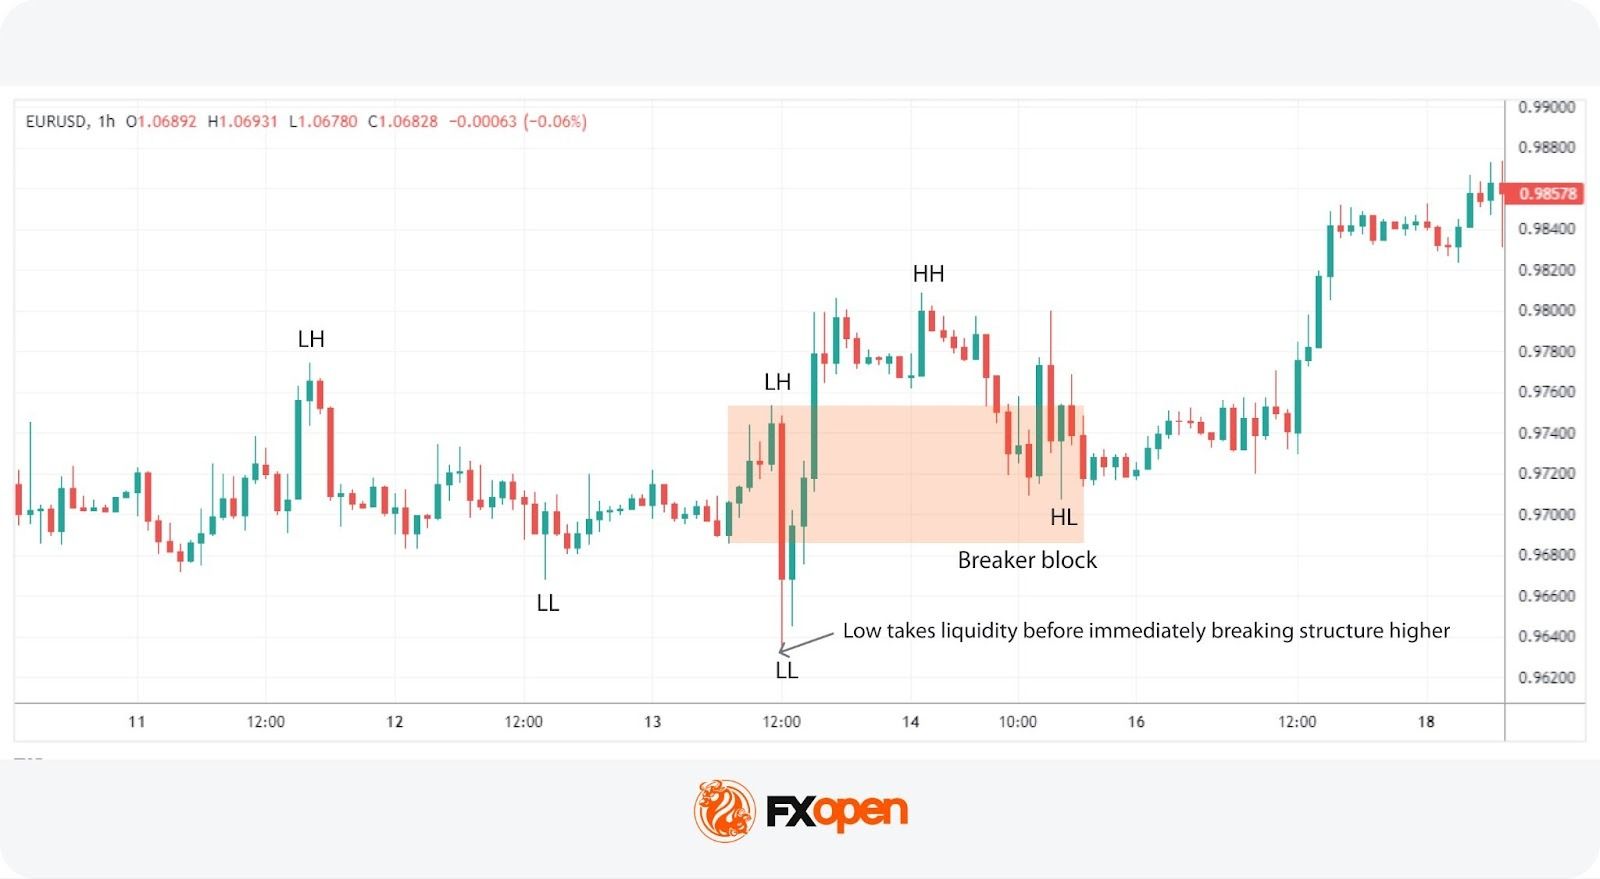
On the other hand, a breaker block is characterised by the formation of a new high or low before the market structure is broken, indicating that liquidity has been taken. This means that although the trend initially looked set to continue, it quickly reverses and breaks structure.
In effect, a breaker appears when the market takes liquidity beyond a swing point before reversing the trend. A mitigation appears when the price doesn’t move beyond the trend’s most recent high or low, instead plotting a lower high or higher low before reversing the trend.
Application of Mitigation Blocks in Trading
Areas of mitigation in trading can be important tools for identifying potential trend reversals and entry points. When they align with a trader’s analysis that anticipates a reversal at a certain level, it can serve as a robust confirmation for entry.
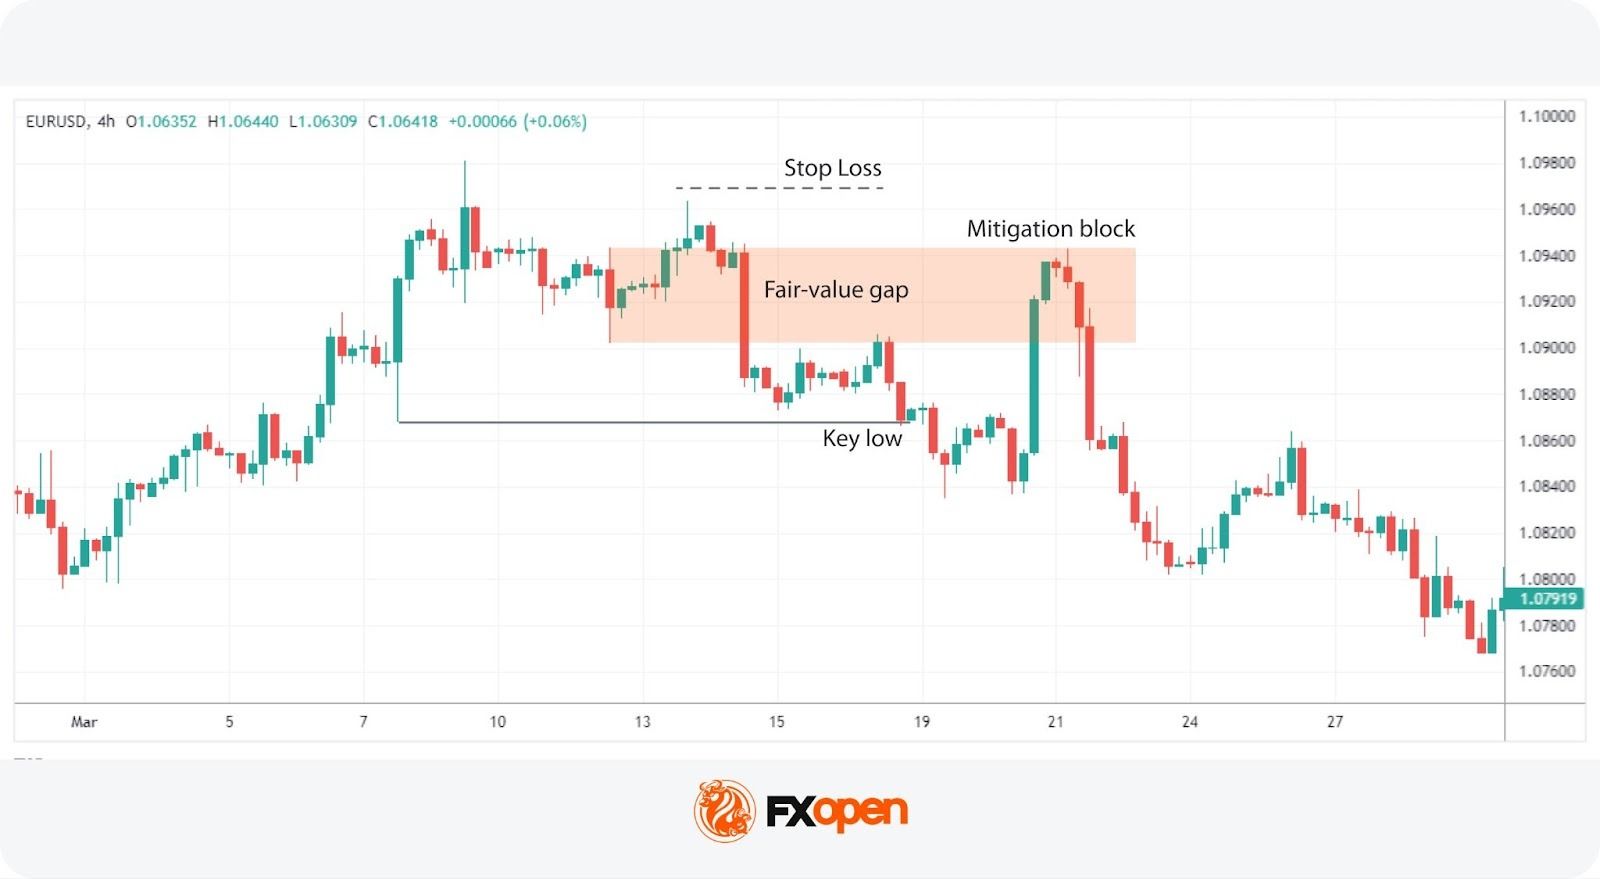
Traders can utilise these zones by placing a limit order within the area once it is considered valid. Validation occurs after a new peak or trough is established following the initial failure swing that forms the mitigation area.
If a liquidity void or fair-value gap is present, the trader may look for such a gap to be filled before their limit order is triggered, potentially offering a tighter entry. Stop losses might be placed beyond the failure swing or the most extreme point.
Furthermore, if a mitigation block is identified on a higher timeframe, traders can refine their entry by switching to a lower timeframe. This approach is supposed to allow for a tighter entry point and potentially more effective risk management, as it offers more granular insight into the momentum around the area.
Common Mistakes and Limitations in Mitigation Blocks
While these blocks are valuable for trading, they come with potential pitfalls and limitations that traders should know.
- Overreliance: Relying solely on mitigation blocks without corroborating with other trading indicators can lead to misjudged entries and exits.
- Ignoring Context: Using these zones without considering the broader market conditions may result in trading against a prevailing strong trend.
- Misinterpretation: Incorrect identification can lead to erroneous trading decisions, especially for less experienced traders.
- False Signals: Mitigation blocks can sometimes appear to signal a reversal but instead lead to a continuation of the trend, trapping traders in unfavourable positions.
The Bottom Line
Mitigation blocks remain a valuable tool for traders seeking to understand institutional behaviour. By highlighting areas where unfilled orders may influence future price action, they can support traders in decision-making. However, like any market concept, mitigation blocks should not be viewed in isolation. Traders combine them with broader market structure analysis, liquidity concepts, and strict risk-control practices.
If you are looking to apply these concepts in a practical trading environment, you can consider opening an FXOpen account to put theory into practice across dozens of currency pairs complemented by robust tools and insights.
FAQs
What Is a Mitigation Block?
A mitigation block is a price zone that identifies potential reversal points. It signals where a currency pair has previously stalled, indicating strong buying or selling pressure, suggesting similar reactions in future encounters with these levels.
How Do Traders Identify a Mitigation Block?
Mitigation blocks are identified by analysing charts for areas where previous highs or lows were not surpassed, leading to a reversal. Traders look for a sequence of movements, including a swing high or low followed by a retracement that fails to exceed the previous swing.
What Is the Difference Between a Breaker Block and a Mitigation Block?
While both indicate potential reversals, a breaker block forms when the price makes a new high or low before reversing, suggesting a temporary continuation of the trend. In contrast, a mitigation block forms without creating a new extreme, indicating a direct loss of momentum and an immediate potential for reversal.
This article represents the opinion of the Companies operating under the FXOpen brand only. It is not to be construed as an offer, solicitation, or recommendation with respect to products and services provided by the Companies operating under the FXOpen brand, nor is it to be considered financial advice.

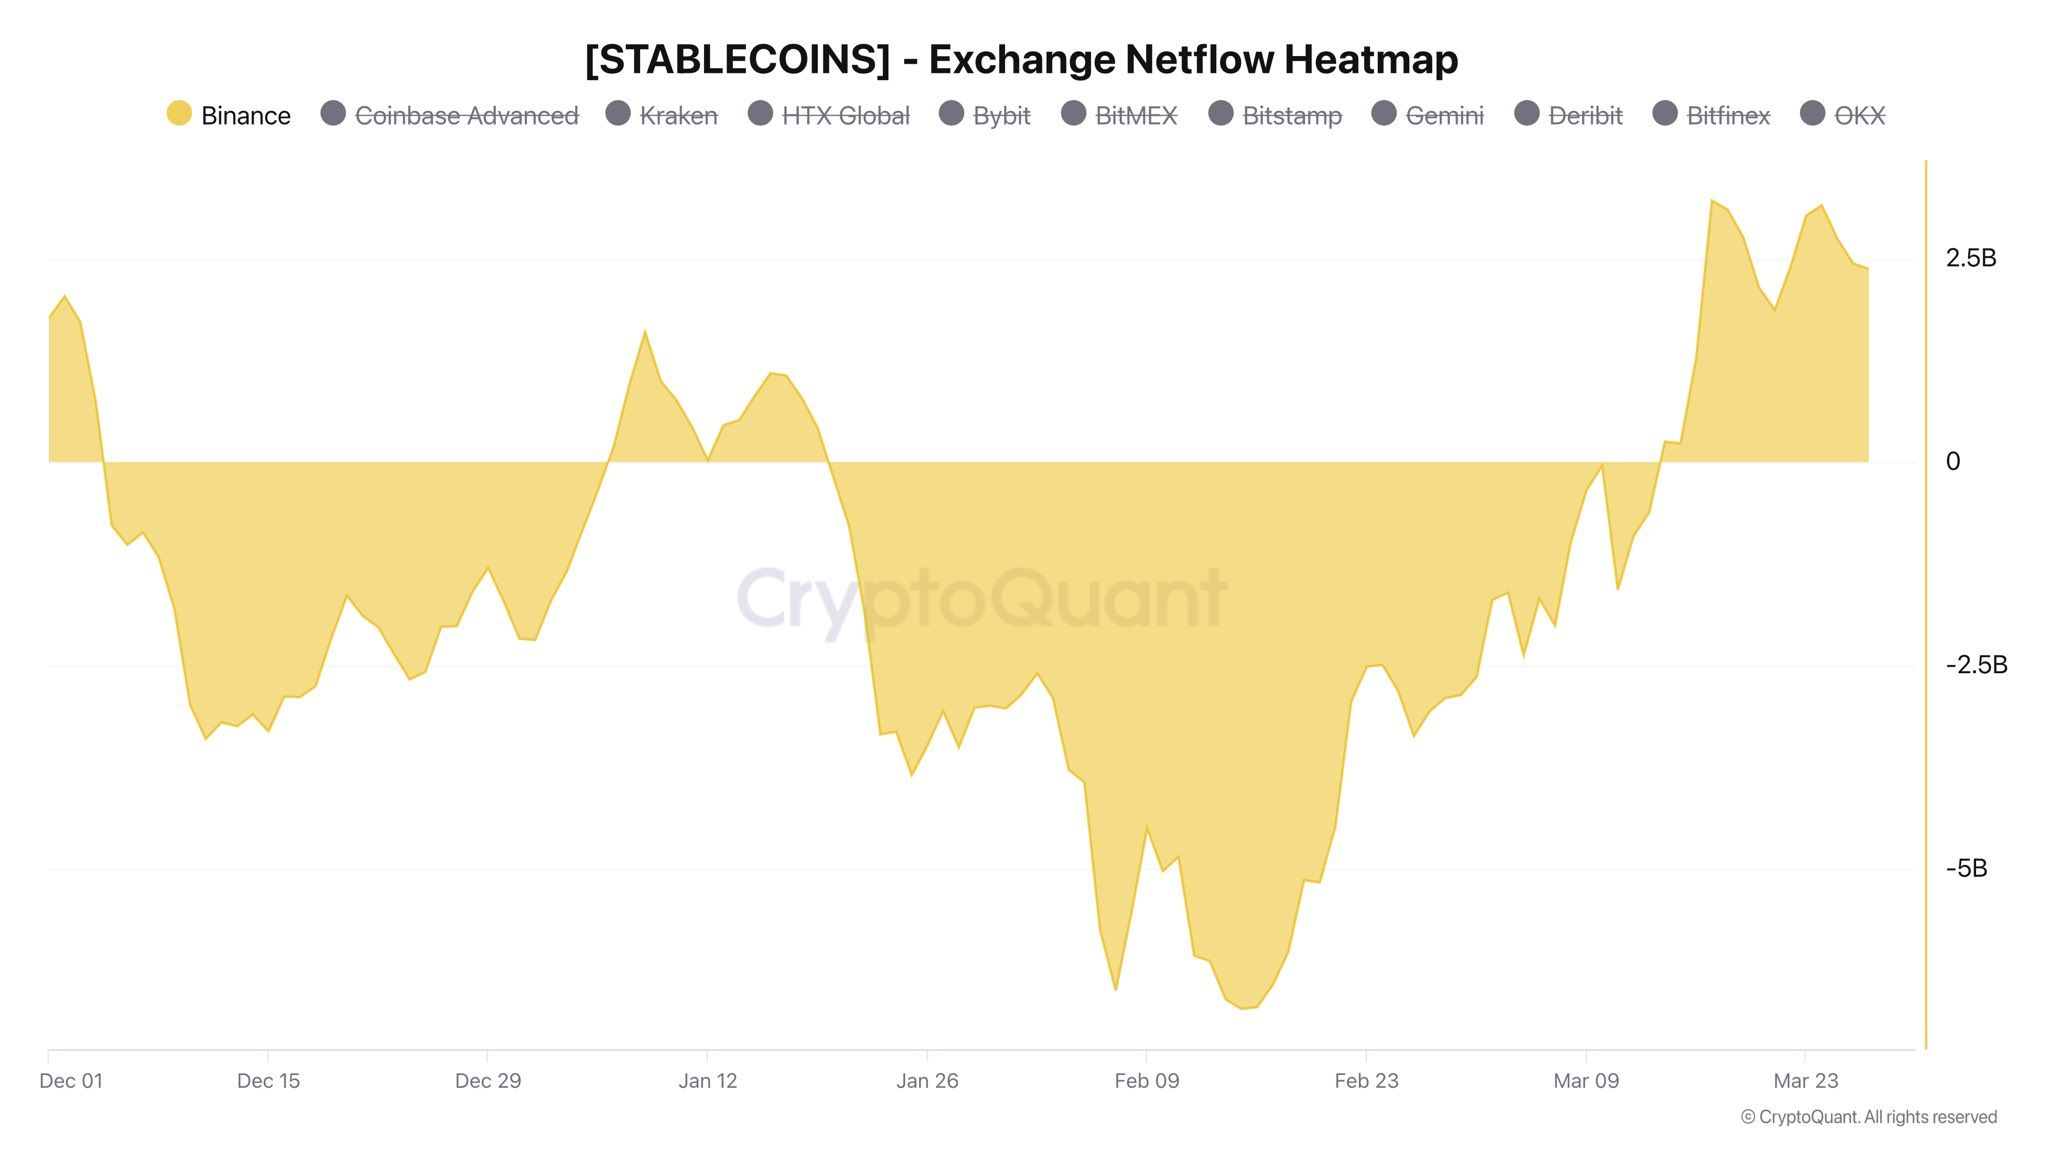
Stablecoin netflows on Binance have turned positive, marking a notable shift in market liquidity.
Analyst Darkfost noted that the exchange, which consistently leads global crypto trading volumes, has moved from recording net stablecoin outflows to net inflows of $2.4 billion.
The reversal follows earlier periods of heavy withdrawals, including $3.4 billion on December 11 and $6.7 billion on February 15.
Follow us on X to get the latest news as it happens
Liquidity Is Back on Binance, but Where Are the Traders?
Stablecoins are widely viewed as deployable capital within the crypto ecosystem, and inflows to exchanges often indicate that traders are preparing to enter positions. However, actual spot trading activity tells a very different story.
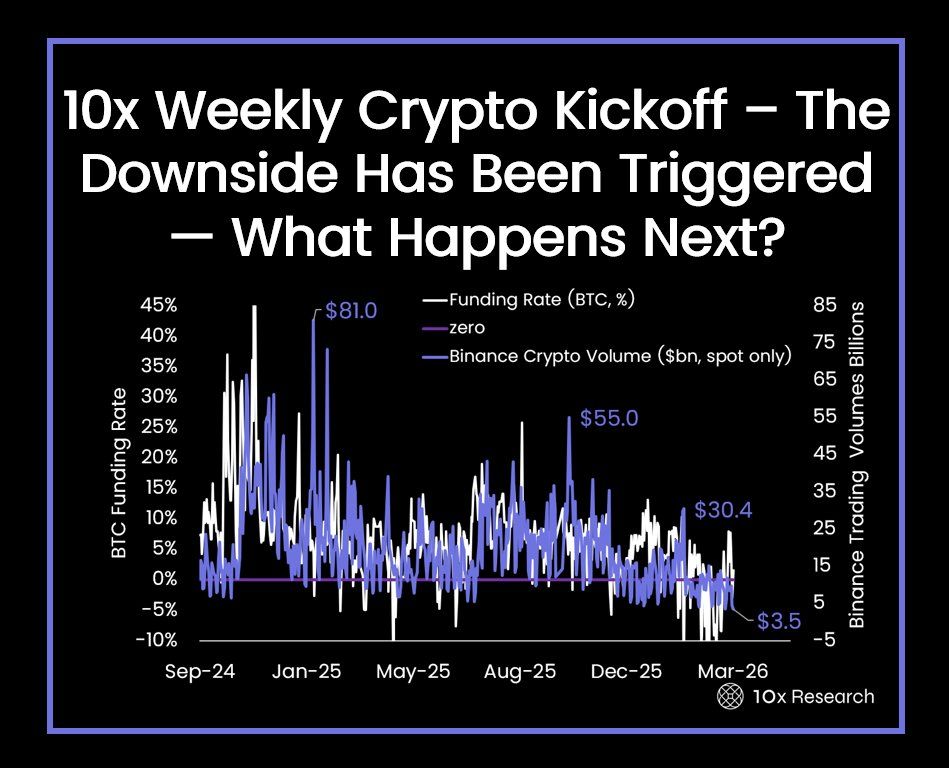
Research firm 10x Research flagged that spot trading volume on Binance has fallen considerably since the beginning of 2025, dropping from $81 billion to just $3.5 billion.
This creates a notable disconnect. Investors are moving stablecoins onto exchanges, yet they are not converting that capital into positions. In effect, liquidity is building, but risk appetite has yet to follow.
“Liquidity support is fading, and as a new gamma profile takes shape, a move through key levels could amplify volatility and trigger outsized price reactions. This is not a market to be complacent in; low liquidation activity and weak volumes mask underlying fragility,” the analysts wrote.
The stance comes amid rising geopolitical tensions and mounting macroeconomic concerns over a potential recession. The ongoing US-Israel war involving Iran has rattled markets, sending oil prices sharply higher while putting pressure on equities.
“The crypto market is not spared, even though it has shown relative resilience over the past few weeks,” Darkfost said.
Thus, the shift from heavy outflows to renewed inflows suggests that capital is re-entering the market. However, until trading activity picks up, the data points to a market defined more by caution than conviction.
Subscribe to our YouTube channel to watch leaders and journalists provide expert insights
The post $2.4 Billion Stablecoin Inflows Hit Binance, But Traders Stay on the Sidelines appeared first on BeInCrypto.
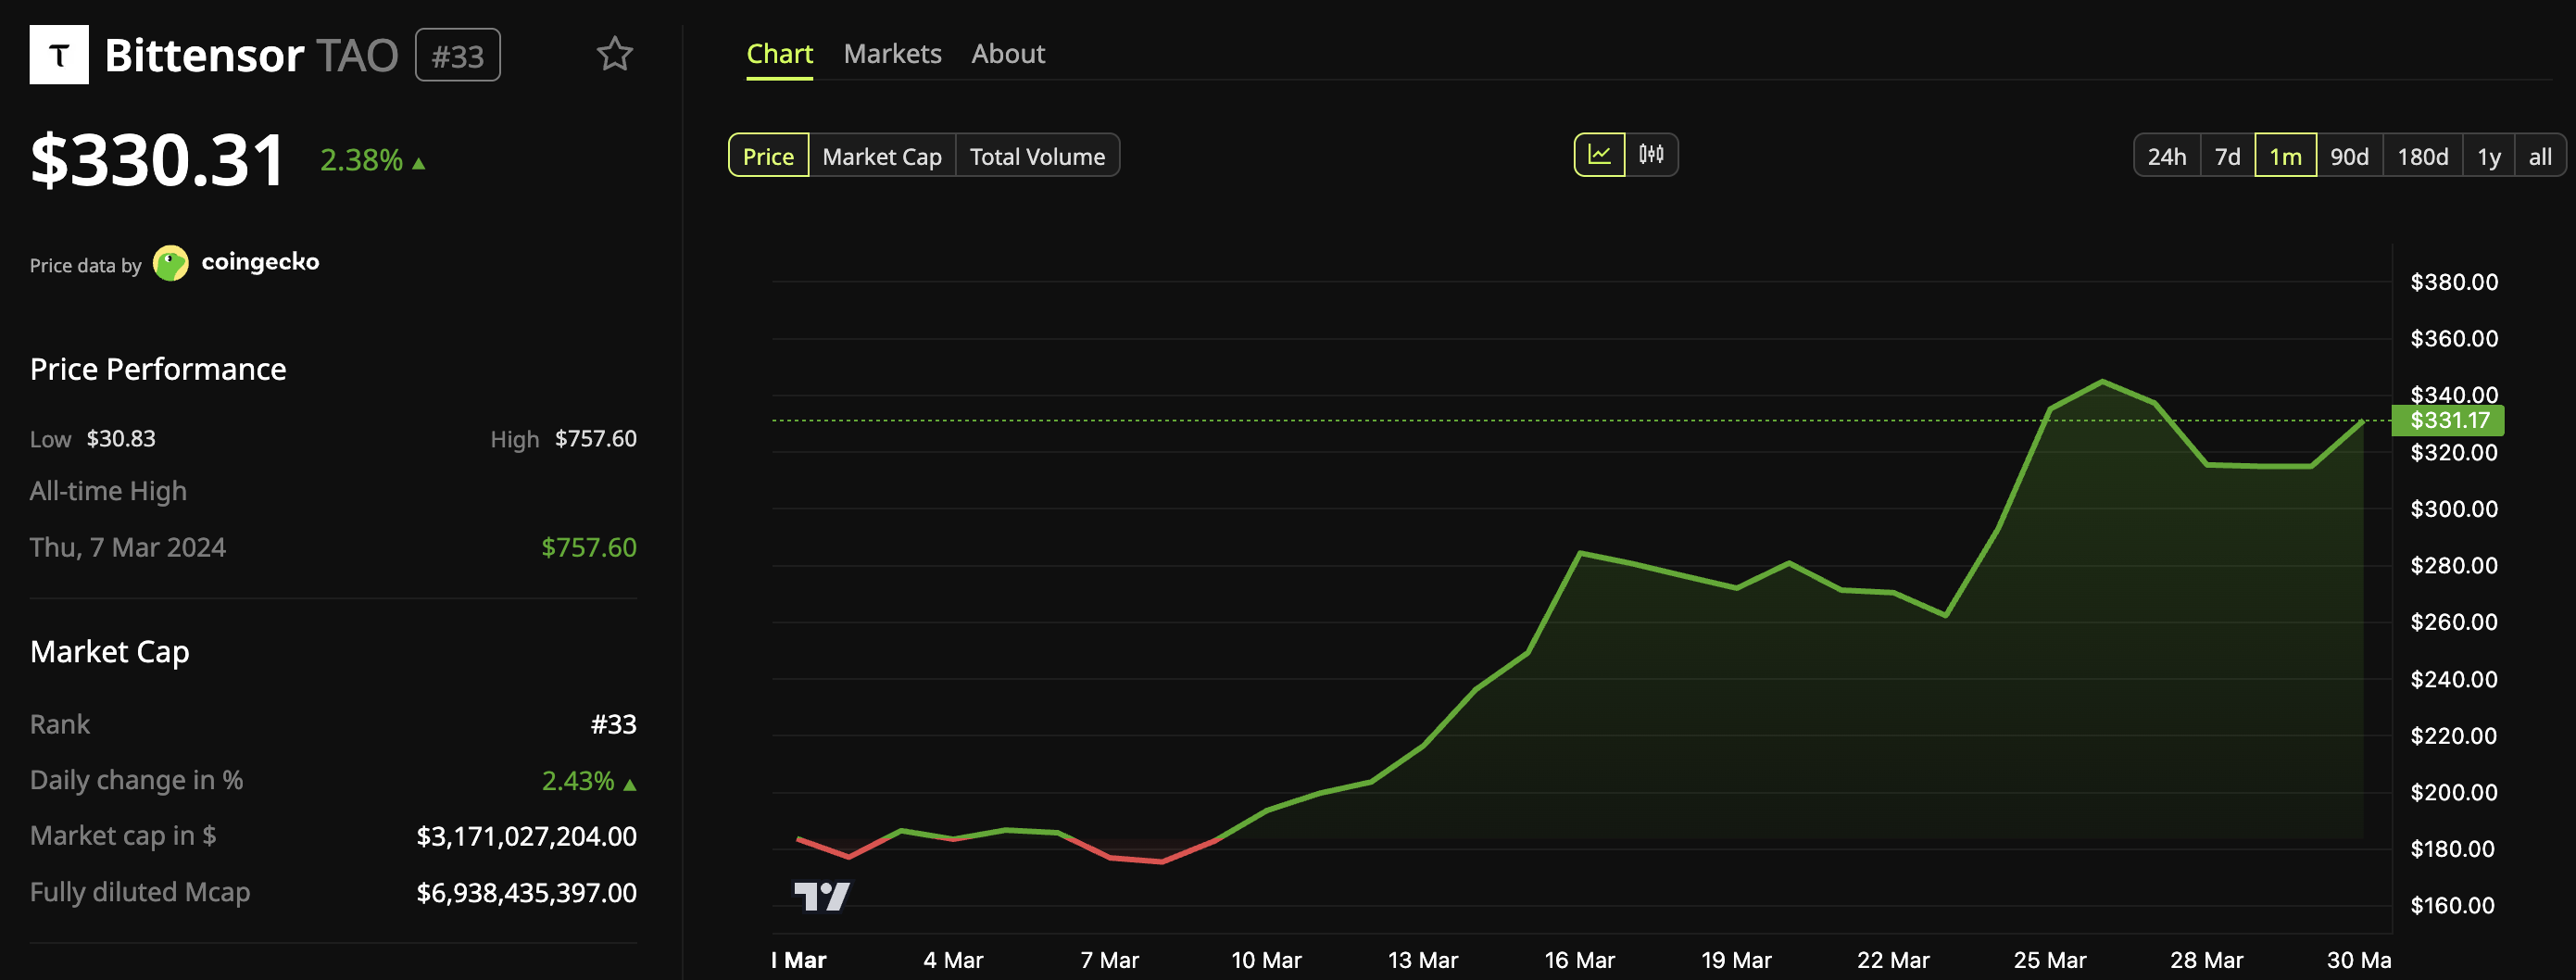
Bittensor (TAO), the decentralized AI network token, has staged a dramatic recovery from its February lows, and on-chain data suggests the rally may have real legs.
CryptoQuant data tracking 90-day Spot Taker Cumulative Volume Delta (CVD), a metric measuring the balance between aggressive buyers and sellers on spot exchanges, shows a sustained flip toward buy-side dominance since the $154 floor.
Follow us on X to get the latest news as it happens
The chart reveals weeks of consistent green bars replacing what had been months of sell-dominant red, indicating that real spot buyers have been steadily absorbing supply.
The token is now trading around $330. Its price rose more than 20% over the past week alone, and its market capitalization has climbed back to approximately $3.17 billion.
The broader Bittensor ecosystem has also benefited. According to CoinGecko data, the total market capitalization of subnet tokens has collectively surged to $1.4 billion. Nearly every token in the network has posted double-digit gains over the past 30 days.
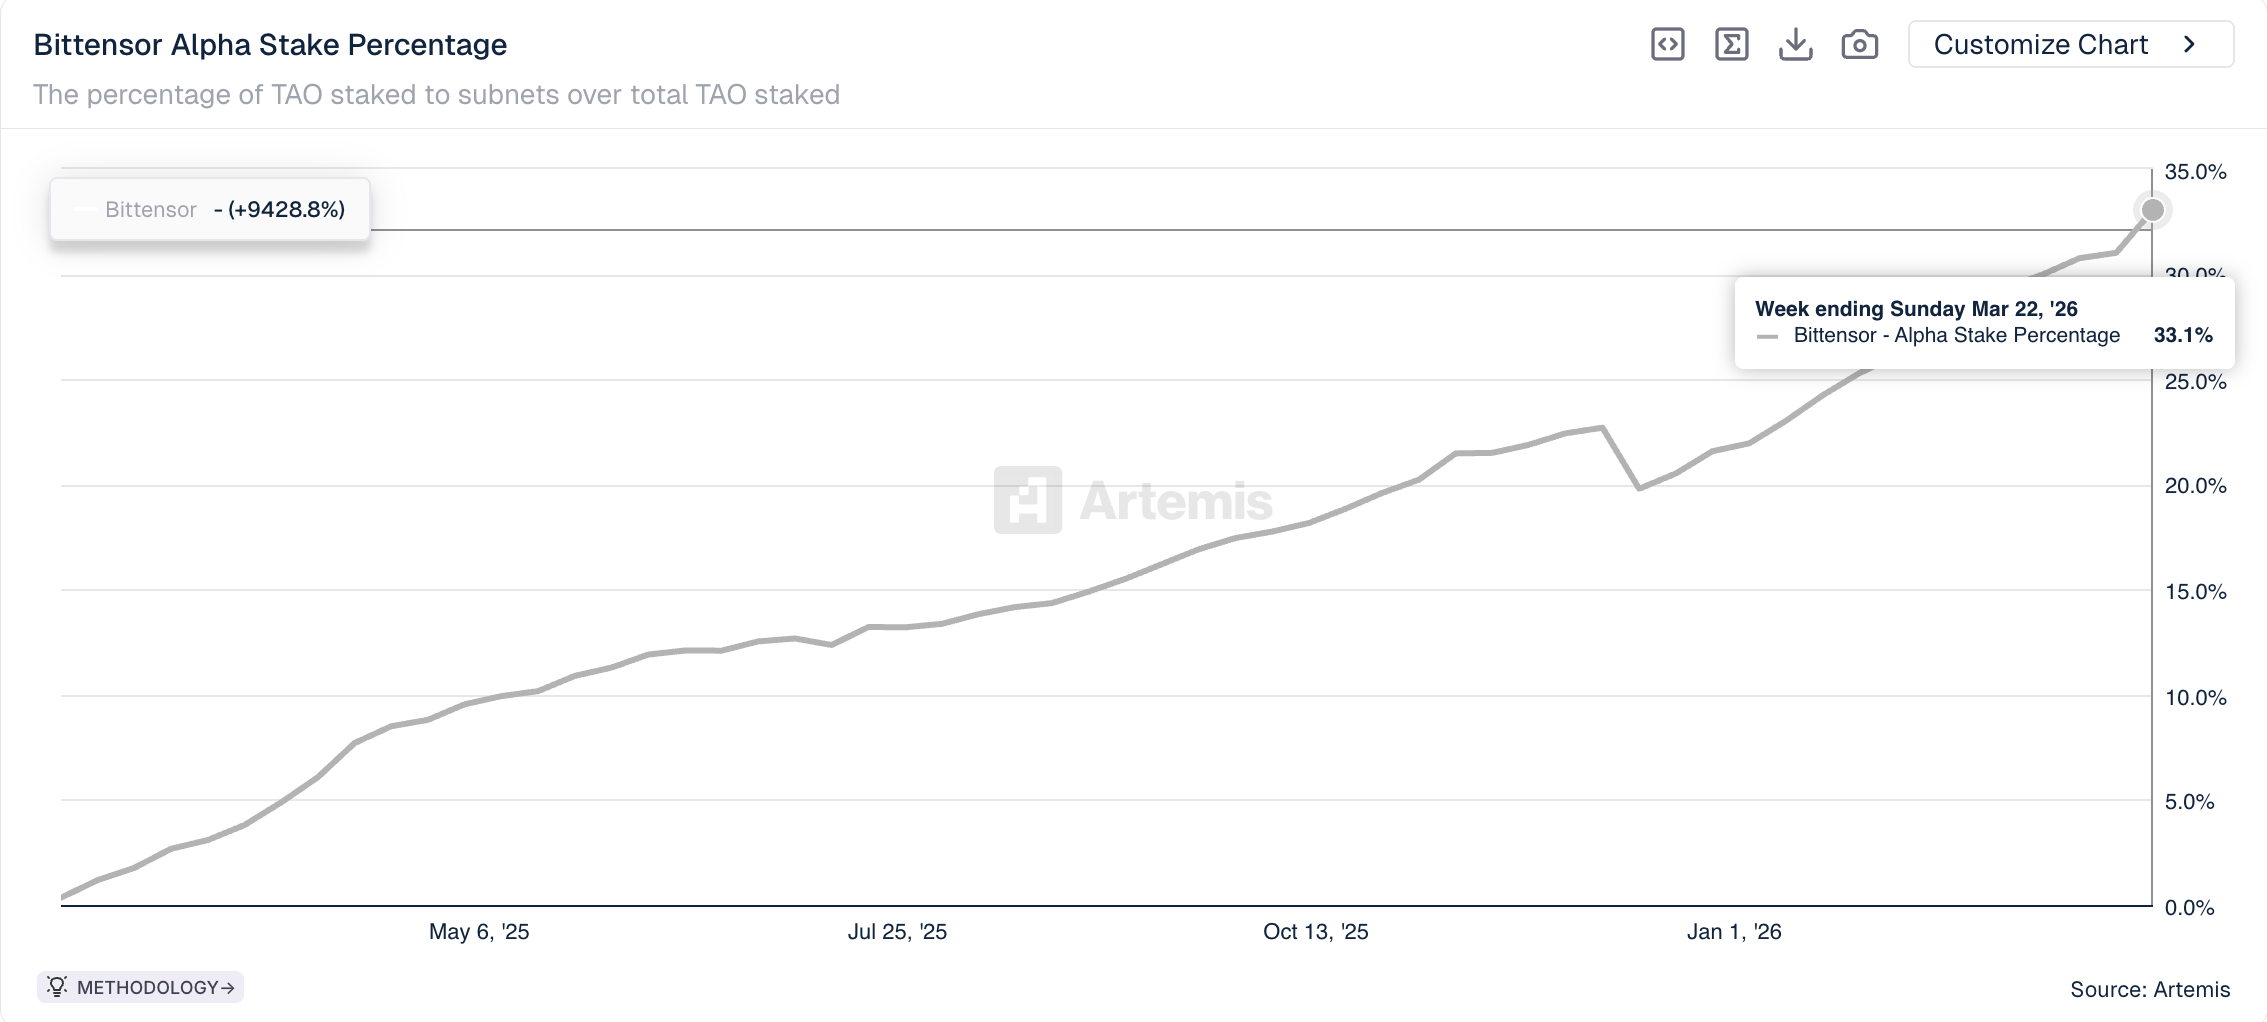
Meanwhile, the percentage of TAO staked to subnets relative to total TAO staked has exceeded 33%, reflecting growing confidence in the subnet economy.
Despite the bullish backdrop, CryptoQuant analyst Maartunn noted that all segments of Bittensor trading activity, including spot volumes, futures volume, and retail participation, are heating up simultaneously.
“When everything heats up at once… risk increases,” he wrote.
The observation does not necessarily predict an imminent reversal. Nonetheless, it suggests the current rally may be in a zone where downside risk increases.
The post Bittensor (TAO) Demand Looks Real and Risky at the Same Time: Here’s Why appeared first on BeInCrypto.
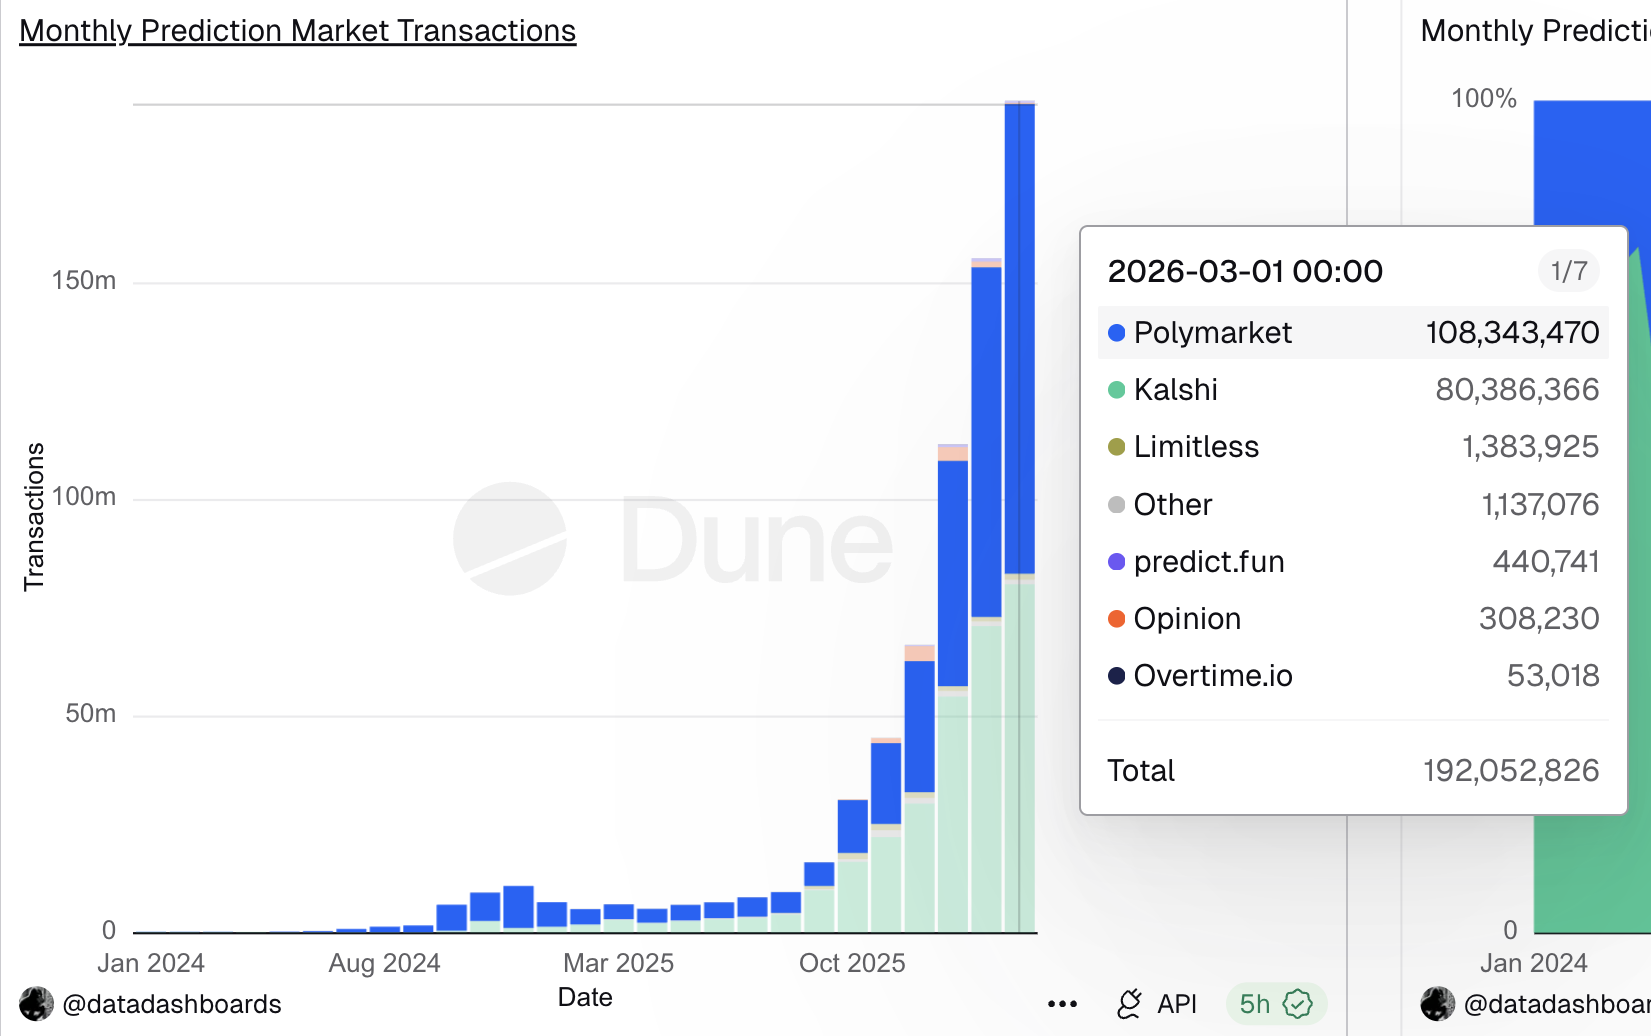
Prediction market transactions surpassed 192 million in March 2026. This represents an all-time record as volume and user growth continued to accelerate year over year.
The figures, tracked by Dune, reflect a sector that has shifted from a niche use case into a multibillion-dollar financial market.
Follow us on X to get the latest news as it happens
The number of monthly users grew to a record high of 865,411, a roughly 118% increase from 396,642 in March 2025.
Monthly notional trading volume for prediction markets reached roughly $23.89 billion so far in March, a roughly 1,107% year-over-year increase. Nonetheless, it remains around 10.7% below January’s all-time high of $26.7 billion.
BeInCrypto’s exclusive analysis found that sports, crypto, and politics lead weekly volume on Polymarket. On Kalshi, the exotics category overtook politics in late February to secure a position among the top three categories by weekly volume according to Dune data.
The behavioral data also suggests a structural shift. On Polymarket, over 57% of users trade less than $100 per position.
The average active participant executes roughly 25 trades per day. That frequency mirrors patterns seen in retail stock trading rather than traditional betting.
Subscribe to our YouTube channel to watch leaders and journalists provide expert insights
Despite the growth, prediction markets face increasing regulatory scrutiny. Lawmakers have introduced multiple bills in March alone, ranging from curbing insider trading to banning war-related contracts.
The post Prediction Markets Hit New Milestones in March Despite Growing Regulatory Scrutiny appeared first on BeInCrypto.
Lido DAO’s decentralized autonomous organization is weighing a one-off $20 million buyback of its governance token, LDO, in a bid to address a pronounced price dislocation relative to Ether. The plan would swap 10,000 stETH tokens from the treasury for LDO, with proponents arguing that the governance token is undervalued given the protocol’s fundamentals.
The proposal, submitted on Friday, outlines a staged approach: the treasury would acquire up to 10,000 stETH in smaller batches of 1,000 and swap each batch for LDO. Lido argues this move could restore alignment between LDO’s market price and the underlying health of the protocol, a gap it says has widened to historically large levels. As part of the process, each batch would require tokenholder approval, and results would be reported before the next tranche proceeds.
“This is not a routine fluctuation. It represents one of the most significant dislocations between LDO’s market price and its underlying protocol fundamentals in the token’s history.”
The time to act comes as LDO sits at an extended discount to Ether. Lido DAO notes LDO trades at about 0.00016 ETH, roughly 63% below its two-year median. At the same time, Lido remains the dominant force in Ethereum’s liquid staking market, holding about 23.2% of staked Ether, according to Dune Analytics data. That leadership has not come without controversy; previous assessments flagged the potential centralization risks tied to a single protocol’s dominance in securing a large share of the network’s staking.
Price and market metrics underscore the scale of the challenge. LDO is currently trading around $0.30, down about 95.9% from its peak near $7.30 in August 2021. Its market capitalization sits near $255 million, placing it around the 141st-largest token by value. The plan’s proponents argue that the proposed buyback could shore up sentiment by demonstrating active governance-driven capital allocation tied to the protocol’s real-world performance.
Key takeaways
- The Lido DAO proposal would execute a one-off $20 million buyback by swapping up to 10,000 stETH from the treasury for LDO, in batches of 1,000 stETH each, using limit orders or dollar-cost averaging to manage volatility.
- Approval for each batch would be required from tokenholders, and results would be disclosed after every tranche before proceeding.
- LDO trades at a steep discount to ETH (approximately 0.00016 ETH per LDO, about 63% below the two-year median), despite Lido’s leadership in Ethereum’s liquid staking sector.
- Lido’s dominance has been cited in the past as a potential centralization risk for the network, though the current governance move focuses on price alignment and treasury management.
- Revenue and fee dynamics in 2025 show Lido’s take rate rising to 6.1% even as staking fees declined, with total staking revenue dipping amid a broader market retrenchment.
Mechanics, governance, and investor considerations
The proposed buyback plan hinges on a staged governance process. If approved, Lido would execute batches of 1,000 stETH each, swapping them for LDO until the 10,000-stETH target is reached. The strategy emphasizes price discipline: Lido intends to use limit orders or a dollar-cost averaging approach to smooth entry and avoid abrupt price moves. Each batch would require a new round of tokenholder approvals, and the DAO would report results after every step to maintain transparency and accountability.
The broader context includes a look at Lido’s earnings trajectory. In 2025, Lido’s revenue declined by about 23% to roughly $40.5 million, driven largely by a drop in staking fees to about $37.4 million. Despite the revenue dip, the protocol’s take rate—defined as the percentage of staked ETH rewards retained as fees—improved from about 5% to just over 6% in 2025. Lido argues that the core fundamentals remain robust even amid a wider market pullback and a 13% cost improvement in 2025 versus 2024.
The idea of a buyback is not entirely new within Lido’s ecosystem. In November, a member proposed an automated buyback mechanism to support LDO’s price, but that proposal has not been implemented. The current plan reframes the concept as a one-off, governance-driven initiative tied directly to the treasury’s assets and the DAO’s long-term interests.
Implications for holders and the broader ecosystem
If the proposal advances, the immediate effect could be a temporary lift in LDO’s trading dynamics, especially if the market interprets the buyback as a signal that the DAO is willing to put treasury-backed resources toward balancing token price with protocol fundamentals. For investors, the move highlights a visible attempt to align incentives between token economics and the platform’s operational strength, particularly given Lido’s entrenched position in Ethereum staking and its influence on validator economics.
However, the plan also introduces governance risk and execution risk. The need for multiple rounds of tokenholder approvals means outcomes will be contingent on community sentiment and turnout. Moreover, the market’s reaction will hinge on how the buyback intersects with broader SEC-like scrutiny, market liquidity conditions, and the pace at which LDO could absorb new supply without dampening demand for the token’s governance role.
Looking ahead, observers will be watching whether the DAO proceeds with the proposed schedule, how each batch performs relative to market conditions, and whether this approach invites further debates about token economics, centralization concerns, and the resilience of Ethereum’s staking architecture as it evolves post-merge.
Readers should monitor Lido DAO’s governance votes and the market’s reaction to any announced results from each tranche, as these steps will illuminate how the community weighs treasury-backed interventions against the need to maintain decentralization and protocol integrity in a challenging macro environment.


The war just got bigger. Bitcoin briefly got smaller.
Bitcoin dipped to $65,112 early Monday morning, its lowest level since the February crash, before recovering to $67,402 as Asian markets opened.
The 24-hour range of $65,112 to $67,389 reflects a market that sold hard on overnight escalation headlines and found buyers near $65,000, a level that hasn’t been tested since the war’s opening weekend five weeks ago.
Ethereum recovered 2% to $2,044, Solana gained 0.9% to $83.48, and XRP added 1.4% to $1.35. The 24-hour green across the board masks a rougher weekly picture though. BTC is still down 1% on the week, ETH 0.9%, XRP 1.9%, and SOL 3.7%. Tron is the one name sitting in green, up 2.6% in a day and 4.6% on the week, quietly outperforming the entire majors complex.
The escalation this time came from multiple directions simultaneously. Iran-backed Houthi forces entered the conflict, opening a new front beyond the direct U.S.-Israel-Iran theater. Additional U.S. troops arrived in the Middle East, fanning fears of a ground operation.
The Wall Street Journal reported Trump is weighing a military operation to extract uranium from Iran, though no decision has been made. And Iran attacked two aluminum production sites in the region, sending the metal up as much as 6% and extending the war’s economic damage beyond oil and into industrial commodities.
Brent crude rose 2.5% to around $115 a barrel, now up roughly 90% year-to-date. Asian equities fell sharply, with South Korea’s benchmark down 3.2% on a technology stock selloff and Japan’s Nikkei dropping 3.4%. S&P 500 futures pared losses and were trading roughly flat, suggesting some stabilization after the initial reaction.
The $65,112 low matters technically. That level is within range of the $64,000 low from Feb. 28, the day the war started. Bitcoin has spent five weeks building a pattern of higher lows on each escalation, from $64,000 to $66,000 to $68,000 to $69,400 to $70,596.
Monday’s dip below $66,000 is the first time in weeks the floor has moved lower rather than higher. Whether it recovers and re-establishes the uptrend or marks the beginning of a break below the range that has held since the war began is the question for the rest of the day.
Meanwhile, oil at $115 and aluminum spiking on direct attacks on production facilities means the inflationary impact is broadening beyond energy into industrial supply chains. That makes the Fed’s position even harder and the rate cut timeline even more distant.
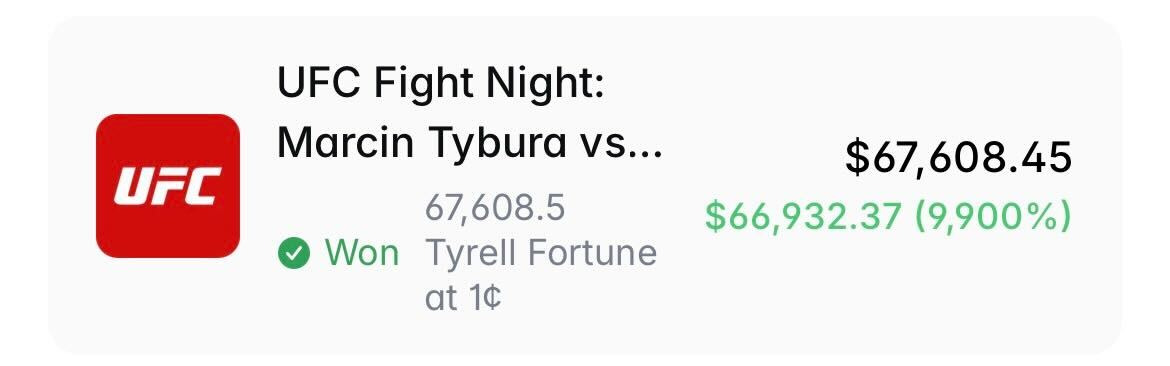
A Polymarket trader turned $676 into $67,608 on Saturday by capitalizing on a rare mistake during a UFC heavyweight bout, where the wrong fighter was initially announced as the winner.
The trader, known as LlamaEnjoyer on Polymarket and Verrissimus on X, watched the live fight between Tyrell Fortune and Marcin Tybura and suspected that a mistake may have been made when UFC presenter Bruce Buffer announced Tybura as the winner.
During that time, Polymarket shares for Fortune fell to one cent, and LlamaEnjoyer was able to place the $676 bet moments before Buffer corrected himself and declared Fortune the winner.
LlamaEnjoyer profited roughly $67,000 from the UFC’s brief blunder, allowing him to capture a near 100x return.

The incident shows the speed at which odds on prediction markets can whipsaw during live events.
Related: NYSE parent ICE completes new $600M investment in Polymarket
LlamaEnjoyer almost lost $100,000 initially
Speaking about the incident, the Polymarket trader said they almost put $100,000 on Tybura at 99 cents, presumably once the initial decision was made before realizing that something “was off.”
“Cancelled my order, scooped up 1c shares instead. the UFC corrected the winner seconds later. easiest 100x ever.”
The trader said they placed the trade before a UFC commentator said “We have a mistake,” meaning that they made the bet within 50 seconds of Tybura being incorrectly declared the winner.
29-28
29-28
30-27WHAT JUST HAPPENED? 😅
Marcin Tybura defeats Tyrell Fortune via unanimous decision! ☝️#UFCSeattle | Stream TNT Sports on HBO Max pic.twitter.com/PqlRwBYdTD
— UFC on TNT Sports (@ufcontnt) March 28, 2026
“There’s no way Tybura won that fight,” LlamaEnjoyer said.
Prediction markets have become one of the hottest use cases in crypto, with trading volumes clocking more than $10.4 billion so far in March, marking a tenfold increase from March 2025.
Over 865,000 users have placed bets on prediction markets like Polymarket, Kalshi and Opinion so far in March, spanning a wide range of events, from sports and politics to financial results, culture and more.
Magazine: IronClaw rivals OpenClaw, Olas launches bots for Polymarket — AI Eye


Lido’s decentralized autonomous organization has proposed a one-off buyback of its governance token to support price levels amid a prolonged downturn.
Summary
- Lido DAO has proposed a one-off buyback of up to 10,000 stETH, about $20M, to accumulate LDO amid what it calls a significant valuation gap.
- The token is trading roughly 63% below its two-year median against Ether and remains down 95.9% from its all-time high.
According to a governance proposal submitted by the Lido Ecosystem Operations team, the plan would allocate up to 10,000 stETH from the DAO’s treasury for Lido DAO to accumulate LDO (LDO). At current prices, the allocation is valued at nearly $20 million.
Framing the move as a response to mispricing, the DAO said it “represents one of the most significant dislocations between LDO’s market price and its underlying protocol fundamentals in the token’s history.”
If approved, the proposal would be executed in smaller batches of 1,000 stETH, up to a total of 10,000 stETH, with plans to use limit orders or adopt a dollar cost averaging strategy to avoid market volatility.
Token holders, however, have the right to review every tranche, as each batch would require separate approval before further execution.
Lido DAO also highlighted the LDO to ETH ratio, which it said was at “historically depressed levels,” trading at a steep discount to Ether, with its current ratio roughly 63% below its two year median.
Even though Lido remains in the top spot of the Ethereum liquid staking market with a market share of about 23%, according to Dune Analytics data, LDO price has fallen 95.9% from its $7.30 high.
In its latest update, the protocol reported a decline of 23% to $40.5 million in 2025, but the foundation argues that core performance remains strong despite the drop in revenue.
For instance, it noted that Lido’s rewards were down approximately 20% over the same period, while its costs improved 13% year over year. Its take rate has also increased from 5% to 6.11%.
“That dislocation is not justified by a proportional deterioration in protocol performance,” the DAO said.

OKX’s Ethereum layer-2 network, X Layer, has welcomed Aave to its DeFi roster, marking the 21st chain integration for the largest decentralized lending protocol by cumulative lending volume. Aave’s milestone of surpassing $1 trillion in cumulative lending volume was reached in late February, a development widely noted in market coverage. On X Layer, Aave adds about $23.5 billion in total value locked (TVL) across its lending and borrowing activities. X Layer, which launched in May 2024, previously carried a modest TVL around $25 million, illustrating how high‑profile integrations can accelerate growth for Layer-2 ecosystems. The deployment enables OKX Wallet and X Layer users to lend, borrow and earn yield directly on the network, eliminating the need to bridge assets to other chains.
Aave’s entrance into X Layer comes as part of a broader push to diversify DeFi access on a scaling-focused platform. OKX officials described the integration as a versatile expansion of its DeFi ecosystem that should benefit the full spectrum of X Layer users, from retail to developers. X Layer’s emphasis on speed and cost efficiency positions it as a practical on‑ramp for DeFi activity, offering roughly $0.0005 per transaction and one‑second block times. This combination of cheap, rapid transactions aims to reduce a key obstacle in cross-chain DeFi usage: friction and latency.
Key takeaways
- Aave expands to X Layer, marking its 21st chain integration and broadening DeFi access on OKX’s Layer-2 network.
- Aave’s cumulative lending volume tops $1 trillion, reinforcing its leadership in decentralized lending and its cross-chain appeal.
- X Layer’s on‑chain DeFi suite now includes major platforms such as Uniswap for swaps, Chainlink for oracles, and Stargate for cross‑chain transfers.
- Aave reports about $23.5 billion in total value locked, with net deposits on the platform exceeding $40 billion, outpacing competitors like Morpho (roughly $10 billion).
- The collaboration highlights ongoing cross‑chain DeFi expansion and the competitive dynamics among Layer-2 ecosystems as users seek cheaper, faster access to liquidity.
X Layer expands DeFi capabilities with Aave integration
The move integrates Aave’s lending and borrowing rails directly into X Layer, allowing users to deposit collateral, borrow against it, or earn interest on deposits without leaving the Layer-2 environment. For OKX Wallet holders and other X Layer participants, the integration reduces bridging costs and latency, delivering a more seamless DeFi experience on a network designed for high throughput and near-instant settlement. OKX emphasized that this integration broadens the DeFi toolkit available to its user base, potentially attracting both new users and existing DeFi participants seeking a more efficient on-chain experience.
X Layer launched amid a crowded Layer-2 market, positioning itself on scalability as a primary differentiator. Its stated proposition—low-cost transactions in a sub-second finality window—appears well-aligned with Aave’s need for fast, responsive liquidity access. By anchoring Aave to X Layer, the ecosystem gains a broader base of user activity that can tap into Aave’s treasury management, liquidity provisioning, and yield opportunities without the overhead of cross-chain messaging or bridges.
Aave’s historic milestone and cross-chain expansion
The Aave milestone of surpassing $1 trillion in cumulative lending volume underscores the protocol’s durable traction within DeFi. While the figure represents on-chain borrowing and lending activity rather than price or utilization metrics alone, it signals sustained engagement and capital allocation across the protocol’s markets. In parallel, Aave’s cross-chain footprint remains extensive; the protocol is deployed on more than 20 networks—including Ethereum, Arbitrum, and Base—continuing to monetize deposits and liquidity across multiple ecosystems.
Defi metrics reflect Aave’s market position as well. The protocol currently reports about $23.5 billion in TVL, a figure that positions it well ahead of near peers in the DeFi lending space. On a revenue and growth front, Aave has generated roughly $6.2 million in revenue over the last 30 days, a level that outpaces its closest competitor, Morpho, by a meaningful margin. These figures—TVL, net deposits, and revenue—highlight an established, profitable DeFi incumbent expanding its reach into Layer-2 networks like X Layer.
For context, Aave’s scale is complemented by a broad partnership network on X Layer. The platform joins other major DeFi players already integrated on the network, including Uniswap for swaps, Chainlink for price feeds and oracles, and Stargate for cross‑chain money transfers. The presence of these protocols signals a maturing liquidity fabric on X Layer, one that could attract more users who seek consolidated DeFi services on a single Layer‑2 chain.
The broader significance extends beyond a single deployment. As Layer-2 ecosystems compete to host robust DeFi primitives, expansions like Aave’s help validate the viability of on‑chain liquidity and lending on L2s. They also illustrate how leading protocols are differentiating themselves not just by features, but by the ease with which users can access and deploy liquidity in a multi-chain world.
Implications for investors, builders and users
For investors, the Aave–X Layer integration highlights the ongoing trend of cross‑chain DeFi maturation. The ability to access a leading lending market directly on an L2 reduces bridging costs and may spur higher utilization of capital across Layer-2 ecosystems. For builders and developers, the collaboration reinforces the importance of interoperability and modular DeFi stacks. As Uniswap, Chainlink, and Stargate join the mix on X Layer, developers gain a more cohesive environment to deploy and test new liquidity, pricing, and cross‑chain services without repeatedly migrating across chains.
As with all Layer‑2 expansions, observers will want to watch sustained user adoption, TVL trajectory, and the rate at which new DeFi services leverage Aave’s liquidity across X Layer. The balance between Layer‑2 efficiency gains and the continued demand for cross‑chain liquidity will shape how quickly X Layer moves from a niche option to a mainstream DeFi rail.
In the near term, the market will likely monitor whether X Layer can sustain its initial momentum as more users and protocols migrate to or experiment with Aave’s lending rails. The broader takeaway is that DeFi’s growth engine—efficient access to liquidity across networks—remains intact, with major protocols like Aave continuing to push the envelope on where and how users can borrow, lend, and earn yield.
Readers should keep an eye on subsequent updates from OKX and Aave regarding additional optimizations, expanded asset support, and any new DeFi partnerships on X Layer, which could further diversify the network’s liquidity and yield opportunities in the coming months.
Hyperliquid is decentralized, but geography still matters, as new research by Glassnode shows traders closer to its infrastructure have a clear speed advantage.
Trades from Tokyo-based users can reach the protocol’s validators in as little as 2 to 3 milliseconds. That’s far better latency than European users, who face delays exceeding 200 milliseconds.
That’s because Hyperliquid’s 24 validators are clustered in Tokyo, deployed across multiple availability zones in Amazon Web Services’ ap-northeast-1 region. The API layer routes through AWS CloudFront, but the validators sit in a single Japanese cloud region.
This shows that while decentralized platforms like Hyperliquid preserve core principles of open access, transparency, and the absence of centralized oversight to remove control asymmetries, speed and execution asymmetries still exist. So, while the market remains structurally fair and permissionless, traders with better proximity to infrastructure can still have an edge, highlighting an inherent tension between decentralization and equal participation in practice.

In a time-ordered system, geography determines queue priority. A trading desk in Tokyo can reach the matching layer hundreds of milliseconds ahead of competitors in Hong Kong, Singapore, or the U.S., securing a better position, tighter spreads, and higher fill probability.
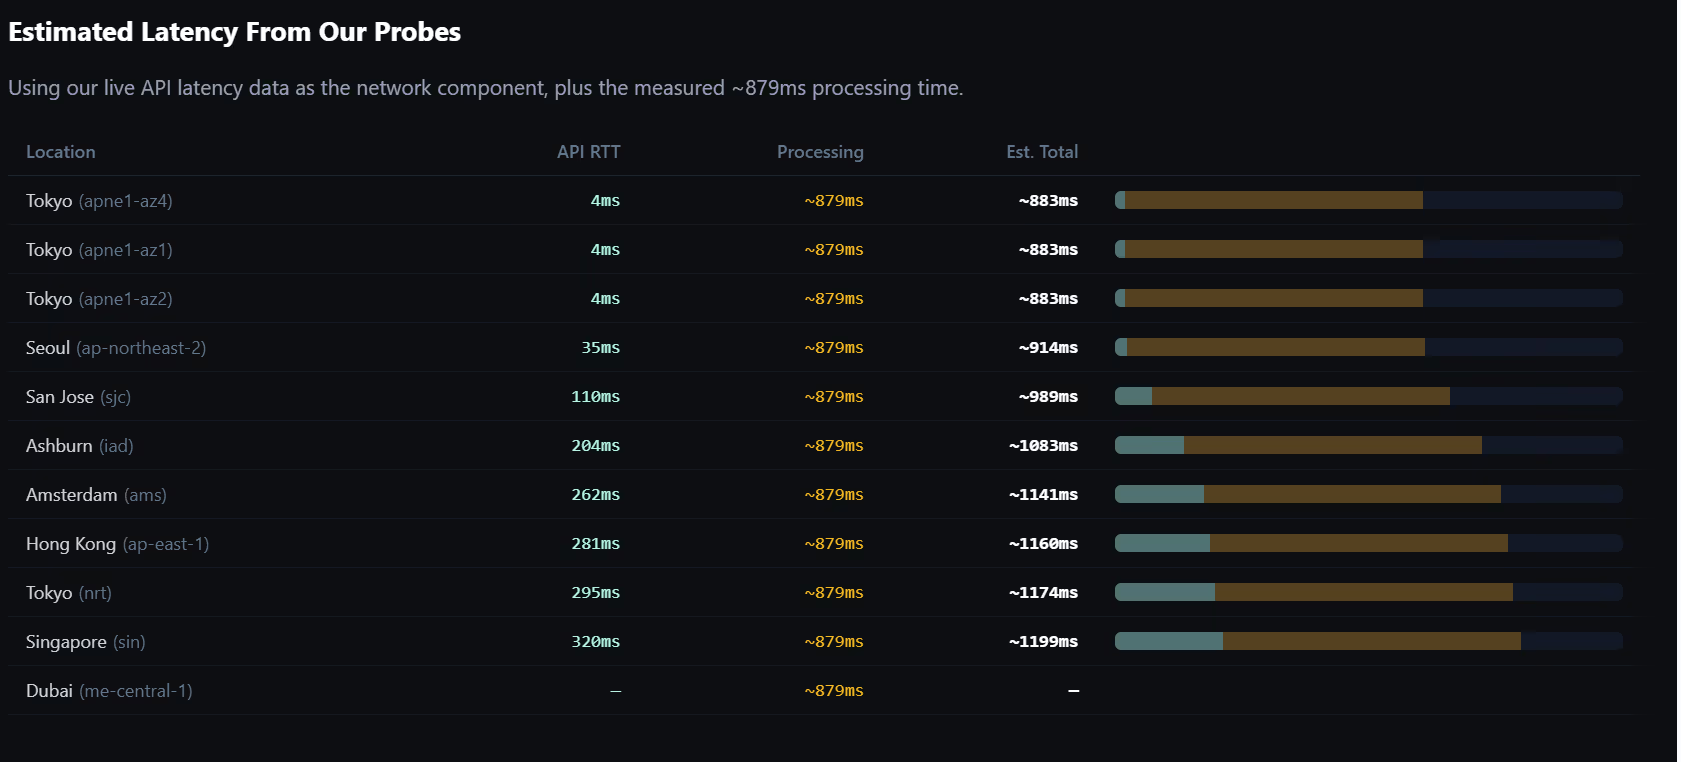
Hyperlatency’s order-to-fill measurements put numbers on the gap. From AWS Tokyo, the median round-trip to place and confirm an order is 884 milliseconds, of which roughly 879 milliseconds is server-side processing and just 5 milliseconds is network transit.
From Ashburn, Virginia, the total rises to roughly 1,079 milliseconds. The edge is about 200 milliseconds on a one-second fill, a margin that compounds across an exchange regularly handling more than $4 billion in daily perpetuals volume.
This research, however, isn’t without its critics. One person on X pointed out that more complicated order instructions submitted from the Tokyo region can hit a roundtrip latency time of 400ms.
Tokyo’s role as crypto’s infrastructure capital is not new. Centralized exchanges have clustered deployments around the city’s AWS region for years, drawn first by proximity to Asian trading flow and then by a regulatory framework Japan built after the collapse of Mt. Gox.
At Token2049 in Singapore last year, crypto executives described Tokyo as the center of gravity for digital asset infrastructure in Asia.
“Japan had no regulation for a long time, don’t forget, that’s where crypto basically happened, and then it went super stringent, and nothing happened for a long time,” Konstantin Richter, the CEO of Blockdaemon, told CoinDesk during Token2049. “But people kept on chiming away, and now they actually have a regulatory infrastructure that’s institutionally scalable and about ready to pop.”
Richter said his company’s clients in Japan are willing to pay for institutional-grade infrastructure.
BitMEX CEO Stephan Lutz put it more directly. “We were in Ireland before … but it became more and more difficult because basically everyone except the U.S. players are in the Tokyo data centers,” he said.
The switch boosted liquidity by roughly 180% in BitMEX’s main contracts and up to 400% in some altcoin markets, gains Lutz attributed to the latency reduction from being in Tokyo, not market-maker recruitment.
AWS Tokyo: crypto’s Mahwah
Hyperliquid is not unique in this regard. Binance and KuCoin also run significant infrastructure on AWS ap-northeast-1.
An April 2025 AWS outage caused service degradation across multiple platforms, underscoring how much of crypto’s plumbing runs through a single cloud region and Amazon itself (data shows that around 36% of all Ethereum nodes are powered by AWS).
In traditional finance, exchanges neutralize this kind of geographic advantage by design.
NYSE uses optical backscatter reflectometry in its Mahwah data center to equalize cable lengths to the nanosecond.
Deutsche Börse normalizes cross-connects to within 2.5 nanoseconds. IEX routes every order through a 350-microsecond speed bump, 38 miles of coiled fiber, to eliminate proximity advantage.
Europe’s MiFID II mandates clock synchronization to 100 microseconds and externally audited cable-length equalization. Those safeguards took decades to develop. Nothing equivalent exists in decentralized markets.
For now, crypto traders appear comfortable with that asymmetry. Hyperliquid has seen sustained growth despite its centralized infrastructure concentration. But as processing times compress and institutional capital enters DeFi, the dynamics are clear: speed determines position, and position determines liquidity.
The latency arms race that reshaped Wall Street is arriving in decentralized finance. It runs through Tokyo.

Prediction market transactions have hit record highs in March, amid growing interest in political and geopolitical event contracts, improved accessibility and positive regulatory developments for the industry.
According to prediction markets data tracked by Dune, the number of transactions for March is over 191 million so far, which is already a 2,838% increase compared to the same time last year.
Blockchain intelligence firm TRM Labs said in a report on Friday that the sector has grown significantly with Google Finance and mainstream media coverage of live odds.
“Prediction markets have scaled rapidly due to improved accessibility, regulatory developments, and integration with mainstream platforms. They are increasingly used as real-time indicators of geopolitical and macroeconomic events,” TRM Labs said.

Prediction markets allow users to trade contracts on the outcome of future events. They are emerging as a significant real-world use case for blockchain, with some platforms relying on crypto rails and stablecoins for settlement and payments.
US politics, macro decisions attract most interest
Monthly notional trading volume for prediction markets reached roughly $23.9 billion in March so far, up sharply from $1.9 billion at the same time last year, according to Dune, though still 12% below January’s all-time high.
TRM Labs noted that crypto-native topics have taken a back seat as users flock to contracts tied to political and global events.

“Geopolitical events, US politics, and macroeconomic decisions account for the majority of trading volume. Crypto-native topics, while prevalent, now represent a smaller share of overall activity,” the TRM Labs team said.
Polymarket data shows that the five highest-volume contracts as of Monday center on who the major US political parties will nominate for the 2028 presidential race and whether Israeli Prime Minister Benjamin Netanyahu will remain in office by year-end.
Addressing key challenges will decide if momentum continues
Prediction markets have faced increasing scrutiny over allegations of insider trading and potential violations of gambling laws.
In March, Kalshi and Polymarket announced plans to introduce trading guardrails, the same day US lawmakers unveiled a bipartisan bill to ban event contracts that resemble a “casino-style game.”
Related: Nevada judge temporarily blocks Kalshi from operating in the state
Going forward, TRM Labs said the continued growth of prediction markets will depend on how key challenges, such as market integrity and susceptibility to manipulation, are addressed.
“Looking ahead, prediction markets have the potential to evolve beyond speculative platforms into core infrastructure for real-time information aggregation and risk pricing,” TRM Labs said.
“As liquidity deepens and participation broadens, these markets could increasingly serve as forward-looking indicators for policy decisions, geopolitical developments, and macroeconomic trends—complementing, and in some cases competing with, traditional forecasting tools.”
Magazine: When privacy and AML laws conflict — Crypto projects’ impossible choice

Today’s NYT Connections: Sports Edition Hints, Answers for March 30 #553

Hill Dickinson Stadium: Dan Meis designed Everton’s new home – now he has an 1878 tattoo

Alcoa scales back amid gas squeeze

Smart energy pays enters the US market, targeting scalable financial infrastructure

Why Israel is blocking foreign journalists from entering

Bitcoin: We’re Entering The Most Dangerous Phase

How Much Money Does He Make Flipping This Mercedes? #shorts #reselling #flipping #money

“This time it’s yo’ money”: Trump’s signature to be added to U.S. paper currency

How and WHAT to invest in! #investing #stockmarket #money #finance #recession #inflation #wallstreet
-
 NewsBeat5 days ago
Manchester United reach agreement with Casemiro over contract clause amid transfer speculation
-

 News Videos4 days ago
Parliament publishes latest register of MPs’ financial interests
-

 Sports7 days ago
Gary Kirsten Accuses Pakistan Cricket Board Of ‘Interference’, Mohsin Naqvi Responds
-

 Sports7 days ago
Remo Stars and Kano Pillars Strengthen Survival Hopes in NPFL
-

 NewsBeat2 days ago
The Story hosts event on Durham’s historic registers
-

 News Videos7 days ago
Ch 9 Financial Management Part 1 | Detailed One Shot | Class 12 Business Studies Boards 2026
-

 Business3 days ago
Instagram, YouTube Found Responsible for Teen’s Mental Health Struggle in Historic Ruling
-
 NewsBeat5 days ago
Tesco is selling new Cadbury Dairy Milk bar and people can’t wait to try it
-
 Entertainment7 days ago
Cynthia Bailey Dishes on ‘RHOA’ Season 17, Discusses Kandi
-

 Tech6 days ago
Samsung will soon let you control smart home devices from your car’s dashboard
-
 Entertainment1 day ago
Lana Del Rey Celebrates Her Husband’s 51st Birthday In New Post
-
 NewsBeat7 days ago
Colombian military plane with 110 soldiers onboard crashes following takeoff
-

 Business6 days ago
More women enter wealth management, but few in advisory roles: study
-

 Fashion6 days ago
Does It Matter What You Wear When You’re Laid Off and Looking?
-

 Fashion7 days ago
Fringe Bags for the Season
-

 Business6 days ago
Late-paying firms face multimillion-pound fines under new crackdown
-

 NewsBeat5 days ago
Entrepreneurs Forum survey reveals optimism in North East
-

 Sports5 days ago
Fantasy Baseball Week 1 Preview: Top sleeper hitters for both five- and 12-day period led by Munetaka Murakami
-

 Politics6 days ago
How Media Platforms Balance Performance and Accessibility in Image Delivery
-
 NewsBeat6 days ago
NASA Artemis II Astronauts enter 14-Day quarantine as moon rocket reaches launchpad
You must be logged in to post a comment Login