
Crypto World
Most Undervalued Since March 2023 at $20K, BTC Price Metric
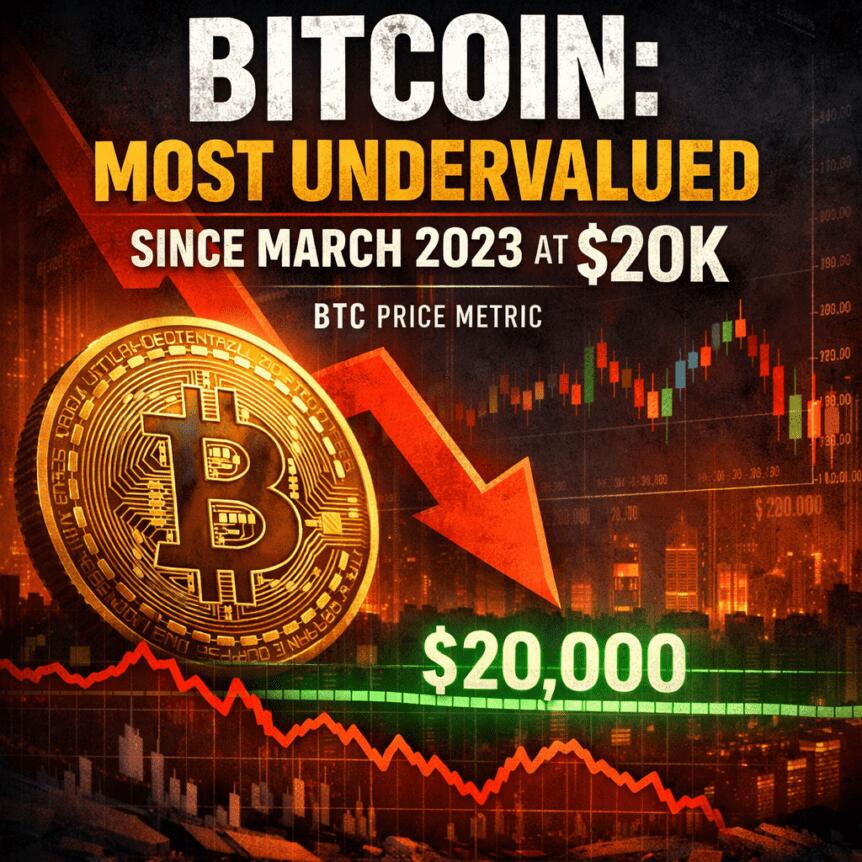
Bitcoin (CRYPTO: BTC) is approaching what on-chain researchers describe as an undervalued zone for the first time in more than three years, according to CryptoQuant’s latest data. The market-value-to-realized-value (MVRV) ratio, a classic gauge of whether Bitcoin is fairly valued relative to the price at which the supply last moved, has moved toward a breakeven point after a months-long downtrend that followed an October 2025 all-time high. Last week’s price action saw BTC dip below $60,000, a level that has framed the market’s sentiment and testing of support in recent cycles. With the MVRV metric hovering near 1.1, analysts say the asset is edging into territory that historically accompanies accumulation and potential reversal, though they caution that no single indicator guarantees a bottom.
Key takeaways
- The MVRV ratio is approaching its key breakeven threshold for the first time in more than three years, signaling a potential move toward undervaluation.
- CryptoQuant data show the MVRV reading around 1.1, the lowest since March 2023 when Bitcoin was trading near $20,000.
- Analysts emphasize that when MVRV dips below 1, Bitcoin tends to be undervalued; the current reading sits above that level but within a range historically tied to bottoms or near-bottom conditions.
- The two-year rolling Z-score of the MVRV ratio has recently reached historic lows, a pattern some traders compare to prior bear-market bottoms, suggesting accumulation dynamics may be forming.
- Past commentary notes that the Downdraft since the October 2025 peak has not featured a rapid ascent into an overvalued zone, a nuance that could differentiate this cycle’s bottom formation from earlier ones.
Tickers mentioned: $BTC
Market context: On-chain signals come as Bitcoin experiences a multi-quarter consolidation after a new all-time high, with traders watching MVRV and Z-score metrics alongside price levels around $60,000. The combination of shifting on-chain signals and macro risk sentiment will likely influence whether the current downtrend resumes or a broader accumulation phase takes hold.
Why it matters
On-chain metrics like MVRV provide a lens into the psychological and behavioral underpinnings of Bitcoin’s price action. When the market value to realized value ratio approaches breakeven, commentators interpret it as a potential signal that the supply-weighted cost basis is, on average, becoming cheaper relative to current market prices. CryptoQuant contributors have highlighted that Bitcoin’s MVRV ratio hovered around 1.13 after Bitcoin’s dip below the $60,000 level last week—the lowest print since March 2023, when BTC traded near $20,000. That backdrop matters because it frames a broader narrative: the asset may be transitioning from a drawdown phase into a period where long-term holders could be stepping in at historically favorable levels.
“Generally, when the MVRV ratio falls below 1, Bitcoin is regarded as undervalued. At present, the indicator stands at around 1.1, suggesting that price levels are nearing the undervaluation range.”
CryptoQuant’s analysis emphasizes that the current reading should be interpreted in the context of a four-month downtrend that followed Bitcoin’s October 2025 peak. The team notes that the market did not experience a sharp move into an obviously overvalued zone during the most recent bull cycle, a nuance that could influence how traders interpret the “bottom formation” narrative this time around. The research argues that such a structural difference could mean the eventual bottom may form gradually rather than through a sudden capitulation event—a scenario that has implications for long-term investors and risk teams evaluating exposure.
“The current Z-Score of $BTC is lower than during the bear market bottom in 2015, 2018, COVID crash 2020 and 2022,”
commented Michaël van de Poppe, a well-known trader and analyst, underscoring how the present configuration differs from prior cycles. In another update, CryptoQuant contributor GugaOnChain used a separate Z-score iteration to characterize BTC/USD as being in a “capitulation zone,” a reading that some interpret as an early stage of accumulation pressure forming behind the scenes. The analyst framed the takeaway as an invitation to consider the bottom could be forged in the current environment rather than simply waiting for a textbook capitulation event to materialize.
“The indicator suggests that we are approaching the historical accumulation phase,”
GugaOnChain wrote, adding that the statistical deviation captured by the Z-score points to opportunity rather than imminent disaster. While the language is nuanced, the consensus in these on-chain circles is that Bitcoin’s downside risk may be increasingly limited as long-term holders show willingness to accumulate near these levels.
What to watch next
- Track the MVRV ratio for a breakeven shift toward or below 1.0, which historically signals stronger undervaluation periods or a local bottom formation.
- Monitor the two-year rolling Z-score trajectory for a sustained move away from capitulation readings toward accumulation-style behavior.
- Observe Bitcoin price action around key support zones, particularly a continued hold above $60,000 and any subsequent retests that could validate the on-chain narrative.
- Look for corroborating on-chain signals, such as realized-cap data and transaction-flow metrics, that would reinforce a shift from distribution to accumulation.
Sources & verification
- CryptoQuant analysis on Bitcoin’s MVRV ratio and the “undervalued” zone hypothesis.
- CryptoQuant commentary on Z-score readings and capitulation-zone signals for BTC/USD.
- Cointelegraph coverage of Bitcoin’s price action, including the recent dip below $60,000 and prior bear-market analyses referenced in related on-chain pieces.
- Historical context from on-chain reporting on prior cycle bottoms (2015, 2018, 2020, 2022) and the 2023 regime when MVRV prints below 1.
Bitcoin’s on-chain signals point toward undervaluation and potential bottom formation
Bitcoin’s current on-chain narrative centers on a delicate balance between valuation signals and price action. The MVRV ratio, long used to gauge whether market prices are aligned with realized on-chain cost bases, has begun to test a breakeven threshold after a prolonged downtrend. The latest reads show MVRV around 1.1, a level that CryptoQuant contributors describe as edging into an undervaluation zone. This is especially notable given that the most recent weekly close saw BTC slip under the $60,000 mark, a psychological line that has acted as both a magnet and a ceiling in various market regimes. The juxtaposition of a price discipline around key levels with an MVRV metric that says, metaphorically, “value is being accumulated near the current prices,” fuels a nuanced debate on whether a lasting bottom is imminent or whether further consolidation is necessary before a durable uptrend can resume. (CRYPTO: BTC)
CryptoQuant researchers emphasize that when MVRV falls below 1, the signal is a cleaner undervaluation flag. While the current approximation sits around 1.1 rather than 1.0, the interpretation remains constructive: price levels could reflect a rising probability of longer-term value attraction. The last time MVRV explicitly dipped below 1 was at the start of 2023, when BTC traded around $20,000. The comparison underscores that the present cycle has delivered a different flavor of bottoming dynamics, one that may unfold more gradually than in prior cycles. The source notes that the peak-to-trough structure of the current drawdown did not send the market into a textbook overvalued regime, which broadens the set of possible scenarios around the eventual bottom and subsequent recovery.
“Generally, when the MVRV ratio falls below 1, Bitcoin is regarded as undervalued. At present, the indicator stands at around 1.1, suggesting that price levels are nearing the undervaluation range.”
Beyond the MVRV signal, the market is attuned to the behavior of another metric set—the Z-scores that measure how far current values diverge from historical patterns. In two-year windows, the MVRV Z-score has dipped to an all-time low in several instances, a pattern analysts say mirrors the kinds of bottoming behavior seen in previous cycles. Michaël van de Poppe has highlighted that the current Z-score is lower than what was observed at major bear-market bottoms in 2015, 2018, 2020, and 2022, though no single metric guarantees an outcome. A different analyst, GugaOnChain, has used an alternate Z-score variant to characterize BTC/USD as being in a capitulation zone—an environment that often precedes accumulation-driven rebounds. The underlying message is that the bottom formation, if it is underway, could be a more drawn-out process than in some historical episodes, with on-chain dynamics providing nuance that price charts alone might miss.
These signals come at a time when the broader market is listening closely to on-chain data instead of relying solely on momentum-driven narratives. The combination of a price dip to sub-60k levels and a valuation framework that points toward undervaluation is generating renewed interest among long-term holders who recall similar cycles in which the real value of Bitcoin begins to assert itself well before a definitive price breakout appears on traditional charts. In this light, the discussion shifts from whether a bottom exists to how convincingly the current readings could translate into a sustainable reversal once the cycle completes its consolidation phase. The narrative remains contingent on a confluence of factors, including future price action, on-chain flows, and macro risks that continue to shape risk appetite across the crypto ecosystem.
The analysis, while nuanced, reinforces a cautious yet curious stance among observers: the market may be near a critical juncture where valuation signals begin to align with price stability and eventual demand. As ever, the caution remains that on-chain indicators offer probabilities, not certainties, and that a range of outcomes remains plausible depending on how external forces evolve in the weeks ahead.

Crypto World
Trump Just Signaled Military Escalation Against Iran and Bitcoin Price Dropped 6% in Hours: Is $60,000 Next?
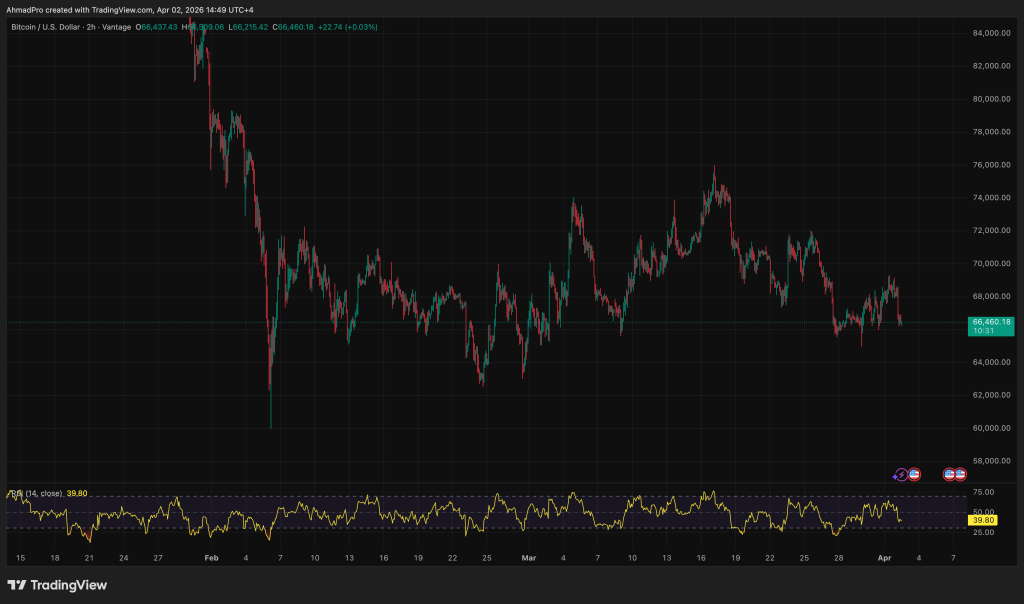
Bitcoin price dropped to approximately $66,500, shedding nearly 6% in hours, after President Trump’s April 1st address signaled harder military strikes against Iran in the coming weeks, shattering the fragile optimism that had briefly lifted risk assets.
The S&P 500 followed into the red, with MSCI’s Asia Pacific index reversing a prior session’s rebound to fall 1.7%. Brent crude jumped more than 5% to above $106 a barrel as traders priced in prolonged Strait of Hormuz disruption. This market fallout is precisely the macro fog that keeps risk assets pinned.
Trump’s remarks reversed sentiment that had built earlier this week when he indicated a willingness to end the conflict before reopening the Strait of Hormuz, a critical global trade waterway.
The April 1st address walked that back entirely, using language that pointed toward escalation rather than negotiation. Investors received no timeline for resolution – only the prospect of intensified operations.
Bitcoin’s digital gold narrative took another hit. With the 30-day rolling BTC-to-S&P 500 correlation spiking to 0.75 – its highest in months – institutional desks are treating Bitcoin as a high-beta tech proxy, not a geopolitical hedge. The safe-haven narrative is cracking.
Discover: The best crypto to diversify your portfolio during market turbulence
Bitcoin Price Prediction: Hold $65,000 Support or Another Leg Down?
BTC is sitting at $66,500, stuck in a pattern of lower highs since the March peak at $76,000, with each recovery attempt getting weaker and selling pressure capping every bounce before it gets going.
The $64,000 to $65,000 floor is the level that matters most right now, it has held on multiple tests but a clean break below it opens the path straight back to $60,000 where the February wick bottomed out.

On the upside, $68,000 and then $70,000 are the levels that need to flip for any real recovery narrative to rebuild, and neither looks easy given how heavy every bounce has been recently.
Until one of those scenarios plays out, this is a chart in damage control mode.
The broader bearish trend in BTC’s recent price history makes this inflection point more consequential than it might otherwise appear.
Bitcoin ended March up just 2%, snapping a five-month losing streak – but it remains down roughly 45% from its October peak above $126,000. Apparent demand was already negative by approximately 63,000 BTC as of late last month, per CryptoQuant.
“Stock and commodity markets continue to whipsaw according to Trump’s latest comments on geopolitical developments,” said Caroline Mauron, co-founder of Orbit Markets.
“Bitcoin is largely following stocks’ direction, though in the past few weeks it has showed reduced sensitivity to both good and bad news.” That reduced sensitivity may be the one thin positive – but it hasn’t prevented a $6,500 drop in a single session.
Notably, gold’s worst monthly performance in 17 years through March – down more than 11% – strips away the easy ‘rotate to safe havens’ narrative. Treasuries and cash are absorbing the flight-to-safety flow instead.
The 10-year U.S. Treasury yield surged as markets priced in persistent inflation driven by energy supply disruptions, creating a direct headwind for non-yielding assets like Bitcoin. Until the Iran situation resolves cleanly in either direction, Bitcoin is unlikely to decouple.
Explore: The best pre-launch token sales with asymmetric upside potential
The post Trump Just Signaled Military Escalation Against Iran and Bitcoin Price Dropped 6% in Hours: Is $60,000 Next? appeared first on Cryptonews.
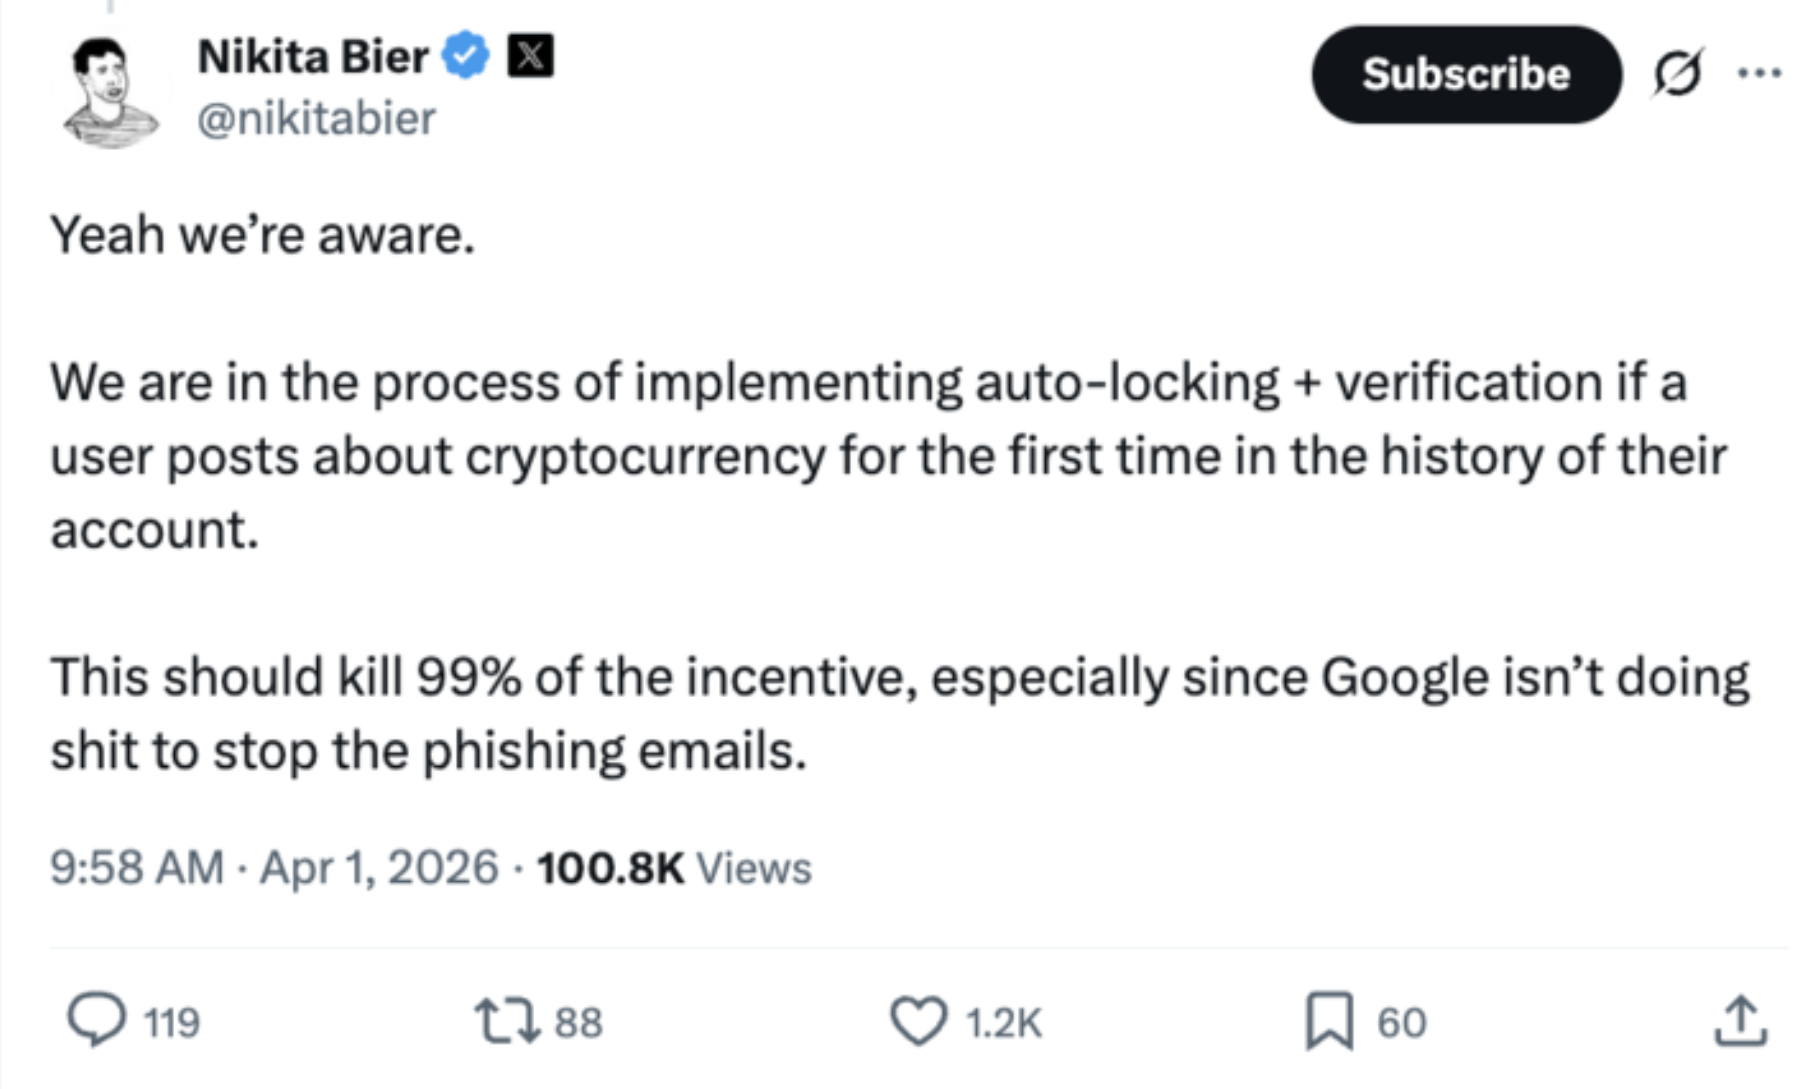
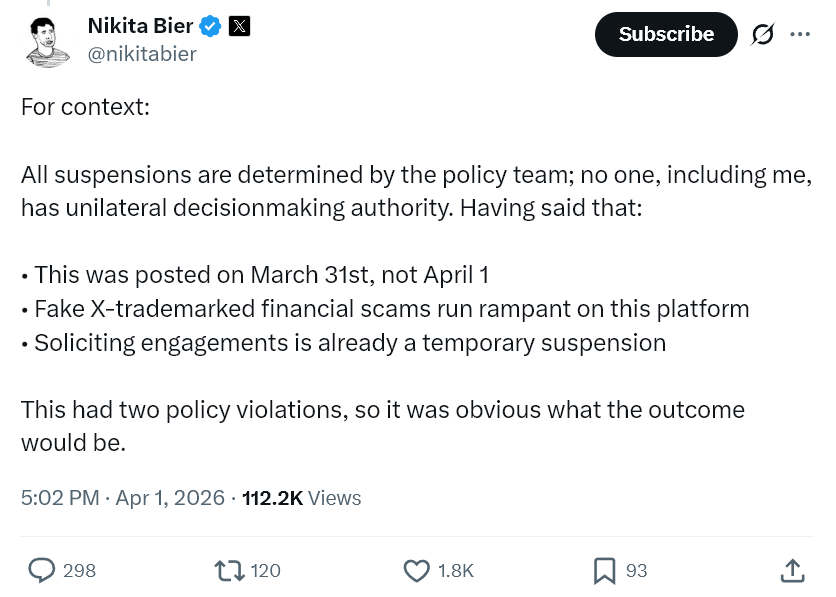
X (formerly Twitter) is moving to automatically lock accounts that suddenly post about crypto for the first time, in a bid to curb a growing wave of hacks and scam promotions on the platform.
Product lead Nikita Bier said the system will flag accounts with no prior crypto activity that begin promoting tokens, triggering identity verification before further posts.
The feature specifically targets a common attack pattern where hackers take over high-follower accounts and use them to push meme coins or phishing links.
The change reflects a broader crackdown on crypto-related spam, which has surged in recent months.
Hacked accounts promoting tokens have become one of the most reliable scam vectors on X, often exploiting audience trust to drive quick liquidity before disappearing.
In practice, the update treats sudden crypto activity as suspicious by default. That could reduce large-scale phishing campaigns but may also catch legitimate users posting about crypto for the first time.
Reaction has been split. Some users see it as a necessary step to clean up “crypto Twitter” and protect users from scams.
Others argue it introduces excessive control, raising concerns about censorship and how platforms define “normal” behavior.
The post X (Twitter) Targets Scams by Locking First-Time Crypto Posts appeared first on BeInCrypto.
Crypto World
Ethereum Price Prediction: Pepeto Raises Above $8.1M While ETH Drops Below $2,100 and SOL Faces Pressure

Google just warned that quantum computers could crack Bitcoin’s encryption in roughly nine minutes, a finding that rattled the crypto market this week. Ethereum and Solana are both losing ground for different reasons, and the ethereum price prediction shows limited recovery while traders weigh growing risks.
The real question is where smart money goes while the large caps stall. Pepeto has raised above $8.1M in presale, the Binance listing is approaching, and the entry available now is the asymmetric chance that large cap yields will never produce.
Google’s Quantum AI team published research showing that cracking crypto’s core encryption could need fewer than 500,000 qubits, far below earlier estimates, according to Bloomberg.
CoinDesk reported that roughly 6.9 million Bitcoin sit in wallets where public keys are already exposed. The findings do not mean an attack is imminent, but they tighten the timeline enough to change how traders think about where to put capital.
Top 3 Cryptocurrencies Amidst the Ethereum Price Prediction
Pepeto
Google just proved that quantum threats are closer than anyone assumed, and the traders paying attention are repositioning now. Most will stay frozen, waiting for large caps to recover. The ones looking at Pepeto see what has not been priced in yet.
That is the difference that separates early movers from everyone else. Most people who missed the early stages of the biggest crypto runs did not have the right tools when it mattered, and by the time a breakout became obvious the entry that counted was gone.
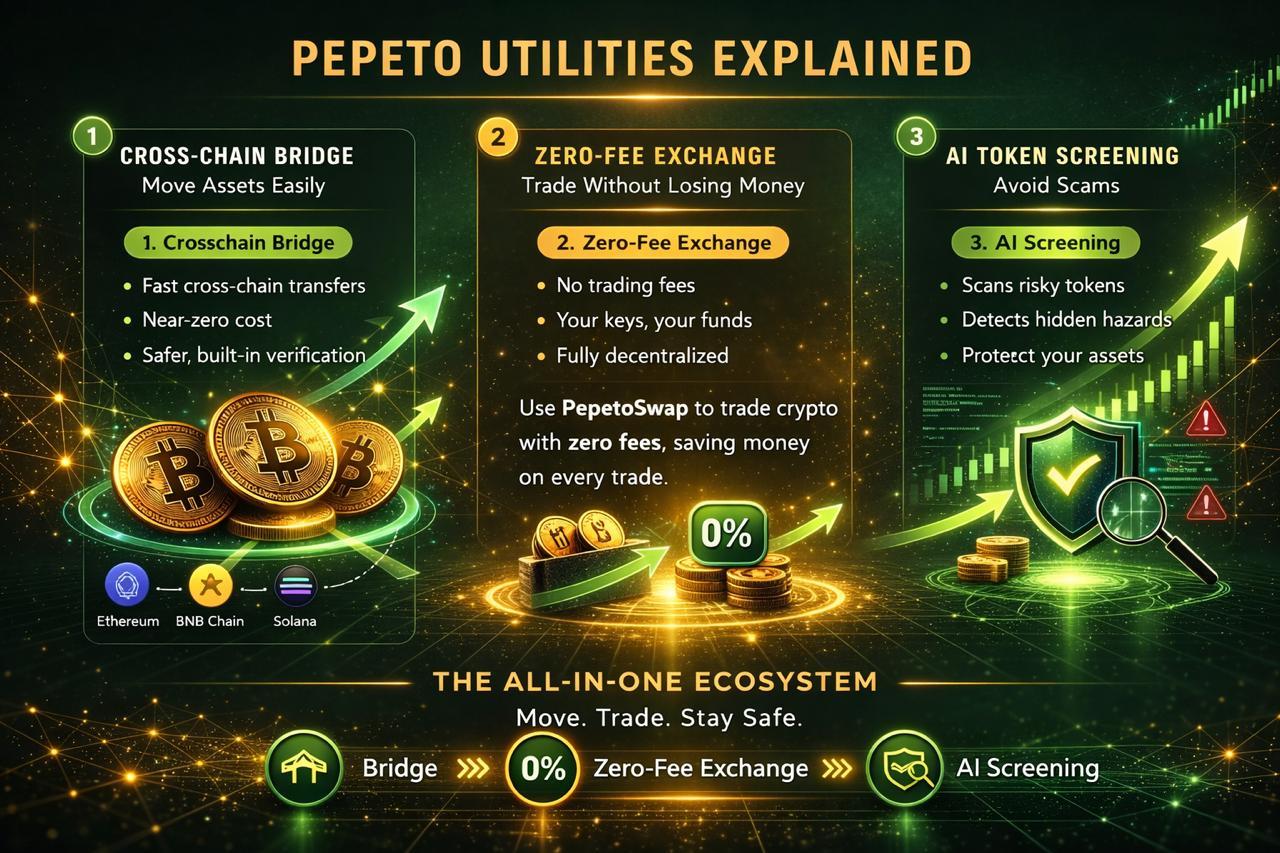
Pepeto exists to close that gap. The cross chain bridge moves your holdings between blockchains so you are never trapped on one network when the opportunity lives on another. The zero fee swap engine trades any token pair across every major chain at zero cost, which means your position never gets eaten by fees while you try to grow it.
While the ethereum price prediction keeps pointing to limited recovery, Pepeto’s exchange tools are already live and working from entry to exit. The mind who built the first Pepe token is part of the dev team, and a former Binance expert leads alongside. At $0.000000186, the presale price is a fraction of what any buyer will pay once the Binance listing opens. A $25,000 position earns 189% APY through staking, putting $49,000 in yearly returns into your wallet just for holding while the listing approaches.
That is the kind of return no large cap can produce from its current level. The presale is filling with serious capital, the Binance listing date is not moving backward, and the wallets that are not inside yet are running out of runway.
Ethereum
Ethereum is trading near $2,054 after a brief climb to $2,200 failed to hold, and the token remains down nearly 50% from its record high according to CoinMarketCap.
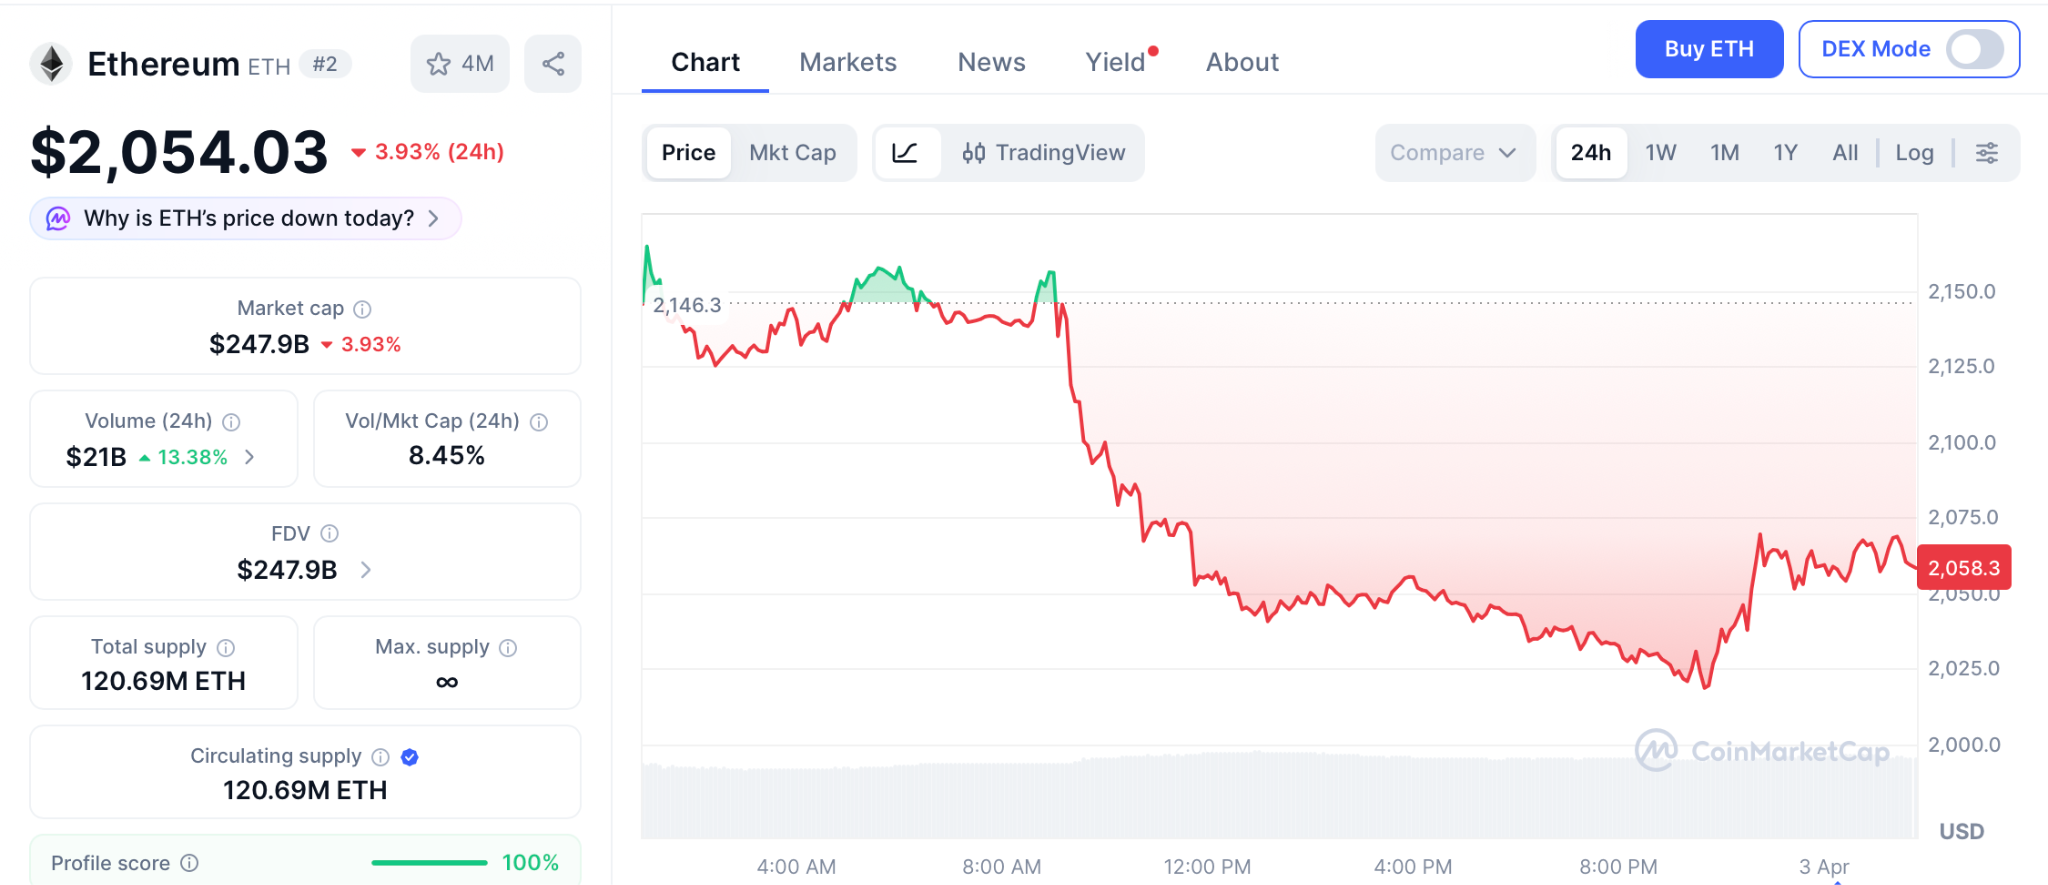
The Glamsterdam upgrade expected in June is the main catalyst, but derivatives still show heavy leverage that could trigger sharp moves. Even a push back to $2,400 delivers a modest return compared to the entries presale wallets are collecting before listing day.
Solana
Solana dropped to $79 after the Drift Protocol exploit drained $285 million from the network’s largest DeFi exchange according to Bloomberg.
SOL recovered slightly but the damage to confidence is fresh. Even a reclaim of $100 delivers less than 20% from here, which barely registers against the kind of early entry presale tokens offer before they hit the open market.
The Bottom Line
The ethereum price prediction turned cautious after ETH failed to hold $2,200 and Solana took a direct hit from the Drift exploit. Even the Google quantum research that rattled the market did not change the fact that large caps have limited room from here. Capital always flows to the sharpest entry, and right now that flow is headed into Pepeto.
The presale is above $8.1M, whales are entering with real size, and the Binance listing is locked in, which you can verify at the Pepeto official website. The wallets that miss this window will spend the next cycle wishing they had moved faster.
Click To Visit Pepeto Website To Enter The Presale

FAQs
What does the latest ethereum price prediction reveal after ETH pulled back from $2,200?
The ethereum price prediction shows ETH stuck below $2,200 with heavy leverage in derivatives, making a clean breakout difficult to call right now.
What is the ETH price forecast as geopolitical volatility and DeFi exploits shake confidence?
The ETH price forecast remains cautious because macro pressure and the Drift Protocol fallout are keeping risk appetite low across the market.
What does the latest ethereum market news mean for investors seeking better early stage opportunities?
Ethereum market news highlights limited large cap returns, pushing investors toward early presale entries like Pepeto that carry far bigger potential before the Binance listing, and all details are at the Pepeto official website.
Disclaimer: This is a Press Release provided by a third party who is responsible for the content. Please conduct your own research before taking any action based on the content.

Bitcoin (BTC) traded at $66,450 on Thursday, a 47% drawdown from its all-time high of $126,000 reached in October 2025. As a result, many BTC holders are sitting on significant unrealized losses, underscoring the risks still facing Bitcoin investors at current levels.
Key takeaways:
-
Bitcoin’s 47% drawdown from its $126,000 all-time high has left holders with nearly $600 billion in unrealized losses.
-
Apparent demand and buying from US investors remain in deep contraction, suggesting broader market distribution.
44% of Bitcoin circulating supply now in the red
BTC/USD trades 24% below its yearly open of $87,500 after it closed 2025 in the red. The prolonged weakness has pushed a significant portion of its supply underwater.
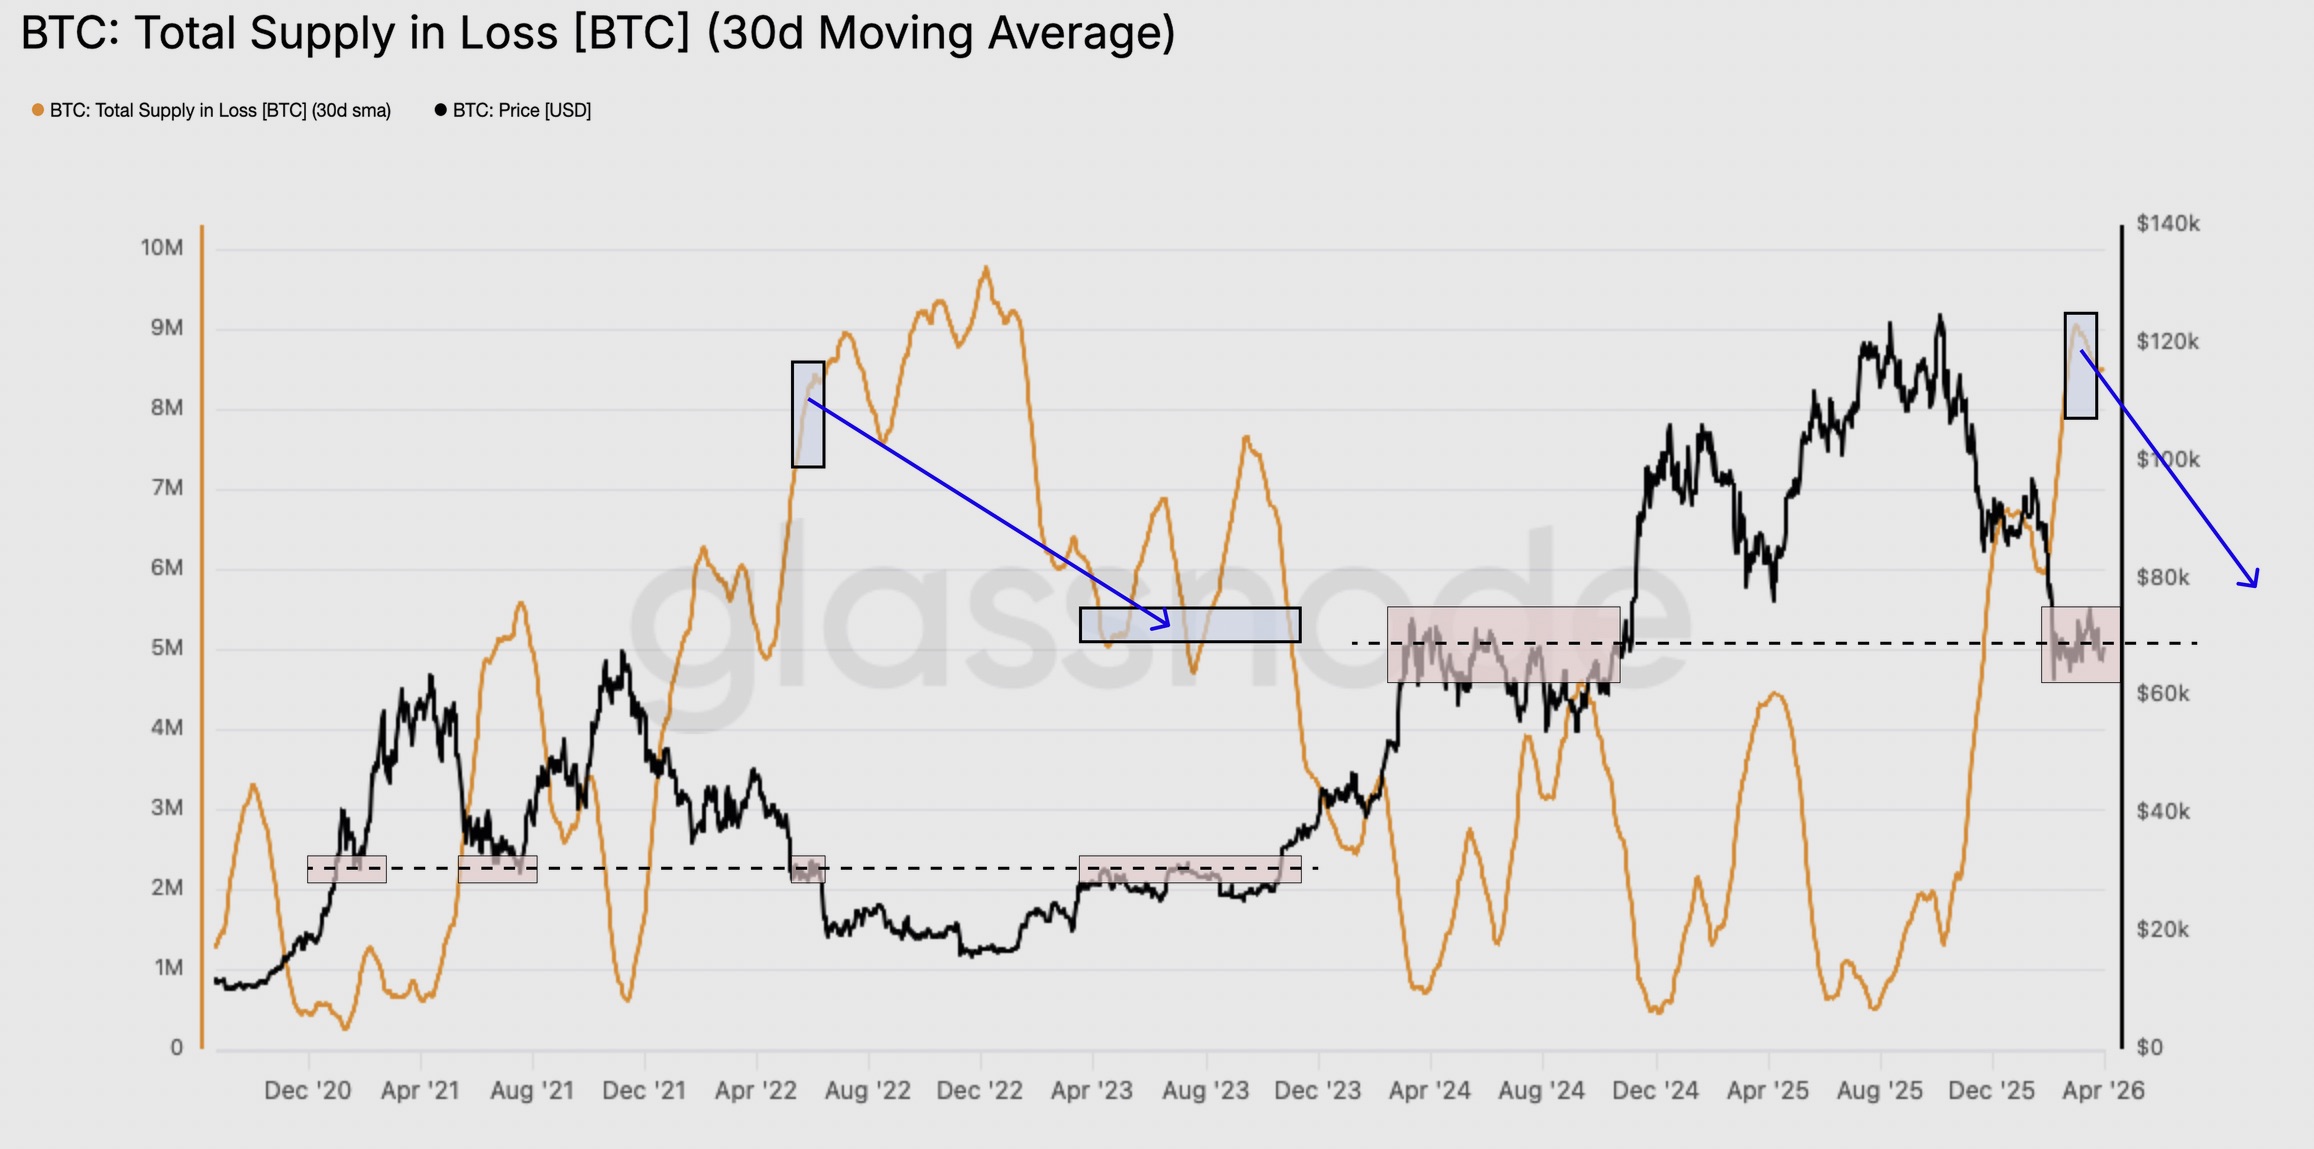
As Bitcoin trades at $66,450 on Thursday, roughly 8.8 million BTC are held at a loss, representing $598.7 billion in unrealized losses, or more than 44% of the circulating supply, according to data from Glassnode.
Related: Bitcoin risks new lows as US dollar targets highest level since April 2025
The magnitude of this figure implies a “structural resemblance to conditions observed in Q2 2022,” Glassnode said in its latest Week On-chain newsletter.
Glassnode explained that the 2022 bear market provides a precedent when roughly 3 million BTC needed to be redistributed before the market could recover.
“Historically, resolving a supply overhang of this scale has required a meaningful redistribution of coins from loss-realizing holders to new buyers at lower prices.”

This mounting paper loss has eroded conviction, prompting long-term holders (LTH) to capitulate by selling below their cost basis.
LTH realized loss, a metric that measures the aggregate dollar value of Bitcoin sold at a loss by investors who have held BTC for more than 155 days, has risen to $200 million, “confirming active capitulation,” Glassnode said, adding:
“A meaningful cooldown toward levels below $25M per day would represent a more compelling signal of exhaustion in selling pressure, and a prerequisite for the base formation that historically precedes a sustainable bull market transition.”

BTC’s spot price is also below the average cost basis of US spot Bitcoin ETF holders, currently at $83,408, suggesting that these investors are increasingly under strain.

The risk-off sentiment is also seen in global Bitcoin investment products, which recorded more than $194 million in net outflows during the week ending March 27.
Bitcoin apparent demand contraction persists
Bitcoin’s apparent demand has stayed negative since mid-December 2025, as traders and investors continue to be risk-off amid BTC’s price weakness.
Capriole Investment’s Bitcoin Apparent Demand metric shows that the demand for Bitcoin is at -1,623 BTC on Thursday, and that sellers are in control.

The continued contraction in total apparent demand indicates persistent “selling from retail,” CryptoQuant said in its latest Weekly Crypto report, adding:
“The sustained demand contraction, now persisting since late November 2025, confirms that the broader market remains in distribution.”
Meanwhile, Bitcoin’s Coinbase Premium Index, which measures the difference in pricing between the BTC/USD pair on Coinbase and Binance, also remains in negative territory.
“The persistent negative premium indicates that US investors have not yet re-entered the market at scale,” CryptoQuant said, adding:
“This is consistent with the demand contraction seen across on-chain metrics.”

As Cointelegraph reported, Bitcoin price risks new lows in the short term amid a strengthening US dollar.
This article is produced in accordance with Cointelegraph’s Editorial Policy and is intended for informational purposes only. It does not constitute investment advice or recommendations. All investments and trades carry risk; readers are encouraged to conduct independent research before making any decisions. Cointelegraph makes no guarantees regarding the accuracy or completeness of the information presented, including forward-looking statements, and will not be liable for any loss or damage arising from reliance on this content.


France’s Lightning Stock Exchange, known as Lise, is preparing to host what could become Europe’s first fully onchain stock market debut, a step that brings tokenization into the initial public offering (IPO) process.
The Paris-based exchange, approved last year under the EU’s Distributed Ledger Technology (DLT) pilot regime, plans to list French aerospace supplier ST Group on April 9, according to a Thursday press release.
ST Group builds composite parts used in aircraft, defense systems and space programs. The company says it has about 59 million euros ($68 million) in potential program revenue over the next decade and aims to scale output as demand rises across aerospace and military supply chains.
Tokenization has gained traction among large financial firms using blockchain rails to settle trades and track ownership of assets such as bonds, funds and equities. Proponents say tokenization could improve capital markets with cheaper and faster settlements and more efficient operations. Wall Street giants like the Nasdaq and NYSE are also laid out plans for tokenized securities trading on their platforms.
Lise pushes that concept further by moving the IPO process itself onchain. The exchange focuses on small and mid-sized firms that would face high costs and long timelines when raising capital through traditional markets. It is backed by French lenders such as BNP Paribas, CACEIS (a subsidiary of the Crédit Agricole Group) and Bpifrance.
ST Group’s debut, if successful, could offer a blueprint for smaller firms a cheaper and faster path to public markets within European rules.
Read more: EU at risk of falling behind the U.S. in tokenization rules, digital asset firms warn
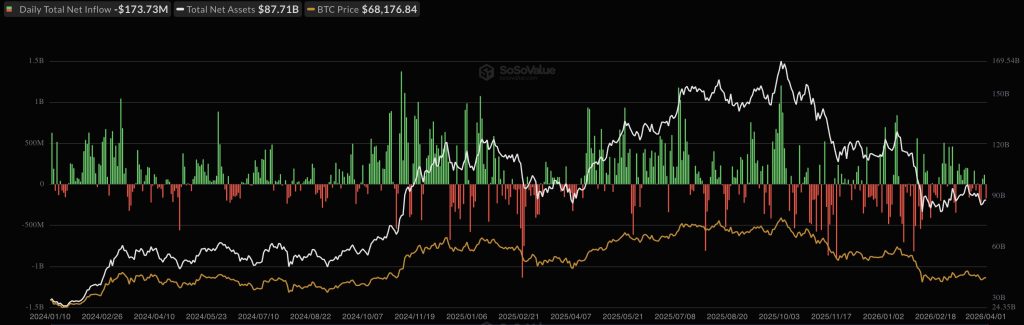
US spot Bitcoin ETFs pulled in $1.32 billion in March 2026, ending four consecutive months of net outflows and posting their first monthly gain of the year. The reversal signals institutional demand returning to Bitcoin specifically, not to crypto broadly.
That distinction matters. While BTC funds snapped their negative streak, Ethereum ETFs closed March with $46 million in outflows, extending their own losing run to five straight months. XRP funds also ended in negative territory, sharpening a capital rotation thesis that increasingly favors Bitcoin dominance over altcoin exposure.

The prior four months had been brutal. Outflows totaled approximately $6.3 billion between November 2025 and February 2026, $3.5 billion in November alone following Bitcoin’s crash from its $126,000 all-time high on October 10.
December added $1.1 billion in redemptions, January another $1.6 billion, with February contributing $206 million more before sentiment began stabilizing.
Macro conditions drove the pressure. Sticky inflation, a cautious Federal Reserve, and geopolitical risk from the U.S.-Iran conflict kept institutional risk appetite compressed. Bitcoin retraced over 50% from its October peak, closing Q1 2026 at $66,619, down 23.8% from January 1.
ETF investors were sitting on an average cost basis near $84,000 against a market price roughly $18,000 below that.
Despite the paper losses, whale accumulation offered a countervailing signal.
On-chain data showed wallets categorized as whales accumulated 30,000 BTC – approximately $2.1 billion – through March, absorbing selling pressure and stabilizing price near $65,000 during peak Iran-related volatility.
BlackRock’s IBIT added $98.42 million on March 31 alone, and led a $458 million single-day surge earlier in the month. US spot Bitcoin ETFs added $117.63M as BTC reclaimed $68K at one point during that window, reinforcing the case that institutional demand was quietly rebuilding beneath the noise.
Discover: The best pre-launch token sales
Bitcoin ETFs Inflows: Sustainable Reversal or Relief Rally?
That $1.32 billion inflow number sounds strong, but it does not tell the full story, because it still failed to offset the $1.81 billion that left earlier in the quarter, leaving Bitcoin ETFs with a net outflow overall, so calling this a clean recovery is a stretch.
What we are really seeing is uneven demand, bursts of buying followed by sharp redemptions, which explains why price still feels stuck instead of trending.
If inflows actually stabilize and turn consistent, especially with macro tension easing, that is when Bitcoin has room to push through $74K and aim higher, helped by April usually being a solid month.
Right now though it still looks like a range, with price caught between roughly $67K and $74K while institutions absorb supply but do not push aggressively, and retail participation remains weak in the background.
The risk is that those recent inflows were just short term positioning, because we already saw a sharp weekly outflow at the end of March, and if that kind of selling returns and price loses the lower range, things can open up quickly to the downside.
Nate Geraci, co-founder of the ETF Institute, previously argued that cumulative outflows since the October crash are statistically insignificant relative to the $56 billion in total net inflows the category has attracted since its January 2024 launch. The diamond hands thesis holds – but only if inflows resume with conviction rather than in isolated bursts.
Discover: The best crypto to diversify your portfolio with
The post Bitcoin ETFs Snap Four-Month Outflow Streak With $1.32B in Inflows appeared first on Cryptonews.


Summary
- Fundrise’s Innovation Fund VCX will be tokenized into a new asset called VCXx in partnership with Kraken’s xStocks platform.
- VCXx will provide onchain exposure to late-stage private tech companies such as SpaceX, OpenAI, Anthropic, and Databricks through a single token.
- Eligible investors will be able to buy VCXx using USDG or U.S. dollars, with tokens designed to integrate into broader onchain trading, collateral, and DeFi strategies.
Technology investment platform Fundrise is partnering with crypto exchange Kraken to tokenize shares of its Fundrise Innovation Fund VCX, according to reporting from Crowdfund Insider. The deal will see the publicly listed VCX vehicle, which trades on the NYSE, wrapped into a blockchain-based representation on Kraken’s tokenized equities venue xStocks under the ticker VCXx.
Kraken’s xStocks framework, powered by Payward, already offers more than 100 fully backed tokenized U.S. stocks and ETFs, and the addition of VCXx marks its first move into tokenized access to a diversified private-tech portfolio. Fundrise CEO Ben Miller said, “We built VCX to act as a bridge between the public and private markets,” arguing that tokenizing the fund on xStocks lets “individual investors own a piece of the best private technology companies in the world” via a regulated structure.
The VCXx token will be issued by Backed Assets (JE) Limited and offered via Payward Digital Solutions, with trading set to go live on xStocks “in the coming days.” Fundrise and Kraken say VCXx will be fully backed by underlying VCX shares and designed to move seamlessly between centralized exchanges, self-custodied wallets, and onchain applications.
According to xStocks’ launch materials, VCXx will be purchasable using USDG — Kraken’s on-platform dollar-denominated token — or U.S. dollars, giving eligible investors outside the U.S. a way to gain exposure to VCX’s portfolio. That portfolio includes stakes in late-stage private firms such as SpaceX, OpenAI, Anthropic, and Databricks, bundling them into a single liquid, tokenized asset that can also be used as collateral or integrated into automated strategies.
Fundrise’s Innovation Fund was launched to open up late-stage private tech deals that are typically reserved for institutions and ultra‑high‑net‑worth investors. By bringing VCX onchain, xStocks and Fundrise are extending tokenized equities beyond public stocks into private-market exposure, a segment Kraken has called “one of the most sought‑after and historically inaccessible parts of the market.”
The partners argue that tokenizing VCX shares allows diversified private-tech exposure to be accessed, transferred, and integrated into DeFi with the same flexibility as other digital assets. If VCXx gains liquidity, it could become a template for how other listed vehicles and funds wrap private holdings into programmable, globally tradable tokens without dismantling existing regulatory structures.
The price of AAVE has dropped to a 52-week low, falling below $95 even as Aave rolled out its long-awaited V4 upgrade this week.
The decline extends a broader downtrend, with the token losing over a third of its value in the past year.
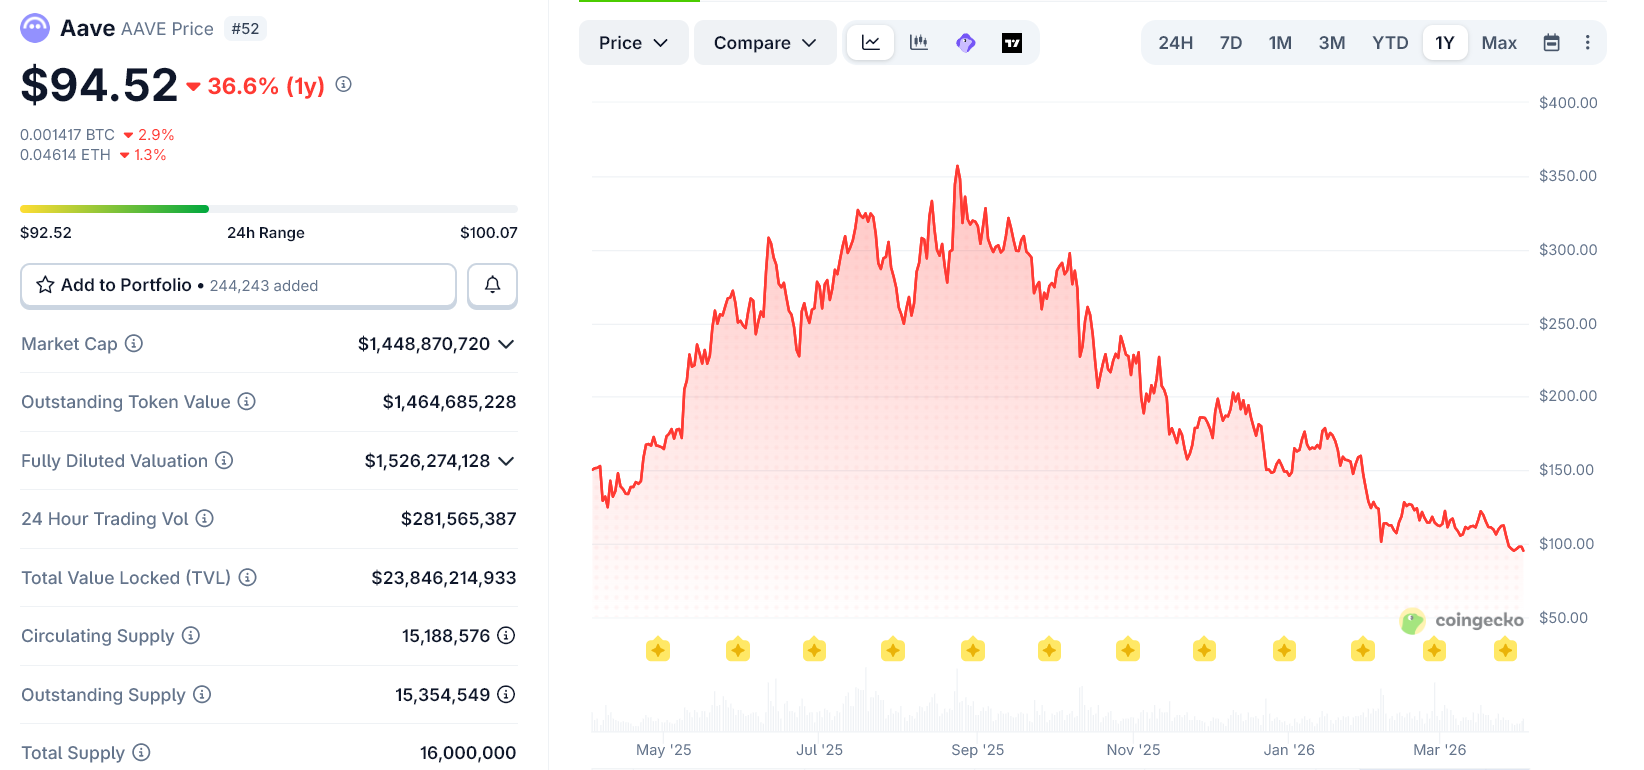
The timing stands out. Aave V4 is one of the protocol’s biggest upgrades to date. In simple terms, it turns Aave from a collection of separate lending pools into one large shared liquidity system.
That means users borrow from a bigger pool, get better rates, and use capital more efficiently. It also introduces smarter pricing, where safer collateral gets cheaper loans and riskier assets cost more to borrow.
The system is also easier to expand, allowing new products and markets to plug in faster.
However, the market has not responded. The drop suggests that fundamentals alone are not driving price action in crypto right now.
Traders are still reacting more to macro conditions, liquidity, and broader sentiment than to protocol upgrades.
In reality, V4’s impact is likely to play out slowly. It improves Aave’s utility, makes the platform more competitive, and strengthens its position as core DeFi infrastructure.
But that does not guarantee immediate demand for the token itself.
The disconnect is clear. Aave’s network is becoming more useful and advanced, while its token continues to trade like a macro-sensitive asset rather than a direct reflection of that progress.
The post AAVE Hits Yearly Low Despite Major V4 Upgrade Rollout appeared first on BeInCrypto.


Elliptic said Thursday the $285 million Drift Protocol exploit, the largest this year, carries “multiple indicators” of North Korea’s state-sponsored DPRK hacker group involvement.
The research firm pointed specifically to onchain behavior, laundering methodologies and network-level signals, all of which align with previous state-linked attacks.
Drift Protocol, whose token has dropped over 40% to roughly $0.06 since the hack, is the largest decentralized perpetual futures exchange on the Solana blockchain.
“If confirmed, this incident would represent the eighteenth DPRK act Elliptic has tracked this year, with over $300 million stolen so far,” the report said.
“It is a continuation of the DPRK’s sustained campaign of large-scale cryptoasset theft, which the U.S. government has linked to the funding of its weapons programs. DPRK-linked actors are believed to be responsible for billions of dollars in cryptoasset theft in recent years,” Elliptic added.
Hours earlier, Arkham data showed that over $250 million had been moved from Drift to an interim wallet, then to various other addresses.
In December, a Chainalysis report revealed DPRK hackers stole a record $2 billion of crypto in 2025, including the $1.4 billion Bybit breach, representing a 51% increase from the previous year. The U.S. Treasury Department last month said North Korea uses the stolen assets to fund the country’s weapons of mass destruction program.
Rather than focusing on the exploit itself, Elliptic’s analysis highlights a familiar operational pattern. The activity appears “premeditated and carefully staged,” with early test transactions and pre-positioned wallets preceding the main event.
The report explains that once executed, funds were rapidly consolidated and swapped, bridged across chains, and converted into more liquid assets, reflecting a structured, repeatable laundering flow designed to obscure origin while maintaining control.
A central challenge, Elliptic notes, is Solana’s account model. Because each asset is held in a separate token account, activity tied to a single actor can appear fragmented across multiple addresses. Without linking these, investigators risk seeing “fragments of the attacker’s activity, not the complete picture.”
This is where Elliptic’s report highlights the clustering approach, which connects token accounts back to a single entity, allowing exposure to be identified regardless of which address is screened. In an incident involving more than a dozen asset types, that entity-level view becomes critical.
The case also emphasizes, Elliptic adds in its report, how laundering has become inherently cross-chain. Funds moved from Solana to Ethereum and beyond, demonstrating the need for what Elliptic described as “holistic cross-chain tracing capabilities.”

TLDR
- Ethereum derivatives recorded more than $1 billion in sell volume within one hour after Trump’s speech on Iran.
- Ethereum’s price fell over 4% as traders increased short positions in the derivatives market.
- Binance accounted for nearly $968 million of the total Ethereum derivatives sell activity.
- The S&P 500 lost about $500 billion in market value shortly after the remarks.
- Spot Ethereum ETFs reported more than $7 million in net outflows on April 1.
Global financial markets reacted sharply after President Donald Trump outlined potential military action against Iran within weeks. Ethereum followed the broader risk-off move as traders rushed to exit positions. Data from CryptoQuant showed heavy selling in derivatives within a single hour.
Ethereum Derivatives Record $1B in Rapid Sell Orders
Crypto markets shifted quickly after Trump addressed the nation and detailed plans for continued strikes on Iran. He said Operation Epic Fury had weakened Iran’s military and reduced missile capabilities. He also warned that stronger attacks would continue over the next two to three weeks.
As a result, traders moved rapidly across risk assets and pushed US Treasury prices higher. At the same time, the S&P 500 erased about $500 billion in market value within minutes. Ethereum derivatives then recorded more than $1 billion in sell volume within one hour, according to CryptoQuant.
CryptoQuant reported that about $968 million of that sell volume occurred on Binance. Binance currently handles the largest share of global crypto trading activity. The surge in orders increased short-term bearish pressure across futures markets.
Consequently, Ethereum’s price fell more than 4% during the same period. The sharp movement reflected aggressive positioning in leveraged products. CryptoQuant stated that markets now face “a period of extreme uncertainty and volatility.”
The firm added that price action has become “increasingly erratic and unstable.” Traders reacted directly to geopolitical developments and shifting liquidity conditions. The derivatives spike marked one of the largest hourly sell waves this month.
ETF Outflows Add Pressure on Ethereum
Institutional flows also reflected weaker sentiment toward Ethereum products. Spot Ethereum ETFs posted eight consecutive days of net outflows before briefly reversing direction. During the following two sessions, these funds recorded short-lived inflows.
However, the rebound did not hold as outflows returned. On April 1, spot Ethereum ETFs registered more than $7 million in net withdrawals. The renewed selling aligned with rising geopolitical tension and reduced risk appetite.
Bitunix analysts described the current environment as a shift in market structure. They stated, “The market has entered a new phase dominated by ‘supply chain destruction.’” They added that energy, metals, and geopolitics now push inflation expectations higher without supporting growth.
The analysts said this dynamic creates a mismatch between risk pricing and economic support. They explained that asset prices now respond mainly to liquidity conditions. They also stated that markets lack a clear policy anchor or exit path from conflict.
Ethereum’s derivatives data and ETF flows both reflected mounting strain across trading venues. Traders reduced exposure as headlines intensified across global markets. The latest ETF outflow data on April 1 marked the most recent confirmed movement in institutional positioning.

Nancy Metayer Bowen: Husband charged with murder after Florida vice mayor found dead in home

Key Benefits for Collagen and Skin Repair

Trump Just Signaled Military Escalation Against Iran and Bitcoin Price Dropped 6% in Hours: Is $60,000 Next?

Smart energy pays enters the US market, targeting scalable financial infrastructure

Why Israel is blocking foreign journalists from entering

Bitcoin: We’re Entering The Most Dangerous Phase

XRP RIPPLE CEO CRYPTO LAW WILL PASS NOW! XRPL AI ALPHA DROP #crypto #xrp #cryptocurrency #bitcoin

Bitcoin PLUMMETS To $66K As David Sacks Steps Down & Coinbase Faces Backlash!

Battle of Bretton Woods , Ripple , XRP Price & The Scary Realty Of AI
-

 NewsBeat6 days ago
The Story hosts event on Durham’s historic registers
-

 Sports6 days ago
Sweet Sixteen Game Thread: Tide vs Michigan
-
Entertainment3 days ago
Fans slam 'heartbreaking' Barbie Dream Fest convention debacle with 'cardboard cutout' experience
-

 NewsBeat1 hour ago
Steven Gerrard disagrees with Gary Neville over ‘shock’ Chelsea and Arsenal claim | Football
-
 Entertainment5 days ago
Lana Del Rey Celebrates Her Husband’s 51st Birthday In New Post
-
Crypto World2 days ago
Dems press CFTC, ethics board on prediction-market insider trades
-

 Crypto World24 hours ago
Gold Price Prediction: Worst Month in 17 Years fo Save Haven Rock
-

 Sports2 days ago
Tallest college basketball player ever, standing at 7-foot-9, entering transfer portal
-

 Tech4 days ago
The Pixel 10a doesn’t have a camera bump, and it’s great
-

 Tech2 days ago
EE TV is using AI to help you find something to watch
-

 Fashion5 days ago
Amazon Sundays: Soft Spring Layers
-

 Tech3 days ago
Apple will hide your email address from apps and websites, but not cops
-

 Politics3 days ago
Should Trump Be Scared Strait?
-

 Tech2 days ago
How to back up your iPhone & iPad to your Mac before something goes wrong
-

 Crypto World3 days ago
U.S. rule change may open trillions in 401(k) funds to crypto
-

 Tech3 days ago
Flipsnack and the shift toward motion-first business content with living visuals
-

 Business7 days ago
Chinese universities with military links bought Super Micro servers with restricted AI chips
-

 Fashion6 days ago
Weekly News Update, 3.27.26 – Corporette.com
-

 Tech4 days ago
Elon Musk’s last co-founder reportedly leaves xAI
-
Crypto World4 days ago
Bitcoin’s Six-Month Losing Streak: What On-Chain Data Says About the Market’s Next Move
You must be logged in to post a comment Login