
Crypto World
Nevada cleared to pursue restraining order against Kalshi


Nevada state authorities have been cleared to issue a temporary restraining order against prediction market platform Kalshi.
Summary
- A federal appeals court denied Kalshi’s request to halt proceedings, clearing the way for Nevada regulators to pursue a temporary restraining order against the platform.
- Industry experts say Kalshi may be forced to exit Nevada for at least 14 days if the order is issued, as such rulings are not appealable under state law.
On Thursday, the Ninth Circuit Appeals Court denied Kalshi’s emergency request to stay proceedings. The case will now be sent back to federal court, where Nevada regulators can proceed with enforcement action.
According to Gaming lawyer Daniel Wallach, this would likely result in a temporary restraining order and noted that Kalshi would not be able to operate in the state for at least 14 days, as the order is “not appealable under Nevada law.”
“Kalshi would be required to exit the state in the interim,” he added.
The case stems from a cease and desist issued against the platform in March, where regulators claimed that the platform offered unlicensed sports betting under the state’s gaming laws.
Kalshi, in the meantime, has countered these claims, arguing that its contracts fall under the federal jurisdiction of the Commodity Futures Trading Commission, which means any restriction imposed by the state would conflict with federal oversight and would also cause its business imminent harm.
Similar actions have emerged across a number of other U.S. states, with lawmakers claiming that sports event contracts may violate local gambling laws. States like Connecticut, New York, and New Jersey have taken steps against sports event contracts that have targeted Kalshi and many of its competitors, like Polymarket and Crypto.com.
Meanwhile, the U.S. Commodity Futures Trading Commission chairman, Michael Selig, has said that the commission will establish a federal rulebook for prediction markets while asserting exclusive jurisdiction over such products.
Prediction markets like Kalshi and Polymarket have recently surged in activity, with weekly trading volumes exceeding $2 billion. As previously reported by crypto.news, ultra-short duration contracts have become increasingly popular, with five to 15-minute bets now accounting for a significant share of trading on these platforms.

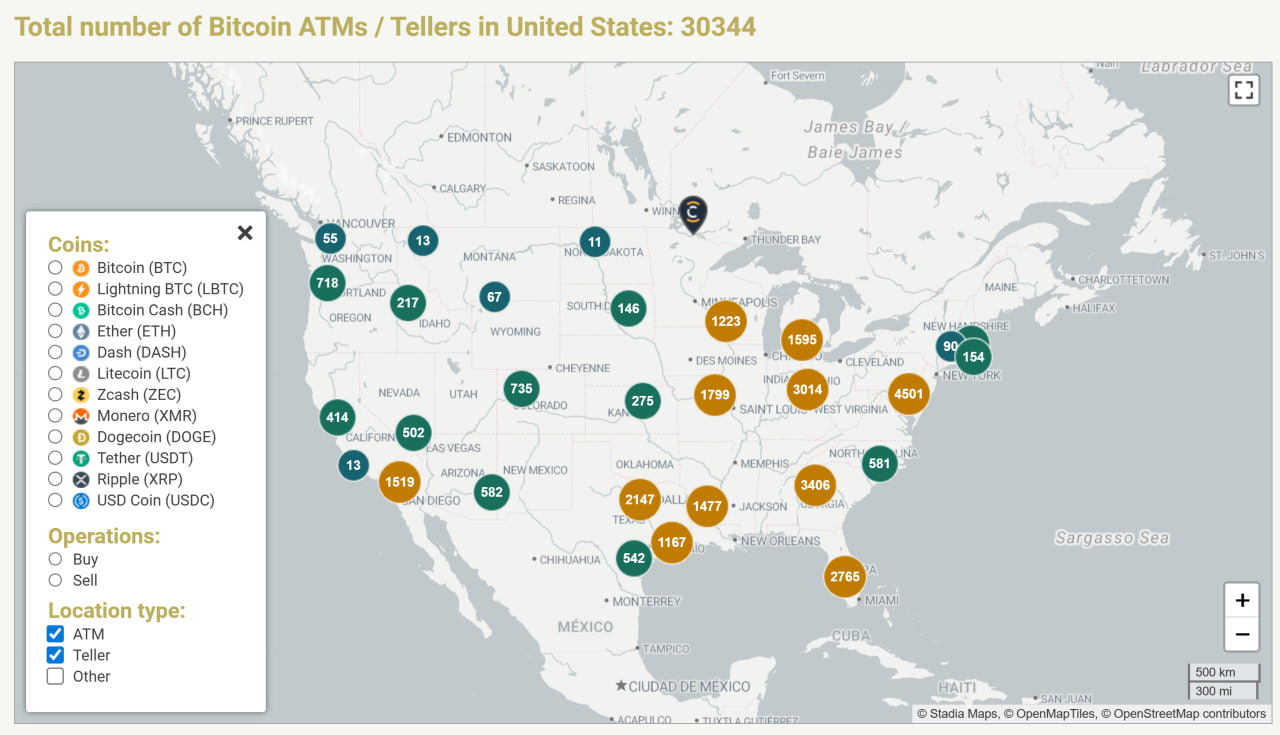
Crypto ATM operator Bitcoin Depot revealed that it lost about 50.9 Bitcoin, worth roughly $3.7 million, after a hacker gained access to some of its internal systems.
The breach happened on March 23 after the attacker took control of credentials linked to Bitcoin Depot’s corporate Bitcoin (BTC) wallets, according to a Monday filing with the US Securities and Exchange Commission. The company said that customer accounts, platforms and personal data were not affected.
Bitcoin Depot added that the attack has not had a major impact on daily operations, and said it has insurance that may cover some of the losses. “As the investigation of the incident is ongoing, the full scope, nature and impact of the incident are not yet completely known,” the filing states.
Shares of Bitcoin Depot jumped sharply on Wednesday, closing at $2.74, up $0.37 or 15.61% on the day, with additional gains in pre-market trading pushing the price to $2.90, a further 5.84% increase, according to data by Yahoo! Finance.
Related: Bitcoin Depot enters Hong Kong as part of Asia expansion
Bitcoin Depot under pressure
Bitcoin Depot has been facing growing legal and regulatory pressure across several US states. The company recently had its money transmission license suspended in Connecticut, along with a temporary cease-and-desist order, with regulators citing violations such as high fees and failure to fully refund scam victims.
The company has also faced a lawsuit from Massachusetts alleging overcharging and facilitating scams, and paid $1.9 million in Maine to compensate affected users.

In June 2024, Bitcoin Depot also experienced a data breach that exposed the personal information of 26,732 customers. The breach was linked to an external system, and authorities cleared the company to issue notifications only after the probe concluded in June 2025.
Related: Australia’s financial watchdog may gain power to ban crypto ATMs
US cities move to ban crypto ATMs
US cities are increasing pressure on crypto ATMs as concerns over fraud grow. Stillwater, Minnesota, has banned crypto ATMs after residents lost large sums to scams, while Spokane, Washington, introduced a citywide ban in June, calling the kiosks a “preferred tool for scammers” following a spike in fraud cases.
Haverhill, Massachusetts, is also considering banning crypto ATMs, with a proposed ordinance citing fraud and money laundering risks that would require all machines to be removed within 60 days if approved.
Magazine: Bitcoin may take 7 years to upgrade to post-quantum — BIP-360 co-author


Banks are approaching stablecoins cautiously despite rapid market growth, reflecting early-stage strategy and rising structural concerns, according to a report by S&P Global Market Intelligence.
According to the Wednesday report, the question is no longer whether stablecoins will endure, but how they will reshape business models, infrastructure and revenue, For banks, the trade-offs are sharp, spanning deposit risk, modernization costs and new competition.
A wait-and-see stance still dominates. S&P Global’s Q1 2026 U.S. Bank Outlook survey found just 7% of 100 mostly smaller institutions are developing frameworks, with none actively piloting, underscoring how exploratory strategies remain.
“Most financial institutions remain early and cautious,” said Jordan McKee, director of fintech research at S&P Global Market Intelligence, in emailed comments. “Our survey of U.S. banks shows that stablecoin strategy is still largely exploratory, with limited internal development and no active pilots among smaller institutions.”
Stablecoins, digital tokens pegged to assets like fiat currencies or commodities, have become a core layer for payments and settlement in crypto, widely used in trading and cross-border flows. The market is dominated by Tether’s USDT, followed by Circle Internet’s (CRCL) USDC.
The stablecoin market has grown rapidly into a roughly $300 billion-plus sector, with total market capitalization surpassing $316 billion in early 2026 after nearly doubling since 2023, according to multiple data sources.
Transaction volumes have also surged into the tens of trillions annually, underscoring rising use in trading, payments and cross-border transfers, while forecasts point to continued expansion, potentially reaching $500 billion or more in the near term as institutional adoption accelerates.
Pressure is building. The report pointed to growing concern over deposit cannibalization and customer migration, alongside a surge in stablecoin mentions on earnings calls following the GENIUS Act’s passage in July 2025.
Competition is also intensifying. S&P Global highlighted a wave of nonbanks pursuing charters to house stablecoin issuance, custody and settlement within regulated entities, positioning themselves as credible alternatives.
Banks are also wary of yield-like incentives in stablecoin ecosystems that could compete with deposits, even as direct interest payments remain restricted.
Responses will diverge. S&P Global analysts expect large, global banks to explore issuing tokenized deposits or bank-backed digital assets, while regional and midsize lenders focus on facilitating access via fiat on- and off-ramps. Regardless of strategy, banks will remain key gateways between fiat and stablecoin networks, but doing so will require significant upgrades to legacy systems ill-suited for real-time digital asset activity.
Cross-border banks face the strongest push to modernize as payments shift to multi-rail systems combining traditional, real-time and tokenized networks. Interoperability and wallet infrastructure will be critical, with large banks building multi-network connectivity and smaller firms leaning on fintech partners. Secure custody and embedded compliance are expected to become standard, the report added.
Read more: Stablecoin rewards restrictions can slow but not stop Circle’s USDC, says Citigroup

BitMEX has released its Q1 2026 derivatives report, highlighting a sharp rise in trading activity for traditional finance perpetual swaps (TradFi Perps), driven by increased demand for tokenised commodities and equities.
According to the report, TradFi perpetual swaps grew from 0.03% of total crypto derivatives volume in December 2025 to 1.72% by the end of Q1 2026, reaching $30.7 billion in weekly trading volume. This expansion was supported by new product launches across prominent exchanges and macroeconomic events, including increased volatility in commodities markets.
“Q1 marked a clear inflection point for TradFi perpetuals, with volume growth driven by real market demand for 24/7 access to commodities and equities,” said Stephan Lutz, CEO at BitMEX. “What we’re seeing is the early formation of a structurally different market, one that removes the constraints of traditional trading hours and introduces new forms of price discovery and liquidity.”
BitMEX has introduced a range of TradFi perpetual products as part of this shift, expanding its derivatives offering to provide continuous access to commodities and equity markets.
The report identifies commodities as the primary growth driver, with trading volume increasing more than 65,000% during the quarter. Precious metals such as silver and gold led early momentum, while crude oil trading accelerated in March amid geopolitical tensions, reaching $6.9 billion in weekly volume.
Equity perpetuals also saw significant growth, rising more than 900% to $4.9 billion in weekly volume. Activity was concentrated in crypto-adjacent equities and major technology stocks, reflecting continued convergence between digital asset markets and traditional finance instruments.
The report further notes structural differences between perpetual swaps and traditional Contracts for Difference (CFD), particularly in areas such as transparent price discovery, peer-to-peer execution, and continuous market access.
Unlike CFD-based models offered by some platforms, these products enable direct market participation, with pricing determined by underlying market dynamics rather than broker-led mechanisms. These characteristics have contributed to increased participation from both retail and professional traders.
Market expansion was also shaped by exchange-level developments. BitMEX recorded more than 1,300% growth over the 90-day period while Binance captured a significant share of new volume following its entry into the category.
In addition, funding rate disparities across exchanges created arbitrage opportunities. The report highlights cases where traders could capture yield through cross-exchange positioning, with some spreads exceeding 100% annualised returns under specific conditions.
Looking ahead, BitMEX expects continued growth in TradFi perpetual markets, supported by broader asset listings across Forex, commodities, and more, increasing institutional awareness, and ongoing demand for 24/7 trading access. The report suggests that weekly trading volumes could approach $100 billion as additional asset classes enter the market.
The full report can be found on BitMEX’s blog.
About BitMEX
BitMEX is the OG crypto derivatives exchange, providing professional crypto traders with a platform that caters to their needs with low latency, deep crypto native and especially BTC liquidity, and unmatched reliability.
Since its founding, no cryptocurrency has been lost through intrusion or hacking, allowing BitMEX users to trade with confidence that their funds are secure and that they have access to the products and tools required to be profitable.
The post BitMEX Report Finds 500%+ Increase in Tokenised Commodities and Equity Perpetuals appeared first on BeInCrypto.
BitMEX co-founder Arthur Hayes has publicly challenged reports that Iran is collecting Bitcoin (BTC) tolls from oil tankers transiting the Strait of Hormuz.
His skepticism echoes a growing chorus of crypto voices questioning whether Tehran’s crypto toll demands have any on-chain substance behind them.
Iran’s Crypto Toll Demand Meets Blockchain Skepticism
The controversy stems from a report on Bitcoin tolls at the Strait of Hormuz. According to Hamid Hosseini, spokesperson for Iran’s Oil, Gas and Petrochemical Products Exporters’ Union, laden tankers must email cargo details to Iranian authorities.
They then receive a toll assessment of roughly $1 per barrel of oil on board.
Payments must be made in cryptocurrency or Chinese yuan. BTC was explicitly cited as an accepted option. Fully loaded supertankers could face fees of up to $2 million, roughly 281 BTC at recent prices.
The payment window is reportedly just seconds long, designed to make funds difficult to trace or seize under Western sanctions.
The Islamic Revolutionary Guard Corps (IRGC) enforces compliance, with non-compliant vessels risking denial of passage.
Hayes responded on X with a pointed challenge.
“I’ll believe Iran is charging a toll in $BTC when I see a tx linked to a vessel’s toll payment. Otherwise, it’s just the IRGC trolling the western filthy fiat financial system,” Hayes challenged in a post.
Strait Remains Blocked as Doubts Mount
Despite a two-week US-Iran ceasefire, shipping data shows minimal tanker traffic. According to reports citing intelligence firm Kpler, no oil or gas tankers have passed through since the ceasefire took effect.
Hundreds of vessels remain waiting, and the waterway that normally handles roughly 135 ships per day remains largely restricted.
Earlier Bloomberg reporting indicated some vessels had paid tolls in yuan or stablecoins like Tether (USDT) for IRGC-escorted passage before the ceasefire.
However, no BTC-specific payments have been verified on-chain.
Other renowned accounts amplify the skepticism, citing “geopolitical shitposting” as the reason the story transcends BTC-only to any crypto or yuan within minutes.
Meanwhile, a Mossad-linked commentary account raised an additional wrinkle. It claimed Iran listed the Trump-linked USD1 token as an accepted payment method, framing the move as a potential geopolitical provocation.
What Comes Next
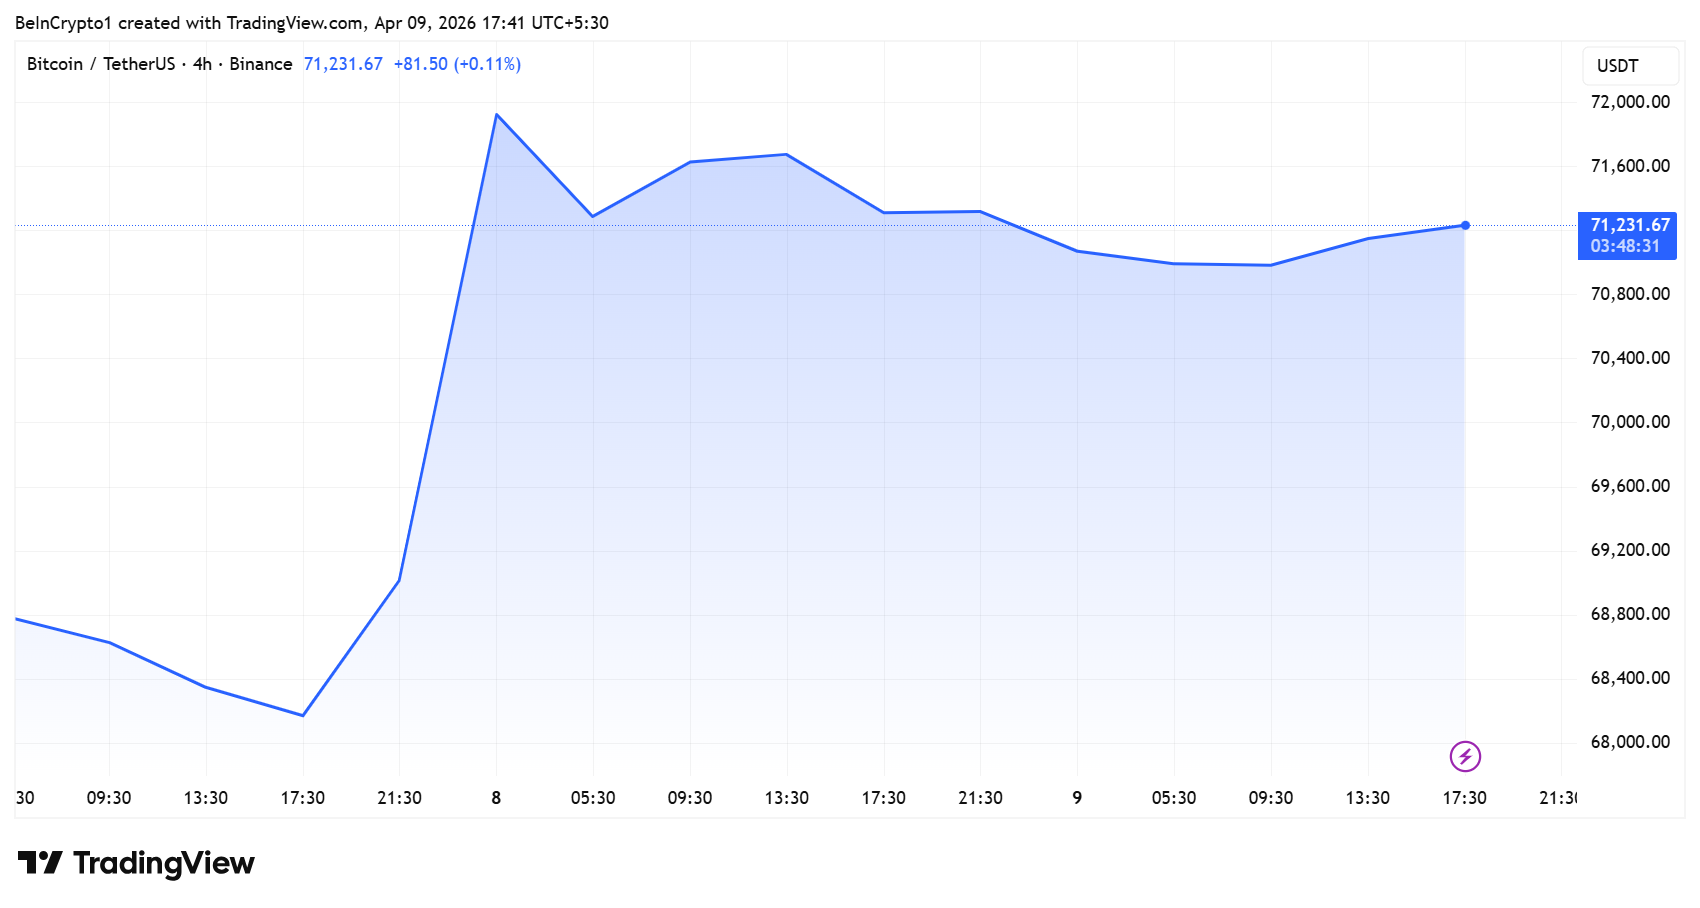
BTC surged roughly 5% on the initial reports, signaling that markets treated the news as a bullish adoption signal.
Yet the EU has publicly stated that freedom of navigation must be ensured without any payment or toll.
If a verifiable on-chain transaction surfaces linking BTC to a specific vessel’s toll, it would represent one of the largest real-world sovereign uses of Bitcoin for energy-related payments.
Until that proof appears, Hayes and much of the crypto community remain unconvinced.
The post Arthur Hayes Calls Iran’s Bluff: Show Me the Bitcoin or It’s Just IRGC Theater appeared first on BeInCrypto.


Bitcoin Depot Inc. reportedly failed to spot a data breach that resulted in the loss of over 50 bitcoins (BTC) worth $3.7 million for three days.
The BTC ATM operator disclosed the loss of 50.9 BTC in an SEC filing earlier this week, stating that the attacker gained access to its IT systems and its digital asset settlement accounts on March 23.
This, it says, allowed them to move the BTC from company-controlled wallets.
However, according to subsequent research from onchain sleuth ZachXBT, the breach actually occurred three days earlier on March 20.
“On April 6, 2026 Bitcoin Depot disclosed in an SEC 8K filing it uncovered an incident on March 23, 2026 which resulted in 50.9 BTC ($3.6M) stolen,” wrote Zach on Telegram.
“However the report did not include theft addresses so I manually traced out the incident onchain and found 19 high confidence theft addresses from March 20.
“This means it took three days for Bitcoin Depot to notice the funds were missing from its business.”
Read more: Inside the $280M Drift hack: weeks of setup, minutes to drain
Zach continued, “A delta of 3.55 BTC (54.45 BTC total) vs 50.9 BTC reported was found indicating other employee personal accounts may have also been impacted.
“54 BTC ($3.7M) flowed to KuCoin, a crypto exchange increasingly used by illicit actors.
“At the time of my post the theft addresses still have not been reported in any compliance tools I use.”
According to the SEC filing, Bitcoin Depot is continuing to investigate the nature and scope of the incident with the assistance of unnamed “third-party specialists.”
It also says it’s “working with its outside cybersecurity experts to further reinforce its information technology systems and to prevent future unauthorized access.”
It also reassures users that no customer personally identifiable information was accessed, but does add that the “investigation remains ongoing.”
Got a tip? Send us an email securely via Protos Leaks. For more informed news and investigations, follow us on X, Bluesky, and Google News, or subscribe to our YouTube channel.

Canary Capital has filed registration with the SEC for a Pepe ETF, marking what appears to be the first attempt to create and ETF for the “blue-chip” memecoin in the U.S.
Canary Capital filed a registration with the U.S. Securities and Exchange Commission for what appears to be the first U.S. spot Pepe ETF on Wednesday, April 8, 2026. The filing represents a formal submission to the SEC for a potential exchange-traded product tied to the Pepe memecoin.
The move comes amid growing institutional interest in cryptocurrency-based ETF products. If approved, the ETF would provide regulated exposure to Pepe, the fourth-largest memecoin by market capitalization.
Sources: SEC
This article was generated automatically by The Defiant’s AI news system from publicly available sources.


CoreWeave (CRWV) and Meta (META) have broadened their existing partnership, originally valued at up to $14.2 billion, with a new agreement worth around $21 billion.
As part of the deal, CoreWeave will supply dedicated cloud capacity to Meta through 2032, helping power the development and rollout of its AI technologies.
The infrastructure will span multiple locations and feature early deployments of NVIDIA’s (NVDA) Vera Rubin platform, aimed at boosting efficiency, reliability, and scale.
The NVIDIA Vera Rubin platform is the next-generation AI supercomputing architecture is expected to mark a massive shift from simple “Generative AI” to “Agentic AI,” whereby AI becomes more proactive in executing steps towards its goals rather than relying on human prompts.
A key focus of the CoreWeave-Meta agreement is inference, reflecting the industry’s shift toward running AI systems continuously rather than just training them.
“This is another example that leading companies are choosing CoreWeave’s AI cloud to run their most demanding workloads,” said CEO Michael Intrator.
The deal signals that large tech companies are increasingly securing long-term compute resources to support AI-driven services. Shares of CoreWeave rose 3% in pre-market trading on Thursday.
Read More: Mark Zuckerberg’s Meta is planning stablecoin comeback in the second half of this year


Meta Platforms is stepping up its presence in the fast-moving social commerce space, introducing new tools that connect creators, artificial intelligence, and advertising more closely to actual purchases, particularly across Instagram and Reels.
Summary
- Meta Platforms is rolling out new tools that let brands turn Instagram Reels into shoppable content by linking product catalogs with creators.
- The company is expanding AI-driven ad tools, including automated video creation and product optimisation, improving conversions and lowering acquisition costs.
- Meta is also preparing new AI models, including Muse Spark, as it scales its ecosystem across WhatsApp, Facebook, and Instagram to stay competitive.
The latest rollout signals a shift from passive product discovery toward a system where engagement can translate more directly into measurable sales outcomes.
A key part of the strategy centres on expanding the role of creators in the shopping journey. Businesses across 22 countries, including India, will soon be able to share product catalogues with creators, enabling them to tag and link items directly within Reels content. The change effectively turns creator posts into shoppable storefronts, narrowing the gap between entertainment and commerce.
Meta said its creator marketplace now includes more than 1.5 million discoverable creators. New filters within Ads Manager allow brands to identify suitable partners with more precision, improving campaign alignment.
“This makes it easier than ever for businesses to quickly identify creators who are a good match for their goals and likely to perform well in their partnership ads campaigns,” the company said.
“Partnership Ads has moved influencer marketing from a brand-building line item to a marketing channel tied to outcomes,” said Vikas Chawla, pointing to the growing ability to measure creator-led performance.
Meta is also increasing its focus on Reels as a space where users are more likely to engage with ads. The company has expanded its “Reels Trending Ads” into categories such as business, finance, travel, and entertainment, placing brands alongside content that is already drawing strong engagement.
“We’re now part of conversations consumers are already having… the performance uplift has been hard to ignore,” said Sadhvi Dhawan.
At the same time, artificial intelligence is becoming a central component of Meta’s commerce stack alongside creators.
The company is extending its Advantage+ suite with generative AI tools that automate video production, voiceovers, and translations. These tools are designed to lower the effort needed to produce localised, high-volume ad creatives.
Meta is also testing a feature called “product set optimisation,” which allows advertisers to prioritise specific products within larger catalogues. Early results show a 17% drop in cost per purchase for promoted items.
Automated catalog video tools are also gaining traction. These tools convert static listings into video ads and are delivering up to 20% more conversions per dollar, further improving campaign efficiency.
Meta prepares new AI models as competition intensifies
Alongside its commerce push, Meta is advancing its artificial intelligence roadmap with plans to release its first models developed under Alexandr Wang. Some versions are expected to be offered under an open-source license.
Meta has long stood out among major U.S. tech firms for allowing developers to modify its frontier models. However, rising competition in AI is prompting questions over whether that level of openness will continue.
The company continues to emphasise its distribution advantage. By embedding AI tools across platforms such as WhatsApp, Facebook, and Instagram, Meta can reach billions of users globally, often without direct cost. That scale remains difficult for rivals to match and forms a key part of its strategy to close the gap with competitors.
Meta has also introduced Muse Spark, its first model from the Meta Superintelligence Labs unit. The system is positioned as a step toward “personal superintelligence” capable of reasoning, using tools, and coordinating multiple agents on behalf of users.
A core feature of Muse Spark is its “Contemplating” mode, which runs several agents in parallel before producing a response. Meta describes it as an answer to advanced reasoning systems such as those seen in models like Gemini Deep Think and GPT Pro.
The company’s push into AI has also involved internal restructuring. Reports indicate that Meta has cut hundreds of roles as it redirects resources toward priority engineering projects tied to its AI ambitions.
A chart tracking the top 15 cryptocurrencies by market cap every year since 2018 shows a clear pattern. Bitcoin never moves from the number one position.
Most altcoins that once competed for top rankings have either fallen sharply or disappeared entirely.
Bitcoin Holds Number One Across Every Cycle
Bitcoin maintains the top position every single year from 2018 to 2026. The crypto market goes through multiple bear markets, regulatory crackdowns in major economies, and waves of new competitors during this period.
Bitcoin’s ranking does not change. It remains at number one while the rest of the top 15 reshuffles around it.

Ethereum and XRP: The Only Cryptos That Keep Up
Ethereum has held second place consistently since 2018, maintaining its position as the dominant smart contract platform. No competitor manages to overtake it despite years of challengers entering the market.
XRP shows more volatility but never drops out of the top 10. It moves from second place in 2018 to third in 2026, surviving a multi-year SEC lawsuit that would have ended most projects. Out of the original 20 cryptos tracked in 2018, only Bitcoin, Ethereum, and XRP maintain top positions.
The Cryptos That Vanished and the Newcomers That Replaced Them
Half of the cryptos that appeared in the 2018 top 15 have completely disappeared from the top 20 by 2026. IOTA, NEM, Dash, NEO, Qtum, EOS, Bitcoin Gold, Nano, Verge, and Ethereum Classic were once considered serious projects. Investors debated which one would become the next
Ethereum. EOS raised $4 billion in its ICO. Dash was marketed as digital cash for the world. Today, none of them rank among the top 20.
The replacements show an equally notable shift. Solana climbs from obscurity to the top five. Dogecoin, created as a joke, now sits in the top ten. Hyperliquid did not even exist in 2018 and now competes with decade-old names.
Higher Means Stable, Lower Means Volatile
The chart shows a pattern: the higher the ranking, the more stable the position. Bitcoin at number one never moves. Ethereum at number two barely shifts. XRP fluctuates within the top 10 but stays there.
Below the top 10, the volatility increases. Projects jump ten positions up or drop out of the rankings entirely within a single cycle. Most of the 2018 top 15 that vanished came from positions six through fifteen.
What This Means for Crypto Rankings
The chart illustrates the volatility that defines crypto beyond price swings. Rankings shift. Projects that dominate one cycle can disappear in the next. Market cap positions that seem secure can evaporate within a few years.
The data covers eight years. In that time, only three cryptos maintain their top positions. Ten disappear from the top 20 entirely. The rest drop but survive somewhere lower in the rankings. For a market often described as high-risk, the data shows where that risk plays out: not just in price, but in relevance.
The post Bitcoin Stays on Top for 8 Years: Most Cryptos Vanished appeared first on BeInCrypto.

A Seoul Administrative Court has overturned the Financial Intelligence Unit’s three-month partial suspension of Dunamu, the operator of Upbit, in a ruling that reframes how AML rules are applied to crypto exchanges in Korea. The decision, reported by Yonhap News Agency, sides with Dunamu’s challenge to the regulator’s February 2025 sanction, which had blocked new Upbit user transfers for a period of three months.
The court’s reasoning centers on regulatory clarity. It noted that explicit guidelines exist for transfers above 1 million won (roughly $675), but regulations governing smaller transfers were not sufficiently specific to underpin the enforcement action. In essence, the ruling challenges the FIU’s ability to impose major AML sanctions when the underlying compliance standards aren’t clearly spelled out in practice.
Key takeaways
- The Seoul Administrative Court overturned the FIU’s three-month partial suspension on Dunamu, affirming Dunamu’s challenge to the regulator’s AML sanction.
- The court found that while large transfers have clear regulatory expectations, smaller transfers lacked precise guidance, weakening the basis for the enforcement action.
- The ruling narrows the FIU’s leverage to sanction crypto exchanges when the applicable AML standards are not explicitly defined, potentially affecting how similar cases are pursued in the future.
- Dunamu had argued that it had already taken proactive steps to address AML concerns, and the court accepted that there was no clear evidence of intent or gross negligence on the part of Upbit’s operator.
- The decision follows a sustained dispute that began after the FIU’s sanction and a court-granted injunction in March 2025 allowing Upbit to continue onboarding while the case was reviewed.
What the ruling changes about AML enforcement for exchanges
At the heart of the case is a tension between regulatory expectations and the practical, day-to-day controls required of digital-asset platforms. The FIU had argued that Dunamu facilitated transactions with unregistered overseas virtual asset service providers (VASPs) and failed to meet customer due diligence standards. It also cited a broader review that flagged hundreds of thousands of suspected KYC violations during Upbit’s license assessment. In response, Dunamu pursued legal relief, arguing that the sanctions lacked a precise, enforceable standard for the actions expected from exchanges.
The court’s decision emphasizes that enforcement actions must be grounded in clearly articulated requirements. When the rulebook is not explicit for certain transaction sizes, penalizing operators on those grounds becomes problematic. The ruling thus narrows the FIU’s capacity to wield large-scale AML penalties in cases where the applicable guidance isn’t demonstrably specific, potentially prompting regulators to refine or clarify AML expectations for smaller transfers going forward.
Regulatory and market implications for Korea’s crypto sector
The judgment arrives at a moment when Korea’s crypto industry has been navigating a tightening but opaque regulatory environment. While the FIU has shown a willingness to sanction exchanges for AML lapses, this ruling signals that the regulator may need to anchor its actions in clearly defined, widely understood standards—especially for lower-value transfers that constitute a substantial portion of daily exchange activity.
For investors and market participants, the decision offers a measure of judicial oversight over AML enforcement, potentially reducing the risk of abrupt, wide-sweeping sanctions when guidance is ambiguous. It also accentuates the importance for exchanges to maintain proactive, transparent compliance programs that can stand up to scrutiny even if regulatory guidance is not perfectly explicit on every transfer tier.
Observers will be watching whether the FIU updates its guidelines in response to the ruling or appeals the decision. The core issue is whether regulators can consistently apply penalties without accessible, precise standards to govern smaller-scale transfers. The court’s stance suggests a preference for clearly defined rules over broad, punitive actions in the AML domain, at least in cases where evidence of intent or gross negligence is not strong.
Operational impact on Upbit and user onboarding
The February 2025 sanction had blocked new Upbit users from transferring digital assets as part of a broader AML crackdown. After Dunamu filed suit, the court granted an injunction on March 27, 2025, permitting Upbit to continue onboarding while the case proceeded. With the new ruling overturning the sanction, Upbit’s operations are positioned to return to prior norms, subject to ongoing regulatory oversight and any further developments in the case or in FIU guidance.
For Upbit users and the broader market, this outcome matters beyond a single court ruling. It underscores the delicate balance between enforcing AML standards and ensuring that legitimate trading platforms can operate without prolonged, legally uncertain suspensions. In the near term, exchanges may respond by accelerating internal reviews and tightening KYC and due-diligence workflows to align with any forthcoming clarifications from regulators.
What comes next
The ruling sets a precedent that could influence future regulatory actions against crypto exchanges in Korea. If the FIU chooses to appeal or to issue updated guidelines, the framework for AML enforcement could become clearer, reducing ambiguity around what constitutes compliance for both large and smaller transfers. Market participants should monitor whether the FIU issues new guidance on cross-border transactions, VASP registrations, and customer due diligence, and whether further cases test the boundaries of enforcement against exchanges with robust internal controls but evolving regulatory interpretations.
In the longer term, the case highlights a broader dynamic in crypto regulation: the push for concrete, actionable standards that guide both enforcement and compliance. For operators, clarity reduces legal risk and helps stabilize onboarding and transaction flows. For users, it signals a potential path toward more predictable compliance practices and smoother access to crypto services, provided the regulatory framework continues to evolve with clear, well-publicized guidelines.
Readers should watch for any FIU statements or guideline updates that clarify expectations for smaller-value transfers and cross-border activity, as well as any subsequent court actions tied to this dispute.

Bitcoin Depot Reports $3.7M Loss after Breach of Corporate Wallets

Offset Faces Lawsuit Over $100K Casino Debt Drama
Northern Irish passport holder shows reality of new EES system at popular Spanish spot

Why Israel is blocking foreign journalists from entering

Bitcoin: We’re Entering The Most Dangerous Phase

Alan Cumming Brands Baftas Ceremony A ‘Triggering S**tshow’

Which 2 would you pick? #finance #investmenttips #investmentadvice #investmentforbeginners #trader

google pay pocket money kya hai | how to use google pay pocket money | gpay pocket money new update

WARNING: Bitcoin is 11 Days Away from a MASSIVE Move! (ETH, XRP, SOL, AVAX)
-

 NewsBeat7 days ago
Steven Gerrard disagrees with Gary Neville over ‘shock’ Chelsea and Arsenal claim | Football
-

 Business7 days ago
No Jackpot Winner and $194 Million Prize Rolls Over
-

 Fashion6 days ago
Weekend Open Thread: Spanx – Corporette.com
-

 Business5 days ago
Expert Picks for Every Need
-

 Business4 days ago
Three Gulf funds agree to back Paramount’s $81 billion takeover of Warner, WSJ reports
-

 Sports5 days ago
India men’s 4x400m and mixed 4x100m relay teams register big progress | Other Sports News
-

 Tech2 days ago
How Long Can You Drive With Expired Registration? What Florida Law Says
-
Business4 days ago
No Jackpot Winner, Prize to Climb to $231 Million
-

 Fashion3 days ago
Massimo Dutti Offers Inspiration for Your Summer Mood Board
-

 Fashion2 days ago
Let’s Discuss: DEI in 2026
-

 Tech7 days ago
Commonwealth Fusion Systems leans on magnets for near-term revenue
-
Politics6 days ago
Wings Over Scotland | The quality of mercy
-

 Business5 days ago
Akebia Therapeutics, Inc. (AKBA) Discusses Pipeline Progress and Strategic Focus on Kidney Disease Treatments at R&D Day – Slideshow
-

 Fashion7 days ago
Statement Sunglasses: The Accessory Shaping Modern Fashion
-

 Crypto World23 hours ago
Bitcoin recovers as US and Iran Agree a Ceasefire Deal
-

 Politics6 days ago
East Jerusalem Palestinian families eviction orders
-

 Sports7 days ago
Which German players will make final cut?
-

 Fashion7 days ago
For Love & Lemons’ Spring 2026 Line is for the Romantics
-

 Politics6 days ago
Why so many children are now classified as ‘disabled’
-

 Fashion7 days ago
Coffee Break: Santa Croce Tote
You must be logged in to post a comment Login