

Crypto World
Novogratz Appears in Court Over Failed BitGo Deal: Report

Galaxy Digital founder Mike Novogratz appeared in court on Tuesday to face off against BitGo CEO Mike Belshe in a long-running legal fight over a failed proposed $1.2 billion merger in 2021.
The planned deal was the largest-ever crypto merger at the time, set to create a massive conglomerate offering a suite of services at a time when investor interest in crypto was high.
Galaxy called off the deal in August 2022 as the crypto market was reeling from the collapse of the Terra ecosystem. BitGo has asked Galaxy to pay a $100 million fee for pulling out of the deal and also hid it was being probed by US authorities, while Galaxy has claimed BitGo failed to provide financial information on time.
According to Bloomberg, Novogratz testified in Delaware Chancery Court on Tuesday that he was “pushing to get this deal done,” but Galaxy and BitGo realized regulatory approval for the merger was unlikely because the Securities and Exchange Commission, then headed by Gary Gensler, made it “very difficult.”

Mike Novogratz, pictured in 2018 at a conference in Hong Kong, has appeared in court over a failed merger with BitGo. Source: RISE
He also said Galaxy was not the subject of the probe and it would not have affected the merger, while BitGo did not provide the needed financial information in time, forfeiting its right to a $100 million termination fee.
Related: On-Chain, In Court: What happened in crypto legal news this week
BitGo bargained for the termination fee, including a deadline to hand over financial statements, but that was complicated by the SEC’s accounting rules requiring companies to record customer crypto holdings as liabilities.
“This was incredibly damaging,” Belshe testified on Monday, claiming that BitGo had provided all the needed information. “Galaxy is telling the world we can’t pass an audit.”
The trial is set to end this week, and a judge will decide whether BitGo should receive the $100 million fee.
Magazine: Guide to the top and emerging global crypto hubs: Mid-2026

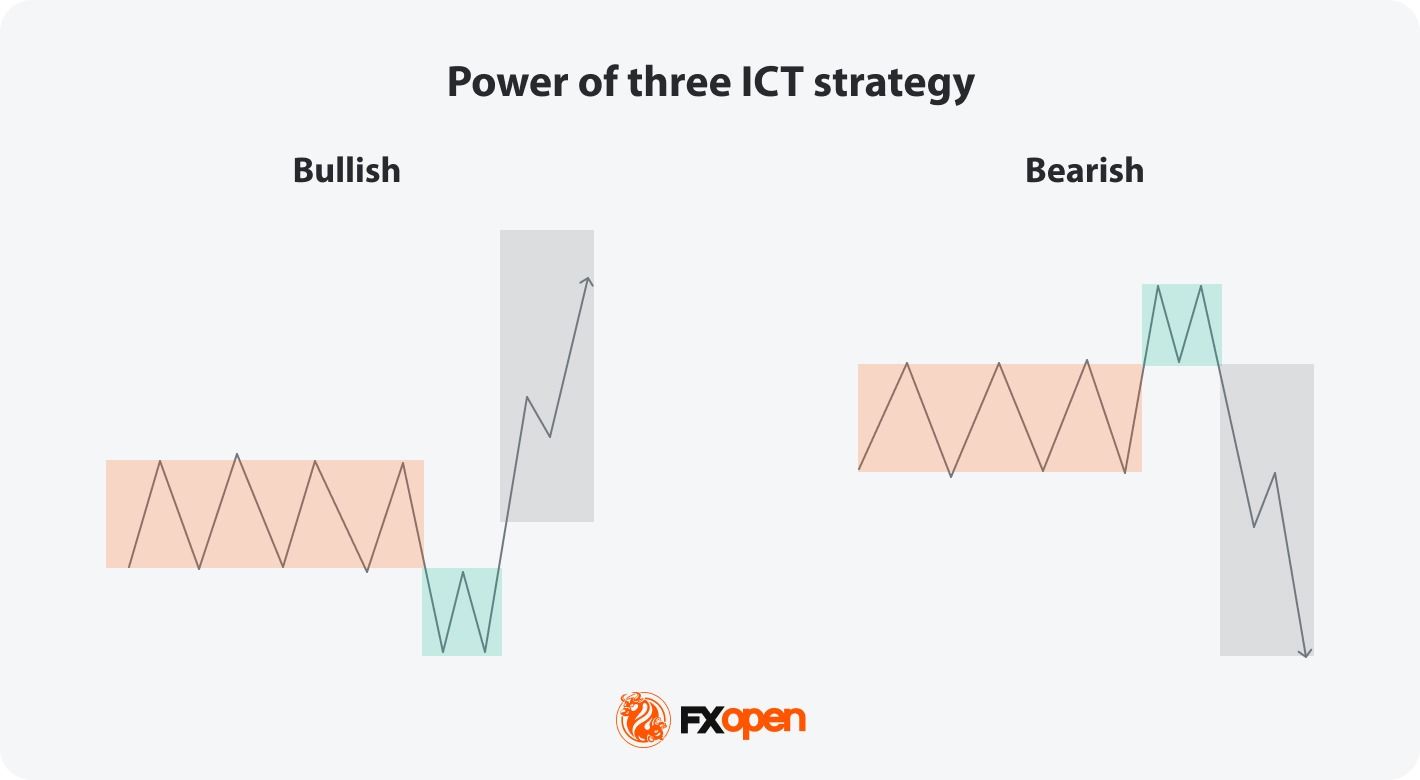
The ICT Power of 3 is a price action model describing how markets move through three phases: accumulation, manipulation, and distribution. Also called the AMD trading model, it sits within the Inner Circle Trader framework. Traders use it to interpret institutional behaviour and shape their own market analysis. Recognising these phases may help traders assess potential areas of interest and align their strategies with broader market dynamics.
This article outlines the core principles of the Power of 3 framework, providing a detailed examination of how it is applied in the context of institutional order flow and market structure.
Introduction to the ICT PO3 Trading Model

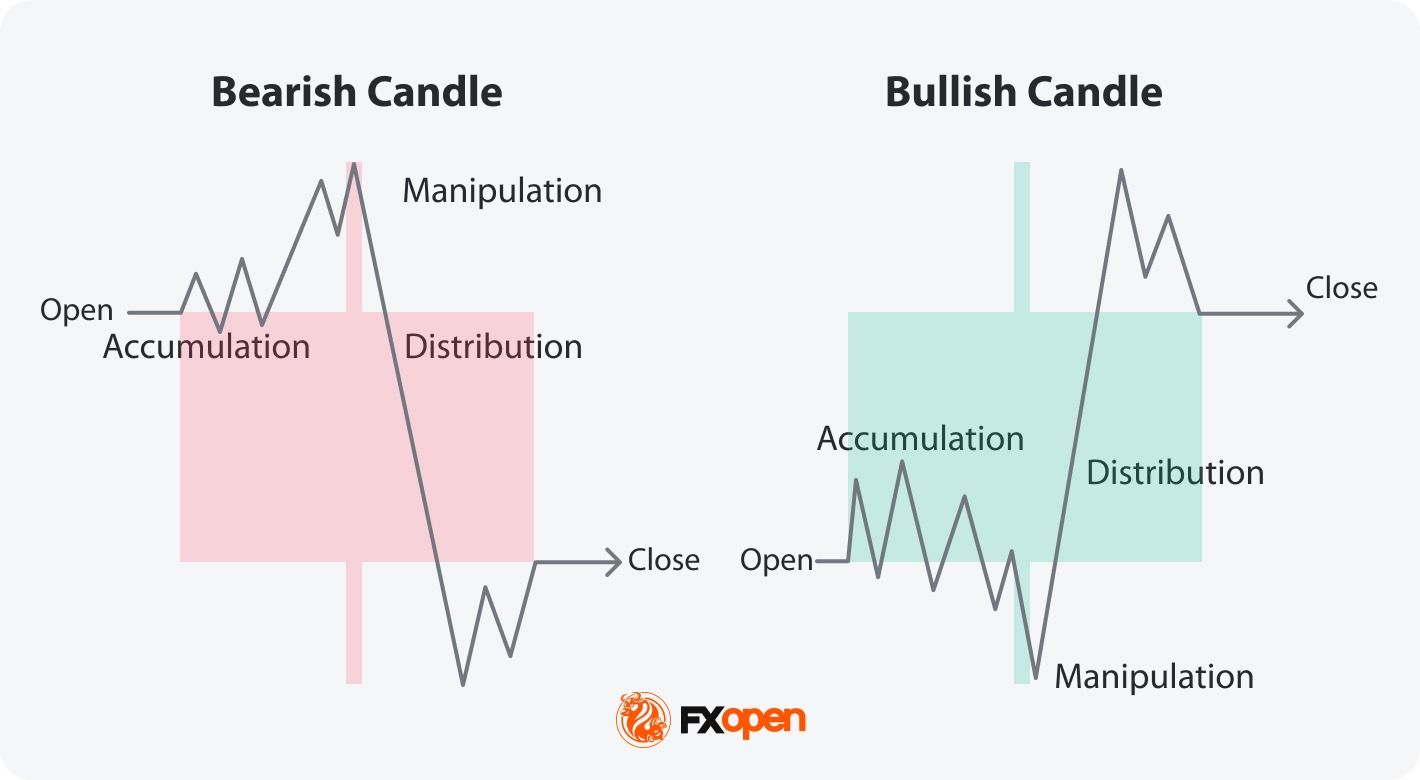
The ICT Power of 3 was developed by Michael J. Huddleston, better known as the Inner Circle Trader. The model, often referred to as the AMD trading model, divides price behaviour into three phases that repeat across timeframes and instruments. Accumulation builds positions inside a range. Manipulation pushes price beyond that range to capture liquidity. Distribution then drives the directional move that follows.
Traders use ICT PO3 to combine liquidity analysis, smart money concept trading, and market structure inside one framework. The activity these phases describe is typically attributed to institutional investors, whose order flow sits behind larger moves. Power of 3 trading applies to forex and indices, commodities, stocks, and cryptocurrencies*, though liquidity profiles vary between asset classes.
Below, we’ll discuss each of these three phases in more detail. Consider following along on FXOpen’s TickTrader trading platform.
Accumulation Phase (PO3)
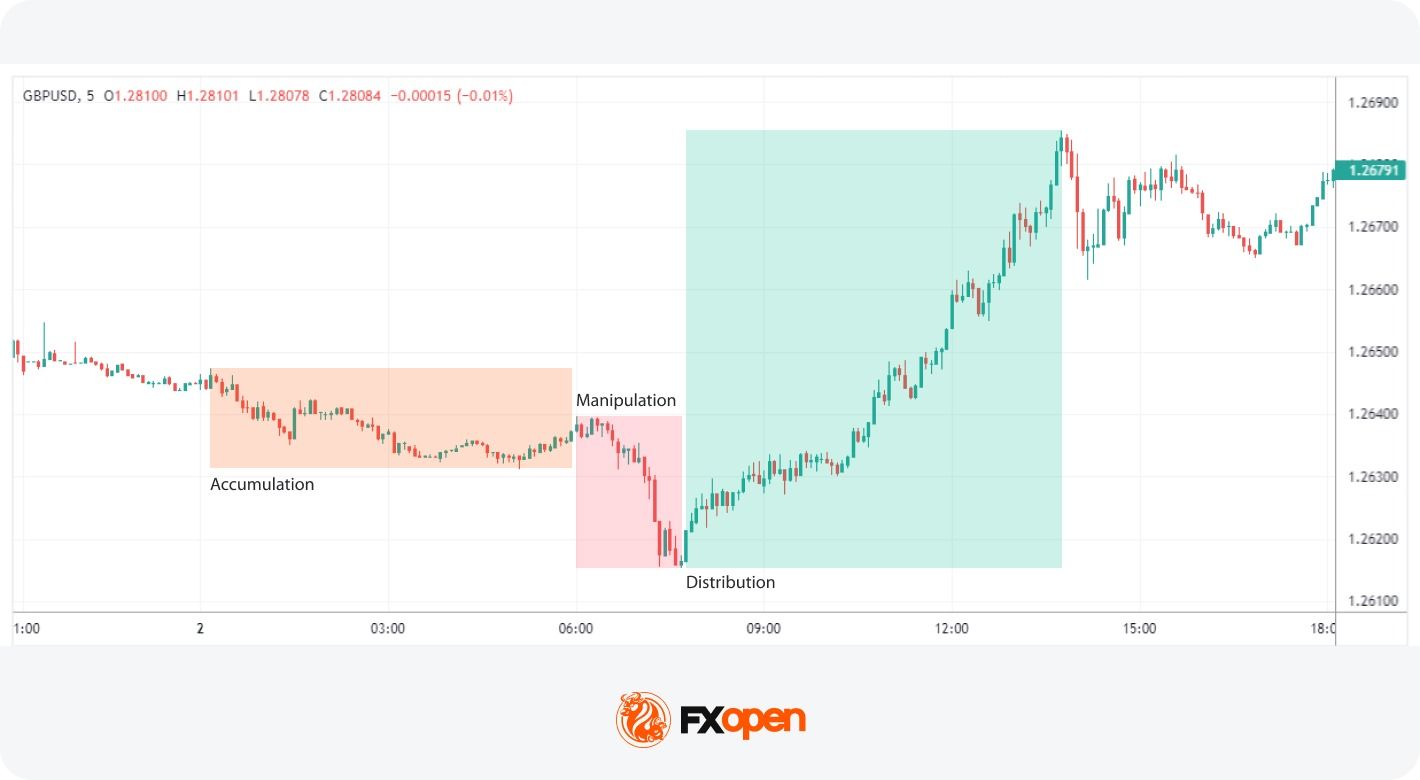
The accumulation phase is the first stage of the ICT Power of 3 model. It involves relatively low volatility and sideways price movement, typically near key support or resistance levels. During accumulation, the market ranges within a narrow band as large traders gradually build positions without significantly driving up price.
The range is where liquidity builds. Stop losses cluster just outside the highs and lows, creating the order pools targeted in the next phase.
For example, GBPUSD may stall inside a 30-pip range below a recent swing high for several sessions. That consolidation, with shrinking candle bodies and steady volume, is a typical accumulation setup. The narrower the range, the more compressed the liquidity sitting above and below it becomes.
Recognising the accumulation phase involves monitoring for typical signs such as:
- Low Volatility: The asset trades within a tight range, showing little directional bias.
- Key Levels: Accumulation often occurs near historical support or resistance levels where the price is deemed under or overvalued by institutional investors.
- Increased Volume: There may be a gradual rise in volume as smart money accumulates positions, signalling their interest without causing sharp price movements.
Accumulation is most often analysed on higher timeframes such as the 4-hour or daily chart, while lower timeframes show the range mechanics.
Manipulation Phase (Liquidity Sweep)
The manipulation phase is a pivotal part of the ICT PO3 trading strategy. This stage is marked by deliberate actions from institutional investors to create market conditions that mislead and trap retail traders. Also called a liquidity sweep or stop raid, manipulation typically occurs around session opens (often London and New York), previous day highs and lows, and equal highs or lows where stop orders tend to cluster.
Signals of the manipulation phase include:
- Stop hunts: Sharp moves beyond the accumulation range that trigger clustered stop loss orders.
- False breakouts: Sudden moves that look like a breakout but reverse back into the range.
- Directional context: In a bullish setup, the sweep typically dips below the range. In a bearish setup, it spikes above.
- Failure to hold beyond the level: Candles close back inside the range rather than extending.
- Movement against higher timeframe direction: Common after a prolonged trend, signalling potential exhaustion.
These moves create liquidity, allowing larger traders to build positions at more favourable prices. Liquidity sweep trading relies on identifying these reversals once the sweep completes.
For example, on GBPUSD, price may consolidate inside a tight range through the Asian session. At the London open, a sharp dip of around 25 pips clears stops below the range, then reverses back inside within minutes. That sequence is a typical manipulation phase in trading, meaning the engineered move clears liquidity before the real direction emerges.
Distribution Phase (Expansion Move)
The distribution phase is the final stage in the Power of 3 trading strategy, where positions built during accumulation are realised. It is also called the expansion move, since price extends sharply in the intended direction after the manipulation phase completes.
Confirmation signals of the distribution phase include:
- Strong directional candles: Sustained movement with large candle bodies in the expansion direction.
- Market structure break: The high or low of the accumulation range is traded through decisively.
- Volume expansion: Increased volume during the move, indicating active participation.
- Holding beyond the level: Candles close and stay beyond the broken structure rather than reversing back.
- Confluence with higher timeframe direction: The expansion aligns with the broader trend.
Distribution phase forex setups are commonly analysed once a market structure break confirms the move. Traders may use moving averages or support and resistance levels to potentially help confirm the transition.
For example, on GBP/USD, after a manipulation sweep below the Asian range at the London open, price reverses, breaks above the prior range high, and extends 60 pips into the New York session. The market structure break and sustained candles confirm the expansion move is underway.
Applying PO3 in Market Analysis
ICT PO3 is typically applied through a structured workflow that moves from higher timeframe context down to lower timeframe execution. The five steps below outline how ICT PO3 works in practice:
- Set the daily bias on a higher timeframe (4-hour or daily).
- Mark the day’s opening price on the chart.
- Identify the manipulation move beyond the day’s open and range boundaries.
- Confirm the entry on a lower timeframe (5-minute or 15-minute).
- Manage the position with stops beyond the manipulation extreme.
Setting the Daily Bias
Traders often start by establishing their market bias for the day. This involves analysing higher timeframes to determine the overall market trend. Understanding whether the market is bullish or bearish sets the foundation for the day’s trading strategy.
The higher timeframe directional context, typically taken from the 4-hour or daily chart, sets the side of the market traders look to align with intraday.
Marking the Day’s Open
After setting the bias, traders mark the opening price of the day. This price point often acts as a reference level for intraday price movements and liquidity analysis.
The daily open often sits close to overnight liquidity pools, and price reactions around this level may reveal whether short-term moves align with the higher timeframe direction.
Identifying Manipulation
Traders look for price movements beyond the day’s open and the established range boundaries. For a long bias, they observe for manipulation below the open, while for a short bias, they look above the open. This stage is important as it indicates where smart money may manipulate the market to create liquidity.
Resting liquidity tends to sit above swing highs and below swing lows, and the manipulation phase typically targets these areas before the expansion move begins.
Entry Confirmation
While a trader can simply enter once price trades beyond the day’s open, many choose to confirm the trade. Using a 5- and 15-minute charts, they might look for signals such as:
- A Change of Character (ChoCh).
- Price rejection at a key swing high or low.
- Candlestick reversal patterns such as a hammer, shooting star, or engulfing candle.
- Momentum slowing in the manipulated direction.
A ChoCh is a break in short-term market structure that may signal a shift in momentum, often appearing as the first lower timeframe sign that the manipulation move is exhausted.
Traders typically place stop losses beyond the manipulation high or low to potentially manage risk here.
Distribution Phase
If an entry is missed during the manipulation phase, traders can look for entries during the distribution phase. Although this phase may offer a less favourable risk-to-reward ratio, it still may have trading potential. Continuation entries could be taken after a market structure break, ChoCh and a pullback, with stops placed beyond a recent swing point.
ICT Power of 3 Example
The example below illustrates how the ICT Power of 3 (PO3) model may appear on an intraday chart.
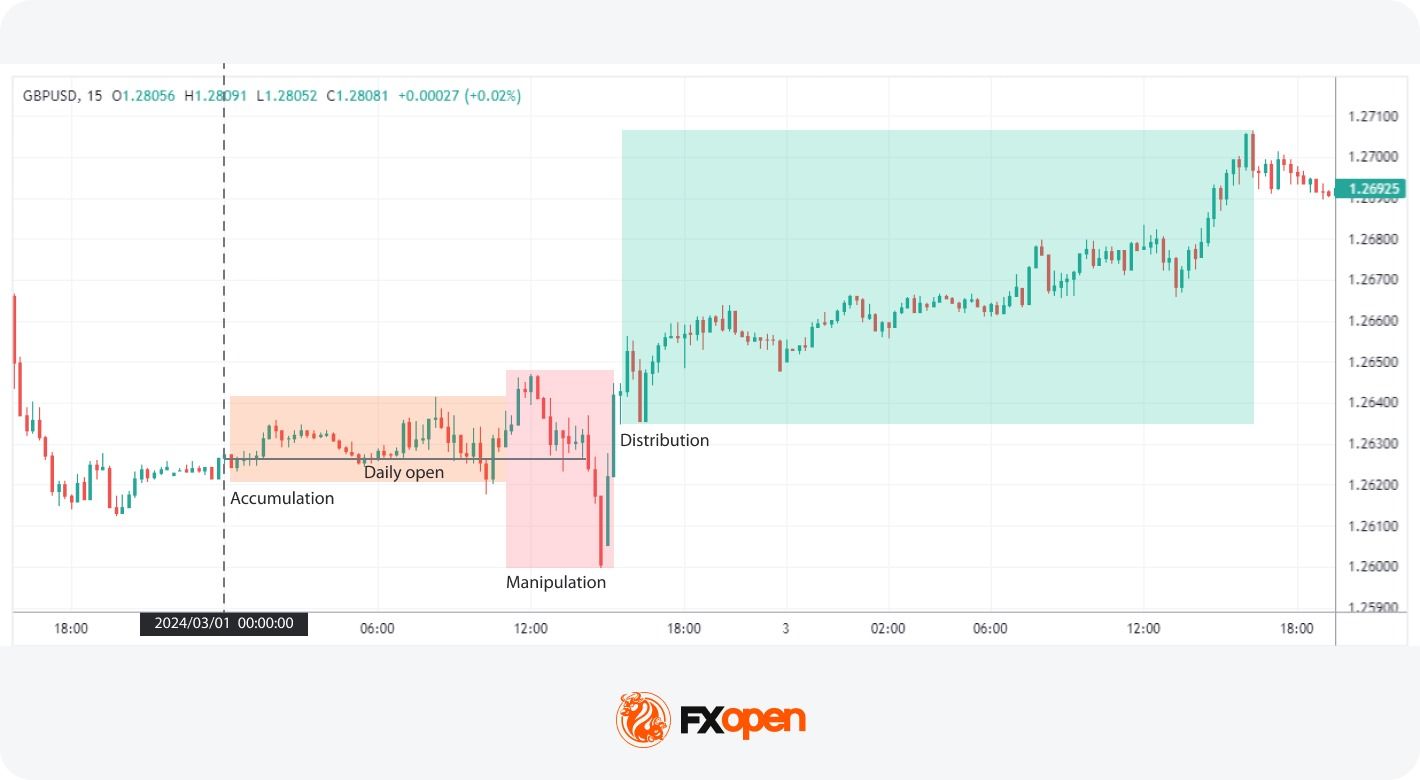
Accumulation: On the GBP/USD 15-minute chart, the day open acts as a support level. Price ranges sideways above this level, building liquidity inside a narrow band.
Manipulation: A candle wicks below the range, briefly clearing stops sitting under the swing low. Price then breaks above the range, only to reverse sharply back inside — a clear liquidity sweep across both sides of the accumulation band.
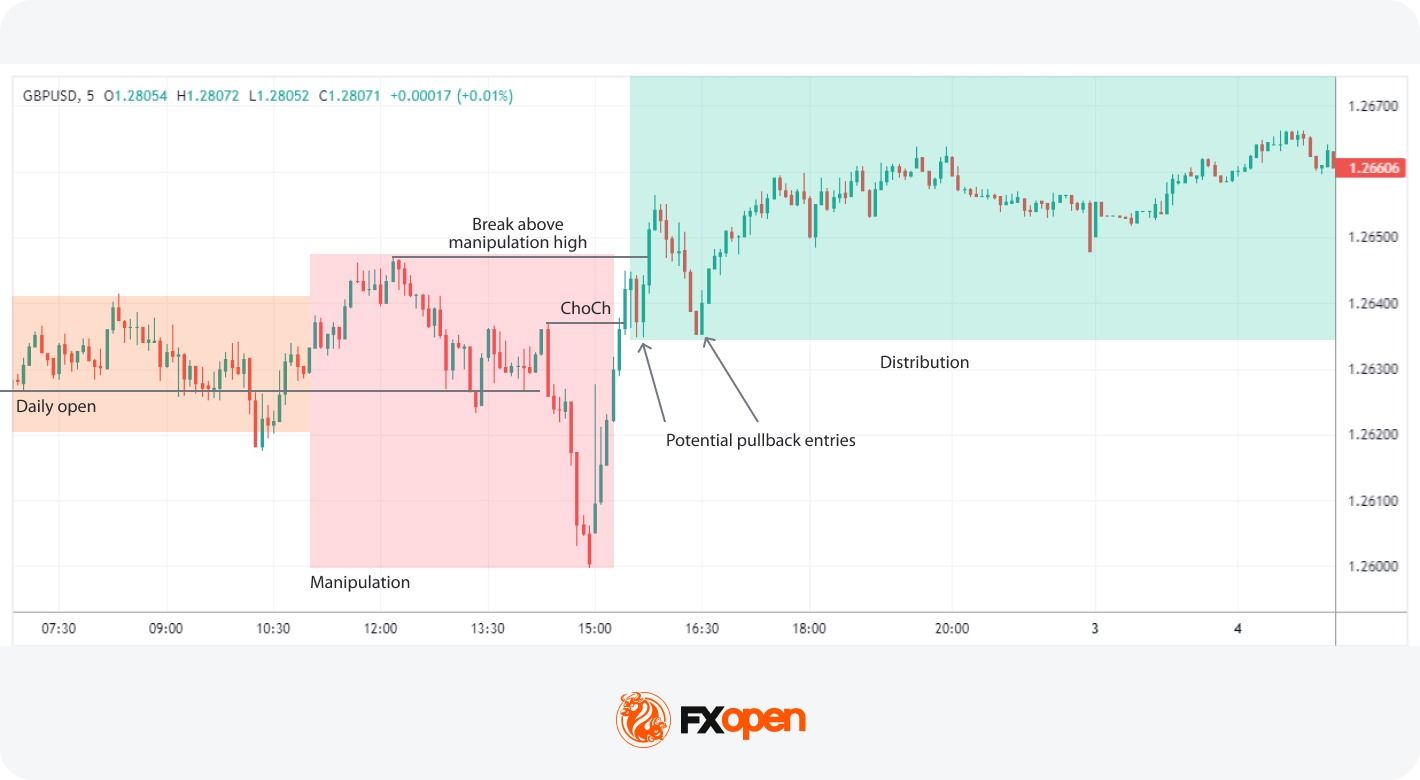
Distribution: On the 5-minute chart, a ChoCh forms as price breaks the downtrend structure. Price pulls back, then breaks above the manipulation high, signalling a bullish expansion move. Subsequent pullbacks may offer entries for traders who missed the initial sweep before price marks up further.
PO3 vs Other Price Action Models
PO3 trading shares ground with other price action approaches but differs in how it interprets price moves around key levels.
Breakout trading typically treats a move beyond a range as a signal of continuation. ICT PO3 treats the same move with caution, since the manipulation phase often produces a false breakout before the real expansion. Where a breakout trader may enter on the break, a PO3 trader often waits for the sweep to reverse and confirm direction on a lower timeframe.
Trend trading focuses on aligning with the broader directional move. Power of 3 trading incorporates trend context through the daily bias step but adds a structural framework around accumulation and liquidity, rather than relying on indicator-based trend signals such as moving averages or trendlines.
Limitations of PO3
The PO3 ICT strategy has limitations traders should consider before applying it.
The model is interpretive. Identifying where accumulation ends and manipulation begins involves judgement, and two traders may label the same chart differently. This subjectivity can lead to inconsistent application.
False signals are common. A move beyond a range may resemble a liquidity sweep but turn out to be a genuine breakout, leaving traders positioned against the actual direction. PO3 also performs differently across market conditions: ranging markets tend to produce clearer setups than strongly trending markets, where the accumulation phase may be brief or absent.
Risk Considerations in PO3 Trading
Stop placement is central to applying PO3. Stops are typically placed just beyond the manipulation high or low, since a return to that level may invalidate the setup. Placing stops too tight inside the range may potentially result in being stopped out by minor noise.
Volatility around session opens, particularly the London and New York opens, can produce sharp moves that extend further than expected. Wider stops may be required during these windows, which means position sizing potentially needs adjustment to keep risk per trade consistent. Pairing PO3 setups with structured risk management may potentially support more consistent execution.
The Bottom Line
Understanding and applying the ICT Power of 3 strategy can support a structured approach to analysing market movements. By identifying the phases of accumulation, manipulation, and distribution, traders may gain insights into potential institutional activity and adjust their decisions accordingly.
Traders interested in applying the model on live charts may consider opening a forex trading account with FXOpen.
FAQ
What Is ICT Power of 3 in Trading?
The ICT Power of 3 (PO3) is a trading strategy developed by Michael J. Huddleston, known as the Inner Circle Trader. It involves three key phases: accumulation, manipulation, and distribution. These phases may help traders understand market movements by aligning their strategies with institutional investors.
What Is the Power of 3 ICT Entry?
The Power of 3 ICT entry involves identifying optimal points to enter trades during the phases of accumulation, manipulation, and distribution. Traders typically look for signs of price manipulation, such as false breakouts, and then enter trades in the direction of the anticipated distribution phase.
How Does the Power of 3 Work?
The ICT Power of 3 can be an indicator of potential smart money involvement. It works by breaking down market movements into three phases:
1. Accumulation: According to theory, smart money is expected to build positions.
2. Manipulation: Traders monitor price movements that extend beyond the day’s opening level and the defined range limits.
3. Distribution: Smart money exits positions, leading to significant price movements in the intended direction.
How Do Traders Use the Power of Three?
Traders use the Power of Three (PO3) to analyse potential market direction through three phases: accumulation, manipulation, and distribution. They typically identify a ranging period, monitor liquidity sweeps beyond key highs or lows, and then look for confirmation that price is moving in the intended direction. Traders may combine PO3 with market structure analysis, liquidity levels, and higher timeframe bias when assessing trade setups.
Is PO3 Suitable for All Markets?
PO3 (the AMD trading model) may be applied to forex, indices, stocks, commodities, and cryptocurrencies*. Setups tend to be clearer in markets with defined session opens and concentrated liquidity, such as major forex pairs and equity index CFDs. In 24-hour markets like cryptocurrency*, accumulation and manipulation phases may form differently due to less defined session breaks, so context matters when applying the model across asset classes.
*Important: At FXOpen UK, Cryptocurrency trading via CFDs is only available to our Professional clients. They are not available for trading by Retail clients. To find out more information about how this may affect you, please get in touch with our team.
This article represents the opinion of the Companies operating under the FXOpen brand only. It is not to be construed as an offer, solicitation, or recommendation with respect to products and services provided by the Companies operating under the FXOpen brand, nor is it to be considered financial advice.

XRP price is holding its ground while the rest of the market buckles, as supported by its ETF flow data. XRP ETFs pulled in $8.88 million in the latest session, extending a run that included $18.52 million on May 14 and $10.87 million on May 15, totaling $42 million in net inflows across the past week.
Bitcoin ETFs, by contrast, shed another $100.9 million in the same session, following a brutal stretch of $648.6 million, $331.1 million, and $290.4 million in consecutive daily redemptions. Ethereum also lost $32.6 million in the latest session.
Not just ETF flows, XRP has also recorded its fourth-largest daily wallet creation spike of 2025, with 4,300 new addresses added in 24 hours.
— Santiment Intelligence (@SantimentData) May 21, 2026
 $XRP has had 4,300 new wallets created in 24 hours, the 4th largest spike of 2026. Network growth is among the top leading signals to identify reversals.
 Check out XRP’s network growth and level of address activity any time with this handy chart: https://t.co/8jwj1uvJta pic.twitter.com/Fbo1WRKEN8
The contrast between XRP inflows and BTC/ETH outflows points to selective rotation as BTC and ETH in fights againts its key supports.
Discover: The best crypto to diversify your portfolio with
Can XRP Price Break $1.50 This Week?
XRP’s price range of $1.36–$1.38 represents a holding pattern. The 7-day picture is less flattering with a -7% drawdown over the past week; the current stabilization is a recovery from a slide, not a continuation of a trend.
We identify $1.20–$1.25 as the critical support floor, with the $1.50–$1.60 band acting as near-term resistance that XRP has yet to convincingly reclaim.
Options positioning around the $1.40 level has been flagged as a near-term magnet, suggesting market makers may be keeping price anchored in a tight range heading into June expiry. ETF inflow data is encouraging, but spot volume has been modest, which limits the conviction behind the move.
The data points to a token in a critical zone, not yet confirming a reversal. Watch the $1.40 level closely.
Discover: The best pre-launch token sales
Bitcoin Hyper: A Superior Chain
XRP’s rotation story is compelling, but even a successful breakout to $1.60 from $1.37 would represent just 17% upside. For traders who want the narrative of Bitcoin ecosystem expansion, institutional capital flows, and infrastructure plays without the large-cap ceiling, early-stage presales offer a different risk/reward profile entirely.
Bitcoin Hyper ($HYPER) is currently in presale at $0.0136, having raised a huge $32 million to date. The project positions itself as the first-ever Bitcoin Layer 2 with Solana Virtual Machine (SVM) integration, targeting sub-second finality and smart contract capability on top of Bitcoin’s security layer, with performance that exceeds Solana.
A Decentralized Canonical Bridge handles BTC transfers, and staking is live with a high 36% APY for early participants.
The infrastructure thesis aligns directly with the capital rotation dynamic driving XRP’s current moment. Investors are not abandoning crypto; they are hunting for assets with structural upside that the majors can no longer provide at scale.
The post XRP Price Defies Market Weakness as ETF Flows Crush BTC and ETH appeared first on Cryptonews.

TLDR:
- Arthur Hayes warns AI is replacing high-earning workers, creating dangerous credit risks for global lending institutions.
- Hayes calls the AI-driven lending threat the “new subprime crisis,” comparing it directly to the 2008 financial collapse.
- Federal Reserve Chair Kevin Warsh’s balance sheet focus is neutral for liquidity, not the bearish signal markets feared.
- Commercial bank lending tied to wartime spending may offset AI deflation, supporting a higher Bitcoin price outlook ahead.
Arthur Hayes, the co-founder of BitMEX, has raised fresh concerns about artificial intelligence and its threat to the global credit system.
Speaking at the Bitcoin 2026 conference on April 28, Hayes argued that AI-driven job displacement among knowledge workers could trigger a wave of banking failures.
He described the risk as comparable in scale to the 2008 subprime mortgage collapse, with consequences in the hundreds of billions of dollars for lending institutions worldwide.
AI Displacement Threatens Traditional Lending
Hayes pointed to the growing replacement of high-earning knowledge workers by AI tools. These workers have historically been reliable borrowers for banks and SaaS companies alike.
As AI cuts into their employment, the credit risk tied to that income disappears. On YouTube, Hayes noted that AI is triggering a deflationary crisis, warning that it will “devastate traditional SaaS companies and severely impact lending institutions.”
The concern is that banks are currently underpricing this risk. Traditional lending models were built around stable professional incomes.
AI disruption breaks that assumption entirely. Without adjustment, banks could face mounting defaults they did not anticipate.
Hayes went further, framing the threat in stark historical terms. He called the unfolding situation the “new subprime crisis,” drawing a direct line to the 2008 collapse.
Just as mispriced mortgage risk brought down major institutions then, mispriced professional credit could do the same now. The structural parallel, in his view, is difficult to dismiss.
This deflationary pressure from AI had, until recently, been one of the key forces weighing on Bitcoin prices. However, Hayes noted a shift in market behavior since the onset of recent geopolitical conflicts, with Bitcoin beginning to outperform amid wartime inflation expectations.
War Economy and Banking Regulations Shift the Liquidity Picture
On the monetary side, Hayes turned his attention to Federal Reserve Chair Kevin Warsh. Many market participants have worried about Warsh’s hawkish reputation and its effect on liquidity.
Hayes pushed back on that concern, arguing that Warsh’s focus on shrinking the Fed’s balance sheet is “neutral for liquidity,” not a reason for alarm. That framing offered some reassurance to markets watching the Fed closely.
Crucially, Hayes noted that Warsh’s room to maneuver is limited. The Treasury still needs buyers for its bonds, and any sharp reduction in the Fed’s balance sheet could destabilize those auctions.
That constraint effectively caps how aggressive Warsh can be. The result, Hayes argued, is a neutral rather than negative liquidity outcome.
Commercial banks are also expected to step in. New regulations around the Enhanced Supplemental Leverage Ratio allow banks to hold more assets on their books.
This regulatory change enables banks to absorb debt rolling off the Fed’s balance sheet, keeping credit flowing through a different channel.
Hayes concluded that wartime spending on armaments and defense, combined with this regulatory shift, will generate enough new credit to offset the deflationary drag from AI.
The net effect, in his view, favors higher Bitcoin prices as commercial bank-driven money creation picks up where the Fed leaves off.


Every May 22, the crypto industry remembers and celebrates a trade that sparked a financial revolution: 10,000 bitcoins (BTC) for two Papa John’s pizzas. That one trade, although trivial at the time, marked the first known real-world transaction using BTC.
Today marks Bitcoin Pizza Day’s 16th anniversary, and it’s a good time to assess how far the digital assets landscape has evolved. But before we get to measuring, let us recap the story of how a man spent thousands of coins, currently worth hundreds of millions of dollars, on two boxes of pizza.
Pizza Day’s 16th Anniversary
The year was 2010 when Floridian programmer and early BTC adopter Laszlo Hanyecz ordered two pizzas from Papa John’s to be delivered to his home. At the time, BTC was worth $0.0041, so the purchase cost Hanyecz $41; however, BTC hit $1 nine months after the transaction, increasing the cost to $10,000.
As it’s more than evident now, BTC did not stop there. Over the following years, the leading digital asset went on to hit an all-time high (ATH) after another. As of 2024, 10,000 BTC was worth $690 million. In 2025, the assets were valued at $1.1 billion, given bitcoin’s price of $111,000 at the time.
It is worth noting that last year’s Bitcoin Pizza Day was celebrated during the bull market, and BTC hit an ATH on that day. At the peak of the bull run in October, BTC surged to $126,200, bringing the value of 10,000 BTC to $1.26 billion.
Unfortunately, this year’s Pizza Day comes at a time when the bears are in control, and bitcoin’s momentum is low. Regardless, the 10,000 BTC from the pizza purchase 16 years ago is currently valued at more than $770 million, per current prices. Data from CoinMarketCap shows BTC trading around $77,360 at press time.
Bitcoin’s Growth in 16 Years
The current value of those Papa John’s pizzas reflects how much Bitcoin as an asset and a network has grown. From adoption to recognition to network development, the asset has come a long way.
A growing number of vendors and merchants now accept BTC as payment, and the asset is increasingly integrated into modern wealth portfolios and institutional frameworks. The crypto industry has grown alongside Bitcoin, and leading financial networks are jumping on the bandwagon.
Meanwhile, 10,000 BTC could only afford two pizzas 16 years ago, but that is not the case today. With $770 million, one can access multiple luxury items, property, and experiences today.
The post Bitcoin Pizza Day 2026: Commemorating Crypto’s First Real-World Transaction appeared first on CryptoPotato.
TLDR:
-
- Binance Bitcoin futures Open Interest climbed from $6.4B in March to $8.96B, topping the 180-day moving average.
- The eight-month deleveraging phase mirrors conditions last seen in 2022, just before the FTX collapse hit markets.
- Speculative traders returned to Bitcoin derivatives despite a continued deterioration in the global macro environment.
- Analysts warn the recovery trend stays fragile, as leveraged traders could exit positions quickly if Bitcoin corrects further.
Bitcoin traders are re-entering derivatives markets after an extended eight-month deleveraging cycle. Binance futures Open Interest climbed from $6.4 billion in March to approximately $8.96 billion, crossing back above its 180-day moving average.
The shift points to renewed speculative appetite, though analysts caution the trend remains fragile given persistent macroeconomic and geopolitical pressures still weighing on broader risk markets.
Bitcoin Open Interest Climbs Back Above Key Average
Binance futures Open Interest has been a reliable gauge of trader activity in the Bitcoin derivatives market. When Open Interest falls below its 180-day moving average, it typically signals that futures activity is contracting. Liquidations mount, and traders pull back from leveraged positions as corrections deepen.
That is precisely what unfolded following the October 10 event. The downturn, compounded by a weakening global macroeconomic backdrop, pushed traders toward risk reduction. Over the months that followed, Binance Open Interest remained below its 180-day moving average.
Crypto analyst Darkfost noted that this deleveraging phase lasted roughly eight months. According to the analyst, a comparable situation last occurred in 2022, just ahead of the FTX collapse. That event triggered another sharp round of liquidations across the market.
The recent climb above the 180-day moving average, currently near $8.75 billion, marks a potential turning point. Open Interest now sits at approximately $8.96 billion, placing it above that threshold. This crossover is generally read as a signal that the deleveraging period has ended.
Speculative Traders Drive the Recovery, but Risks Remain
The return of traders to Bitcoin derivatives has contributed to the ongoing price correction to the upside. Bitcoin’s sharp pullback from prior highs attracted speculative participants looking to position for a rebound. Their activity has added buying pressure through leveraged exposure.
Darkfost pointed out that despite ongoing macro deterioration, traders moved back into futures positions. The analyst wrote that the sharp correction drew more speculative traders looking to play a rebound. That dynamic has helped stabilize price action in recent weeks.
However, the recovery remains early-stage and should not yet be treated as a confirmed trend reversal. The macro environment has not meaningfully improved, and external shocks could quickly reverse the recent inflows. Leveraged traders tend to exit positions rapidly when conditions shift against them.
If Bitcoin resumes the correction that began in October, these returning traders could unwind just as fast as they entered.
The speed at which Open Interest rose above the moving average also means it could fall back below it. For now, the market is in a transitional phase rather than a clear recovery.

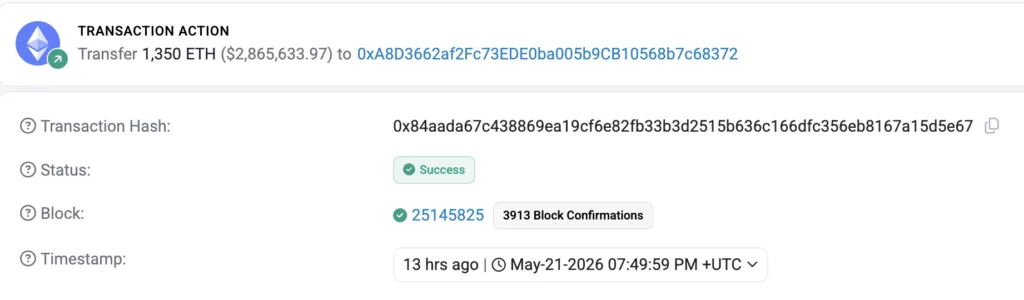
The Verus Ethereum bridge exploiter has returned 4,052 ETH to the project team after a settlement offer, while keeping 1,350 ETH as a bounty.
Summary
- PeckShield says the Verus bridge exploiter returned 4,052 ETH, equal to 75% of stolen funds.
- The exploiter kept 1,350 ETH as a bounty after Verus proposed settlement terms publicly.
- Earlier reports linked the Verus bridge exploit to missing validation checks in cross-chain transfer logic.
PeckShield said the Verus bridge exploiter returned 4,052.4 ETH, worth about $8.5 million, to a Verus team address. The firm said the returned assets represented 75% of the stolen total.
Etherscan data shows a successful transfer of 4,052 ETH from a wallet labeled Verus Exploiter 2 to the address 0xF9AB…C1A74 on May 21. The transaction was valued at about $8.59 million at the ETH price shown by the explorer.
PeckShield said the remaining 25% stayed with the exploiter as a bounty. A separate Etherscan transaction shows 1,350 ETH, worth about $2.86 million, moved from the exploiter wallet to a new address minutes after the return transfer.
Some X users framed the recovery as a win for negotiated returns. Bee Swarm said “75% recovery is the new standard” and argued that bounty deals can work better than legal threats after funds are gone.
Others said the exploit still points to deeper bridge risks. Zenthis argued that partial recovery does not fix “centralized custody in bridges,” while pointing to atomic swaps as an alternative.
Bounty offer followed public Verus terms
Verus had earlier posted a message to the bridge exploiter, saying its community and developers had discussed terms for the fund return. The post said the terms covered the bounty size, the exploiter’s obligations, and how the assets could be returned.
According to the public Verus message from X, the community had agreed to a 1,350 ETH bounty. The offer was tied to returning the remaining funds and settling the matter under the proposed terms.
The return now makes the Verus case different from many bridge attacks, where stolen funds often move through mixers or remain under attacker control. In this case, most of the drained ETH moved back to a team address after the bounty offer.
Earlier exploit drained $11.5M
The fund return follows the May 18 Verus Ethereum bridge attack. Earlier coverage reported that the bridge lost more than $11.5 million after attackers used what security researchers described as a forged cross-chain transfer message.
PeckShield had reported that the drained assets included 103.6 tBTC, 1,625 ETH, and nearly 147,000 USDC. The attacker later swapped the stolen assets into 5,402 ETH, worth about $11.4 million at the time.
Blockaid linked the exploit to missing source-amount validation inside the bridge logic. The firm said the issue was not an ECDSA bypass, not a notary key compromise, and not a parser or hash-binding bug.
Bridge security remains under pressure
The Verus recovery comes during a busy period for cross-chain security incidents. Recent coverage said MAPO fell 96% after attackers exploited the Butter Network bridge and minted a huge amount of unauthorized tokens.
Echo Protocol also paused cross-chain activity after an attacker minted about $76.7 million in unauthorized eBTC on Monad. On-chain investigators said the exploiter used fake eBTC as collateral before moving funds through Tornado Cash.
These cases show why bridge validation remains a core risk for DeFi. Bridges hold assets across chains, so weak checks can allow attackers to trigger transfers, mint tokens, or move reserves before teams can stop the flow.
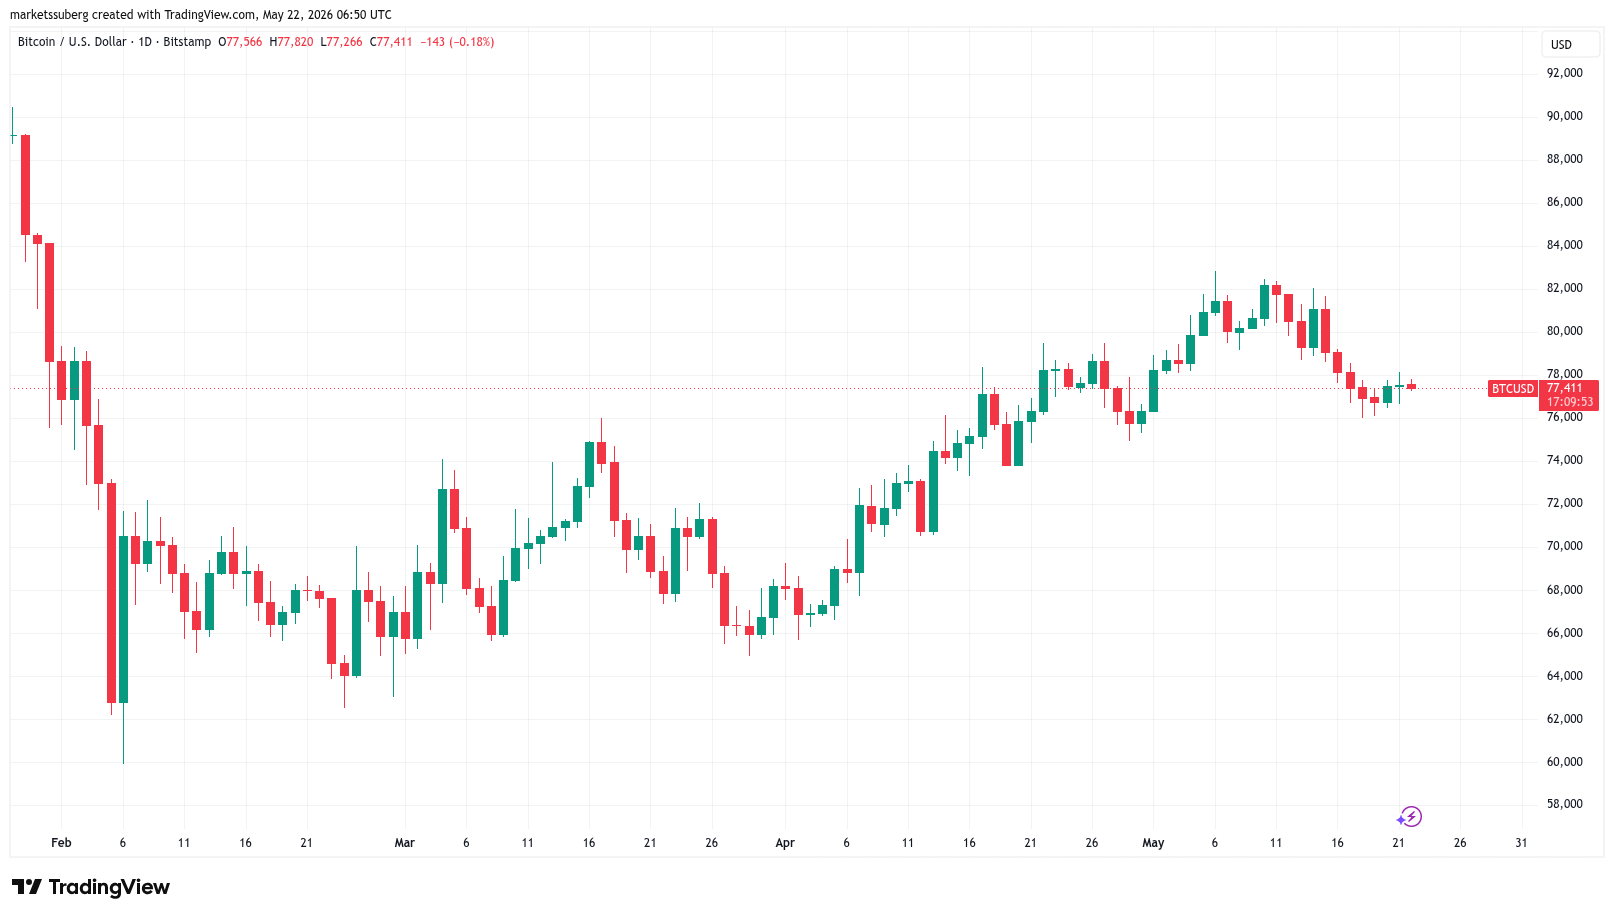
Bitcoin (BTC) has trended up for 90 days and is seeing a “bull market rally,” analysis says.
Key points:
- Bitcoin has trended up for 90 days within its bear market — something that has never happened before.
- Analysis thus sees price as being in a “bull market rally,” with February’s macro lows untouched.
- Separate commentary calls for a reclaim of the weekly supertrend nearer to $90,000 to confirm that bulls are back.
Bitcoin internal bear-market uptrend makes history
In a post on X on Thursday, trader and analyst Matthew Hyland said that Bitcoin’s recent rebound from macro lows has been unlike any other in history.
“This BTC rally resembles a bull market rally NOT a bear market rally,” he summarized.

BTC/USD one-day chart. Source: Cointelegraph/TradingView
According to Hyland, BTC/USD has been in a fresh uptrend since the last week of February. At the start of the month, the pair briefly fell below $60,000, hitting its lowest levels since late 2024.
Since then, relief has taken over, with Bitcoin reaching local highs near $83,000 exactly three months after the February bottom, data from TradingView confirms.
“There has NEVER been a rally that trended upward for 89 days ever in a bear market in BTC history,” he continued.
“The break of high time frame resistance also has marked the start of a bull market rally the prior three times.”
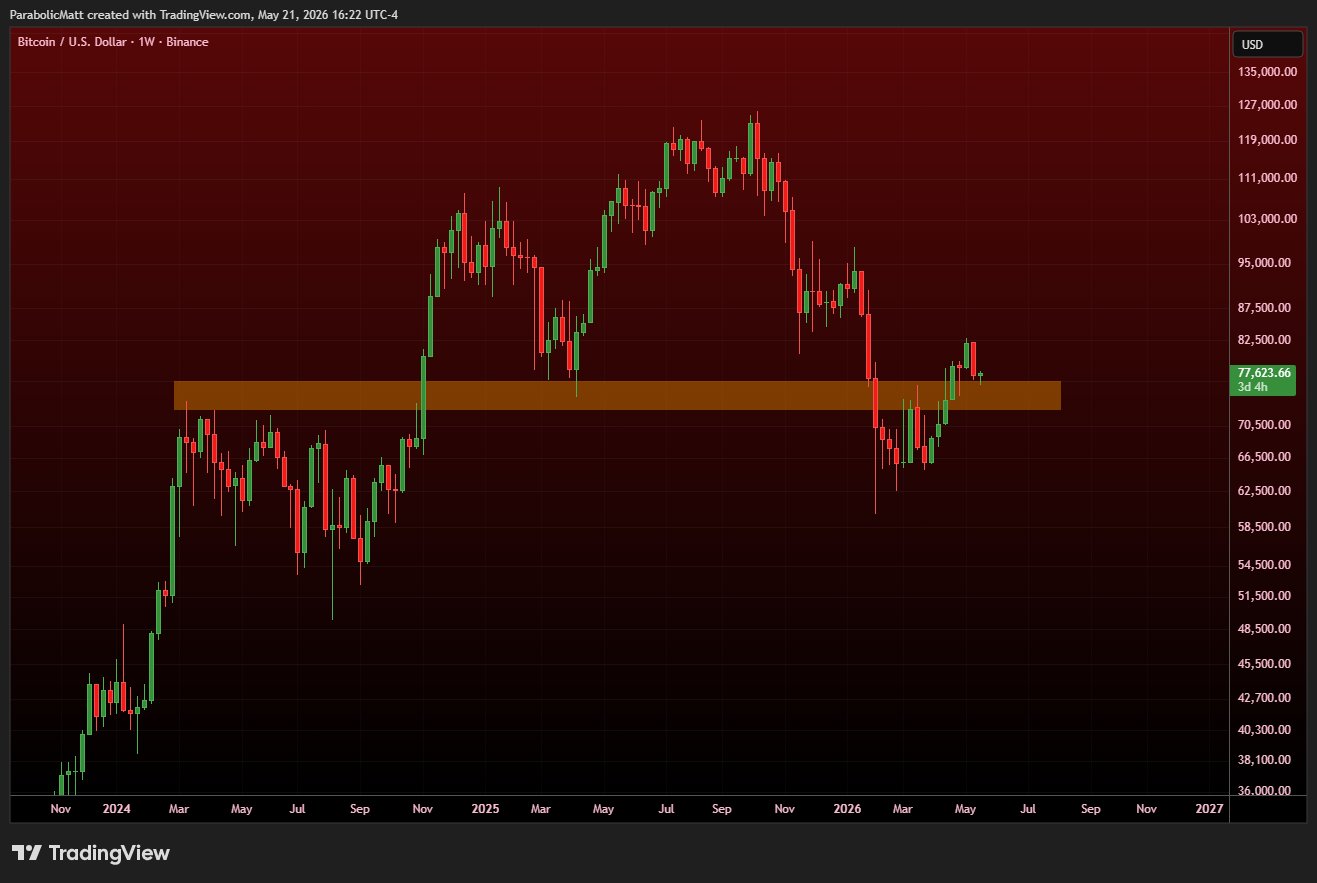
BTC/USD one-week chart. Source: Matthew Hyland/X
An accompanying chart shows that resistance was cleared when the price first broke above and held $77,000.
“Both of these characteristics are characteristics of a bull market rally NOT a bear market rally,” Hyland reiterated.
Analyst: BTC price needs $88,000 rebound
On the topic of bear market expirations, independent analyst Filbfilb demands a higher resistance reclaim for confirmation that bulls are back in control.
Related: Bitcoin due ‘5%+’ move as analysis stays bullish on BTC price outlook
Bitcoin’s weekly supertrend, currently near $90,000, is the line in the sand to watch.
“The last 2 BTC bear markets ended with a >+20% weekly candle and a break of the weekly super trend – presently around $ 88k,” he told X followers.
“If the bearish move we see in play at the moment fails, I’m expecting one of those candles to happen rather than much messing about around these levels.”
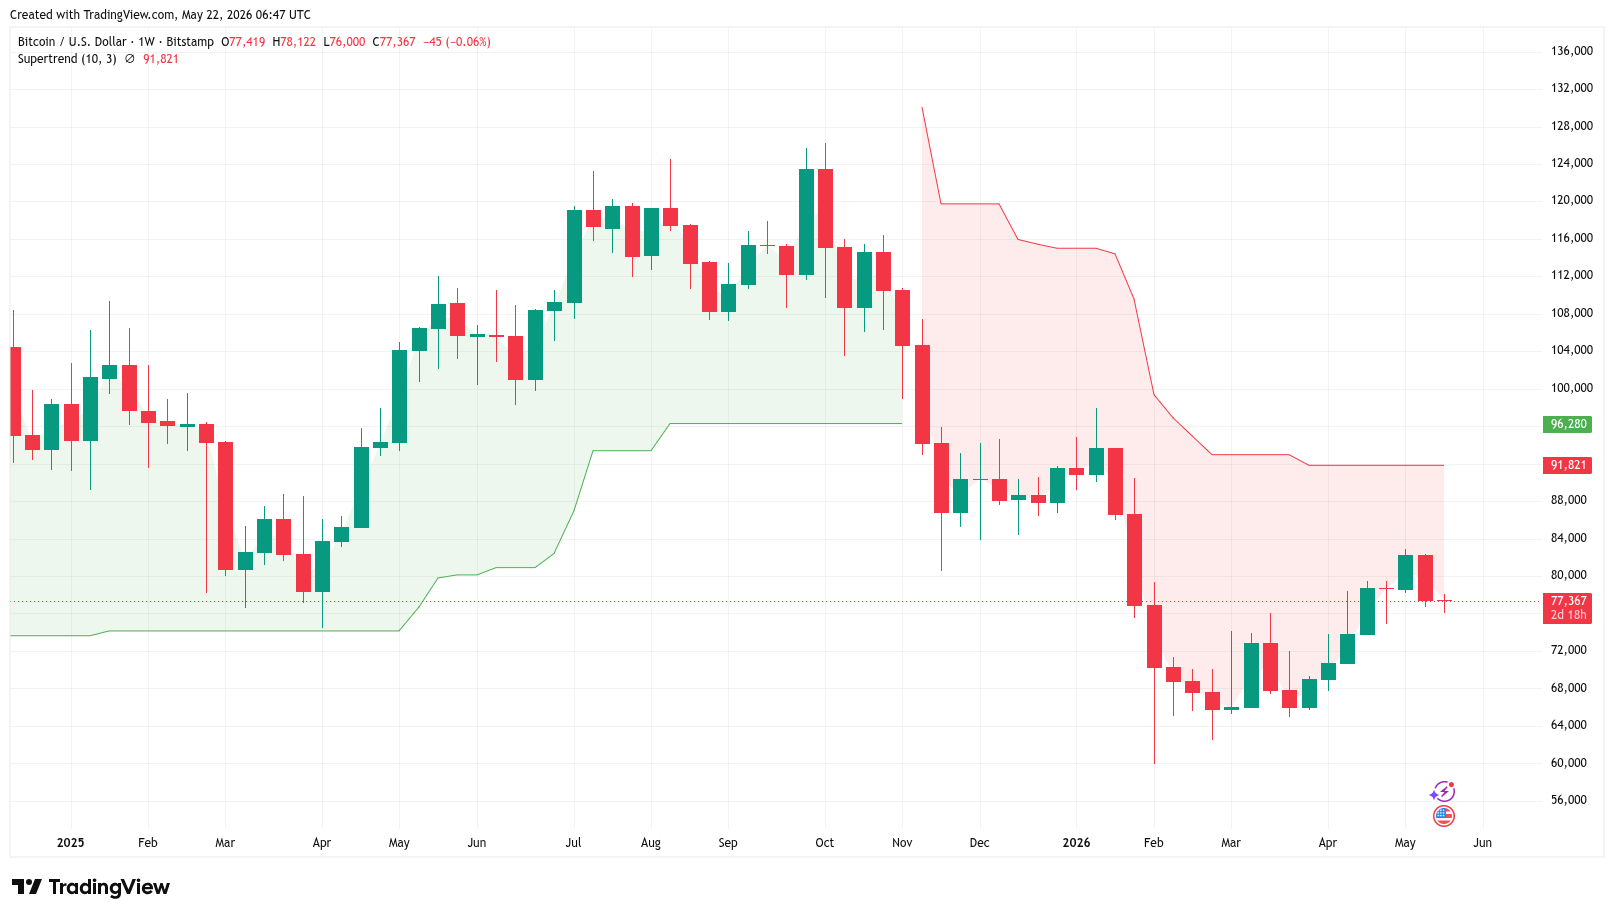
BTC/USD one-week chart with supertrend data. Source: Cointelegraph/TradingView
The super trend is calculated using the average true range of price, coupled with a multiplier. BTC/USD last had a weekly close above the supertrend line in early November 2025.


Layer-1 blockchain Near’s forthcoming upgrade will allow the network to scale dynamically without human intervention.
The market is giving it a thumbs-up, sending the native token’s price sharply higher. NEAR has gained more than 27% in the last 24 hours to trade at $2.25.
“Dynamic resharding is coming to NEAR. The upcoming network upgrade will enable the protocol to add shards automatically as demand grows,” the protocol announced on X. “This delivers on NEAR’s founding vision of building the world’s most scalable blockchain protocol at the highest level of performance.”
Shards are smaller, independent partitions of the blockchain network that process transactions and smart contracts in parallel. Imagine a grocery store with multiple checkout lines. This helps Near handle more traffic than typical blockchains with a single checkout line.
The catch? Until now, opening a new partition on Near has been a slow, manual process, requiring weeks of validator coordination, a vote, and a staged rollout.
The upcoming dynamic resharding in June will automate this process. In other words, when the network sees a specific check out line, a shard, getting too full, it doesn’t wait for a human to fix it. It automatically splits, not in half, but by adding more independent parallel validators to the system, just as the grocery store would hire new cashiers and customer staff.
“Adding shards has required a full protocol upgrade: weeks of validator coordination, a vote, a staged rollout. Dynamic resharding makes it automatic: a shard hits a state size threshold, splits deterministically, and is validated by state witnesses with no human intervention,” Near said in an explainer.
The new feature is particularly foundational to an AI-led onchain economy, where bots are doing business with each other, it explained.
Quantum-proof
Scaling isn’t the only thing changing with the impending upgrade. Near is also adding “post-quantum-safe signing.”
Quantum fears have gripped the developer community ever since Google researchers warned that a sufficiently powerful quantum computer might be able to crack today’s blockchains with significantly less firepower than initially expected.
Near, therefore, is installing new locks so that years from now, those super quantum machines won’t be able to touch funds of Near users.
Native token NEAR is the best-performing cryptocurrency among the top 100 coins by market cap over the past 24 hours thanks to the rally. Bitcoin has dropped 0.4% to $77,360.
NEAR’s external performance is supported by strong demand for the Bitwise Near Staking ETF (exchange-traded product) listed in Europe. This week, the ETP has pulled in $7 million in investor money, according to data shared by Bitwise’s CEO Hunter Horsley.

US Securities and Exchange Commissioner Hester Peirce has told the crypto industry to cool its expectations about a potential “innovation exemption” to allow tokenized stock trading after a report earlier this week about what it could entail.
Her comments were made after a Bloomberg report on Monday. Brett Redfearn, president of tokenization platform Securitize, expressed concern following the report, arguing that enabling third parties to tokenize stock “without an issuer at the table” could lead to fragmentation issues.
In a post to X on Thursday, Peirce said her expectation has always been that any exemption would be “limited in scope” by only permitting “digital representations of the same underlying equity security that an investor could purchase in the secondary market today.”
Peirce said she doesn’t expect synthetic tokens to be included, which would make it more challenging for third parties to offer stock-price tracking tokens under the exemption.
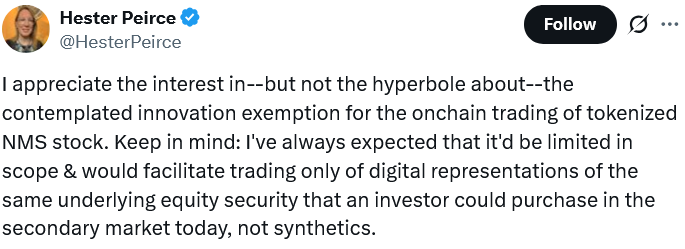
Source: Hester Peirce
Data from RWA.xyz shows that $1.48 billion worth of stocks are tokenized onchain, including shares linked to stablecoin issuer Circle, Bitcoin buying firm Strategy and Google (GOOG).
However, it hasn’t boomed as rapidly as some financial institutions have expected, including Citibank and McKinsey & Co, which predicted in 2022 and 2024 that the tokenization sector would become a trillion-dollar market by or before 2030.
Peirce’s comments cleared the air
Peirce’s comments are in line with Bloomberg’s report stating that the securities regulator is only considering permitting tokens that carry the same benefits as common stock, such as voting rights and dividends.
Robert Leshner, the CEO of crypto tokenization platform Superstate, said this stricter approach would enable decentralized finance and tokenization to expand “without compromising the standards that make the USA the center of capital markets.”
Carlos Domingo, CEO of Securitize, also said the approach would mitigate the risk of ownership fragmentation in the tokenization market.
“This is good, we want to do on-chain trading, but for the right assets, and not to help proliferate those derivatives that are fragmenting the market and introducing additional risks.”
Bloomberg said the SEC reportedly spoke with “hundreds of market participants” for feedback on how best to tailor the rules for tokenized trading.
Related: Kraken parent Payward sees revenue surge as tokenization expands
Details haven’t been finalized and could change before an exemption is made, Bloomberg added in the report, citing people familiar with the matter.
Despite the possible exemption, Bloomberg reported that some SEC officials weren’t in support of permitting tokenized stock trading.
Magazine: 5 tech predictions the mainstream media got horribly wrong

Polymarket reportedly aims to secure government approval for prediction markets in Japan by 2030.
Bloomberg, citing people familiar with the plans, reported that the platform appointed Mike Eidlin to lead the efforts.
Polymarket’s Japan Push Tests 2030 Regulatory Timeline
Eidlin currently heads Japan operations at crypto firm Jupiter. Polymarket sees Japan as a large untapped opportunity, Bloomberg‘s sources said. The country currently sits on the platform’s frontend-restricted list.
The four-year timeline gives Polymarket room to court Tokyo regulators. The company is leaning into new markets as US scrutiny tightens and other governments shut the door.
Argentina ordered a nationwide Polymarket block in March. The platform already restricts or blocks access in more than 30 countries, including France, Germany, Italy, Australia, and Poland.
Follow us on X to get the latest news as it happens

Polymarket itself was barred from the US for roughly three years before regaining CFTC clearance in September 2025. Whether Tokyo proves more receptive depends on how Japanese regulators classify event contracts.
Polymarket isn’t alone in facing regulatory heat. According to ThePrint, India’s electronics ministry is set to issue a blocking order to Kalshi as soon as Friday.
Subscribe to our YouTube channel to watch leaders and journalists provide expert insights
The post Polymarket Reportedly Targets Tokyo Approval by 2030 in Japan Lobbying Effort appeared first on BeInCrypto.

Phils’ Cristopher Sanchez rides scoreless streak into outing vs. Reds

The Wizard of Oz at Sphere Las Vegas: Dorothy Meets the Death Star

GROK makes SHOCKING XRP price prediction…


-

 Crypto World6 days ago
BloFin War of Whales 2026 Grand Prix opens registration for $5M trading championship
-

 Fashion7 days ago
Weekend Open Thread: Theory – Corporette.com
-

 Crypto World7 days ago
E-Estate Announces 1 Year Live: Washington DC Summit as Real Estate Tokenization Enters Its Next Phase
-

 Tech6 days ago
Google reimburses Register sources who were victims of API fraud
-

 Business7 days ago
H&R Real Estate Investment Trust (HR.UN:CA) Q1 2026 Earnings Call Transcript
-

 Entertainment7 days ago
David Letterman Returns to Late Show, Blasts Cancellation
-

 Sports6 days ago
Napoleonic enters 2026 Doomben 10,000 field via Abounding withdrawal
-

 Crypto World6 days ago
BeInCrypto 100 Institutional Awards Nomination: KAST for Best Digital Assets Neobank and Best Digital Assets Fintech
-
 Crypto World6 days ago
Bitcoin Battles US Bond Nerves With BTC Price Dip Toward New May Lows
-

 Crypto World6 days ago
ICE and CME urge US regulators to curb Hyperliquid energy trading
-
 Crypto World6 days ago
Wall Street’s Boldest Gold Prediction Has Russians Rushing to Buy
-

 Fashion5 days ago
On the Scene at Gucci’s Cruise Show in New York City: Mariah Carey, Kim Kardashian, Lindsay Lohan, Iman, and More!
-

 Crypto World6 days ago
IREN closes $3 billion convertible notes deal amid AI infrastructure expansion
-

 Fashion6 days ago
Trending Western Style Vests Perfect for Summer
-

 Politics6 days ago
Watch: far-right flag-fanatics run over victim, attack locals – Setup By the Left wing for your entertainment
-

 Fashion7 days ago
Creative Ideas for Custom T-Shirts
-

 Fashion5 days ago
Amazon Sundays: Memorial Day Hosting
-

 Crypto World16 hours ago
Blockchain.com files with SEC for U.S. IPO
-
 Fashion7 days ago
Philip Jones Wedding Jewellery For Women
-

 Crypto World6 days ago
Crypto Market Structure Bill Clears Committee; Senate Vote in Focus
You must be logged in to post a comment Login