
Crypto World
NVIDIA revenue hits $96.2B as AI demand doubles

NVIDIA reported fiscal second-quarter 2027 revenue of $96.2 billion on Aug. 26, beating analyst expectations as demand for artificial intelligence infrastructure continued expanding.
Summary
- NVIDIA reported Q2 revenue of $96.2 billion, rising 106% year over year and beating estimates.
- Data Center revenue reached $89.0 billion, increasing 117% as AI infrastructure demand accelerated globally worldwide.
- NVIDIA guided Q3 revenue to $108 billion, excluding Data Center compute sales from China entirely.
- Supply and capacity commitments jumped to $279 billion, primarily reflecting expanded procurement of memory components.
- Vera Rubin entered full production, while NVIDIA returned approximately $26 billion to shareholders during Q2.
Revenue for the quarter ended July 26 increased 18% from the preceding quarter and 106% from one year earlier, according to the company’s official release. Visible Alpha analysts had expected approximately $92.2 billion.
NVIDIA revenue beats estimates as Data Center sales surge
NVIDIA’s Data Center business generated $89 billion, rising 18% quarter over quarter and 117% year over year. The result also surpassed the Visible Alpha estimate of roughly $85.7 billion.
Non-GAAP diluted earnings reached $2.22 per share, compared with analyst expectations near $2.09. GAAP earnings were $2.46 per diluted share, while GAAP net income more than doubled to $59.7 billion.
Both GAAP and non-GAAP gross margins were 75%. NVIDIA returned approximately $26 billion through share repurchases and dividends during the quarter. It retained about $99 billion under its share repurchase authorization.
The results arrive as Bitcoin mining companies increase spending on AI infrastructure. As previously reported, nine public miners spent $5.11 billion on capital assets during the first half of 2026 while recording $341.2 million in AI and high-performance computing revenue.
$108 billion NVIDIA outlook excludes China compute sales
NVIDIA projected fiscal Q3 revenue of $108 billion, plus or minus 2%. That forecast exceeded the approximately $104.2 billion consensus estimate cited before the results.
The company expects both GAAP and non-GAAP gross margins of 74%, plus or minus 50 basis points. Its outlook assumes no Data Center compute revenue from China, reflecting continuing restrictions and uncertainty surrounding sales of advanced AI processors.
NVIDIA shares initially fluctuated following the release as investors considered the lower margin forecast. The stock later rose approximately 4.1% in extended trading after the company’s earnings call.
“Customer forecasts point to NVIDIA’s growth doubling next year,” CFO Colette Kress said, but the company expects approximately 70% growth because available supply may not satisfy all forecast demand.
The 70% figure is management’s fiscal 2028 expectation, not a guaranteed result. Customer forecasts also represent demand indications rather than binding revenue commitments.
Supply commitments rise to $279 billion
NVIDIA’s supply and capacity commitments increased from $119 billion in the preceding quarter to $279 billion as of July 26. Its 10-Q filing attributed the increase mainly to memory and manufacturing capacity required for current and future products.
The commitments include $92 billion due during the remainder of fiscal 2027, $87 billion in fiscal 2028 and $88 billion in fiscal 2029. Some supplier agreements may be canceled, rescheduled or adjusted before firm orders are placed.
The filing also disclosed total future commitments of $366 billion across supply, cloud services, leases, equity investments and capital expenditure. The company had another $29 billion in cloud service agreements and $25 billion in data center leases that had not commenced.
Crypto-linked infrastructure providers are participating in this expansion. In related coverage, IREN signed a $3.4 billion NVIDIA contract covering managed GPU cloud services over five years.
Vera Rubin enters production as capacity expands
The firm said its Vera Rubin platform had entered full production, with systems running at CoreWeave, Google Cloud, Microsoft Azure, Oracle Cloud Infrastructure and Nebius.
Meanwhile, the company also announced partnerships with Apollo, BlackRock, Blackstone, Brookfield, Goldman Sachs and KKR intended to mobilize more than $500 billion for AI infrastructure. The initiative remains subject to definitive agreements and therefore does not represent secured funding.
The company’s next financial test will be converting its expanded supply commitments into delivered systems while protecting margins from higher memory and manufacturing costs. Investors will also watch whether the company can meet its $108 billion Q3 forecast without Data Center compute revenue from China.

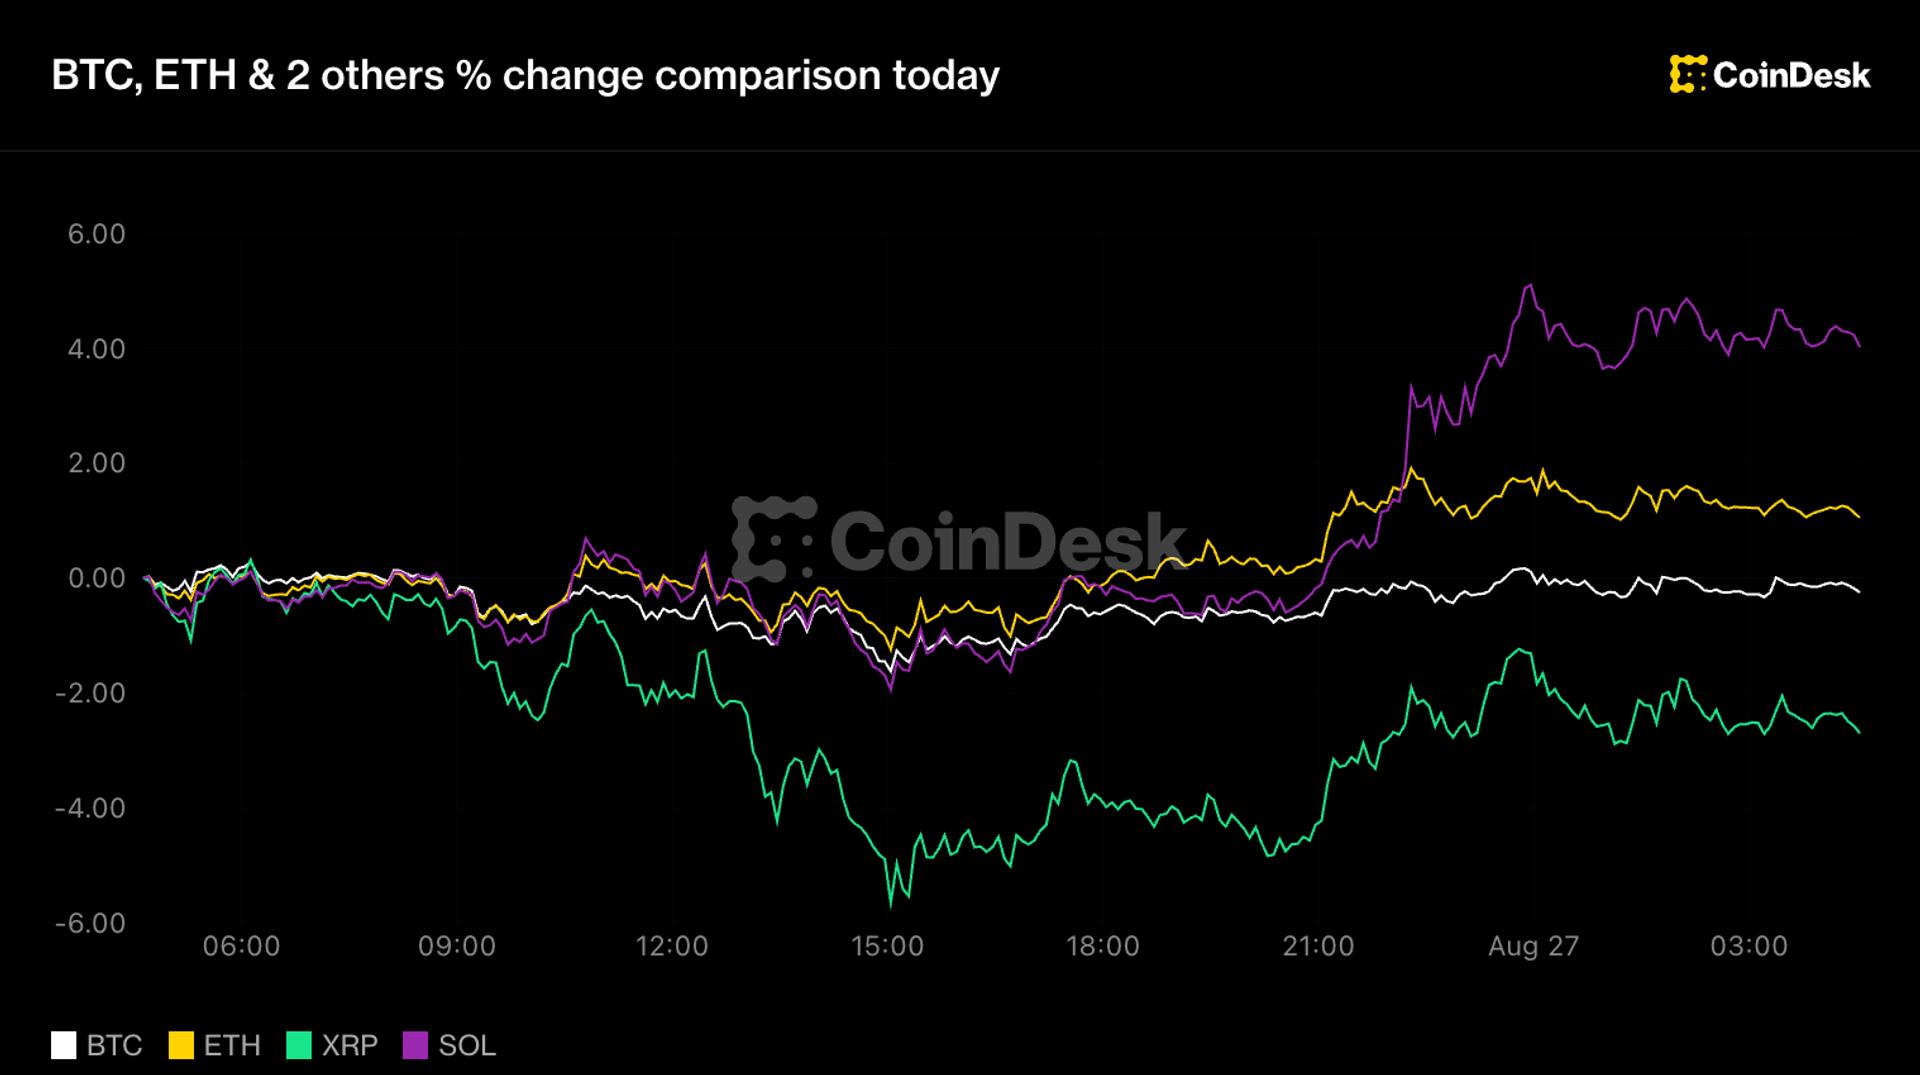
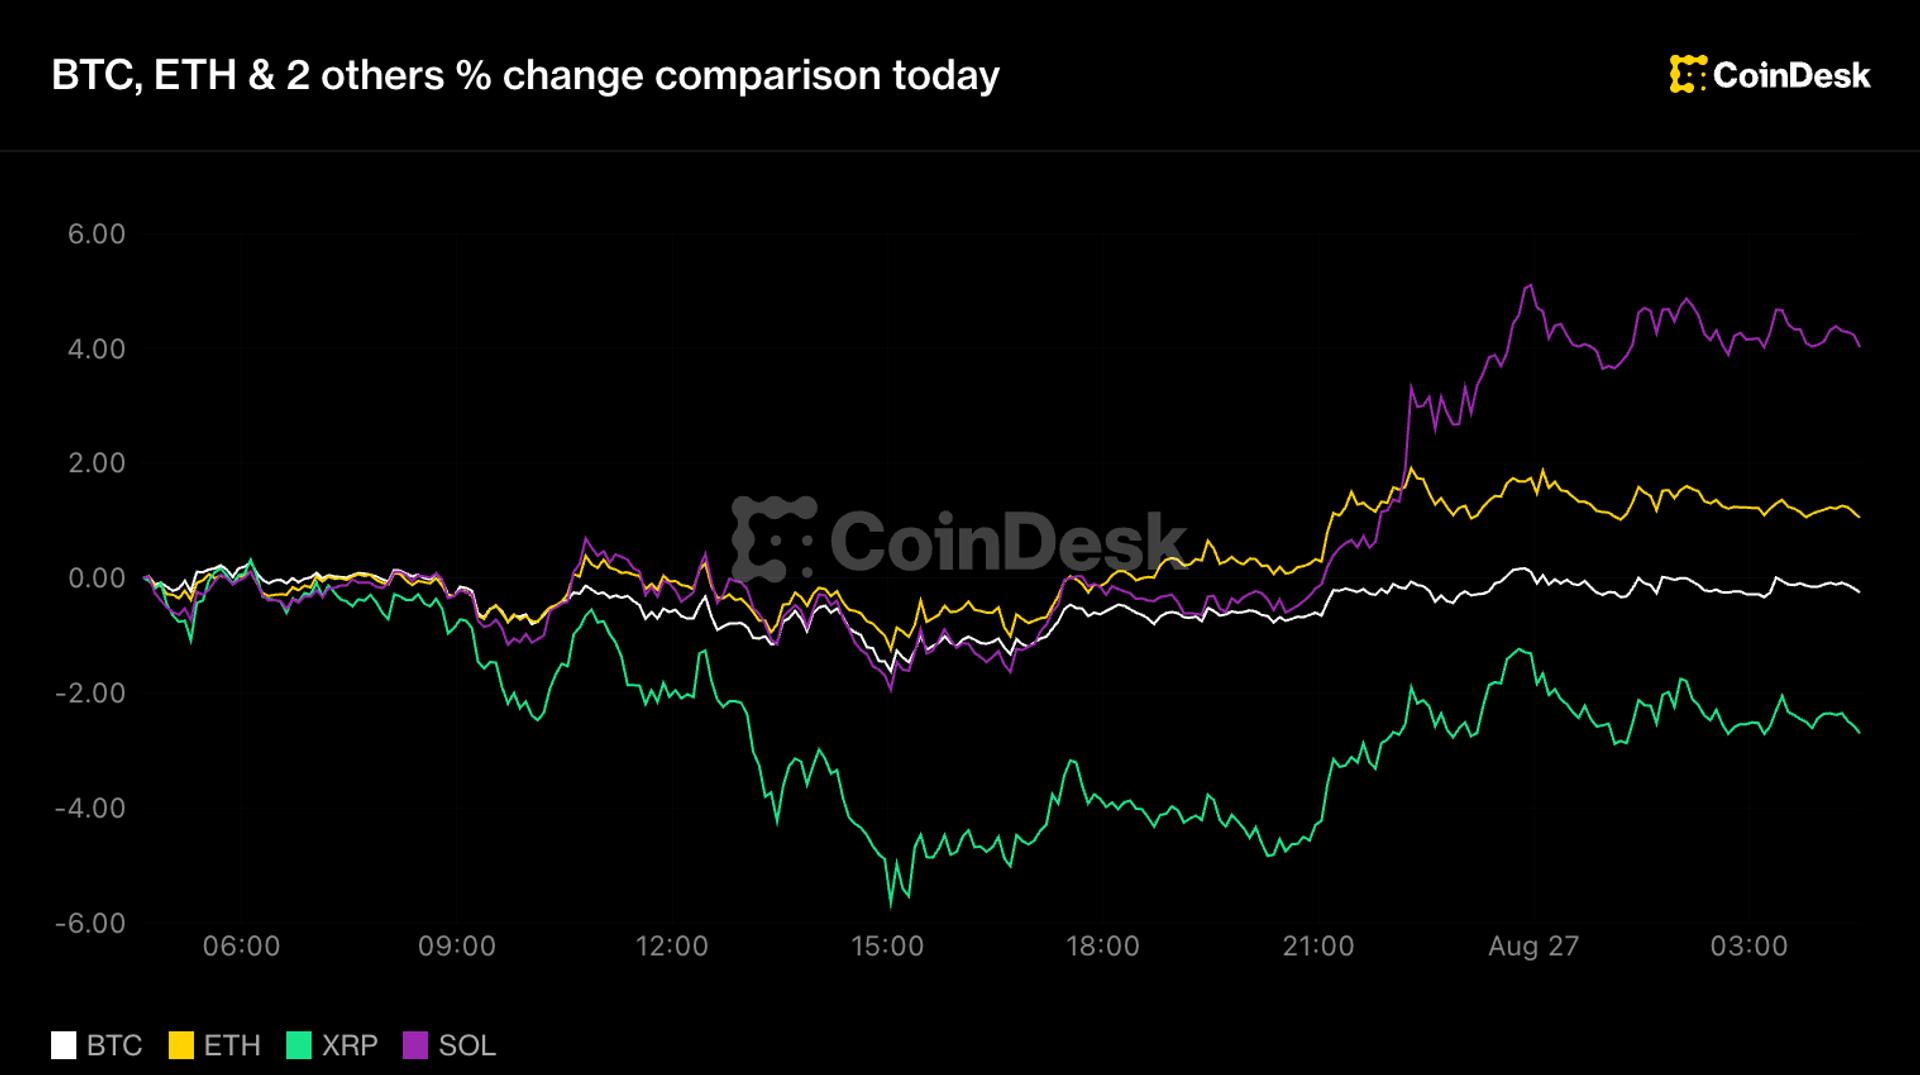
Every major token except solana and BNB is flat or lower over 24 hours, with bitcoin holding a 14% weekly gain and XRP 28%.

XRP briefly surged past $1.7 before stabilizing near $1.4. While the token appears to have hit a wall after a massive rally, whale withdrawals from Binance have surged to their highest level in six months.
According to the latest findings by CryptoQuant analyst Darkfost, more than 231 million XRP have moved off the exchange by large holders.
Whale Accumulation
The withdrawals totaled more than $335 million in a single day, far above the 90-day average of roughly $40 million. Darkfost described the move as both sudden and powerful compared with the recent trend, while pointing to a significant change in behavior among large XRP holders.
The surge in whale outflows comes as the crypto asset’s market capitalization increased by $25 billion over the past week, during which the token gained more than 40%.
According to the analyst, this trend has potentially helped fuel XRP’s strong market performance and renewed attention. If this accumulation trend continues, Darkfost said the asset could potentially test the $2 level within a relatively short period.
This week, Ali Martinez flagged a major jump in XRP network activity, after active addresses rose to 356,070 from 47,180. That represents a surge of well over 654%, a level of activity that typically suggests increased participation and can coincide with sharper price swings.
Trouble Ahead?
But the derivatives market showed short-term pressure for XRP after the token cleared liquidity around resistance and moved back toward a major support zone. Long liquidations were recorded at approximately $4.66 million, a 31.82% daily increase, while short liquidations stood near $1.13 million after rising 61.61%.
Despite the stronger percentage increase in short liquidations, the total volume of long liquidations is nearly four times larger. This indicates that the pullback following the recent rally forced a significant number of leveraged long positions out of the market, meaning that the sell-off was driven by both spot selling and the liquidation of leveraged positions.
While this confirms the current bearish pressure, the clearing of leveraged positions could eventually provide room for a healthier rebound, CryptoQuant explained.
Meanwhile, XRP’s Money Flow Index (MFI) has fallen to 35.89 from around 60, which points to a significant weakening in the buying pressure that supported the earlier price move. However, the MFI remains above 20, which means that the crypto asset has not yet entered technically oversold territory and could still face further downside.
The post Ripple (XRP) Whales Are Pulling Millions Off Binance: The $2 Level Is Back in Focus appeared first on CryptoPotato.
South Korean cryptocurrency exchange Upbit announced on Aug. 26 that it will add PolySwarm’s NCT token to its Korean won market.
Summary
- Upbit will open NCT/KRW trading at 9:00 p.m. KST on August 26, barring liquidity delays.
- NCT rose by over 200% over 24 hours before the scheduled Korean won market opened on Upbit.
- Upbit will waive standard NCT/KRW trading fees for the market’s first 24-hour period after launch.
- Ethereum is the only network Upbit currently supports for NCT deposits and withdrawals on launch.
- PolySwarm uses NCT to reward threat intelligence providers and provide access to security data services.
NCT/KRW trading is scheduled to begin at 9:00 p.m. Korea Standard Time.
The listing gives NCT a direct fiat trading route on South Korea’s largest crypto exchange by reported domestic volume. NCT already trades against Bitcoin on Upbit, with the exchange using that market’s previous closing price to set its initial KRW trading controls.
Upbit will open NCT/KRW with temporary restrictions
Upbit’s official notice listed NCT’s previous BTC market close at 0.00000006 BTC, equivalent to approximately 6.55 won. This figure serves as a reference for early order restrictions rather than a guaranteed opening price.
Buy orders will be blocked for approximately five minutes after trading begins. Sell orders priced 10% or more below the reference price will face the same restriction. Only limit orders will be available during the first two hours.
The exchange warned that the opening “may be postponed” if deposits and withdrawals do not produce sufficient liquidity. At the time of research, Upbit had not announced a delay, and the market remained scheduled to open at 9:00 p.m. KST.
These controls follow the structure used for other recent additions. As crypto.news reported, Upbit also restricted early orders after adding LIT to its Korean won market on Aug. 24.
NCT price jumps before the Upbit listing
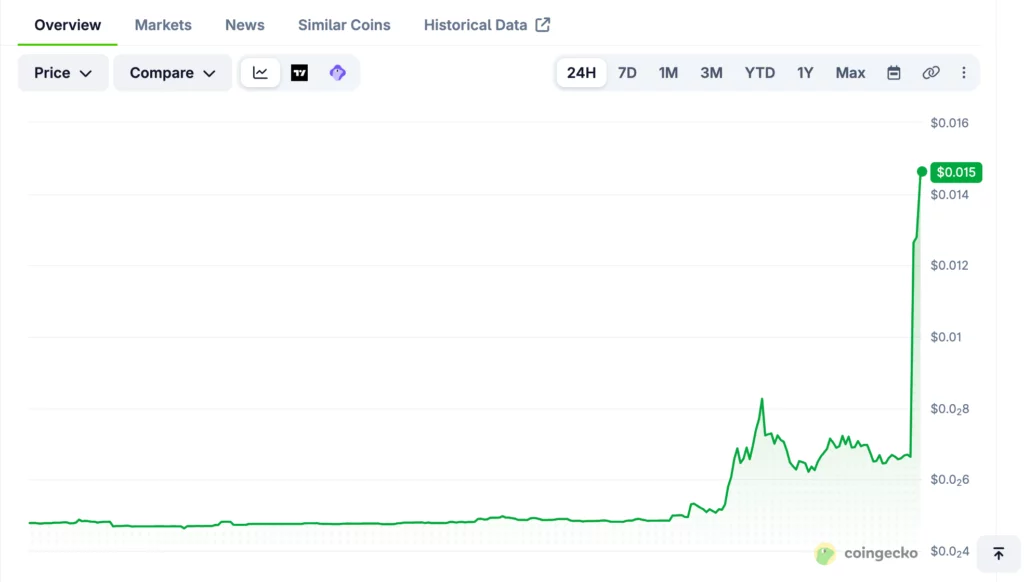
NCT recorded a sharp market response before the Korean won pair opened. The token traded near $0.0146 as of 7:43 p.m. KST, gaining approximately 200% over 24 hours, according to CoinGecko data.
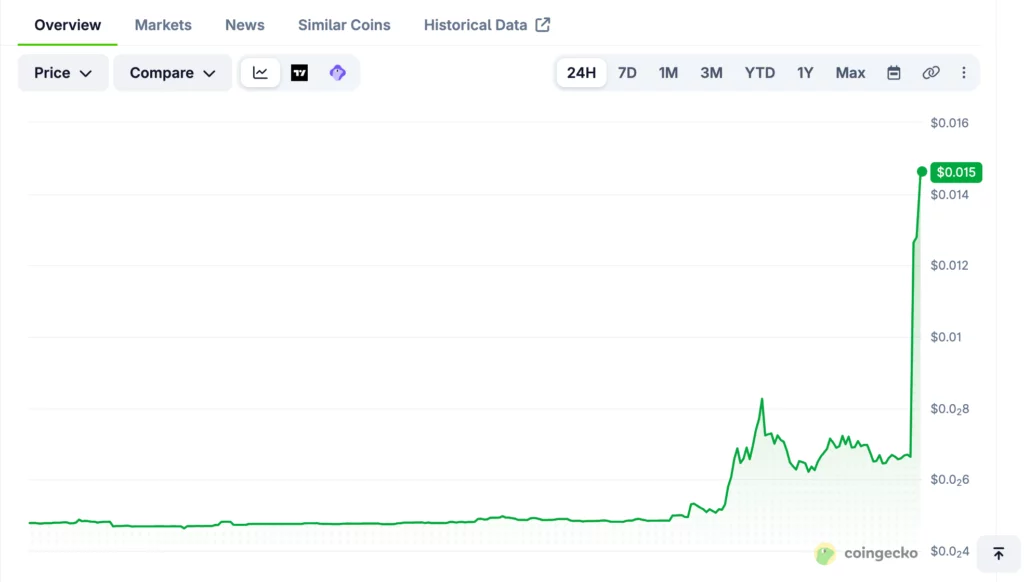
Its 24-hour trading volume reached about $15.36 million, while its market capitalization stood near $24.28 million. NCT traded between approximately $0.004626 and $0.01384 during the period.
The increase occurred after Upbit published its listing announcement, although market data alone cannot prove the exchange decision caused the entire move. NCT was also trading on Bithumb, Coinbase, Gate and smaller venues.
Korean exchange listings have previously coincided with sharp short-term price moves. In related coverage, Upbit’s decision to add three GRVT trading pairs was accompanied by a 23% increase before trading opened.
Upbit will waive NCT/KRW fees for 24 hours
Upbit will reduce its standard NCT/KRW trading fee from 0.05% to 0% during the market’s first 24 hours. The promotion is scheduled to run from 9:00 p.m. on Aug. 26 until 8:59:59 p.m. on Aug. 27.
If Upbit delays the listing, the zero-fee period will instead begin when trading opens. The waiver applies to standard order fees and does not remove the risks associated with rapid price changes or thin liquidity.
NCT deposits and withdrawals will be supported only through Ethereum. Upbit identified the supported contract as 0x9e46a38f5daabe8683e10793b06749eef7d733d1, matching the address shown by Etherscan and major market-data providers.
Transfers through unsupported networks may not be credited automatically. Upbit also requires customers to follow its Travel Rule and personal-wallet ownership verification requirements.
PolySwarm uses NCT in its malware marketplace
PolySwarm describes itself as a decentralized threat-intelligence marketplace. Security engines compete to identify malicious files and receive NCT based on their performance.
Project documentation states that NCT also provides access to threat intelligence generated through the platform. The ERC-20 token has a fixed maximum supply of approximately 1.886 billion NCT, with nearly all tokens reported as circulating.
Attention will now move to the NCT/KRW opening price, early trading volume and whether Upbit extends any restrictions. The zero-fee campaign is scheduled to end on Aug. 27 unless the exchange postpones the market launch.
Disclosure: This article does not represent investment advice. The content and materials featured on this page are for educational purposes only.


Havenex, an Austrian company advised by Sui co-founder Kostas “Kryptos” Chalkias, said on Aug. 26 that its Series A financing round was nearing completion as it pursued regulatory authorization.
Summary
- Havenex says its Series A is nearing completion, although funding size and investors remain undisclosed.
- Havenex is seeking Austrian FMA authorization and cannot provide regulated services before formally receiving approval.
- The platform targets professional institutions offering digital and traditional assets through white-label financial infrastructure services.
- Kostas Chalkias advises Havenex and serves on its supervisory board while remaining with Mysten Labs.
- Havenex proposes continuous solvency proofs, multisignature custody and quantum-resistant keys, but these remain unverified publicly.
Chalkias announced the project through an X post. He described Havenex as infrastructure for financial institutions offering digital and traditional financial assets. The company has not disclosed the round’s size, participating investors, valuation or expected closing date.
Havenex awaits Austrian regulatory authorization
Havenex’s website says the platform is undergoing authorization with Austria’s Financial Market Authority. The company also states that it cannot provide regulated services before receiving approval.
That distinction means Havenex should not yet be described as a licensed exchange. No public authorization number or regulatory approval appears on its website. Chalkias said the company had applied for every required license and some additional permissions, but he did not identify individual license categories.
Havenex AG lists a registered address in Vienna and Austrian company registration number FN 673083d. Its public disclosures identify Gregorios Siourounis as the management board member. Chalkias, Adeniyi Abiodun and Petros Pyloridis sit on the supervisory board.
The company describes its intended customers as professional and institutional clients. Its approval process will determine which services it can provide, the assets it can support and whether it can operate across the European Economic Area.
Series A details remain undisclosed
Chalkias said the Series A allocation was already “quite packed” and invited interested investors to contact him. That statement remains a fundraising update from an adviser rather than confirmation of a completed transaction.
“Series A is underway and closing soon,” Chalkias said.
Havenex has not released supporting documents naming investors or specifying committed capital. It has also not announced a closing deadline. Until the company completes the round, its financing terms remain subject to change.
Chalkias said Havenex originated from his idea but clarified that he would participate as an adviser. He said his main focus would remain Mysten Labs and Sui. His formal position on Havenex’s supervisory board gives him an oversight role, while Siourounis appears responsible for management.
Havenex proposes verifiable institutional custody
Havenex plans to provide white-label infrastructure through which banks and other financial companies could offer crypto and traditional assets. Its proposed services include trading, custody, staking, tokenization, settlement and wallet infrastructure.
The project says it will support verifiable custody, continuous proof of solvency, multisignature controls and hardware-based two-factor authentication. It also plans self-custody and key-recovery protections.
Chalkias called Havenex the “most transparent, safest, institutional-grade, fully regulated exchange possible.”
Those descriptions express the project’s objectives. Havenex has not published an independent security audit, a live proof-of-solvency system, custody addresses or technical documentation demonstrating the planned controls. There is therefore no public on-chain data available to verify the proposed solvency model.
Institutional custody providers are increasingly combining controlled asset storage with blockchain services. As crypto.news reported, HashKey Cloud and BitGo connected institutional staking while keeping customer assets within BitGo’s custody framework.
Sui will form only part of Havenex’s technology
Chalkias said Havenex would use Sui technology where appropriate, but the platform would not operate as a Sui-only exchange. It plans to integrate assets, infrastructure and bridges from multiple blockchain ecosystems.
The promised quantum-resistant key system could connect with Sui’s wider cryptographic work. In related coverage, Sui targeted a 2027 rollout for native quantum-safe account authentication using NIST-approved signature schemes.
However, Havenex has not identified which post-quantum standard it will implement or when the feature will become available. Its use of Sui, bridges and real-world assets also remains under development.
The next verifiable milestones will be an FMA authorization, final Series A disclosures and detailed technical documentation. A launch date has not been announced. Until authorization arrives, Havenex will remain a development-stage infrastructure provider rather than an operating regulated exchange.
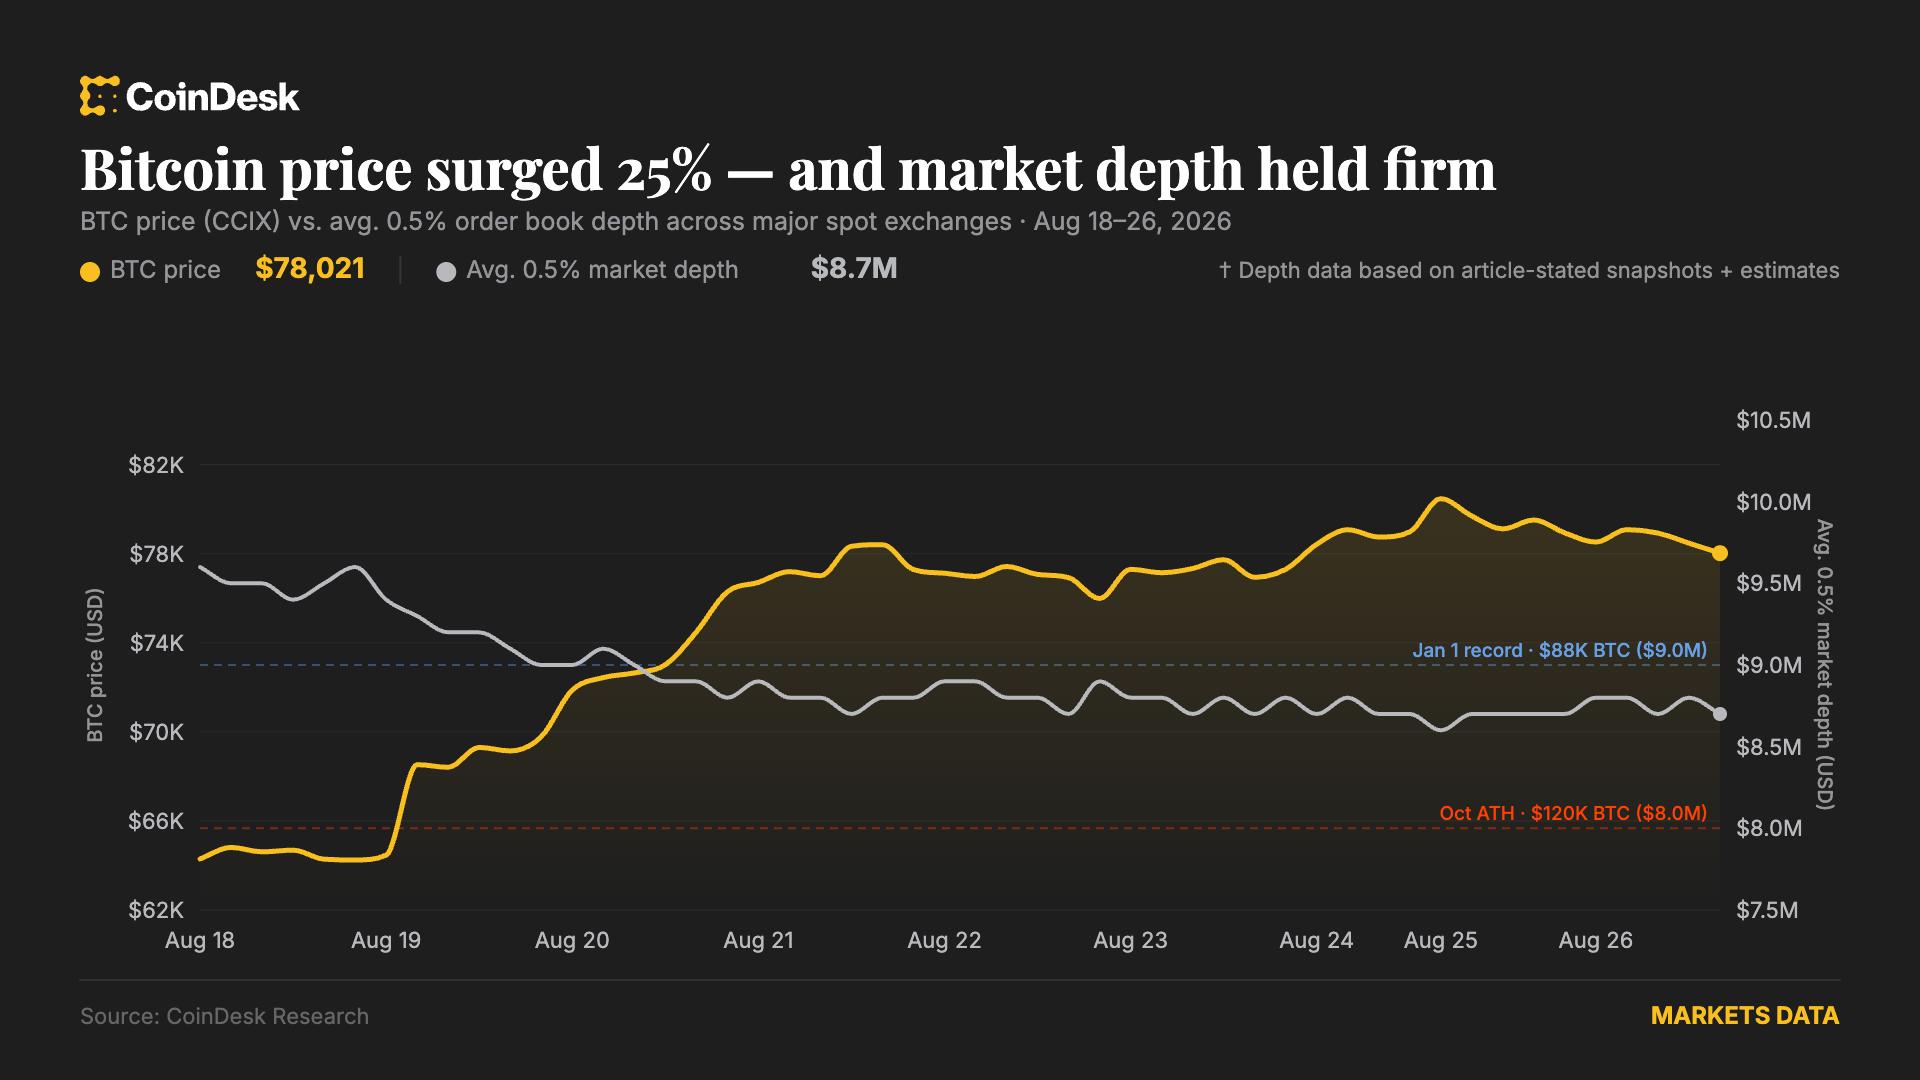
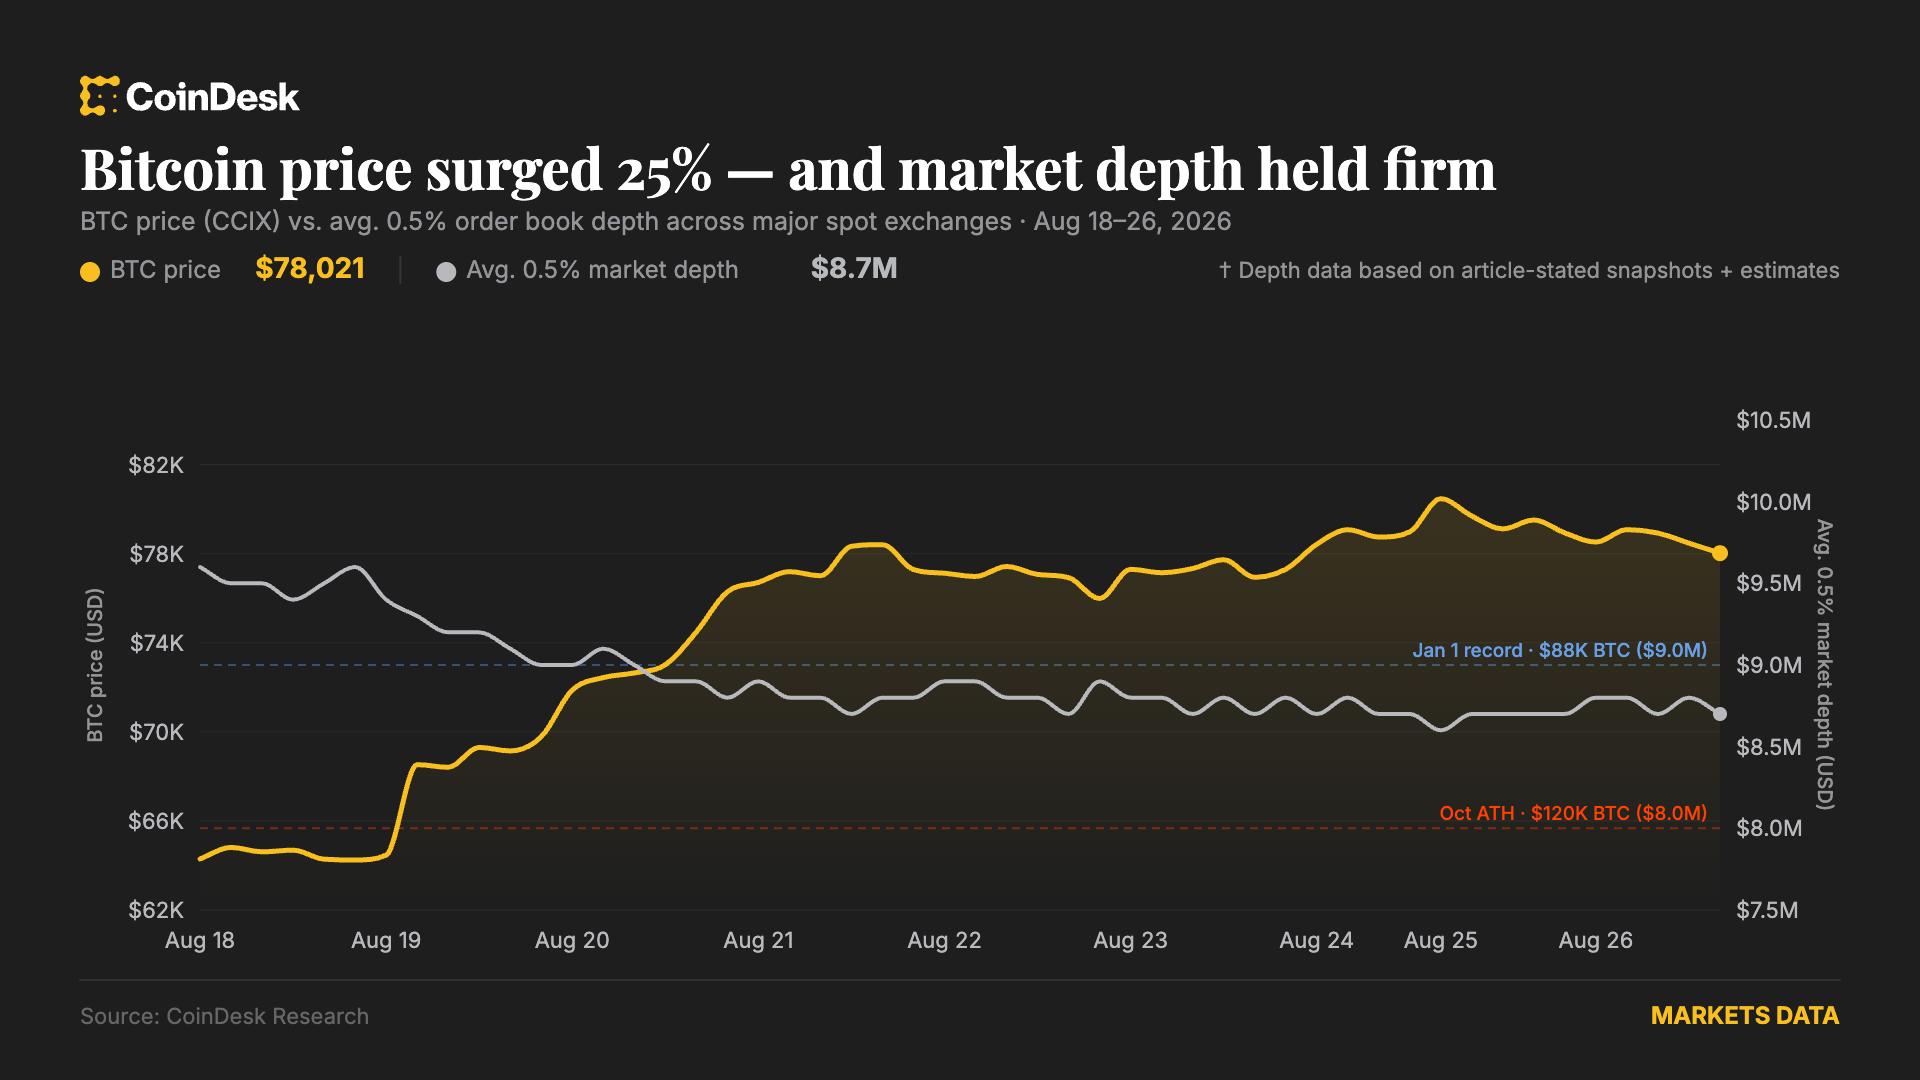
An indicator fundamental to understanding whether capital consistently moved in size to push prices higher is flashing green.
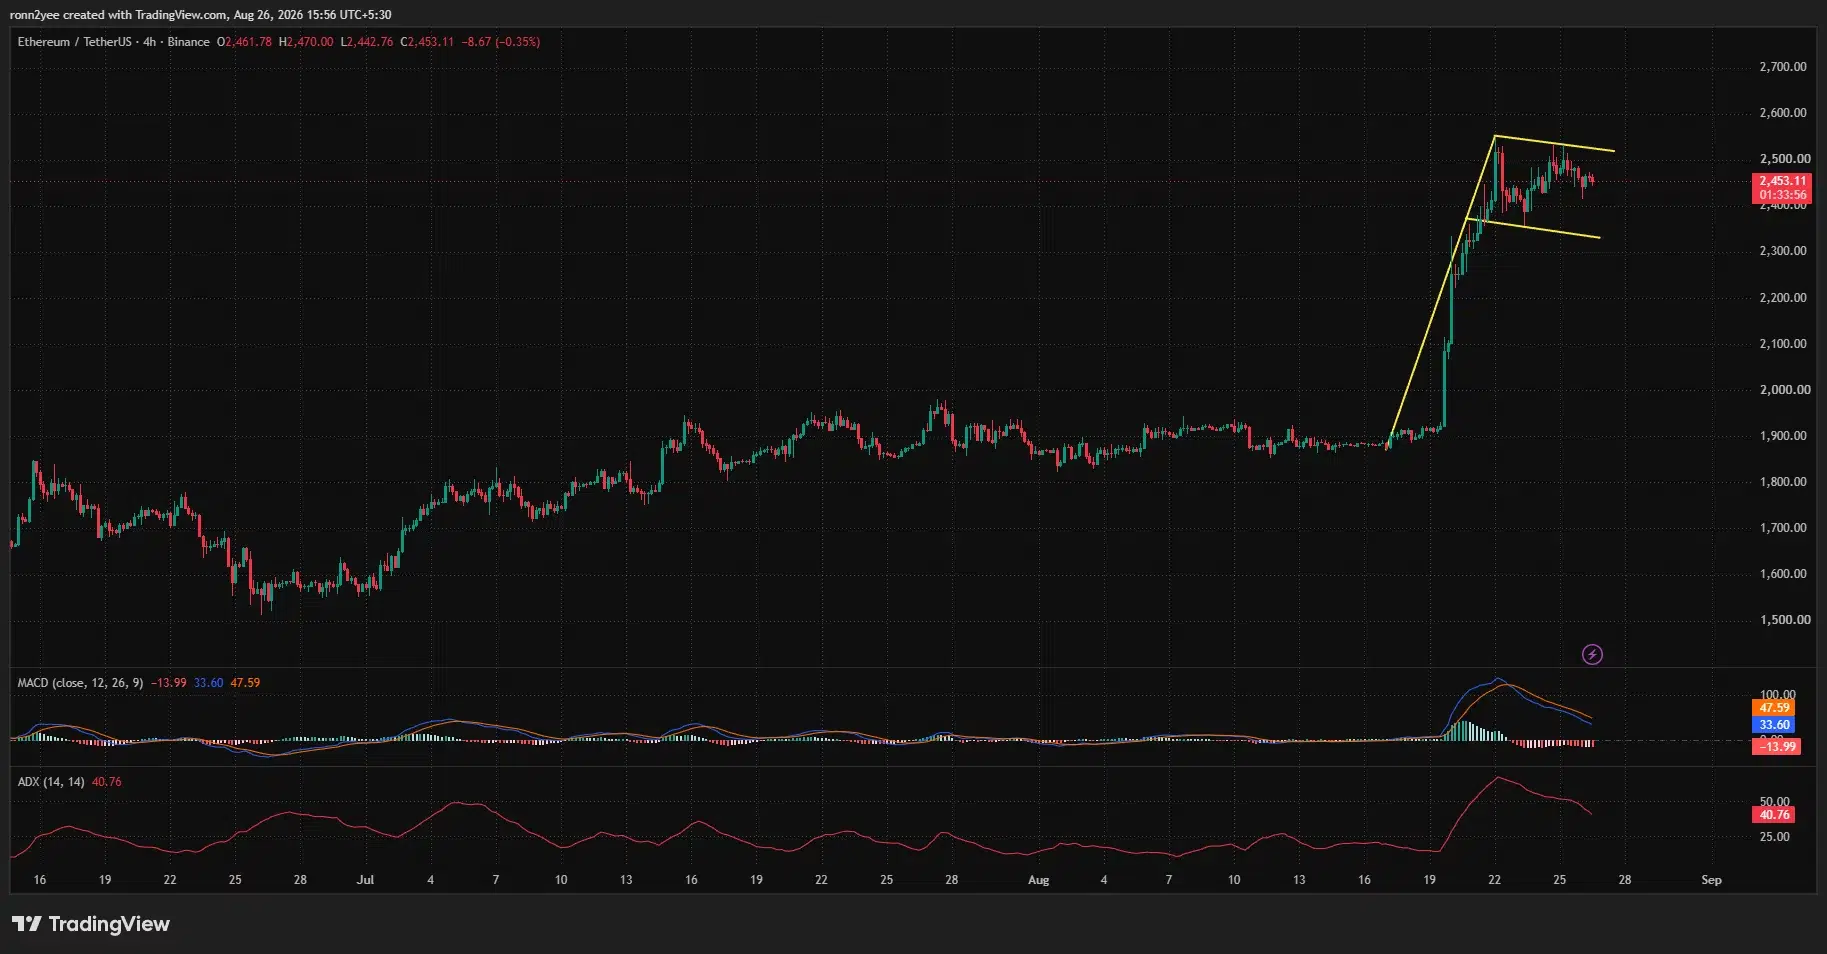
Ethereum price traded near $2,450 on Aug. 26 after a sharp weekly rally stalled below $2,550, while its 4-hour chart formed a potential bull flag that could decide the next major move.
Summary
- Ethereum price remains around $2,450 after reaching a seven-day high near $2,546.
- A 4-hour bull flag places immediate resistance between $2,500 and $2,550.
- Daily RSI has reached 75.59, showing strong but overextended momentum.
- CoinGlass data shows major liquidation clusters near $2,550 and $2,300.
Ethereum price consolidates after its weekly surge
According to data from crypto.news, Ethereum (ETH) price was trading at $2,452 at the time of writing, holding most of the gains produced by last week’s sharp breakout.
ETH opened at $2,251.44 on Aug. 20 and rose to an intraday high of $2,545.88 the following day. Its move from the Aug. 20 opening price to the weekly high represented a gain of about 13%.
The advance becomes larger when measured from the consolidation zone near $1,900 that preceded the breakout. Ethereum gained nearly 34% between that level and the weekly peak before buyers and sellers reached a temporary balance.
Price has since remained largely between $2,400 and $2,500. That tight range shows that traders have not fully reversed the rally despite the failure to extend above $2,550.
The recovery also marked a clear shift from Ethereum’s earlier weakness. ETH had spent much of August moving sideways below $1,950 before breaking through $2,000 and accelerating toward $2,500.
US investors are also watching broader liquidity conditions after falling bond yields supported a recovery across risk assets. Crypto traders will now assess whether those conditions can sustain spot demand after the initial rally and market-wide short squeeze.
Ethereum bull flag points to $2,550 resistance
The 4-hour ETH/USDT chart shows price consolidating within a downward-sloping channel following its near-vertical move from approximately $1,900.
Such a structure can develop into a bull flag when it follows a strong advance. Confirmation would require Ethereum to close above the channel’s upper boundary, currently located around $2,510 to $2,530.
A successful breakout would bring the recent $2,546 high into focus. Buyers would then need to establish support above $2,550 before targeting higher levels.
Crypto analyst Ted Pillows identified the same area as the main barrier to another leg higher. In an Aug. 26 post on X, Pillows said Ethereum needed a weekly close above $2,550 to open a possible move toward $3,000.
The $3,000 target is not confirmed by the current chart because ETH remains below the breakout level. A weekly rejection around $2,500 to $2,550 could instead keep the price inside its short-term consolidation pattern.
The lower boundary of the 4-hour flag currently sits between $2,330 and $2,360. A break below that area would weaken the continuation setup and raise the probability of a deeper pullback.
Momentum cools as daily RSI reaches 75
Ethereum’s daily chart remains bullish, but its momentum readings show that the rally has become stretched.
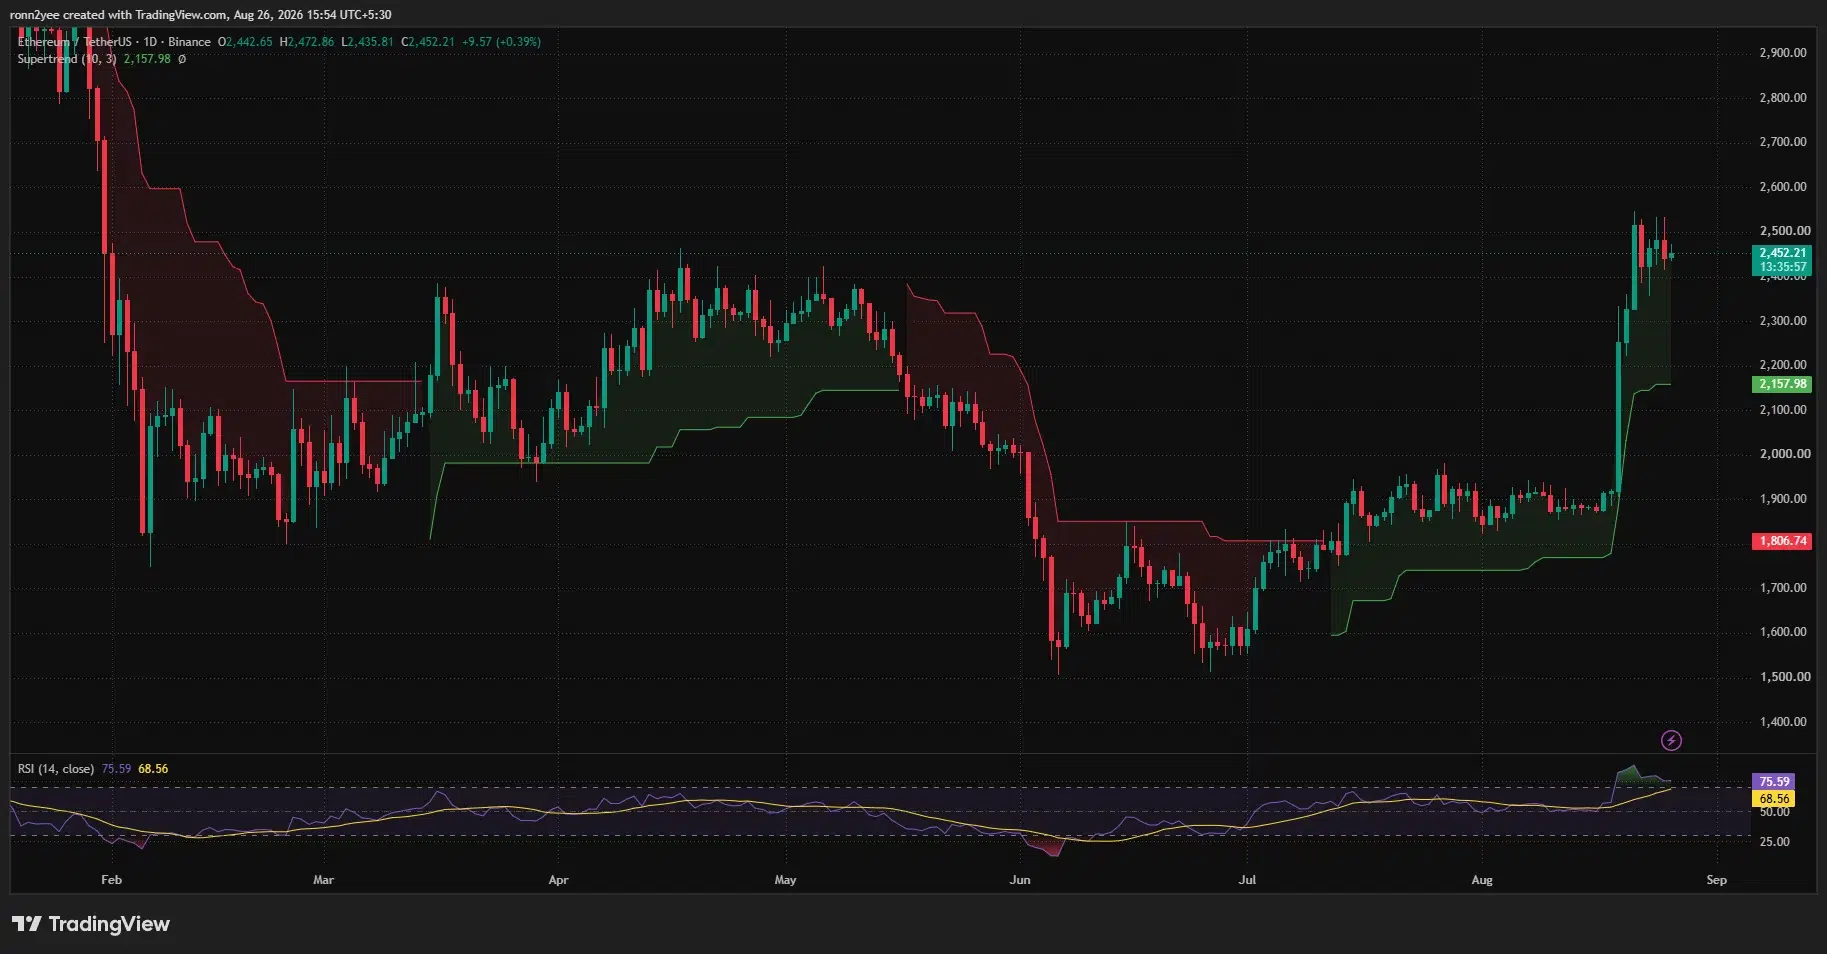
The daily Relative Strength Index stood at 75.59, above the commonly watched overbought threshold of 70. Its RSI moving average was lower at 68.56.
An overbought RSI does not guarantee that the price will fall. It shows that buying accelerated quickly and that Ethereum may require consolidation or a pullback before attempting another sustained advance.
The Supertrend indicator remains positive and places broader trend support at approximately $2,158. ETH is trading almost 14% above that level, leaving room for a correction without fully reversing the daily bullish structure.
Shorter-term momentum has already started to weaken. On the 4-hour chart, the Moving Average Convergence Divergence line stood at 33.60, below its signal line at 47.59. The histogram had fallen to negative 13.99, reflecting slowing momentum after the initial breakout.
The Average Directional Index remained elevated at 40.76, which indicates that the preceding trend was strong. However, the ADX has turned lower from its recent peak, adding evidence that the rapid advance is losing force while ETH trades sideways.
Together, the indicators suggest that Ethereum’s larger recovery remains intact, but the next move may depend on whether buyers can absorb profit-taking above $2,500.
Liquidation clusters frame Ethereum’s next move
CoinGlass’ one-week Ethereum liquidation heatmap shows substantial leveraged positions on both sides of the current price.
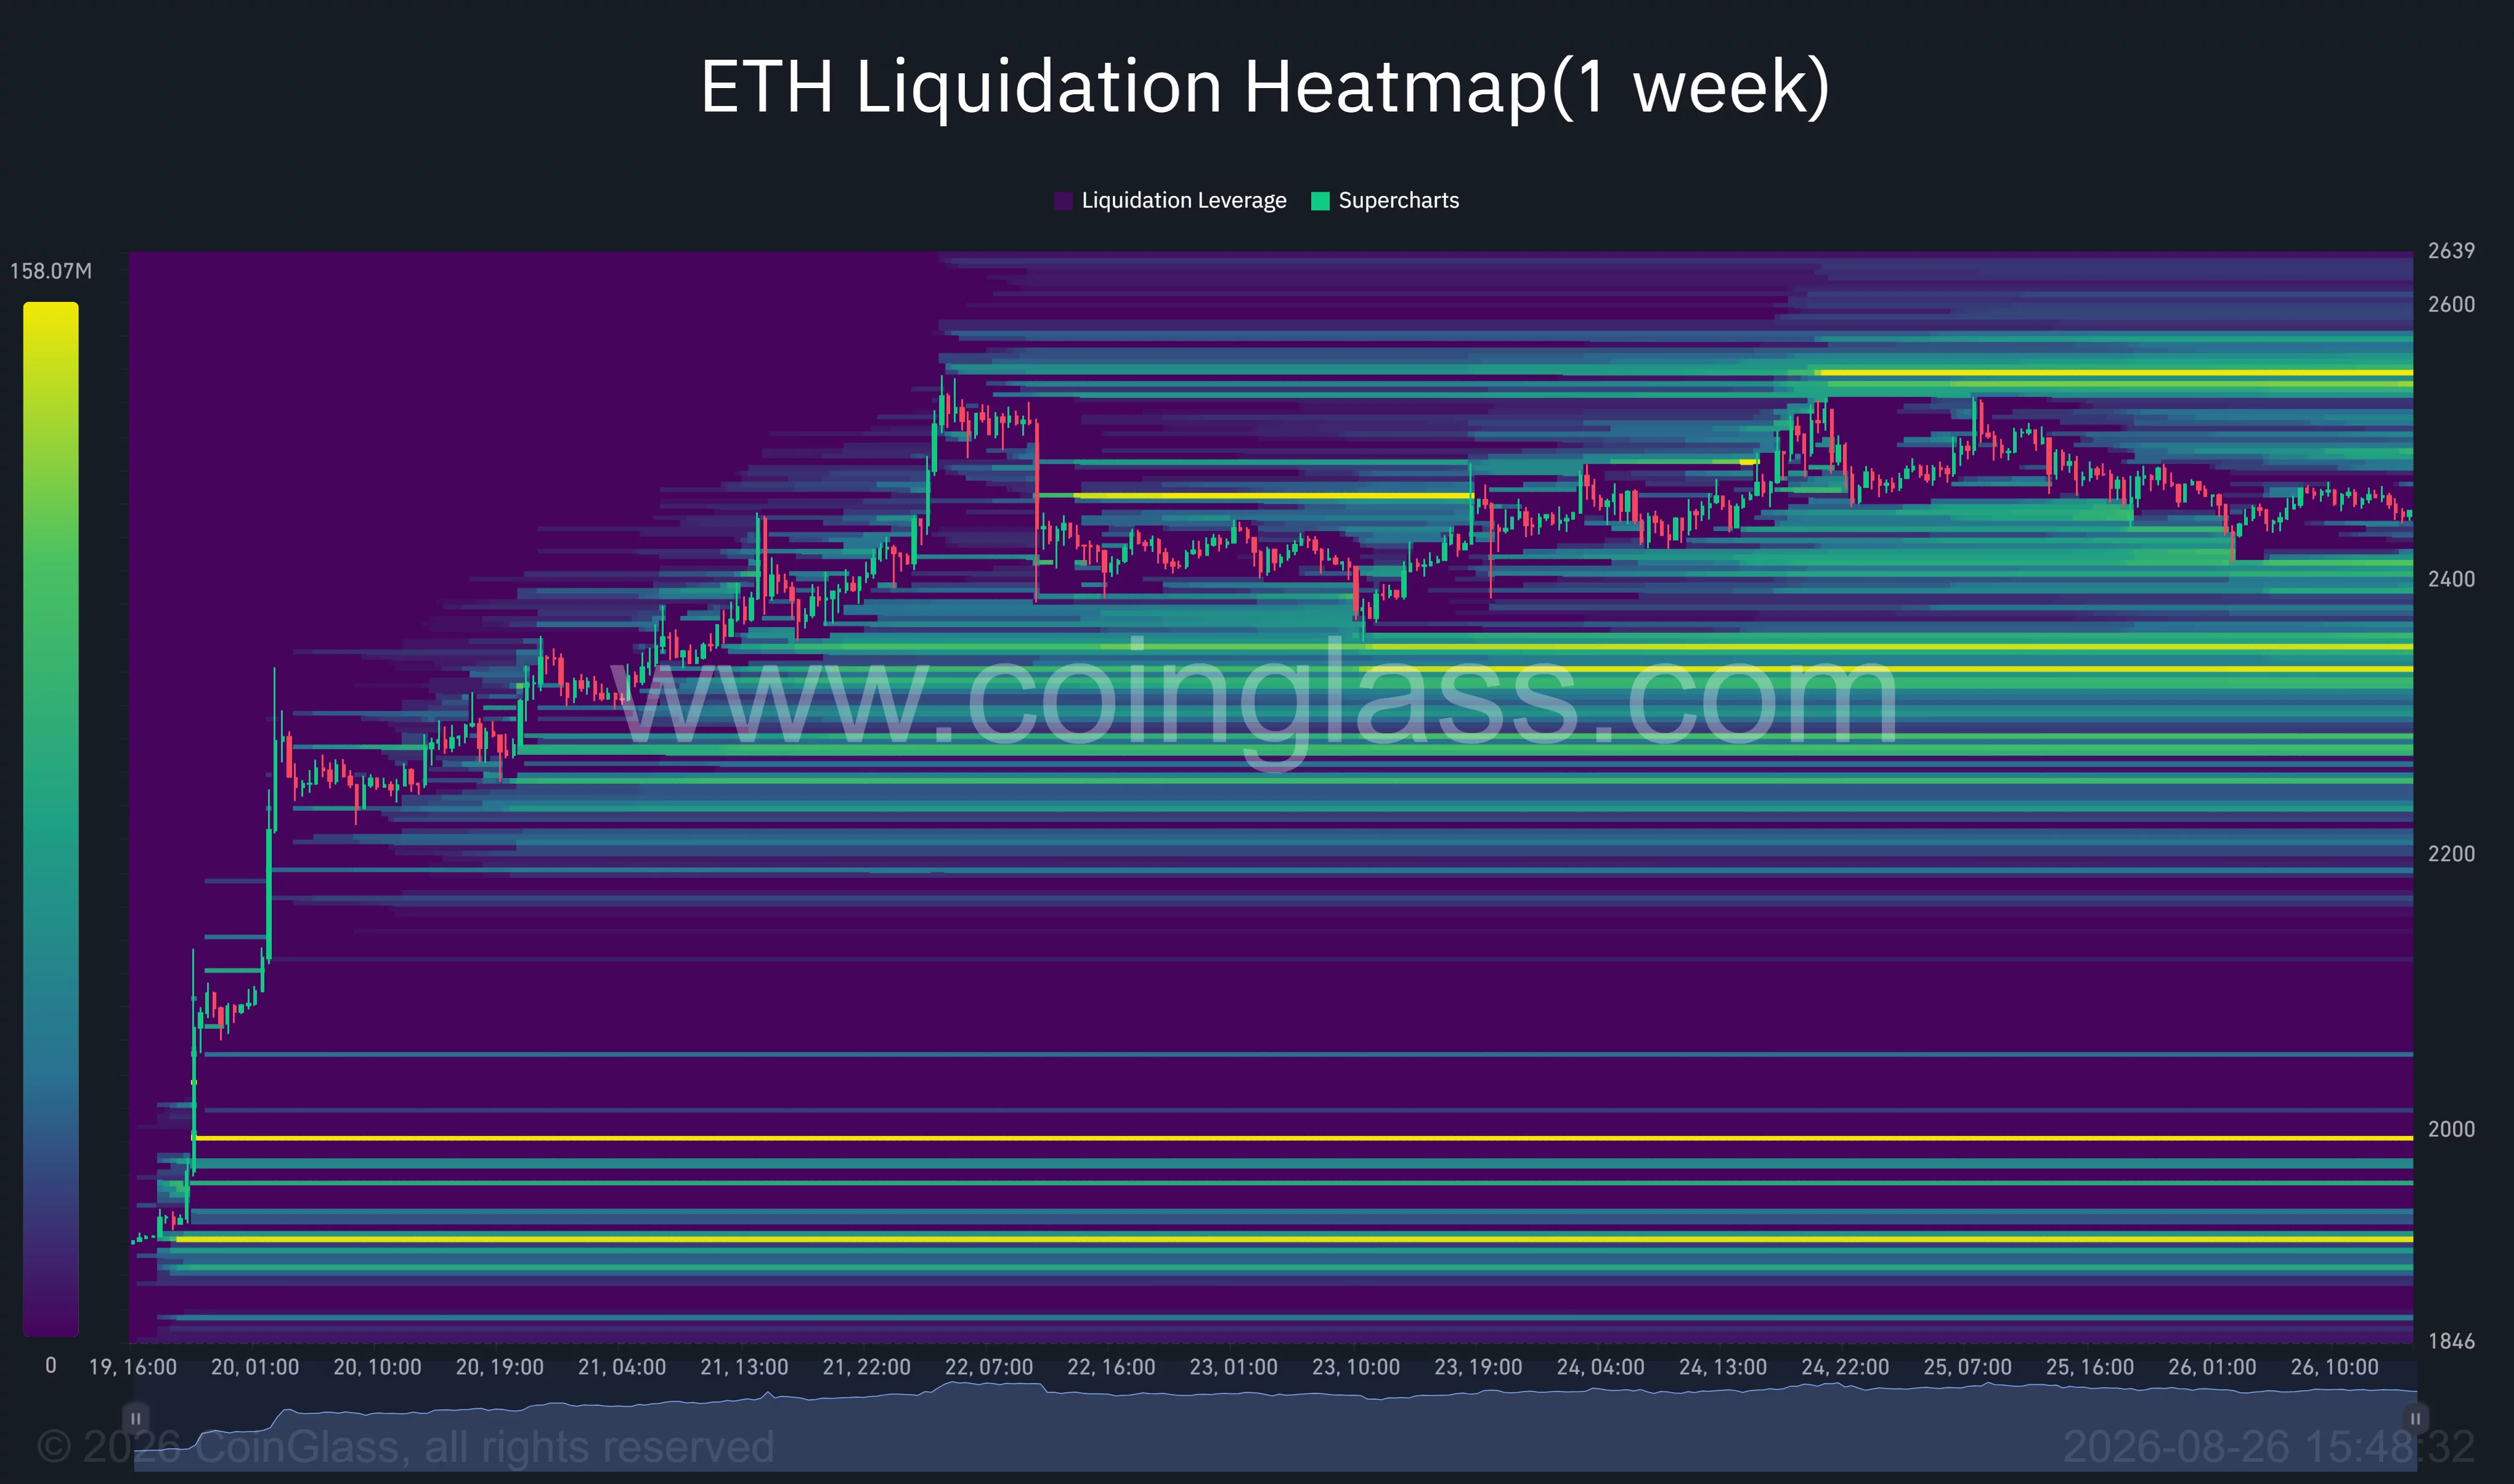
The nearest major pool above Ethereum appears to be around $2,530 to $2,560. A move into that zone could force leveraged short positions to close, potentially adding buying pressure as ETH retests its weekly high.
The heatmap’s brightest band above the market sits close to $2,550, aligning with the technical resistance identified on the price charts. That overlap makes the level important for both spot and derivatives traders.
A larger downside liquidity cluster is visible around $2,300 to $2,330. If Ethereum loses $2,400 and the lower edge of its flag, price could move toward that area as long positions face liquidation pressure.
Additional liquidity is distributed near $2,200, while larger but more distant clusters appear around $2,000 and $1,900. Those lower levels would become relevant only if ETH loses its newly established daily trend support.
Analyst Michaël van de Poppe said on Aug. 26 that an attractive area to buy an Ethereum dip could be approaching. His chart placed the potential demand region below the current price, broadly matching the support visible between approximately $2,300 and $2,400.
Ethereum therefore faces two clear short-term scenarios. A close above $2,550 would confirm renewed strength and could support an expansion toward higher resistance, while a loss of $2,330 would invalidate the 4-hour bull flag and expose the Supertrend support near $2,158.
Until either boundary breaks, ETH is likely to remain in consolidation as traders decide whether the seven-day rally has enough demand for another leg higher.
Disclosure: This article does not represent investment advice. The content and materials featured on this page are for educational purposes only.
Seven spot funds now hold nearly a billion tokens. Daily volume broke $125 million on August 20, then $200 million across three sessions by the weekend. The infrastructure is scaling faster than the market has priced.
Summary
- Bitwise’s XRP ETF recorded $125 million in single day trading volume on August 20, 2026, beating the prior record by 42 percent and pushing three day cumulative volume past $200 million by August 24.
- Cumulative net inflows across all seven United States spot XRP ETFs reached $1.57 billion as of August 24, with August alone contributing $56.86 million, more than double July’s $27.29 million.
- Whale addresses holding between one million and ten million XRP accumulated 380 million tokens in a single week, lifting aggregate whale holdings from 16.05 billion to 16.36 billion XRP.
- XRP futures open interest rose 27 percent in seven days to $3.50 billion, followed by $33 million in short liquidations on August 20 and then a $500 million long liquidation cascade two days later.
- Goldman Sachs disclosed $86.5 million across five spot XRP ETFs in its Q2 2026 filing after reporting zero XRP ETF exposure at the end of Q1.
Seven exchange traded funds, seven issuers, and a fee war that has pushed expense ratios to levels the bitcoin ETF market took months to reach. The trading volume record on August 20 did not arrive in isolation. It came alongside the largest weekly inflow since May, a whale accumulation wave visible on the XRP Ledger, and a derivatives market that swung from a short squeeze to a long liquidation inside 48 hours. The infrastructure around XRP is no longer aspirational. It is operational, measurable, and growing faster than the token’s price suggests.
Seven funds and the fee war that followed
The United States now hosts seven spot XRP exchange traded funds: Bitwise XRP, Canary Capital XRPC, Franklin Templeton XRPZ, Grayscale GXRP, REX Osprey XRPR, 21Shares TOXR, and ProShares XRPL. All trade on major exchanges including NYSE, NYSE Arca, Nasdaq, and Cboe. Franklin Templeton’s XRPZ carries a 0.19 percent expense ratio, the lowest base fee in spot crypto ETF history. Bitwise charges between 0.25 and 0.34 percent depending on the fee waiver schedule. Grayscale sits at 0.35 percent and 21Shares at 0.39 percent. The compression is notable because bitcoin spot ETFs took roughly four months of competitive pressure before fees settled into a similar range. XRP funds arrived there within weeks of launch. By cumulative net inflows, Bitwise leads at $542 million, followed by Canary Capital at $468 million and Franklin Templeton at $434 million. Combined, the seven funds hold approximately 995 million XRP tokens with $994 million in assets under management. The gap between cumulative inflows ($1.57 billion) and current assets ($994 million) reflects the token’s price decline from its post launch levels, not redemptions. Money came in and stayed.
How the inflow pattern changed in August
The monthly trajectory tells a clearer story than any single day. July 2026 closed with $27.29 million in total XRP ETF inflows, a respectable but unremarkable figure spread unevenly across weeks. The first week of August actually saw net outflows. Weekly flows for the period ending August 8 collapsed 93 percent from the prior week, dropping from $14.86 million to just $1.01 million. Then the reversal began. Franklin Templeton and Bitwise injected a combined $3.45 million on August 7, reversing the first outflow in a month. By the week ending August 17, inflows had climbed back to $18.38 million in a single day, the best daily figure since May 14. The week ending August 22 delivered $39.78 million, the strongest weekly result in three months. August’s total of $56.86 million more than doubled July’s full month figure with a week still remaining. The acceleration was not gradual. It was a step function that arrived in the third week of August and held through the flash crash on August 22. Flows did not reverse after the crash. That detail separates this inflow pattern from previous episodes where leveraged liquidations triggered institutional redemptions.
The volume record and what drove it
On August 20, XRP ETF trading volume reached $125 million in a single session, surpassing the prior all time high by 42 percent. Bitwise President Teddy Fusaro confirmed the figure publicly. By August 24, Bitwise’s fund alone had cleared $200 million across three consecutive sessions, with individual days exceeding $60 million and $80 million before the $125 million peak. The volume spike coincided with three events. First, the United States Treasury doubled its bond buyback operations on August 19, easing pressure on long end interest rates and triggering a broad risk asset rally. Second, Ripple CEO Brad Garlinghouse appeared at the Wyoming Blockchain Symposium alongside SEC Chairman Paul Atkins, generating speculation about regulatory clarity. Third, spot XRP ETFs recorded $39.78 million in net inflows for the week, their strongest result since May. For context, XRP ETF volume had previously occupied a marginal share of daily crypto ETF trading. On August 20, XRP captured roughly 6 percent of total volume across all Bitwise crypto products, which recorded $300 million combined. That share had been below 2 percent for most of July. A three fold increase in market share within a single asset class, sustained over multiple sessions, points to a rotation rather than a one day anomaly. The volume profile also matters. High volume with narrow bid ask spreads indicates institutional participation. Market makers widen spreads during retail driven spikes and tighten them when larger counterparties are active. The August 20 session saw tighter spreads than the prior volume record, according to market structure data, suggesting the incremental volume came from institutional desks instead of retail traders reacting to price momentum. Volume without inflows is noise. Volume with inflows is positioning. The August 20 session had both.
Whale accumulation at scale
Addresses holding between one million and ten million XRP accumulated approximately 380 million tokens during the week of August 18, according to on chain data tracked by multiple analytics platforms. Total holdings in that bracket rose from 16.05 billion to 16.36 billion XRP. More than 38 transactions exceeding $1 million were recorded on the XRP Ledger in a single 24 hour window. Whale transactions above $1 million surged 280 percent in that period. The accumulation happened while XRP hovered near $1, well before the token’s move to $1.23 on August 20. When large holders buy aggressively at flat prices, the market has not yet repriced whatever those holders expect. The timing matters. Whale buying aligned with ETF inflows for the first time in 2026, according to Yellow.com’s analysis. Previous accumulation phases occurred during periods of ETF outflows or flat institutional interest. This time, on chain buying and ETF inflows moved in the same direction. The concentration is also notable. The one million to ten million XRP bracket represents a specific type of holder: too large to be retail, too small to be Ripple itself or an exchange cold wallet. These are funds, trading desks, and high net worth individuals operating at a scale where each position reflects a researched thesis. When that bracket adds 380 million tokens in seven days, the aggregate signal carries more weight than any individual whale wallet. The accumulation also coincided with Ripple CEO Brad Garlinghouse’s appearance at the Wyoming Blockchain Symposium on August 18, where he appeared alongside SEC Chairman Paul Atkins. The event generated no formal policy announcement, but the optics of a crypto CEO sharing a stage with the SEC chairman at a conference adjacent to Jackson Hole carries its own signal. Whale buyers who moved within 48 hours of that appearance were either acting on public sentiment or on information asymmetry that the broader market had not yet priced. Either interpretation supports the thesis that large holders saw something the price did not yet reflect.
The derivatives whiplash
XRP futures open interest rose from $2.71 billion to $3.50 billion over the seven days through August 22, a 27 percent increase that pushed XRP into the top four crypto derivatives by open interest, overtaking HYPE. Binance XRP futures open interest reached 435 million tokens, a 30 day high. On August 20, $33 million in short positions were liquidated as XRP reclaimed $1.30 for the first time since early June. The largest single liquidation was $15.61 million. Long to short ratios on Binance hit 2.18 and reached 23.38 on OKX in one snapshot, indicating extreme bullish positioning. Two days later, the leverage unwound violently. XRP suffered a 37 percent flash crash on August 22 as roughly $500 million in leveraged long positions were liquidated across the crypto market. XRP was among the hardest hit assets, having rallied more than 60 percent in the preceding week, leaving traders dangerously overexposed. The sequence is instructive. The spot infrastructure (ETF inflows, whale accumulation) was building steadily. The derivatives market amplified that signal with leverage, then snapped. The spot flows did not reverse. August ETF inflows continued positive after the crash. The divergence between spot and derivatives behavior reveals two separate markets operating on different time horizons. Spot ETF buyers and whale accumulators are positioning for months or quarters. Derivatives traders were positioning for days. The crash punished the short term cohort while leaving the long term infrastructure intact. Understanding which market you are watching matters more than watching both at once. Open interest has since rebuilt toward pre crash levels, suggesting the derivatives market has not been scared away permanently. But the composition has shifted. Long to short ratios on Binance fell from 2.18 to roughly 1.4 after the crash, indicating a more balanced positioning. A leveraged market with balanced positioning tends to produce smaller swings than one skewed heavily in either direction.
Ripple’s corporate infrastructure beyond the token
The ETF story does not exist in isolation from Ripple’s corporate activity. RLUSD, Ripple’s dollar backed stablecoin, crossed $2 billion in market cap during August 2026. A Clearpool and Cicada credit fund now operates on the XRP Ledger using RLUSD as institutional lending collateral, marking the first institutional credit product built directly on XRPL infrastructure. JPMorgan’s Kinexys platform completed a live cross border tokenized Treasury redemption on the XRP Ledger in under five seconds during the same period. The transaction settled an actual United States Treasury instrument across borders using XRPL rails, not a test environment or sandbox. When a bank the size of JPMorgan settles real instruments on a public ledger, the infrastructure argument moves from theoretical to operational. Nearly $1 billion of RLUSD supply now sits on the XRP Ledger directly, with the remainder on Ethereum. The growth of a stablecoin ecosystem on XRPL creates a secondary reason for institutional interest in XRP beyond price speculation. ETF buyers may be pricing in not just the token’s value as a digital asset but its role as the native gas token for an expanding financial infrastructure. This is the section a competitor covering the ETF volume record would not write. The volume and flow data are public. The connection between RLUSD infrastructure growth, institutional XRPL settlement, and ETF positioning requires assembling pieces that do not appear in the same data feed.
Goldman Sachs and the institutional signal
Goldman Sachs disclosed $86.5 million across five spot XRP ETFs in its Q2 2026 13F filing, after reporting zero XRP ETF exposure at the end of Q1. The bank held roughly $25.8 million in Bitwise’s XRP ETF and $25.4 million in Franklin Templeton’s XRPZ, with additional positions in Canary Capital, Grayscale, and 21Shares products. A single bank’s allocation does not make a trend. But Goldman spreading across five issuers rather than concentrating in one suggests the allocation was deliberate portfolio construction, not a one off trade. It also suggests the bank is testing liquidity across multiple products, a behavior consistent with building toward a larger position. For comparison, Goldman’s initial bitcoin ETF allocation in Q1 2024 was concentrated in two products. The XRP diversification across five funds indicates either greater caution about single issuer risk or an intent to compare execution quality before concentrating. The disclosure covers Q2, which ended June 30. The August volume and inflow records came after. If Goldman was building at lower activity levels, the question is what other institutional allocators have done since.
XRP versus bitcoin and solana: the ETF comparison
Bitcoin spot ETFs crossed $1 billion in cumulative inflows within their first week of trading in January 2024, driven by a decade of pent up demand and a price near all time highs. As of August 25, 2026, bitcoin ETF assets approach $100 billion after a $2.2 billion inflow streak in six days. The scale difference is obvious. XRP’s $1.57 billion in cumulative inflows over nine months occupies a different category entirely. But the relevant comparison is trajectory, not magnitude. Bitcoin’s ETF inflows were front loaded. The first month captured the largest share of total flows. XRP’s inflows have been back loaded, accelerating in August after a sluggish summer. That pattern is more consistent with institutional allocators completing due diligence and adding positions gradually than with retail momentum driving initial flows. Solana’s staking ETFs offer a different comparison. Bitwise’s Solana Staking ETF (BSOL) crossed $1 billion in cumulative inflows in less than ten months and recorded $108 million in single day trading volume on August 24. Solana ETFs also offer a yield component (approximately 5.83 percent net of fees) that XRP ETFs lack, making the inflow comparison favorable to Solana on a risk adjusted basis. XRP ETF inflows are pure directional conviction with no yield cushion. The absence of staking yield in XRP ETFs makes the $1.57 billion figure more notable, not less. Investors are not being compensated for holding. They are positioning for price appreciation alone, which requires a stronger underlying thesis than a yield bearing product demands.
The gap between infrastructure and price
XRP traded at approximately $1.05 on August 25, down 57 percent from its January 2026 cycle high of $2.43. Cumulative ETF inflows of $1.57 billion, whale accumulation of 380 million tokens in one week, record trading volume, and Goldman Sachs’ first XRP allocation all occurred while the token sat more than half below its peak. The comparison to bitcoin’s ETF trajectory is useful but imperfect. Bitcoin spot ETFs crossed $1 billion in cumulative inflows within their first week. XRP funds took roughly nine months to reach $1.57 billion. But bitcoin’s ETF launch coincided with its price near all time highs, creating immediate momentum. XRP’s ETF infrastructure has scaled during a price drawdown, meaning the inflows represent conviction buying, not momentum chasing. The fee war also signals issuer confidence. Franklin Templeton does not price a product at 0.19 percent unless it expects the asset under management to grow substantially. At $994 million in total assets and a 0.19 percent fee, XRPZ generates roughly $1.9 million in annual revenue before operating costs. That is not a viable standalone product. It is a loss leader designed to capture market share before the category scales. Issuers subsidize fees to win market share in categories they expect to become large. Seven issuers competing on price in a $994 million market is a bet on a much larger future market. The parallel to the bitcoin ETF fee war of early 2024 is direct. Grayscale started at 1.5 percent. BlackRock launched at 0.25 percent. Within months, multiple issuers were waiving fees entirely. The XRP market skipped most of that competitive cycle and arrived at compressed fees almost immediately, suggesting issuers learned from the bitcoin experience and priced for scale from the start. One metric captures the infrastructure versus price tension precisely. The ratio of cumulative ETF inflows to current market capitalization. At $1.57 billion in inflows against XRP’s approximately $60 billion fully diluted market cap, ETF flows represent roughly 2.6 percent of total value. For bitcoin, the equivalent ratio is closer to 5 percent. If XRP ETF inflows were to reach the same proportional penetration, cumulative flows would need to exceed $3 billion, nearly double the current level. The infrastructure is halfway to parity with bitcoin’s proportional ETF adoption, while the price sits at a 57 percent discount to its cycle high.
What would prove this thesis wrong
Three conditions would invalidate the infrastructure versus price argument. First, if August’s inflow pace reverses and September brings sustained net outflows, the accumulation thesis breaks. Second, if whale addresses begin distributing into ETF driven liquidity, the alignment between on chain and institutional flows was coincidental. Third, if the SEC reverses or restricts XRP’s commodity classification under the ongoing Clarity Act debate, the regulatory foundation supporting these products disappears. The flash crash on August 22 is a partial warning. A 37 percent single day decline in an asset with $1.57 billion in ETF inflows shows that derivatives leverage can overwhelm spot demand in short windows. Infrastructure does not prevent volatility. It provides a floor that volatility eventually returns to.
What to watch
Weekly ETF net flows. August averaged $14.2 million per week. A drop below $5 million for two consecutive weeks would signal fading institutional interest.
Whale bracket holdings. The one million to ten million XRP bracket is the most sensitive indicator of large holder conviction. A decline from the current 16.36 billion level would flag distribution.
Open interest relative to spot volume. When futures open interest exceeds 40 percent of daily spot volume, liquidation risk rises sharply. The August 22 crash occurred at approximately that ratio.
13F filings for Q3. Goldman’s Q2 disclosure covers positions through June 30. Q3 filings, due in November, will reveal whether the August volume record attracted additional institutional allocators.
Fee waiver expirations. Several XRP ETF issuers are operating under temporary fee waivers. When those expire, the true cost of holding shifts, and flow patterns may change. The earliest waivers are scheduled to expire in Q4 2026.
RLUSD supply on XRPL. The growth of Ripple’s stablecoin on the XRP Ledger creates a secondary demand driver for XRP as a gas token. A plateau or decline in RLUSD supply would weaken the infrastructure thesis beyond the ETF data alone.
Clarity Act legislative progress. The Senate returns September 14 with 14 working days remaining in the session. Any movement on the Clarity Act, positive or negative, will directly affect the regulatory foundation supporting all seven XRP ETF products. A failed vote or withdrawal would reintroduce classification uncertainty that issuers have been pricing as resolved.
What is a spot XRP ETF?
A spot XRP exchange traded fund holds actual XRP tokens in custody rather than futures contracts. Investors buy shares through a traditional brokerage account and gain exposure to XRP’s price without managing private keys or interacting with cryptocurrency exchanges directly.
How many spot XRP ETFs exist in the United States?
Seven spot XRP ETFs trade on United States exchanges as of August 2026: Bitwise XRP, Canary Capital XRPC, Franklin Templeton XRPZ, Grayscale GXRP, REX Osprey XRPR, 21Shares TOXR, and ProShares XRPL. They are listed on NYSE, NYSE Arca, Nasdaq, and Cboe.
Which XRP ETF has the lowest fees?
Franklin Templeton’s XRPZ carries a 0.19 percent expense ratio, the lowest base fee among all spot cryptocurrency ETFs in the United States as of August 2026.
What was the XRP ETF trading volume record?
XRP ETF trading volume reached $125 million on August 20, 2026, surpassing the prior all time high by 42 percent. Bitwise’s fund alone exceeded $200 million in combined volume across three sessions ending August 24.
How much have investors put into XRP ETFs total?
Cumulative net inflows across all seven spot XRP ETFs reached $1.57 billion as of August 24, 2026. Bitwise leads with $542 million, followed by Canary Capital at $468 million and Franklin Templeton at $434 million.
Why did XRP crash 37 percent on August 22?
Leveraged long positions built during XRP’s 60 percent rally over the preceding week were liquidated in a cascade. Approximately $500 million in crypto positions were cleared across the market in a single day, with XRP among the hardest hit due to extreme long to short ratios on major exchanges.
Did Goldman Sachs buy XRP ETFs?
Goldman Sachs disclosed $86.5 million across five spot XRP ETFs in its Q2 2026 regulatory filing. The bank held positions in Bitwise, Franklin Templeton, Canary Capital, Grayscale, and 21Shares products after reporting zero XRP ETF exposure at the end of Q1.
Is buying an XRP ETF the same as buying XRP?
No. ETF shares represent a claim on XRP held in custody by the fund. Shareholders do not own XRP directly, cannot transfer tokens, and do not participate in on ledger activity. ETF prices track XRP’s market value minus fees, but the investor holds a traditional security, not a cryptocurrency. This is educational analysis, not investment advice.
Disclaimer. This article was written on August 26, 2026. All figures reflect data available on that date and may have changed. This is educational analysis and does not constitute investment advice. Cryptocurrency markets are volatile, and past performance does not indicate future results.

The Zhipu or Z.ai logo is pictured on a smartphone on Aug. 14, 2026.
Cfoto | Future Publishing | Getty Images
BEIJING — Chinese artificial intelligence company Z.ai released a new model Wednesday that the company claims uses entirely homegrown semiconductors to operate.
Called GLM-5.3-Flash, the low-cost version of Z.ai’s flagship model ranks 10th on the Artificial Analysis Intelligence Index, ahead of DeepSeek V4 Pro Max.
Z.ai’s Hong Kong-listed shares climbed more than 8% in Thursday trading.
The company claimed it used 100,000 China-made chips to handle all online requests to use GLM-5.3-Flash, including when it was released on Aug. 20 under the code name “Ox Alpha.” The model ranked first by usage in the last week on the global OpenRouter platform.
CNBC was unable to independently verify Z.ai’s chip claims. The company declined to share details on which companies’ chips it was using. Running an AI model requires less computing power than training a model.
Nvidia has struggled to sell its chips to China due to restrictions from Washington and Beijing. Meanwhile, Huawei and other Chinese companies have ramped up efforts to build alternatives.
China has ramped up domestic semiconductor and AI capabilities in an effort to gain tech self-sufficiency in the wake of U.S. restrictions on sales of advanced chips to China. Leading U.S. AI models are also not officially available in China.
Z.ai rival MiniMax‘s shares climbed by around 3% in Hong Kong trading after reporting a 283% surge in revenue in the first half of the year versus a year ago.
MiniMax reported adjusted net loss more than doubled during that time to $293 million. The company’s flagship M3 model ranks 18th on the Artificial Analysis Intelligence Index.
Z.ai is scheduled to report results for the first six months of the year on Monday.
The two AI companies both listed in Hong Kong in January. While Z.ai shares have skyrocketed by more than 800% since the IPO, MiniMax shares have only climbed by over 80%.
— CNBC’s Jenny Lee contributed to this report
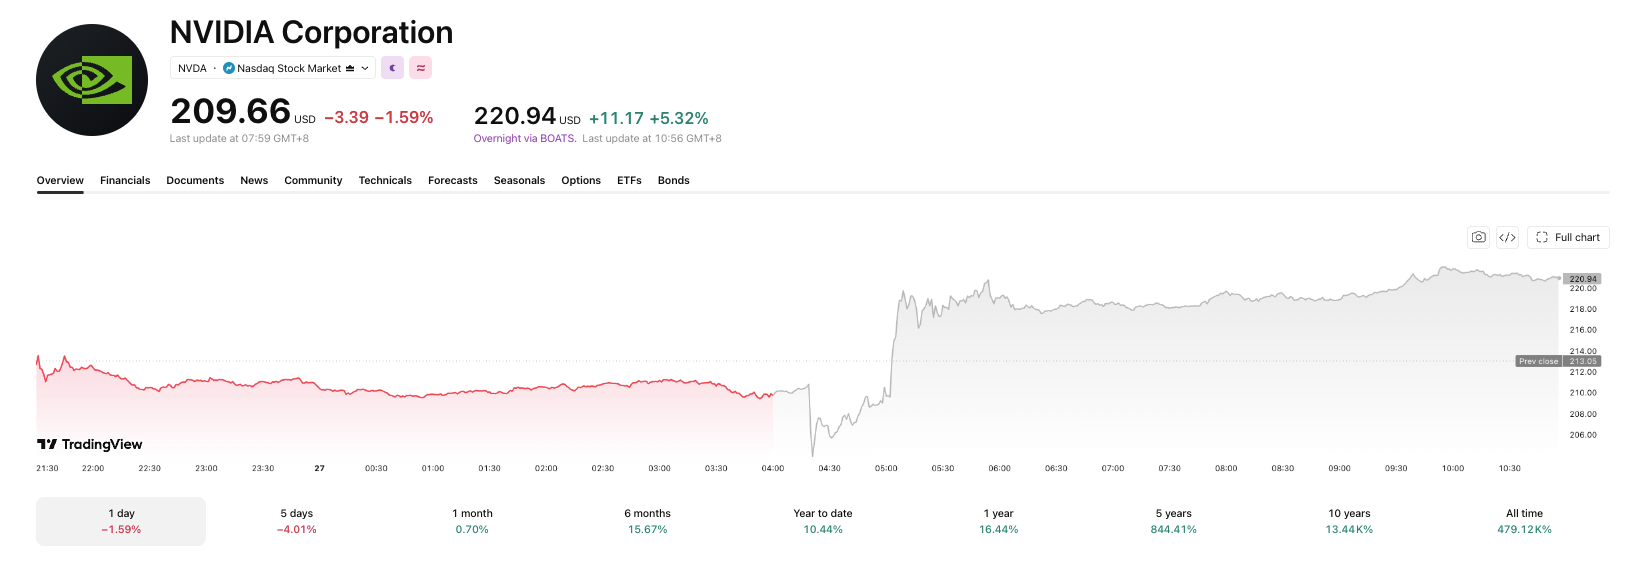
Michael Burry bought December Nvidia (NVDA) call options ahead of the company’s record-breaking earnings, even as he added to his existing short position against the stock. He described the calls as a hedge, not a bet on gains.
The “Big Short” investor disclosed the move on his Substack, where he also revealed fresh shorts against Oracle (ORCL), Palantir (PLTR), Nebius (NBIS), and Caterpillar (CAT). His total short stock position now exceeds 21% of his portfolio, excluding puts.
A Hedge, Not a Reversal
Burry set the call strikes in the mid-to-high $200s and paid a single-digit premium per contract. He said that cost is fully offset by his existing short and put exposure, which represents 3.5% to 4% of his portfolio.
“I am not playing for gains here,” Burry said. He added he would not have made the trade without such a large bearish position already in place. He has used this hedging approach around past earnings reports, though he admitted his track record with it is mixed.
Nvidia’s earnings trap heading into Wednesday’s report had already unsettled traders, with the stock sliding for seven straight sessions beforehand.

Why Burry Still Sees Nvidia as Overvalued
Burry called Nvidia’s low price-to-earnings ratio deceptive for a company he believes commands short-lived monopoly power. He said his own theoretical value for the stock sits well below where it trades today.
He also argued Nvidia will direct more cash toward capital spending than shareholder returns, investing “into and through the top of the bubble” in a way that could later trigger sharp earnings reductions.
The stance echoes Burry’s broader campaign against the AI trade, including his 1987 style crash warning earlier this month.
Burry also expanded long positions in Birkenstock (BIRK) and Freddie Mac (FMCC) this week, calling the Birkenstock stake a full position.
Nvidia stock is up more than 12% year to date, considering its overnight pop. Whether yesterday’s earnings validate Burry’s short or hand him another loss on the hedge remains an open question.
The post Michael Burry Shorts This AI Giant, Then Buys Calls as a Hedge: Why? appeared first on BeInCrypto.
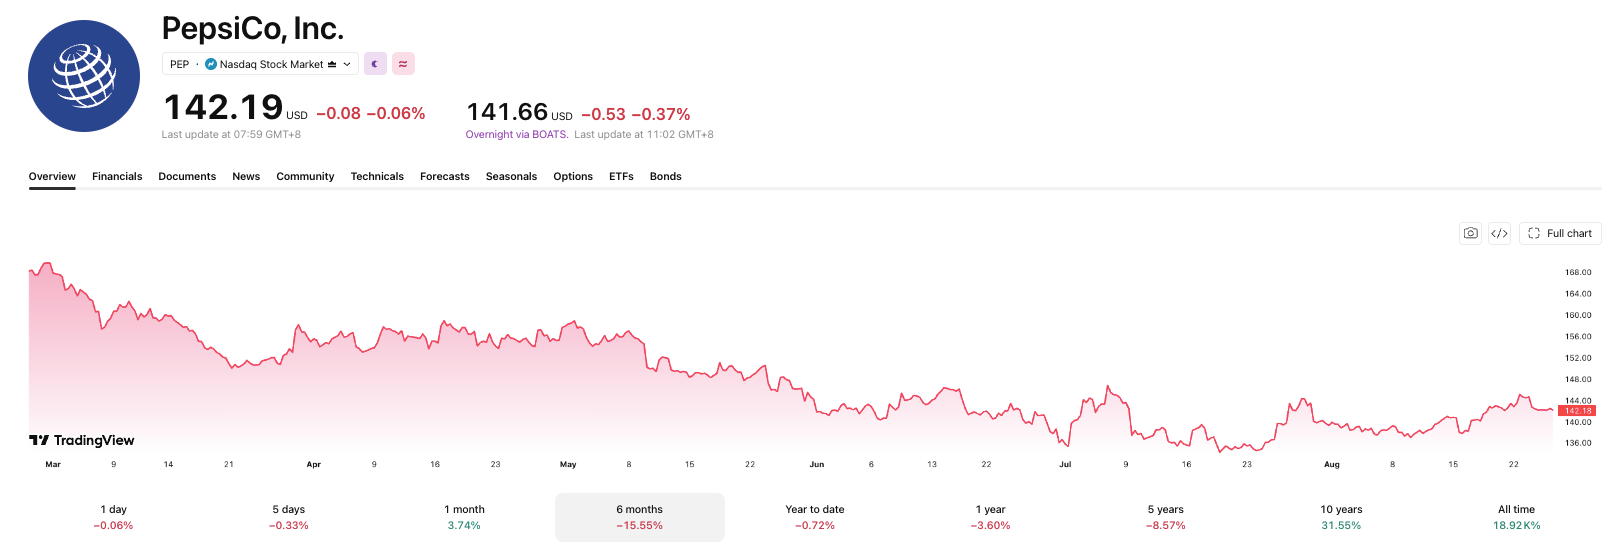
Jim Cramer named PepsiCo (PEP) his next stock idea on Wednesday’s Mad Money. He built the pick on falling oil prices instead of chasing Nvidia or Salesforce.
The CNBC host framed PepsiCo as a value play. He tied it to his broader view that oil is falling and inflation is peaking. Cramer called it a starting point, not yet a position.
A Falling-Oil, Peaking-Inflation Worldview
Cramer’s process starts with a call on rates and inflation before he names any stock. He said the economy looks stable barring a shock out of Iran or Ukraine.
He pointed to easing crude prices as his clearest sign that inflation is topping out. Oil fell nearly 3% this week as Iran and Oman resumed talks on a Strait of Hormuz shipping corridor.
Cramer also downplayed Federal Reserve Chair Kevin Warsh, whose Jackson Hole debut speech lands Friday. He argued a hike is unlikely while the Treasury is already working to hold down long-term borrowing costs.

Why PepsiCo Beat Nvidia and Salesforce to the Pick
Tech was the obvious starting sector, but Cramer said Nvidia and Salesforce had already jumped on strong earnings. Buying either now, he said, would mean chasing a move that already happened. He pointed to Nvidia’s blowout quarter results as an example.
Travel and leisure names failed his test too. He said stocks like Disney and Expedia had already rallied and depend on discretionary spending a soft economy could squeeze.
PepsiCo fit a different screen. Cramer looks for shares trading cheap against their own history with a dividend yield near 4%. PepsiCo has raised its payout for 54 straight years. It now yields roughly 4%, near its highest level in more than a decade.
“I like them low. Some people like them hot. I like them cool.”
Jim Cramer, host of CNBC‘s Mad Money
Cramer said PepsiCo executives repeated on their earnings call that high gas prices have weighed on sales. Falling oil, he argued, could remove that drag on consumer spending.
Cramer stressed the idea remains a screening result, not a formal position. Whether the valuation gap closes may hinge on where oil and rates move after Warsh’s speech Friday.
The post Jim Cramer Says Falling Oil Prices Make PepsiCo His Next Stock Pick appeared first on BeInCrypto.

Missing people are turning up dead on a misty honeymoon island | News World

IGO back in the black with $145m profit

Bitcoin below $79,000, XRP leads losses as traders start betting on a Fed hike





-

 Fashion5 days ago
Weekend Open Thread: Madewell – Corporette.com
-

 Crypto World1 day ago
SpaceX stock could rise 75% to $240, JPMorgan says
-

 Business5 days ago
Musk’s Tesla, SpaceX Confirm $16.8 Billion ‘Terafab’ Chip Plant as World’s Largest Building in Texas
-

 Crypto World5 days ago
anatomy of crypto’s biggest liquidation event since 2021
-

 Crypto World2 days ago
A $30 Billion AI Fund Implodes, Now the SEC Is Investigating Wall Street’s Role
-

 Politics5 days ago
6 months on, Irish renters crushed by effects of government housing bill
-
 Crypto World1 day ago
Did Trump Just Move SpaceX Stock With One Truth Social Post?
-
 NewsBeat5 days ago
The ‘Lucky Dip Gang’ causing carnage for clicks: After five thugs were killed speeding in the wrong direction on a motorway, GUY ADAMS investigates a sick new trend… and why police aren’t even allowed to pursue them
-

 Business4 days ago
Mystery AI Model ‘Ox Alpha’ Draws Developers With Free Access as Chinese Lab Origins Remain Debated
-

 News Videos7 days ago
Don’t Leave Your Financial Future To Chance | August 19, 2026
-

 Business2 days ago
Moderna CEO warns China is pouring state money into mRNA technology
-

 Business6 days ago
Five Below: Kids Discount Retailer Reaps Rich Rewards
-
 Business2 days ago
NVIDIA Stock Drops Nearly 2 Percent to $210 on Seventh Losing Day Ahead of Critical AI Earnings
-

 Business6 days ago
UK firms in critical financial distress rise 9% to 53,756
-

 Sports4 days ago
Deshaun Watson fires back at Browns fans after being booed: ‘It’s a disrespectful thing’
-

 Crypto World7 days ago
Optimism-funded team's deciding vote shifts $49 million in OP tokens away from users
-
 Crypto World4 days ago
Google Gemini AI Predicts Ethereum Could Become the Trade Retail Misses in 2026
-

 Tech5 days ago
Unitree’s New Superman Robot Claims to Outjump and Outrun Every Human, Usain Bolt Included
-
 Crypto World5 days ago
Nvidia Stock Suffers Longest Losing Streak Since 2022: Will Q2 Earnings End It?
-

 Business7 days ago
PayPal and Venmo now accepted for tuition at several universities
You must be logged in to post a comment Login